Abstract
Over the last few decades, life expectancy has increased significantly. However, elderly people who live on their own often need assistance due to mobility difficulties, symptoms of dementia or other health problems. In such cases, an autonomous supporting system may be helpful. This paper proposes the Internet of Things (IoT)-based information system for indoor and outdoor use. Since the conducted survey of related works indicated a lack of methodological approaches to the design process, therefore a Design Methodology (DM), which approaches the design target from the perspective of the stakeholders, contracting authorities and potential users, is introduced. The implemented solution applies the three-axial accelerometer and magnetometer, Pedestrian Dead Reckoning (PDR), thresholding and the decision trees algorithm. Such an architecture enables the localization of a monitored person within four room-zones with accuracy; furthermore, it identifies falls and the activities of lying, standing, sitting and walking. Based on the identified activities, the system classifies current activities as normal, suspicious or dangerous, which is used to notify the healthcare staff about possible problems. The real-life scenarios validated the high robustness of the proposed solution. Moreover, the test results satisfied both stakeholders and future users and ensured further cooperation with the project.
1. Introduction
Nowadays, life expectancy significantly differs from that of 25 years ago. Research of the World Health Organization [1] indicates that over the last 25 years, life expectancy in Poland lengthened six years. Moreover, the research of Kontis et al. shows that with high probability, by the year 2030, life expectancy could lengthen for another three years [2]. However, men’s and women’s life expectancy differs in most cases in favor of women, e.g., in Poland by eight years. Such a situation causes a significant part of the elderly population to live alone. In some cases, such people have mobility difficulties, symptoms of dementia or other health problems, but still would prefer to live in their homes and surroundings. Therefore, there is a need for information systems that could facilitate such a life without compromising people’s safety. This can be done by means of an autonomous system, which monitors people’s position and their vital signs and is able to distinguish different activities and situations, reacts accordingly to the degree of danger and alarms, e.g., appropriate services or caregivers.
The aim of this paper is to propose an Internet of Things (IoT)-based healthcare information system intended for indoor and outdoor use where a methodological approach to the design process is in focus. A distinguishing feature of this approach is that the contracting authority’s and future users’ perspectives and needs are included in most stages of the design process. Moreover, in the proposed approach, the designer from the beginning has to think comprehensively to merge human and technical constraints and requirements. The proposed user-driven Design Methodology (DM) is used to solve the problems of the real-life scenario of supporting seniors living alone, especially those with limited abilities to manage their daily lives. The conducted design process results in a system proposal that meets the required assumptions.
The conducted case studies verified that the designed system, consisting of the Inertial Measurement Unit (IMU) with a built-in three-axis accelerometer, gyroscope, magnetometer and altimeter, together with Wi-Fi and heart rate modules and applying thresholding, Pedestrian Dead Reckoning (PDR) and decision trees algorithms, works properly in the tested real environment. The achieved person’s localization accuracy within one meter fits the required four room-zone level localization accuracy in an apartment environment. The developed fall detection algorithm proved effectiveness of 98%, and other required activities were recognized with 95% compliance. Moreover, the proposed behavior classification algorithm is able to distinguish normal behaviors from suspicious and dangerous ones, working properly in almost 100% of cases.
2. Survey of Related Work
The Design Methodology (DM) of a product or system has been of interest to many researchers. Already in 1991, A. McKnight proposed a definition of DM as “… a sequence of activities required to get from one stage of the design process to another” [3].
R. Prasad and H. Kobayashi, in order to improve hardware description language design productivity, propose the nine-step multi-methodology design process model consisting of system specification, system partitioning, modeling or adaptation, component simulation, system binding, system simulation, pre-synthesis modification, logic synthesis and logic simulation [4]. Their solution enables the diminution of the time required for modeling and simulation-related activities by 31% and 16%, respectively, compared to the classical hardware description language-based design.
The design methodology proposed by S. A. Mengel et al. contains the three stages: requirements, specification and implementation [5]. At the requirements stage, the designers should focus on the key concept of the problem and propose a graph with the structure of the system. At the specification stage, they refine the proposed graph into the content flowchart, which should be easily implementable into the considered system in the last design stage. Moreover, after each DM stage, the validation and verification should be carried out to ensure that the key concepts would have been met.
To improve the productivity of the complex electronics system design, H. Eskelinen proposes to apply two questionnaires to the traditional four-stage electronics system design, which are: system design, electronics design, mechanical design and design for manufacturing [6]. Those questionnaires are used to form requirements lists of electronic system components.
F. Wang and M. J. Hannafin state that the design-based research should be “pragmatic, grounded, interactive, iterative, flexible, integrative, and contextual” [7]. Based on this assumption they form nine principles of the design-based research: support design with research from the outset; set practical goals for theory development and develop an initial plan; conduct the research in representative real-world settings; collaborate closely with participants; implement research methods systematically and purposefully; analyze data immediately, continuously and retrospectively; refine designs continually; document contextual influences with design principles; and validate the generalizability of the design.
A. Saini and P. Yammiyavar chose the user as the focal point of the design of m-health system [8]. They use the object-oriented system design methodology, typical for software development, and then study interactions and relationships between the system requirements and the components of the user’s needs and goals. User-driven design becomes especially useful in health applications, where the stakeholders and different kinds of users may express different requirements and constraints.
The suggested DM approach of M. Ahmad considers five design aspects: the target field failure rate, expected use environment, expected environment use conditions, expected enclosure use conditions and expected product internal conditions [9]. The method is applicable to estimate the target’s lifetime in the Internet of Things (IoT). It uses the probabilistic approach for estimating hardware reliability with given uncertain use conditions while considering overall system reliability.
Emerging technologies create new opportunities, and the robust monitoring of persons or things, alike, in indoor and outdoor environments, becomes of interest to many scientific and industrial applications, where one of the most important is the healthcare domain. However, the conducted survey reveals that design methodologies, despite their efficacy, have not yet been of great interest to designers in the field of healthcare information systems in IoT. The emerging healthcare applications are possible due to the development in Micro-Electro-Mechanical Systems (MEMS), which enable the integration of various devices like actuators, sensor nodes or mobiles [10,11].
It is preferable that the devices used for monitoring purposes operate wirelessly [12], forming Wireless Sensor Networks (WSNs), which constitute the substantial part of IoT [13]. WSNs are widely used in healthcare applications due to their advantages and diversity. In [14], C. Rotariu and V. Manta propose WSN for monitoring patients’ heart rate and oxygen saturation. W. Y. Chung, S. C. Lee and S. H. Toh embed Electrocardiography (ECG) and blood pressure sensors into a cellular phone [15]. The wireless body area network is an example of a suitable approach to the IoT healthcare paradigm. S. -L. Tan, J. Garcia-Guzman and F. Villa-Lopez use Wi-Fi technology to transmit data about the blood pressure, heart rate, body temperature and oxygen saturation to the base station [16]. J. Wannenburg and R. Malekianc apply Bluetooth technology and a smartphone for monitoring the patient’s health parameters [17].
In IoT healthcare applications, one of the most frequently-monitored issues is the localization of patient or equipment. For this purpose, depending on the application, various methods and technologies are used. Numerous approaches are based on Received Signal Strength (RSS) [18]. M. Shchekotov uses RSS measurements from several known Wi-Fi access points assuring the localization accuracy at a four room-zone level on a single floor of a building. In order to localize an asset in the healthcare environment, the authors of [19] use the existing infrastructure of the Wireless Local Area Network (WLAN), extended just with six access point beacons. Based on Wi-Fi RSS measurements and small Wi-Fi tags, they are able to localize the assets like wheelchairs, beds, etc., with an accuracy of about 2 m in the hospital clinic environment of 63 m × 46 m size. W. H. Chen et al. use RFID RSS measurements of the reference and monitored tags to estimate the cost function consisting of the disparity and similarity of RSS between monitored and reference tags [20]. In this way, the three optimal reference tags are found, and the position of the monitored tag is determined as the center of mass of the triangle, which they form. The average localization error of a patient or asset in a 5 m × 10 m healthcare environment is about 0.74 m. F. Palumbo et al. propose the stigmergy approach combined with RSS measurements of Bluetooth Low Energy (BLE) [21]. Their approach results in a localization error of less than 1.8 m in 75% cases in a 6 m × 6 m furnished office. J. Wyffels et al. propose a healthcare dedicated indoor localization algorithm based on BLE RSS measurements and least squares-support vector machine, resulting at the four room-zone level localization accuracy [22]. The authors of [23] focus on patients’ localization, tracking and monitoring in the nursing institute environment. They use RSS measurements of the ZigBee standard and a particle filter. As a result, they achieved an average localization error of less than 2 m in 80% of cases.
Different algorithms and methods can be used to improve the localization accuracy. In [24], the authors use the Radio Frequency Identification (RFID) fingerprints method and the artificial neural network, which enables a 3D localization accuracy of about 70 cm within a room-sized environment. A different approach to the indoor localization problem is shown in [25] where the authors used fingerprints of Wi-Fi and barometric pressure to localize a target with the floor accuracy of a six-floor building. Their Barometer-aided Wi-Fi (BarFi) floor localization approach detects the target’s floor correctly in 96.3% of cases.
An interesting solution of the Pedestrian Dead Reckoning (PDR) algorithm is presented by Kang and Han in [26]. They use data from off-the-shelf three-axis gyroscope, magnetometer and accelerometer smartphone sensors in an in-building environment. The proposed method ensures the mean localization accuracy of 1.35 m with the maximum localization error of 1.62 m. The authors of [27] use data from the accelerometer, magnetometer and gyroscope to recognize a person’s posture and to detect the tumbling of the person [28].
Information about the position of a monitored person or equipment is valuable not only for localization, but also it could be used for patient’s behavior recognition. This is especially useful while monitoring the elderly living alone or a person at the first stages of dementia. For this purpose, L. Wang et al. apply coin-sized RFID readers on both hands of a patient and one accelerometer on the patient’s waist [29]. Using this set, along with a passive RFID tag, they are able to recognize 25 different activities of the supervised person. H. Martin et al. are able to recognize a person’s activities and body position by means of Google Nexus S embedded sensors like the magnetometer, gyroscope, accelerometer, light and proximity sensors and a fuzzy classifier [30].
Most of the mentioned monitoring solutions have the common drawback of being dedicated just to indoor environment applications. In the case of an outdoor healthcare monitoring purpose, most of the enable solutions apply the Global Positioning System (GPS) [31], which in the in-city environment provides localization accuracy of about 6 m. Ch. Wu et al. combine GPS data with gyroscope and accelerometer data using the dead reckoning algorithm, which results in an improvement of the in-city localization accuracy up to 4 m [32]. For outdoor behavior recognition, L. Sun et al. apply the mobile embedded accelerometer and Support Vector Machine (SVM)-based classifier, to recognize activities like bicycling, running and walking [33].
The mentioned monitoring solutions are dedicated exclusively to just one, an indoor or outdoor, environment. A multi-environment localization solution was proposed by Millner et al. in [34]. The authors, using the Symeo local positioning radar, are able to localize animals with an accuracy of 0.5 m in 75% of cases in both indoor and outdoor environments; however, the major constraint of the system is its applicability in an environment with low multipath distortions. J. Gonzalez et al. combine Ultra-Wide Band (UWB) and GPS technologies and a particle filter to localize a robot in the indoor and outdoor environments with a localization accuracy of about 2 m [35].
However, these multi-environmental solutions, in turn, are difficult to implement in healthcare applications inter alia due to the size of the devices used. A localization system relatively easily implemented in healthcare, both indoor and outdoor environments, is presented in [36]. It is based on RSS measurements in a ZigBee network [37]. The major drawback of this solution is a significant number of needed reference nodes with known positions and the maximum distance from the reference node of 15 m, which considerably reduces the applicability of the system from the large outdoor environment.
A promising approach to the multi-environmental patient monitoring system is proposed by R. Tabish et al. [38]. They propose a monitoring system of the patient’s temperature and ECG based on 3G/Wi-Fi IPv6 over Low Power Wireless Personal Area Networks (6LoWPAN). While the monitored person occurs in an indoor environment, the system uses local Wi-Fi for sensors’ data transfer, and in the case of the outdoor environment, the 3G/4G technology is applied. The drawback of this solution is a limited number of monitored vital parameters.
3. Problem Statement and Main Contributions
The number of related publications is enormous, and this review provides only examples of solutions, which in the authors’ opinion give a map of the development fields. However, the review of related works indicates that although a variety of solutions is used in the IoT healthcare-monitoring domain for indoor and outdoor environments, a methodological approach to the design process is still missing; where design is understood as “scientific principles, technical information and imagination in the definition of a structure, machine or system to perform pre-specified functions with the maximum economy and efficiency” [39]. Furthermore, using a multi-environmental information system for behavior recognition and classification requires improvement and development.
To fill the gap in the methodological approach to the design of a comprehensive information system for healthcare applications, the objective of this paper is to propose a systematic design procedure, which can enhance the development of healthcare appliances. Apart from technical requirements, the procedure considers multifarious constraints, including the lifetime, energy efficiency, usage comfort and even the price. The case study of the design process is an IoT-based system for monitoring people and things multi-environmentally capable inter alia of behavior recognition and diagnosis. The system is dedicated to support and localize elderly people in their multi-room apartments along with a multi-story building, but even outdoors in the building’s surroundings. The system’s functionalities consist of monitoring vital signs, posture recognition, suspicious behavior detection and classification.
The development procedure approaches the design target from the perspective of the stakeholders, the authority in charge and the potential users, as the view of the system developers. The proposed design methodology is modelled and then implemented and validated on the case study of the system for multi-environmental monitoring of elderly people living alone. The system has been implemented and validated in real scenarios.
4. Methodology of System Design
The problem of exclusive indoor or outdoor monitoring of patients or elderly people is complex; including both indoor and outdoor cases is even more compounded, especially in the case of IoT. Therefore, to carry out the design of such a system, we propose to systematize the design process. The proposed design methodology illustrated in Figure 1 is composed of two main stages: problem formulation and product development, each consisting of three different steps. Moreover, to avoid the omission of any important aspects of the designed system, the stakeholder’s, future user’s and designer’s perspectives are taken into consideration at each stage of the design process.
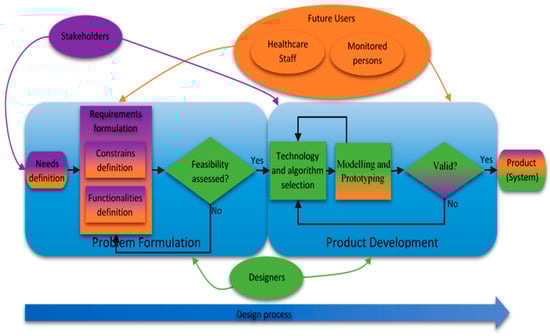
Figure 1.
Flowchart of the proposed design methodology.
4.1. Problem Formulation
The problem formulation stage consists of three steps: need definition, requirement formulation and feasibility assessment. Since an essential aspect of the proposed DM is the involvement of all project contributors, i.e., stakeholders, future users and designers, each of them may have a contribution to the problem formulation. However, their goals and expectations of the future system can differ. For example, the user can focus on convenience, safety and confidentiality; the healthcare staff may aim at the system’s reliability, ease of operation and maintenance, along with the utility of the obtained information. The stakeholders additionally consider financial and marketing aspects of the product, and then, the designers focus on the design tools and their knowledge and experience.
4.1.1. Needs Definition
This step begins the design process when the stakeholders introduce to the designers the concept and define the general problem. In the proposed DM, this stage should be performed together with the future users in order to include their desires. With such an approach, both stakeholders and future users can express their needs and expectations of the outcome of the working system. In this step, participants should not focus on detailed requirements, but rather general goals of the system, so that the designers would be able to preliminarily assess whether the problem is solvable with their resources.
4.1.2. Requirements Formulation
The requirements formulation is the essential step of the proposed DM. At this stage, the stakeholders and future users firstly formulate the desired system’s functionalities such as fall detection or localization of monitored person. Furthermore, the constraints associated with the developed system like costs, size and required lifetime are introduced. In a case of multi-environmental usage, the functionalities and constraints in each of the considered environments have to be defined. These functionalities and constraints constitute the requirements for the designers; moreover, this is how the stakeholders and future users can indirectly affect the structure of the developed healthcare system.
4.1.3. Feasibility Assessment
The designers have to assess the feasibility of the general needs and specified requirements formulated by the stakeholders and future users. Moreover, they have to consider whether the existing possible solutions are able to solve the stated problems and assess whether the needs and requirements are realizable at all. The designers have to take into account also the constraints resulting from the desired working environments. If the designers encounter a problem in accomplishing the requirements, the stakeholders and future users would be asked to modify the requirements in a way that can satisfy them. After assessing that, all requirements can be met, and then, the product development stage can begin.
4.2. Product Development
Usually, due to the challenging trade-offs and diversity of the desired functionalities and constraints, the selection of suitable technologies and algorithms has to be carried out carefully in the following three steps: technologies and algorithms’ selection; modeling and prototyping; and then solution validation. Furthermore, at this design phase, the stakeholders and future users are involved; however, it is the designers’ responsibility to lead the dialog with all contributors. The main duty of the future users and stakeholders during the product development is to supervise whether all of their needs and requirements are implemented. After verification of the functionalities and constraints, the eventual necessary improvements can be postulated.
4.2.1. Technologies and Algorithms Selection
At this stage, the designers propose technologies and algorithms, which are in line with the desired functionalities and constraints stated by the stakeholders and future users at the problem formulation step. Then, in choosing technologies and algorithms, the constraints arising from the environment, like indoor/outdoor or high humidity, in which the designed system will operate, have to be considered. Furthermore, the suitable technologies and algorithms have to be pondered with respect to the price constraint, and then, after the primary elimination, only a few possible solutions would remain; therefore, the price may indicate the final decision. However, if there are no suitable solutions accomplishing the requirements, or the solutions lack some of the functionalities or constraints, then the designers have to propose and develop new solutions or adapt the existing ones.
4.2.2. Modeling and Prototyping
Modeling and prototyping the system are the main tasks of the designers. These tasks require the most time and may involve experts of different fields. However, in user-oriented design, the models and prototypes have to be endorsed by both designers and future users. This is an iterative process. The designers evaluate the solution’s performance, and the future users check if the functionalities and constraints defined by them are accomplished. If something is missing or needs an improvement, the designers have to get rid of bugs and complement any shortcomings. The process continues until all contributors are satisfied. Then, the final outcome has to be validated.
4.2.3. Validation
The stakeholders along with the designers have to validate whether all system’s needs and requirements have been accomplished. Now, it is also possible to verify the costs of the product and accept the price. In the case of any discrepancy between the desired needs and requirements and the prototyped multi-environmental healthcare information system, the designers have to examine the proposed technologies and algorithms and come back to the initial stage of product development. Nevertheless, if both stakeholders and designers approve the results, the system is ready to be implemented and launched into a service.
5. Case Study: Problem Formulation
The proposed design methodology is implemented and validated on the case study of a healthcare system for multi-environmental monitoring of elderly people living alone in the Silesia region in Poland. The designed system can be used not only to support and localize the elderly people in their multi-room apartments located in multi-story buildings, but even outdoors in the buildings’ neighborhood.
5.1. Needs Definition
The growing number of elderly people is a global problem, and many local authorities, also of the Polish region Silesia, acknowledge its importance and are working on it. The general needs and targets introduced by the stakeholders and future users represented by elderly people and their families have considered possibilities to support elderly people, especially those of limited mobility, living alone or patients with the first symptoms of dementia. The support can be yielded by means of an autonomous system monitoring the target’s position, their vital signs and able to recognize different activities and even classify human behavior.
5.2. Requirements Formulation
The functionalities, desired by the stakeholders and future users, consist of the localization of the monitored person in his or her apartment with up to four room-zone level accuracy, but also within a multi-story building, where the apartment is located, with a floor level accuracy. Furthermore, the person’s positioning in the building’s outdoor neighborhood with an accuracy of at least 10 m is desired. Moreover, the system, in all of these surroundings, should be able to monitor the target’s vital signs and even detect the person’s fall.
To recognize the required behavioral changes of the monitored person, in addition to the localization and fall detection, there is a need to distinguish the person’s postures, like sitting, standing, walking or lying. It is even requested that the system should classify if a current behavior is normal, suspicious or dangerous for the monitored person and, in the case of unusual occurrences, notify the people responsible for care. In the instance of conduct that is classified as suspicious or dangerous, a subsidiary part should provide supplementary information about some vital signs.
According to a division of constraints into the two categories of general and particular, the reliability, size and comfort of device-wearing and even a maximum price of 200 EUR for the complete system are classified as the general constraints of the system. Moreover, the demands that the system should be easy to install, operate and maintain and even assure the subject’s privacy are also the general constraints of the system. The operational time of at least one week, necessary for many reasons, can be categorized as particular. The localization accuracy in the considered environments along with the reliabilities of activities and fall recognition are particular constraints. Furthermore, real-time secure non-invasive measurements are crucial particular constraints of the vital signs’ monitoring. The high validity of the behavior classification is also considered as a particular constraint. Both general and itemized functionalities, along with the particular requirements, are summarized in Table 1. The table consists of possible technologies and algorithms, and these, which fulfill the stated requirements, are bolded.

Table 1.
Technologies and algorithms related to itemized functionalities and particular constraints.
5.3. Feasibility Assessment
The needs, functionalities and constraints presented by both stakeholders and future users need to be scrutinized by the designer. After the comprehensive analysis, the general needs of a system supporting elderly people living alone with limited mobility or with the first signs of dementia are assessed as technically accomplishable and feasible. Furthermore, the performed research proved that the related functionalities and constraints concerning the working environments, activity recognition, vital signs’ monitoring and behavior classification are also technically feasible at a moderate level of technical and algorithmic complexity. Nevertheless, the trade-off between the desired low price and the system’s reliability and the further constraints has been acknowledged as challenging.
6. Case Study: Product Development
6.1. Technologies and Algorithms’ Selection
The selection of appropriate technologies and algorithms from a set of possible solutions was carried out for the preliminary defined functionalities and constraints. Table 1 presents the specified functionalities along with the related constraints and facilitating the possible technologies and algorithms, where the technologies and algorithms recommended by the designer as most suitable are bolded.
For an indoor localization in an apartment at four room-zone level resolution, the PDR algorithm, based on three-axial accelerometer and magnetometer data, is chosen. The reason for this recommendation is the small size of the accelerometers and rotation sensors, which should ensure comfort during use. Another motive of this solution is the use simplicity of the PDR algorithm, which fulfills the convenience of use constraint. Moreover, this solution does not require any extensive infrastructure or any additional sensors, making it easily implementable in any environment. Another advantage of this solution is that the same acceleration and orientation readings can be also used for the recognition of other monitored people’s activities.
The BarFi algorithm [25], which applies the Wi-Fi signal and fingerprints of atmospheric pressure measurements, is selected for an indoor localization in a multi-story building with a floor level accuracy. This combination, in addition to meeting the floor level accuracy constraint, maintains the easy operation of the system. Moreover, due to its versatility and simplicity, the Wi-Fi technology can also be useful for communication between the designed device and the PC.
The (GPS) and the PDR-based hybrid method introduced by Ch. Wu et al. [32] are chosen for the outdoor localization with an accuracy of at least 10 meters. This alternative is justified by the GPS’s availability and easy feasibility. Moreover, the PDR algorithm is likewise proposed for the indoor localization, which allows increasing the outdoor localization accuracy without any additional equipment.
To detect a subject’s fall, we propose to apply the three-axial accelerometer along with the thresholding method. The same set of technologies would either be sufficient for the required identification of the subject’s four different postures and activities.
Due to the lack of an accessible suitable behavior classification method, we developed the classification algorithm based on the decision trees algorithm, which should assure the required reliability.
The heart rate can be noninvasively measured by the water-resistant wireless Polar T34 heart rate monitor, which is mounted on the person’s chest with an adjustable elastic strap, ensuring comfort while in use. The applied simple noninvasive acoustic-based method does not require any additional electrodes nor gels. Moreover, the adjustable elastic strap can be useful to mount other elements of the designed system.
The general design constraints of the system, including the small size, low energy consumption, easy installation and use along with low price, are supported by applying the Arduino technology and its compatible devices [40]. The system’s long-life demand can be assured by using energy-saving adaptive algorithms, which for instance adjust the localization sampling with respect to the actual subject’s position.
The selected technologies and algorithms operate in an unobtrusive manner without contravening the integrity of the monitored person. The system collects and processes only insensitive data like the monitored person’s position, activity or heart rate. It monitors people without the violation of their privacy. This way of handling personal integrity is appreciated by the future users. Furthermore, the procedures of data treatment assure the restricted access of exclusively trusted people including the healthcare and medical staff, doctors and, if necessary, the liable family members of the monitored person.
6.2. Modeling
6.2.1. Localization Method
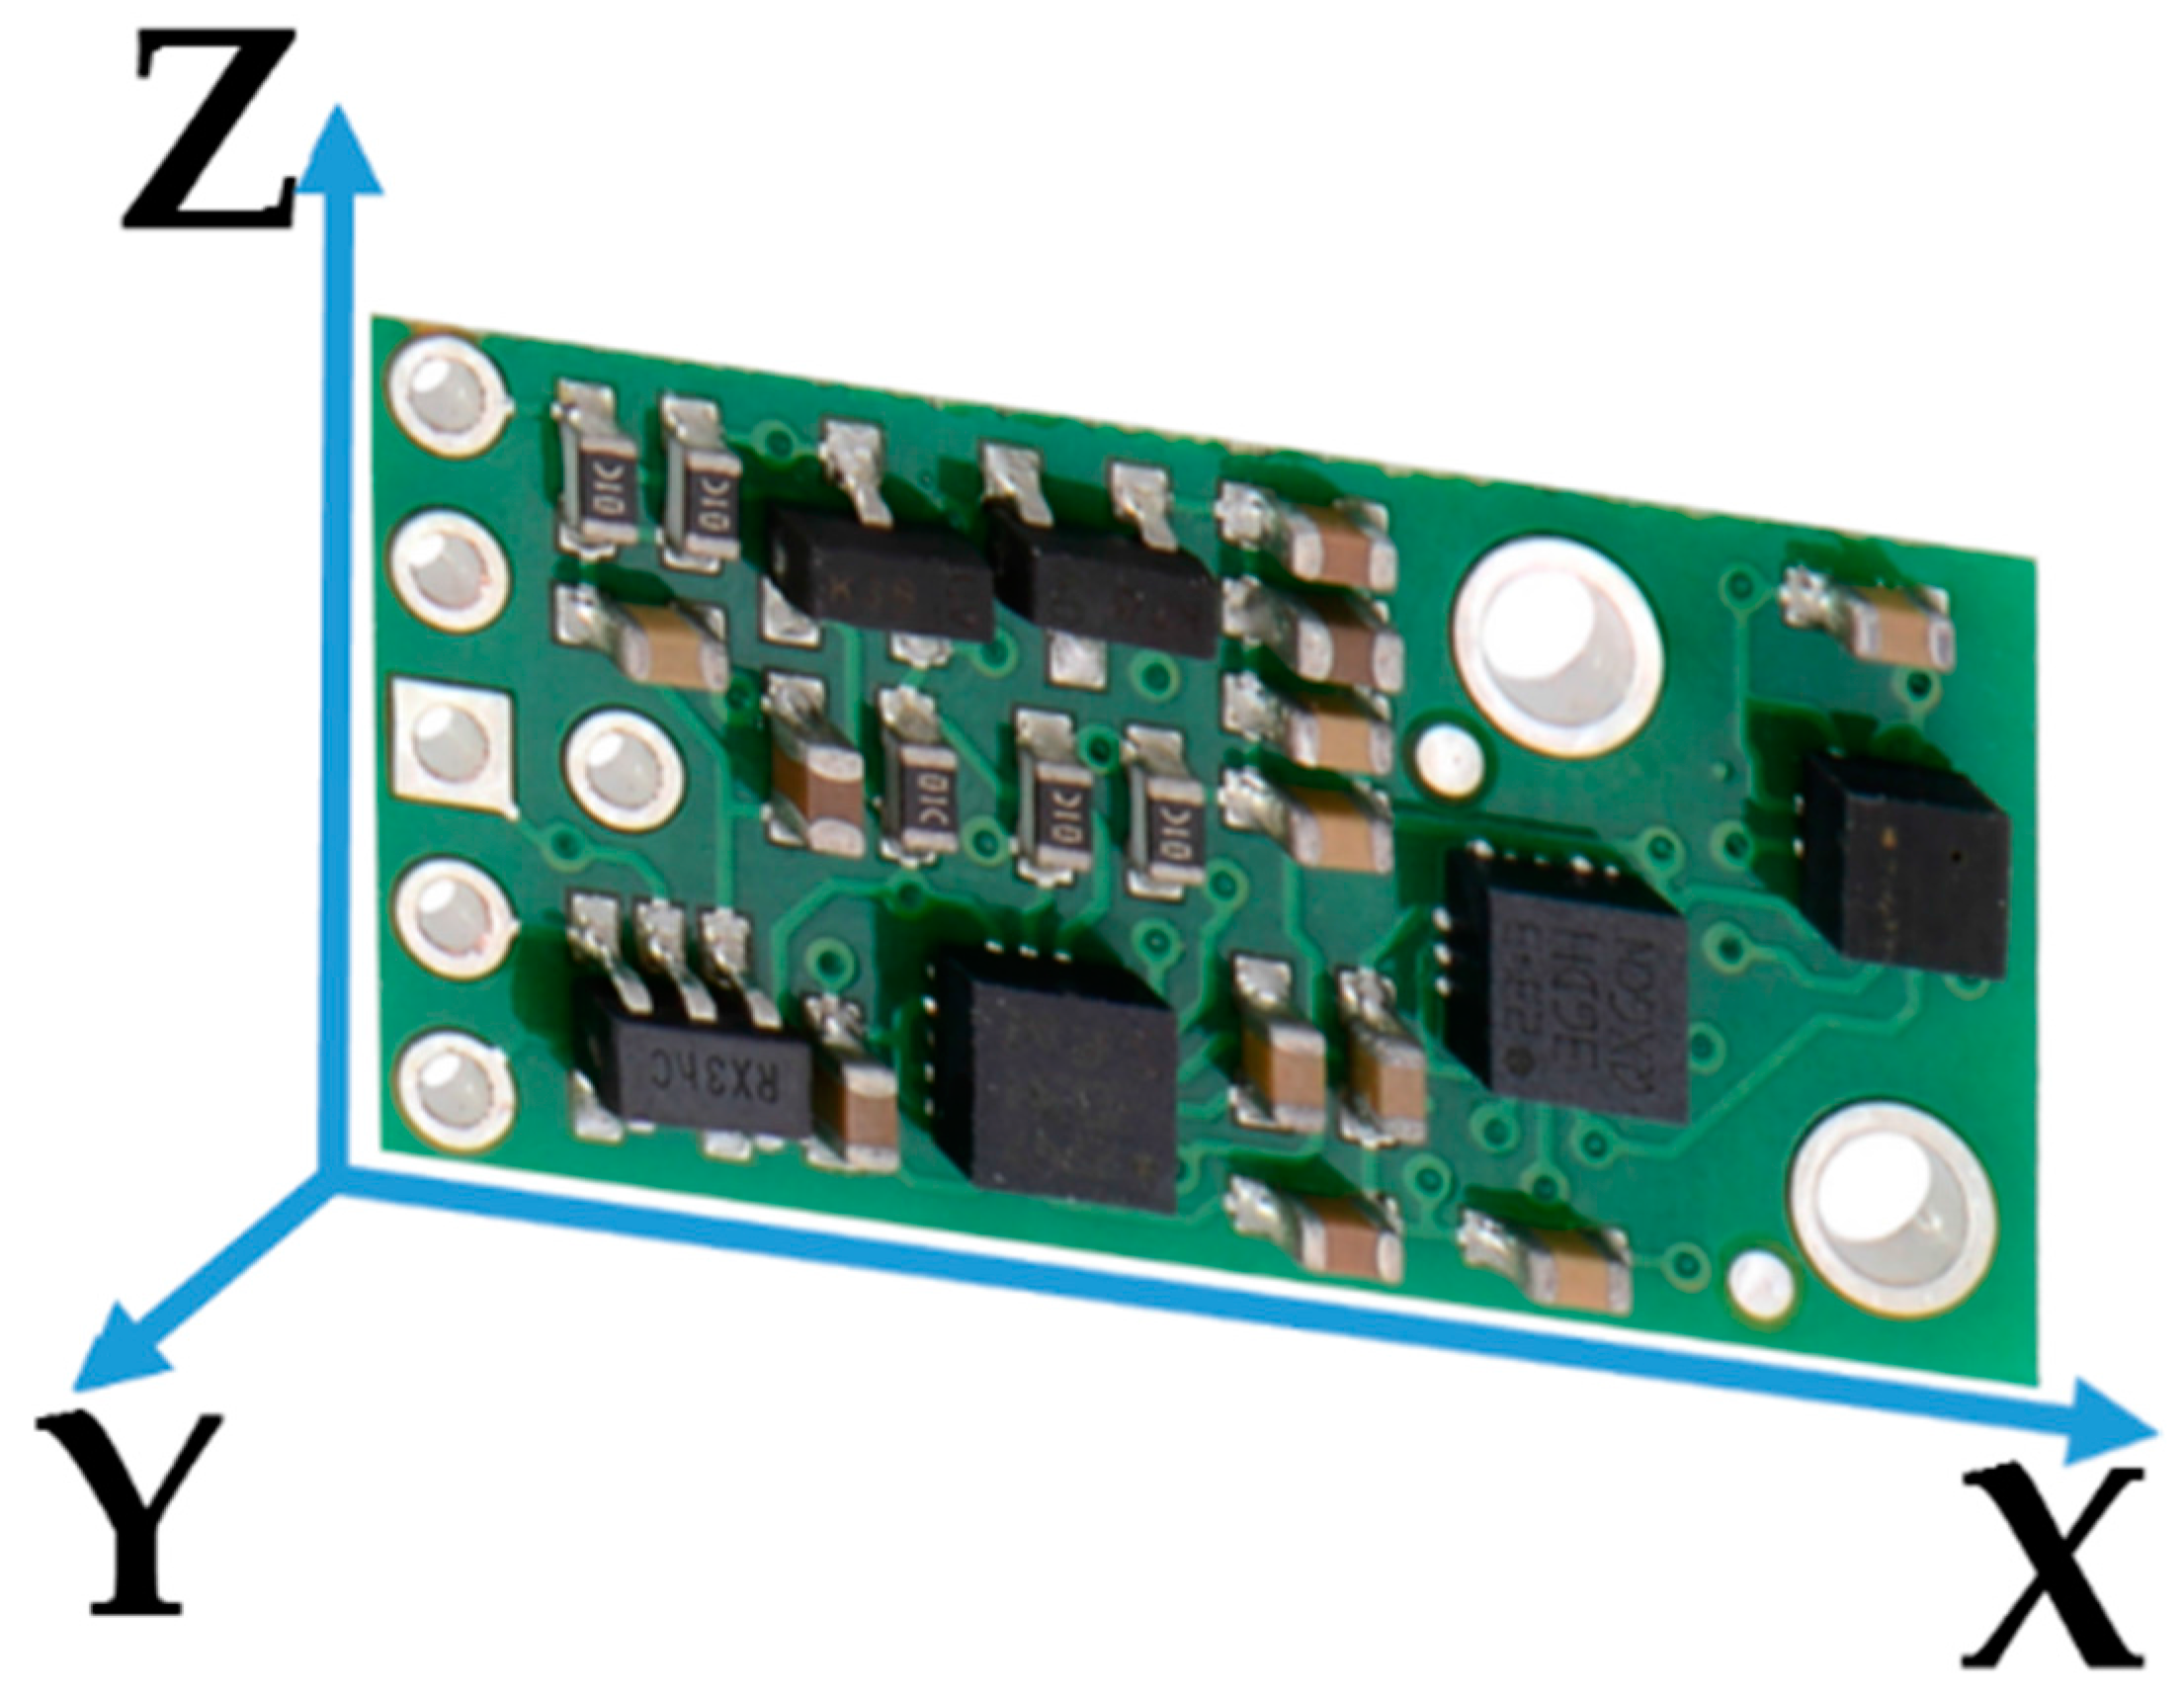
The proposed PDR method for the indoor localization applies the measurements from the three-axial accelerometer gathered with a sampling frequency of 90 Hz. In the case study, the accelerometer’s normal working position is vertical; Figure 2 shows the orientation of the accelerometer axes. The person’s localization is based on the information about the previous position, number of steps, their length and their direction.

Figure 2.
Accelerometer x-, y- and z-axis orientation.
The previously estimated position is stored in the device memory or in the case of the first use of a device, it is set manually at the calibration point. The number of counted steps is estimated using three-axial accelerometer data consisting of acceleration readings in the x, y and z directions, which define the Signal Magnitude Vector (SMV) calculated as:
where xi, yi, zi are the i-th sample of acceleration in the x-, y- and z-axis, respectively. The step is detected when SMV exceeds the empirically chosen threshold. The threshold has to be adjusted to the walking manner of the monitored person.
The step length , approximately unalterable, due to the walking manner of an individual, should be set as fixed and also has to be determined individually. Using such data, the M factor is determined as:
In the last stage of PDR, the magnetometer along with gyroscope readings are used to estimate the direction of the step [26]. Finally, the person’s position can be calculated as:
where and are the coordinates of the estimated position, and are the coordinates of the previously estimated position, is the heading direction and is the factor from (2).
Foremost, occasionally, the system has to be calibrated by activating the device in a known location of the apartment; for instance, while the person is sitting in an armchair or while standing on the clearly marked place in the middle of the antechamber.
6.2.2. Activity Detection
The activity detection means recognition of the subject’s posture and/or action. There are five different states that should be distinguished, such as sitting, lying, standing, walking and falling.
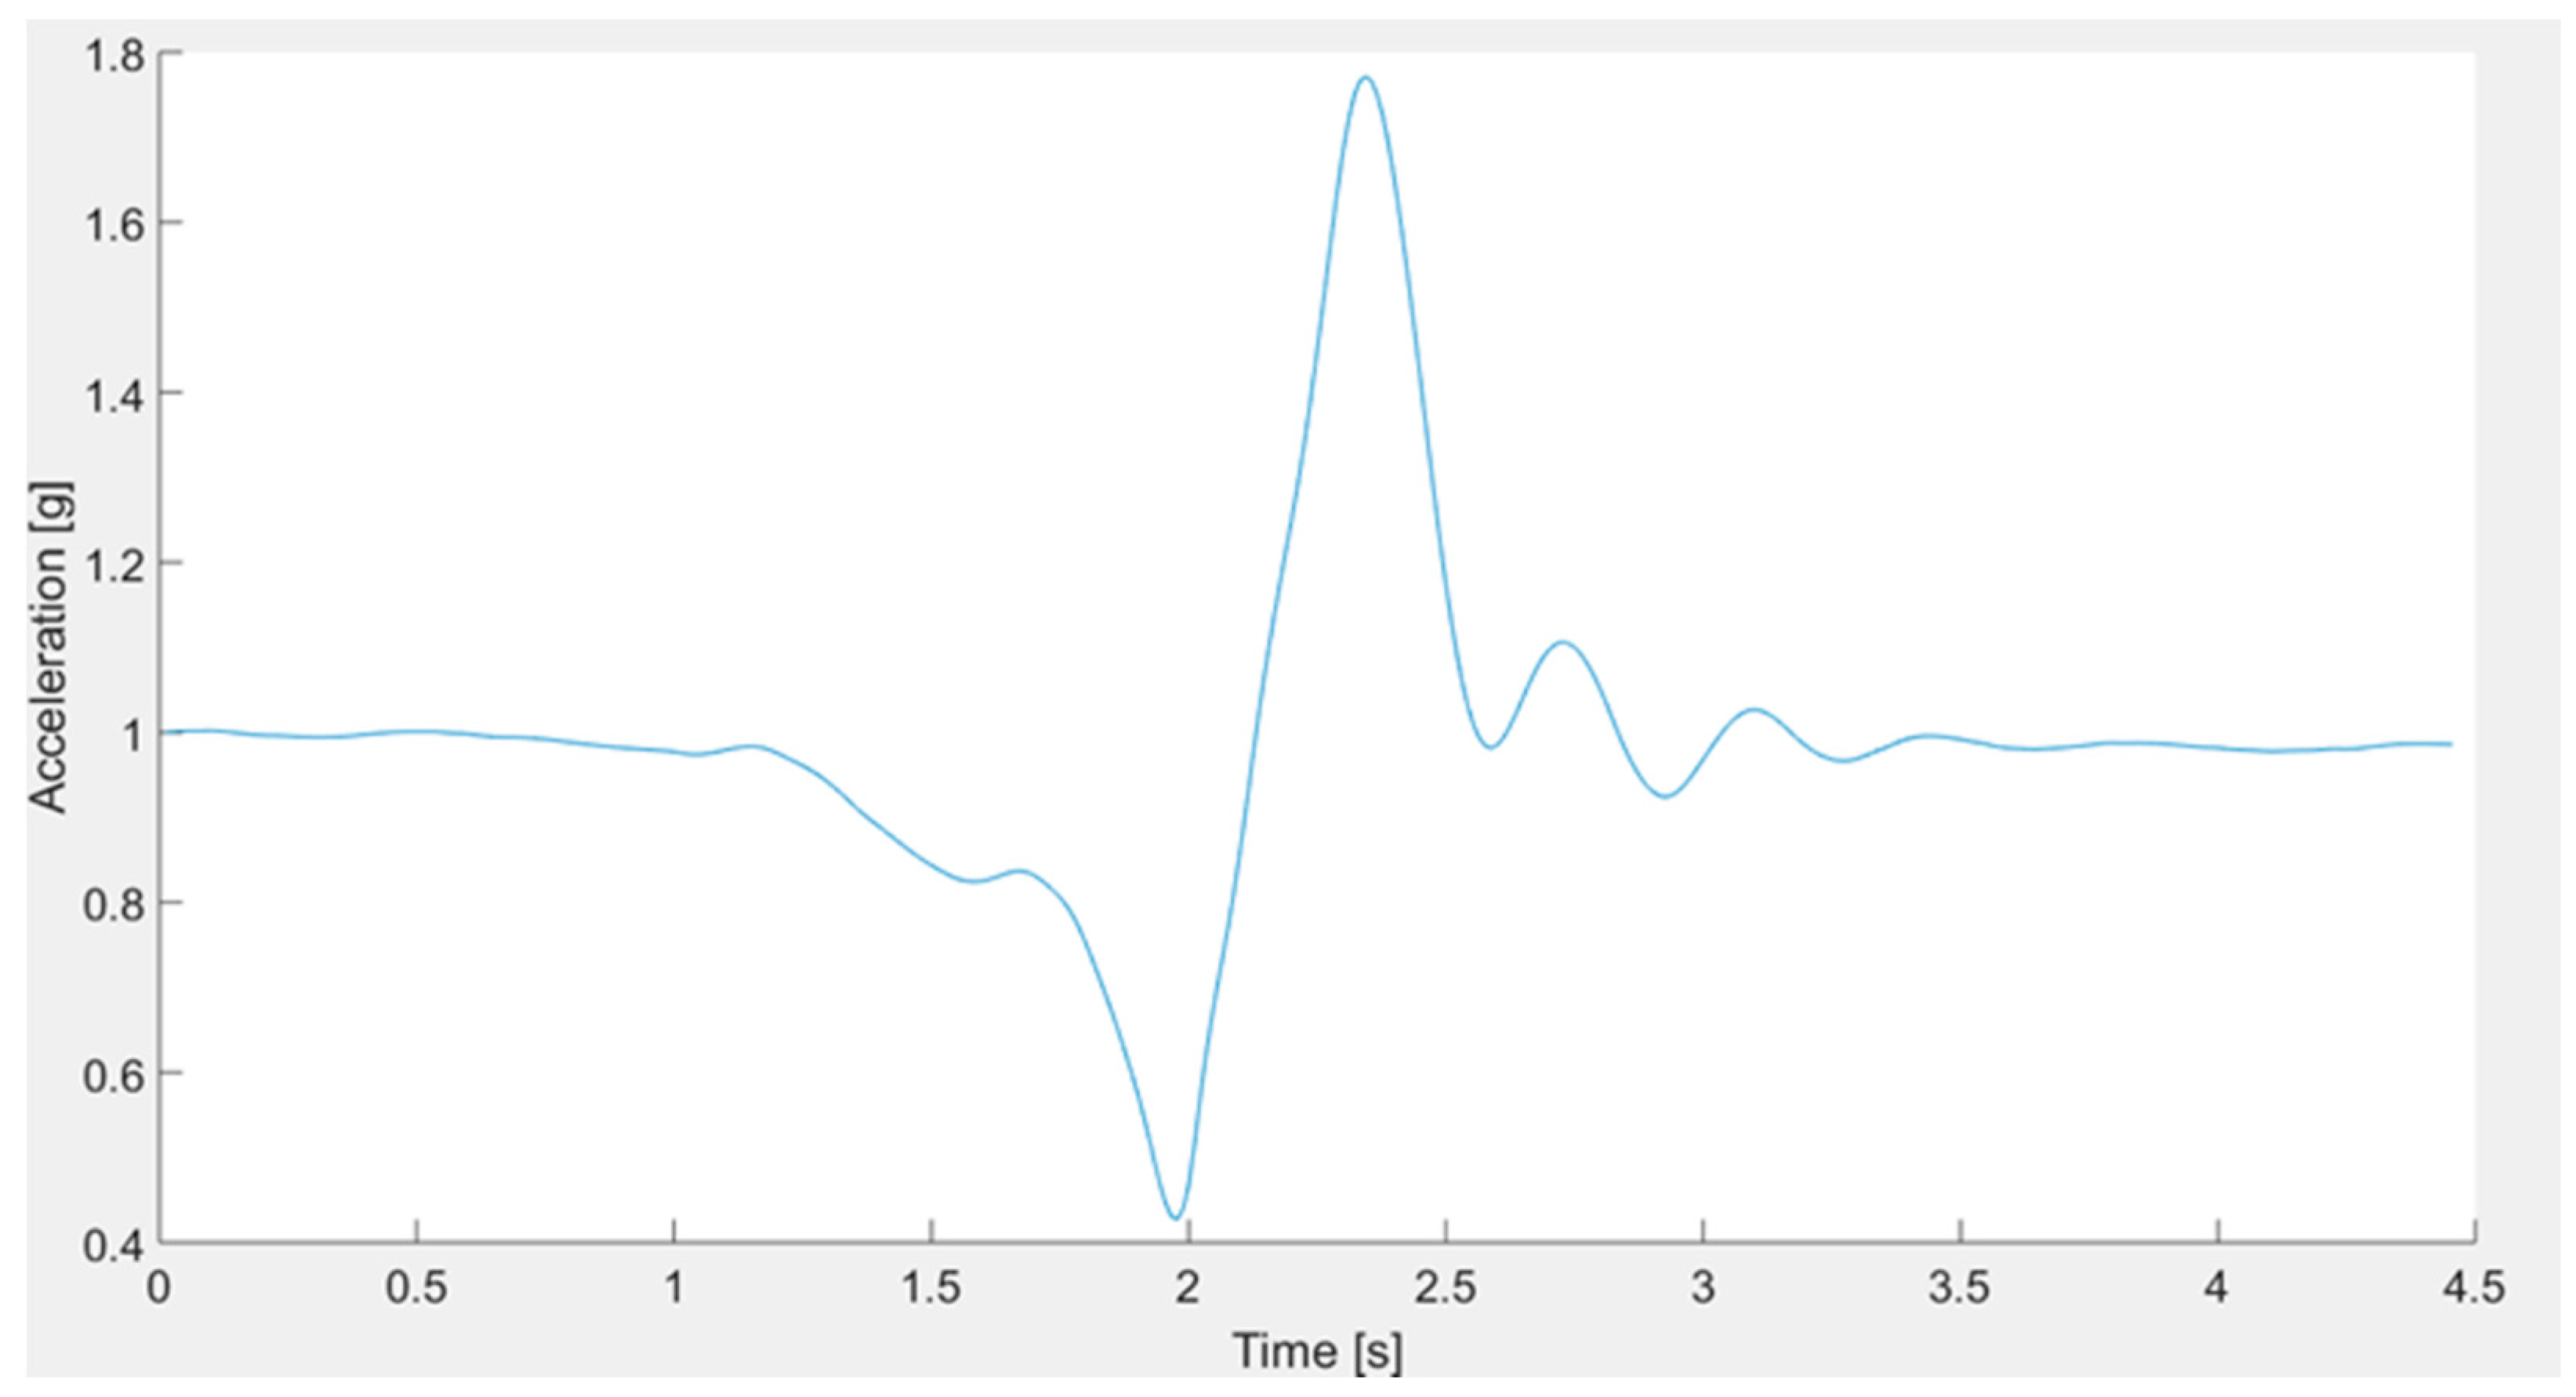
As the most dangerous case, reliable fall detection is the most vital. The SMV defined by (1) is a suitable measure to detect a fall. The tumble causes changes in the SMV with distinctive positive and negative acceleration peaks corresponding to its beginning and the final contact with the floor, as shown in Figure 3. However, in some cases, e.g., a rapid onset of the walk could create similar SMV changes. Nevertheless, it is possible to avoid false alarms by monitoring also the accelerometer measures in the x-, y- and z-axes or by an additional localization and posture checking.
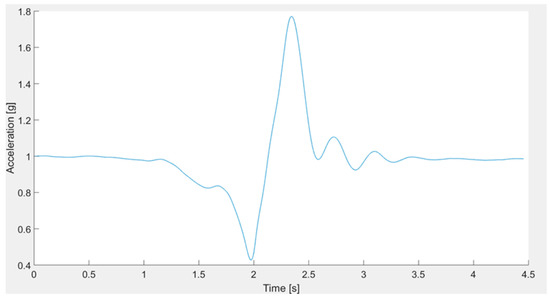
Figure 3.
Exemplary SMV characteristics for the fall test.
The information about a dynamic posture, such as walking, is determined on the basis of the three-axial accelerometer and magnetometer along with the PDR algorithm, used also for the localization method described in the previous subsection. Whenever the designed system detects a step, the system interprets such activity as walking.
The subject’s static postures, such as lying, sitting and standing, can be recognized and distinguished by means of the three-axial accelerometer and magnetometer. The lying position can be easily distinguished from the other postures because in this position, gravity affects mostly the acceleration z-component, whereas when standing and sitting, the y direction is the dominant acceleration component caused by gravity. Therefore, a suitable discriminator can determine when the z-component exceeds the other two components. The most difficult is to distinguish between sitting and standing. These postures cause similar acceleration with just small acceleration deviations resulting from slight movements of the body. Therefore, the system cannot differentiate between characteristic features of sitting and standing; however, it can detect the change of posture. Analyzing the accelerations in the x, y and z directions along with the SMV vector makes it possible to find out the threshold levels to distinguish between sitting down from standing up. Moreover, using appropriate threshold levels makes it possible to distinguish the actions of lying down on a bed from a sitting position and also the action of getting up from the lying down position.
6.2.3. Person’s Behavior Recognition
Beside the auxiliary activity recognition, the core function of the designed system is the classification of normal, suspicious and dangerous behaviors of the subject. To make it possible, we propose to create a fingerprint of ordinary behaviors in a given temporal and spatial environment of a subject’s life. Following the stakeholder’s constraint, Figure 4 illustrates a layout of the possible living environment, which consists of five rooms, including the bathroom, bedroom, corridor, kitchen and living room. Furthermore, each room could be divided into two or three zones dedicated to specific activities. For example, the bedroom could be divided into two zones; one zone around the bed, where sitting and lying activities are considered as normal behaviors, but longer walking or standing should be considered as suspicious and even dangerous when prolonged. The second zone is located near the entrance to the bedroom and around the closet, where standing and walking activities are normal, but sitting and lying should be indicated as suspicious or dangerous.
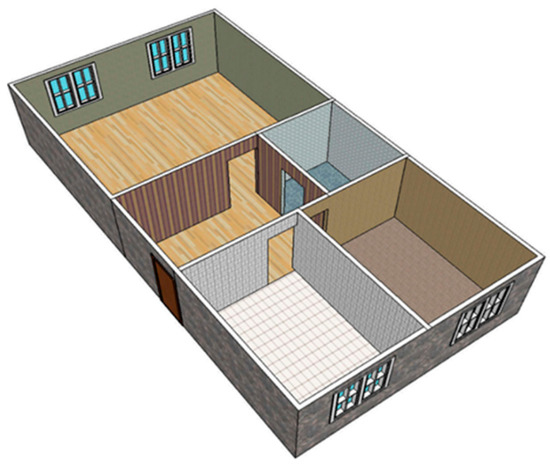
Figure 4.
Sketch of an exemplary five-room apartment.
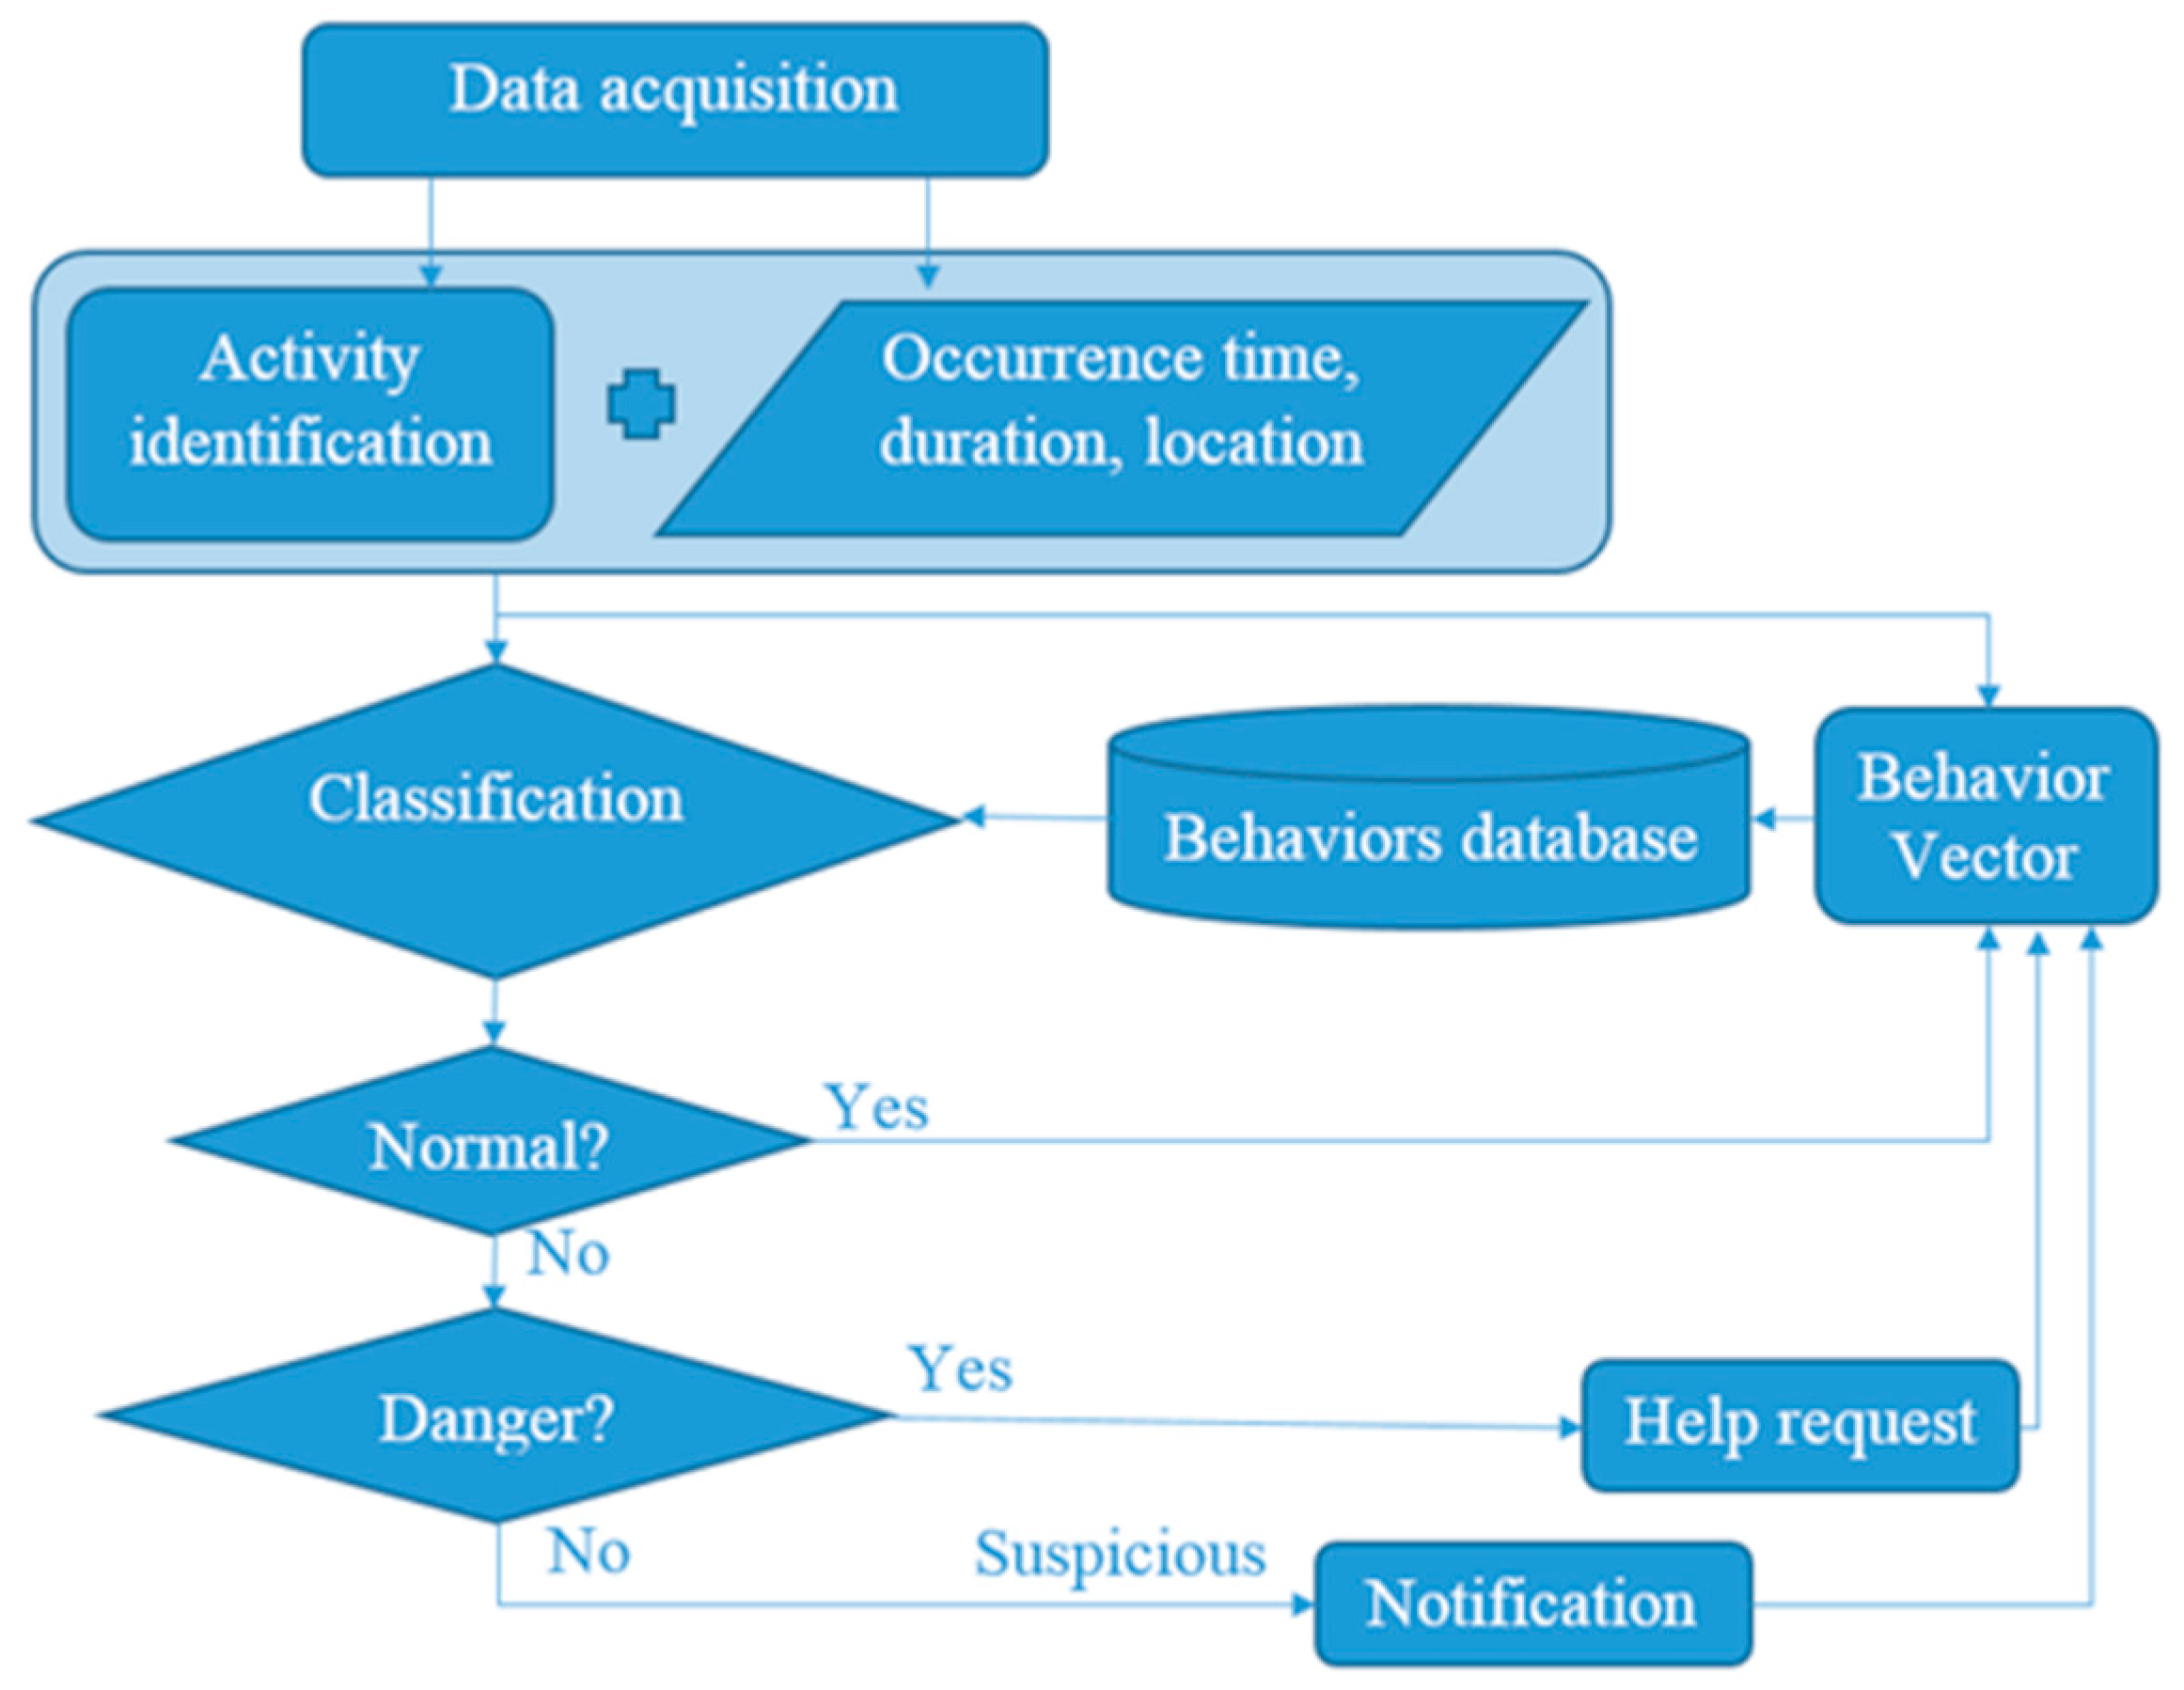
The flowchart of the behavior classification as normal, suspicious or dangerous is presented in Figure 5. Data obtained from the sensors are combined with information about the occurrence, such as the time of day, section of apartment and its zone, then how the current activity is defined and placed in the current activity map. Next, the map is compared with the pattern map of normal behaviors and by means of the machine learning method, and the occurrence is classified.
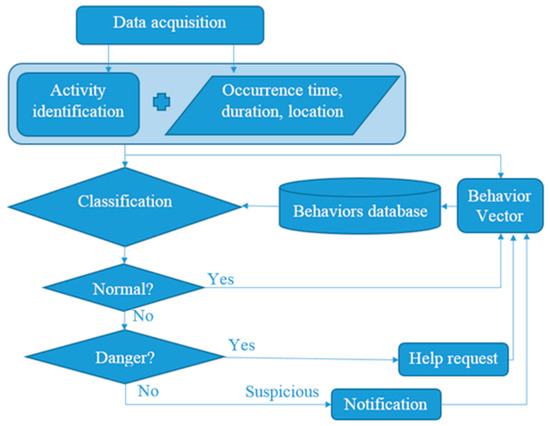
Figure 5.
Behavior classification scheme.
The behavior classification method can make use of the advantages of different machine learning algorithms like decision trees, Support Vector Machines (SVM), k-Nearest Neighbor (KNN) and the Behavior Vector, (BV). The authors propose to base the behavior classification on the six-component BV consisting of five components based on collected data, such as Time of Day (ToD), Section of Apartment (SoA), Zone of Activity (ZoA), Form of Activity (FoA), Duration of Activity (DoA), and the sixth component is Class of Behavior (CoB), based on the previous observations of the monitored person.
The ToD component is measured using the microcontroller’s timer and configurable timeframes, which can be adjusted to personal habits and even changes due to seasons. The SoA and ZoA components are determined from the predefined layout of the apartment and estimates of the PDR indoor localization method. The FoA component results from the proposed activity recognition method, and the DoA component is calculated from timings of recognized activity. The timeframe patterns of normal behaviors of CoB components will be adjusted based on observations of three different elderly persons, two females and one male, during their daily activities.
The behavior is considered as suspicious if its duration exceeds the timeframe of normal behavior up to the 150%. The dangerous behaviors are those that cannot be recognized either as normal or as suspicious behaviors. Table 2 presents the possible states of each component of BV.
Table 2.
Components of the behavior vector.
According to the requirements, in the case of suspicious and dangerous behaviors, additional information about the monitored person’s heart rate, is required.
6.3. Prototyping
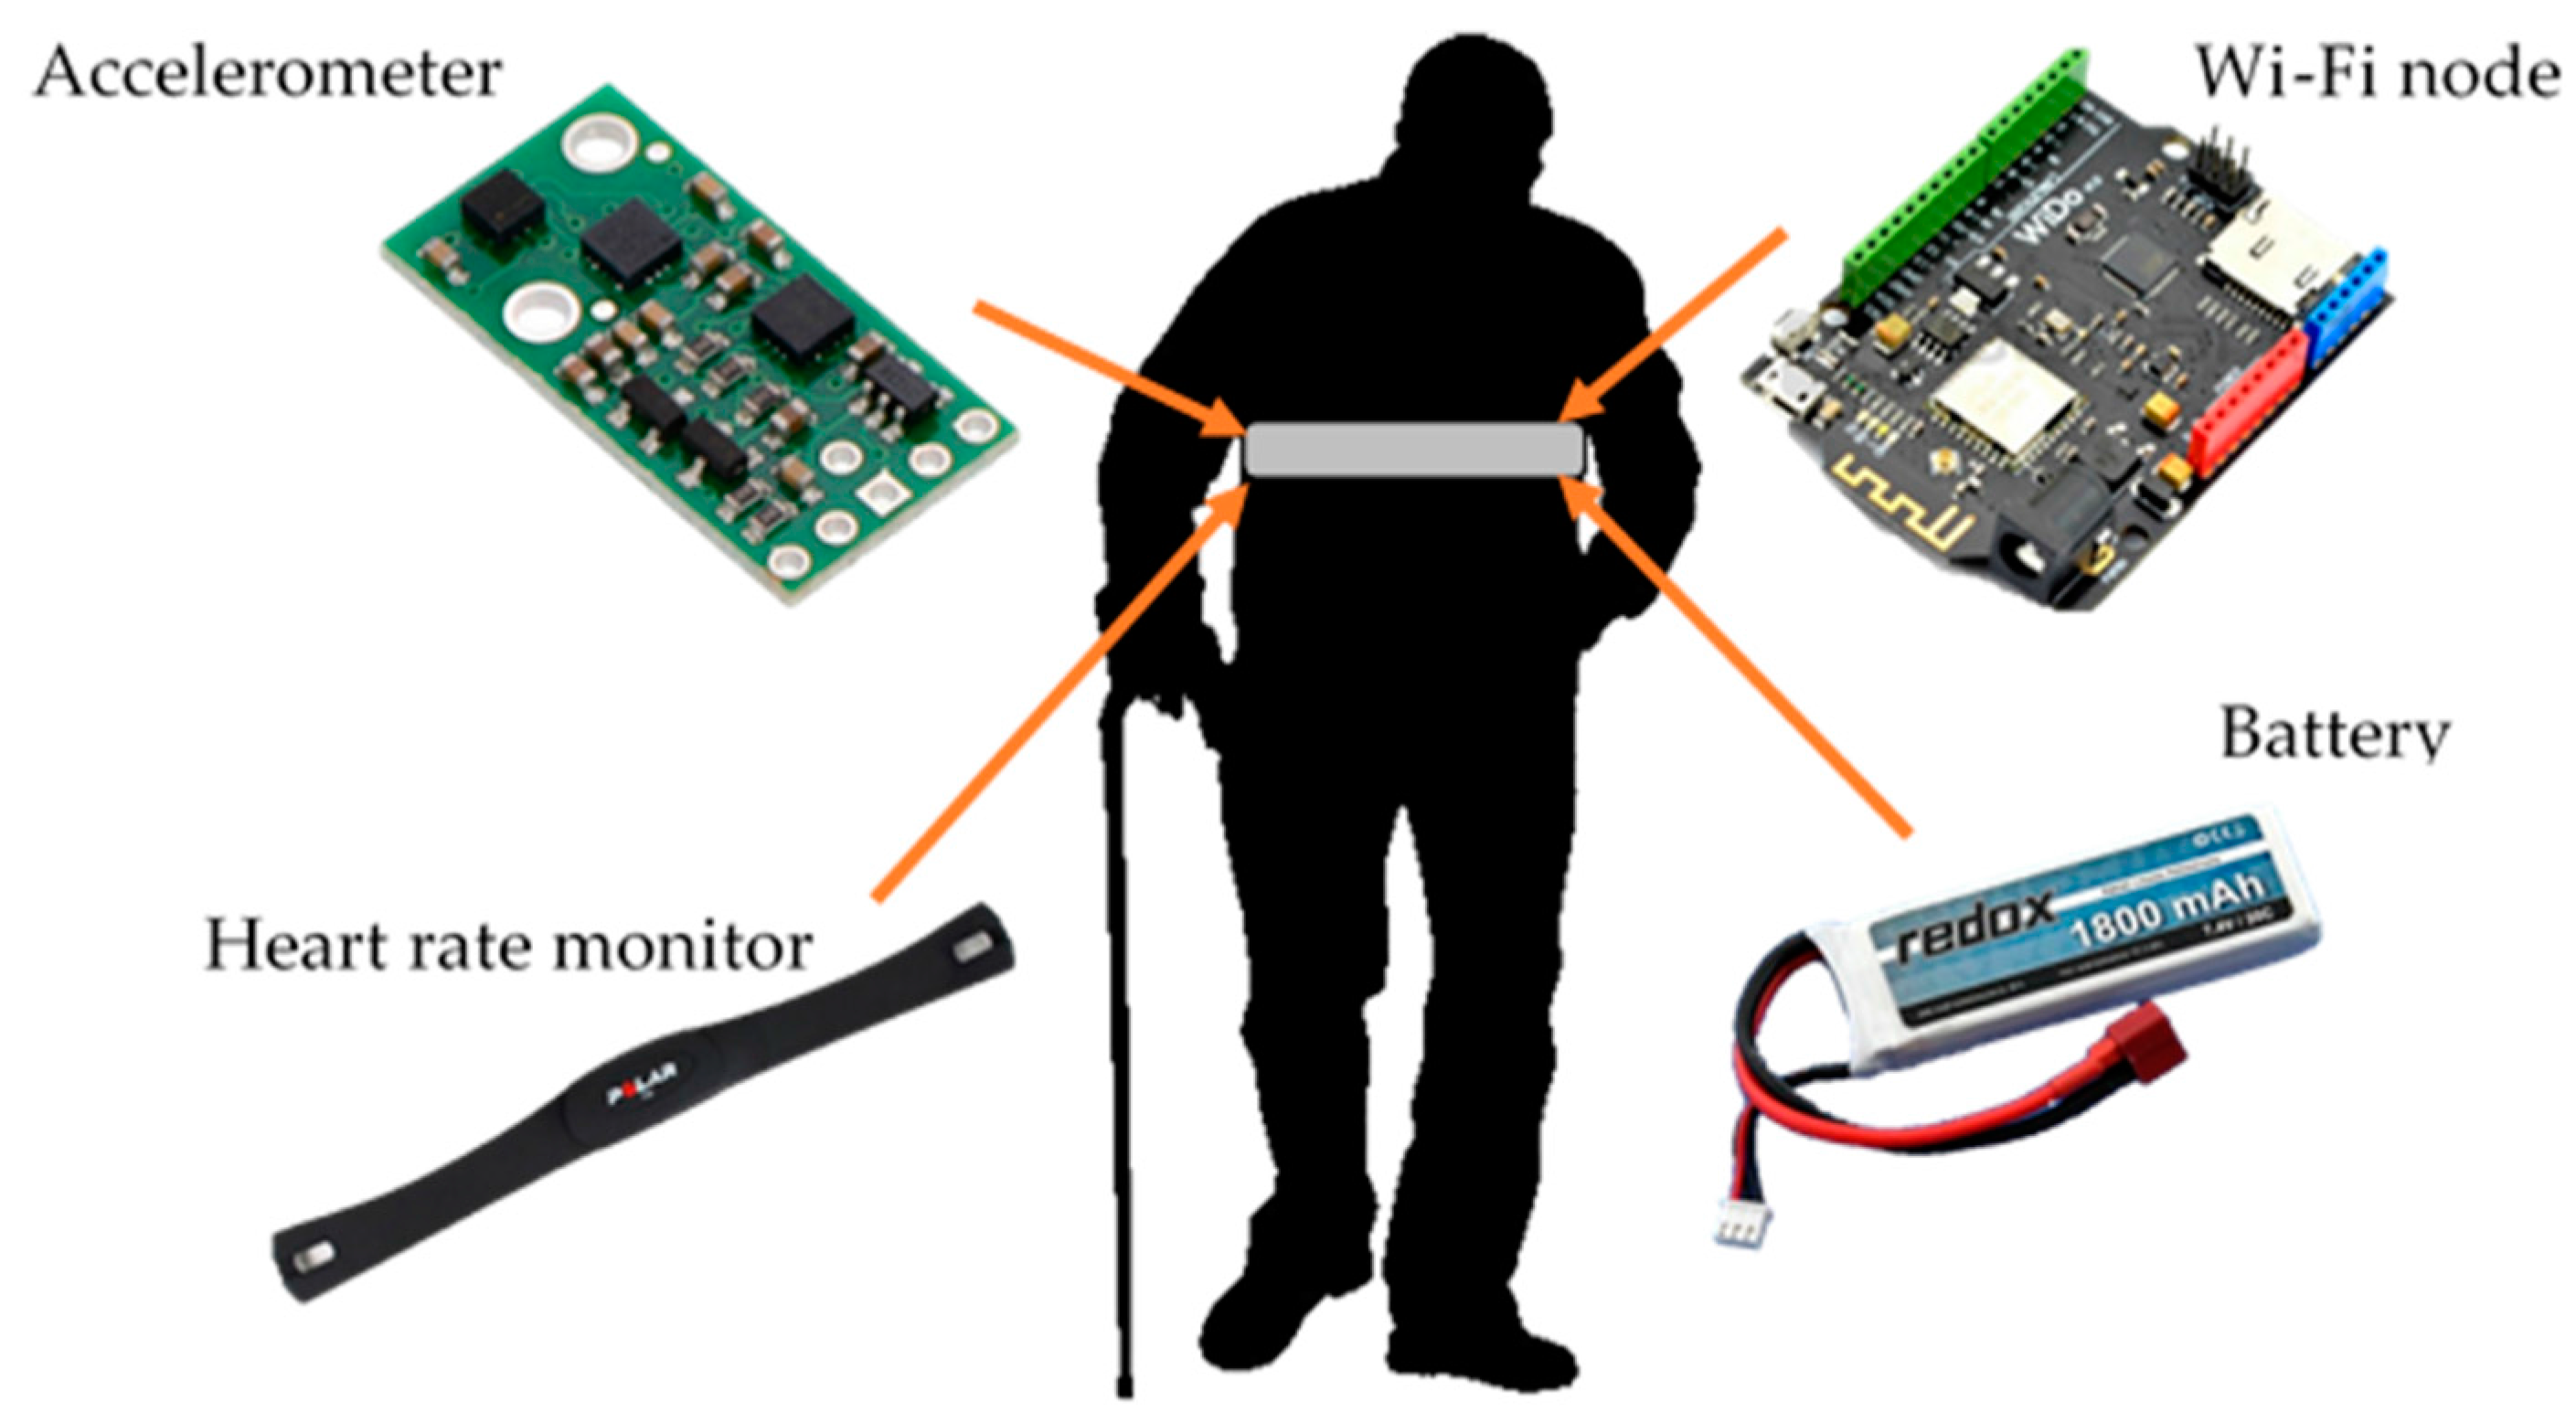
The realized prototype of the system consisting of the designed components is illustrated in Figure 6, where the core of the system is the Arduino-compatible WiDo WiFi WG1300 module equipped with a microcontroller ATmega32u4 and supporting communication with the 2.4-GHz IEEE 802.11 b/g standard. Moreover, the system consists of the Inertial Measurement Unit (IMU), AltIMU-10 v4 with built-in three-axis gyroscope, accelerometer and magnetometer and altimeter. Both devices are mounted on the Polar’s T34 Heart Rate Transmitter chest strap and powered with the Li-Pol Redox 1800 mAh 20C 2S 7.4-V battery.
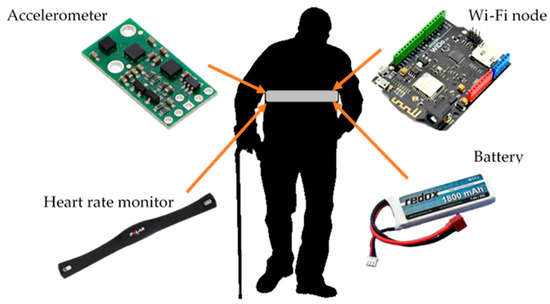
Figure 6.
Component setup of the designed system prototype [41].
The behavior identification and its classification are implemented on a Lenovo ThinkPad T440s with i5-4200u 1.6-GHz CPU and 8 GB of RAM with the Windows 7 64-bit operating system and modeling environment MATLAB Version 2015a.
6.4. System Validation
To prove that the proposed solution works properly and fulfills the stated needs and requirements, the validation process is necessary. It begins with an analysis of the accuracy of step detection and direction estimation. Then, the performance analysis of the used localization method is done. Further steps concern the detailed investigation of activity recognition and the developed behavior classification method. The last step of this process is to check if the costs meet the stakeholders’ assumptions.
6.4.1. Path Tracking Algorithm
After applying a simple Butterworth low-pass filter of a 2-Hz cutoff frequency to the raw SMV readings of the accelerometer, it was possible to discern single steps with 98% validity for 1500 steps in the test environment. The test of direction estimation, , resulted in the mean uncertainty of 1.33°, the standard deviation of 1.15° and the maximal error of 3°. Such high sensitivity causes even the small motions of the body arising from the walking characteristics to be considered as direction changes, imposing an error in the position estimation. The authors’ empirical studies indicate that this effect, for a four-meter walk back and forth repeated three times, causes location error in the y-axis of 1 m and 0.5 m in the x-axis. To eliminate the error of walking characteristics, the direction changes smaller than 6° are neglected. This approach allows reducing the localization error from one meter up to 40 cm.
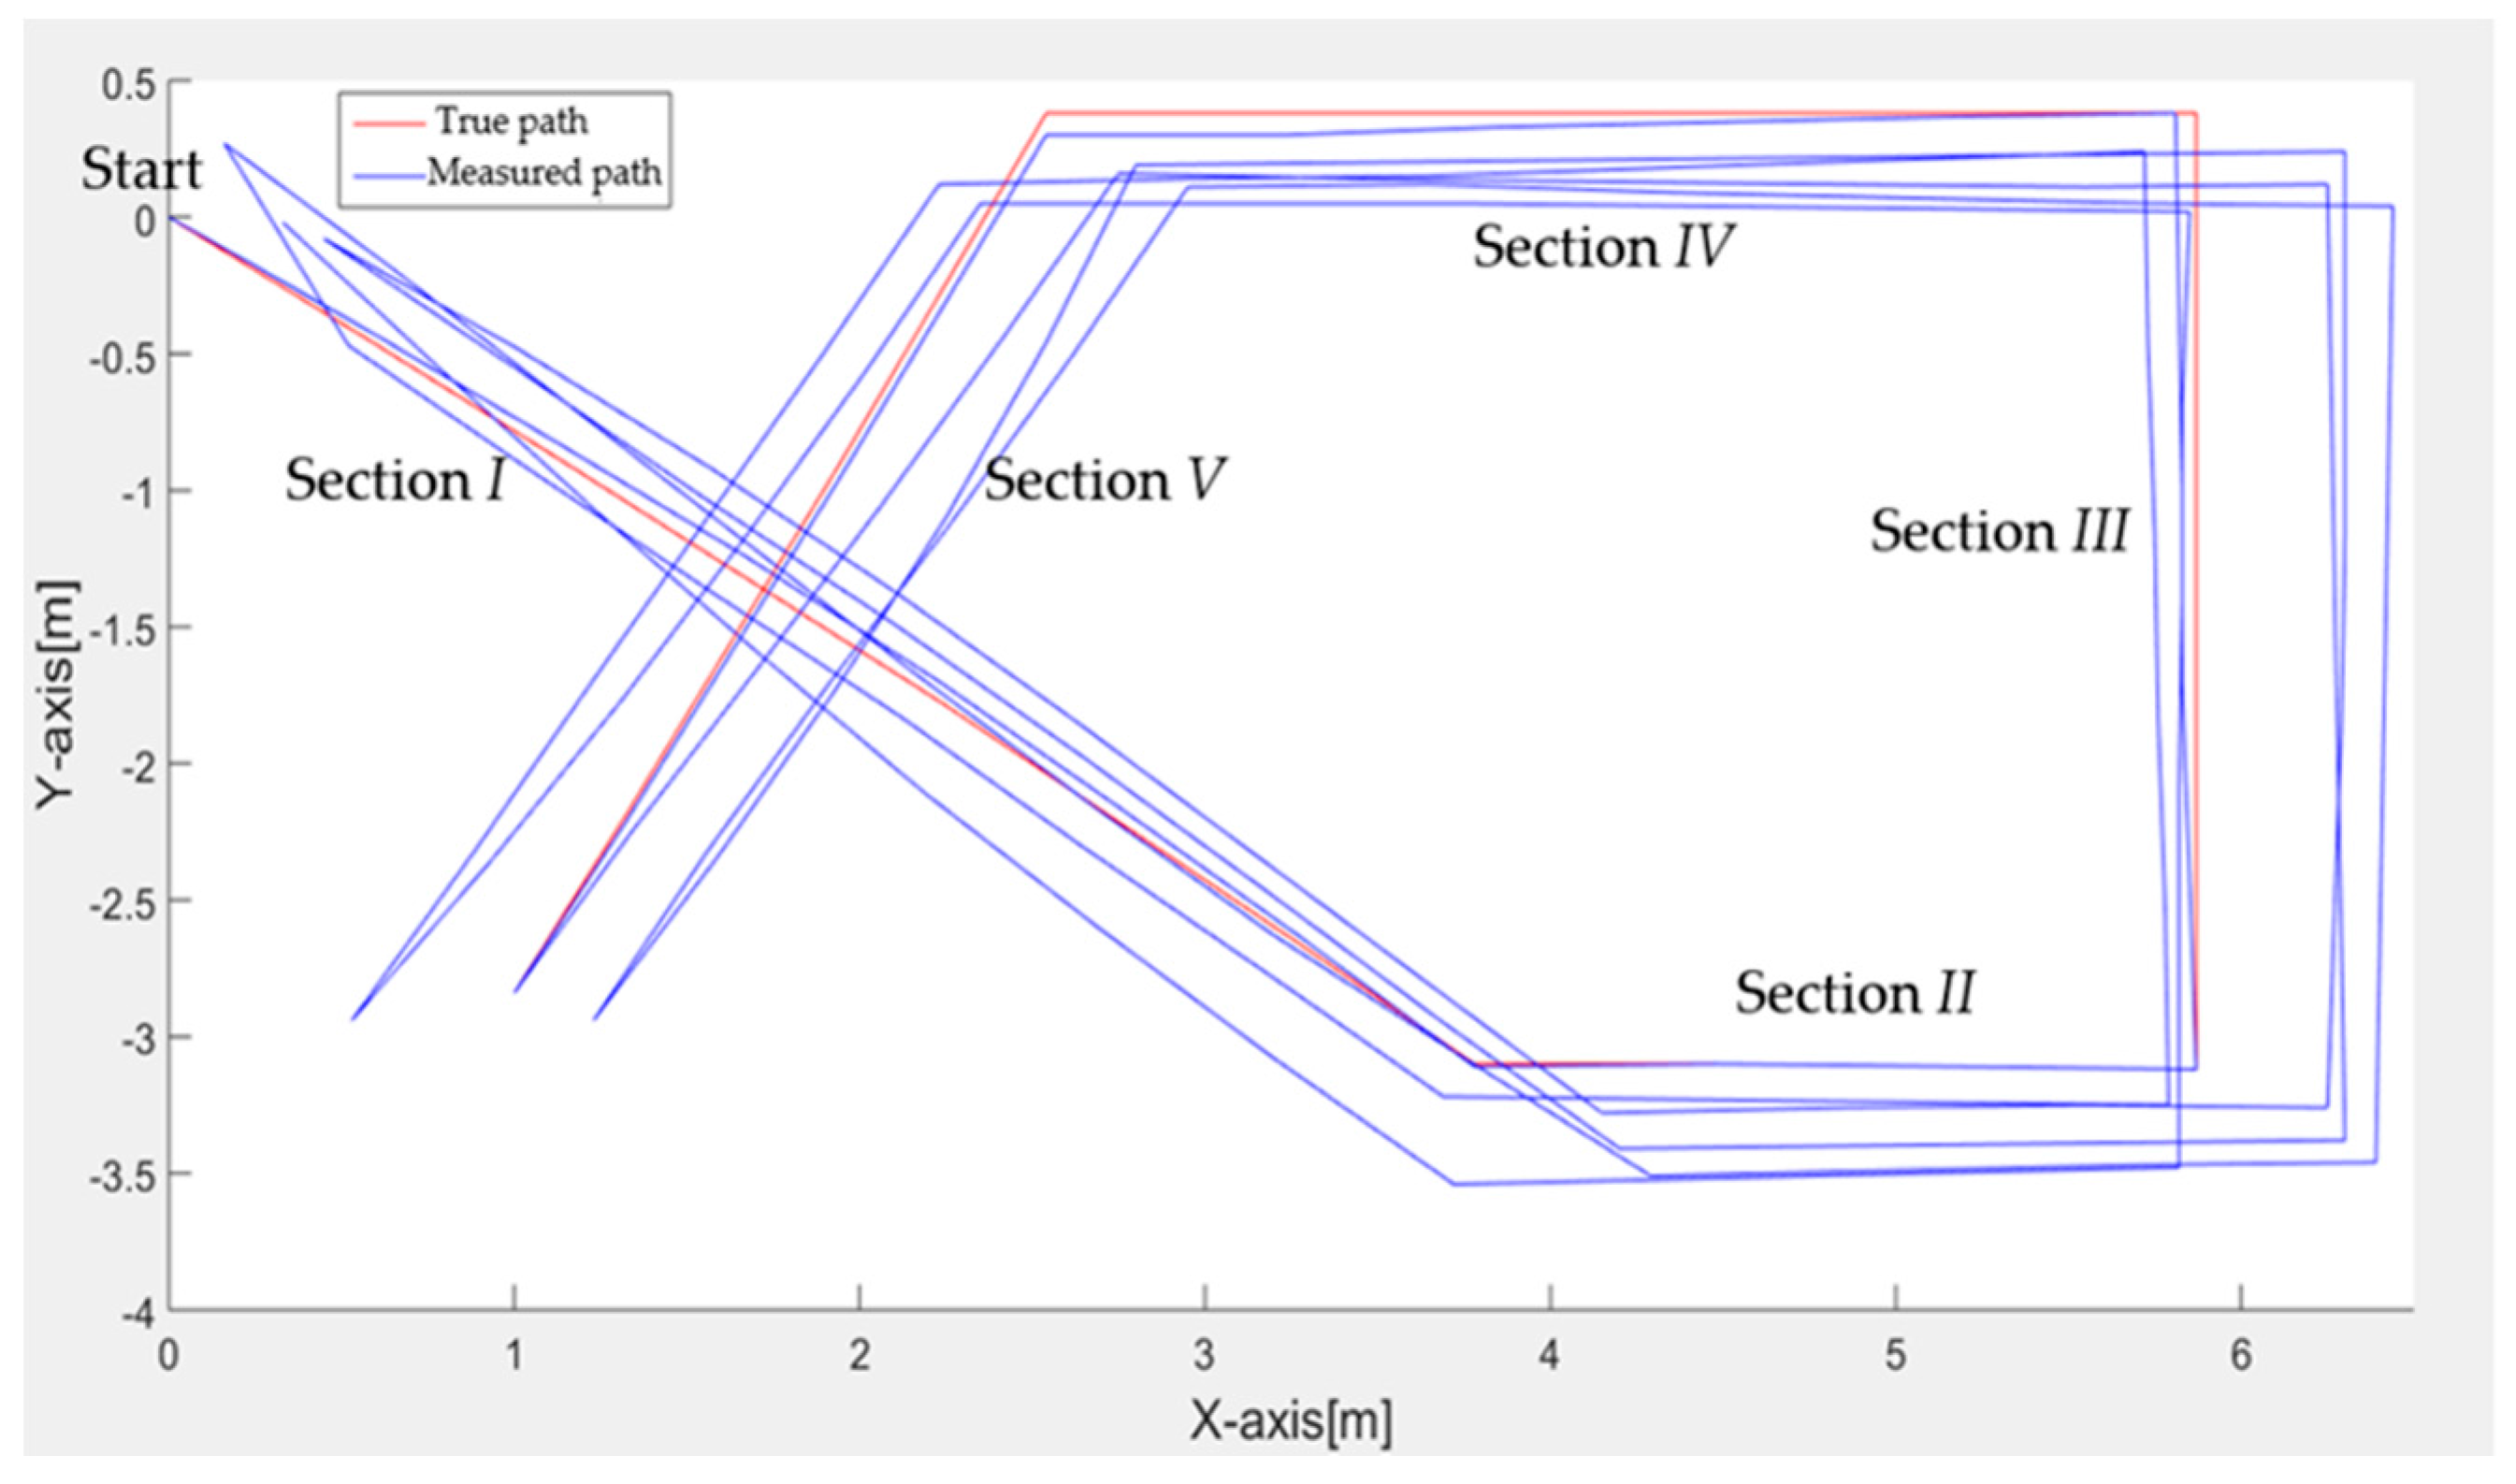
The proposed PDR algorithm with the 6° threshold was investigated in the tested environment. The test path of a walk back and forth each consisted of five sections: I, seven steps ahead, then turn 45° to the left; II, three steps ahead and turn 90° to the left; III, five steps ahead and turn 90° to the left; IV, five steps ahead and 45° turn; and V, five steps ahead; see Figure 7. Then, the volunteer returned to the starting point in the reverse order. The walking pattern was repeated three times.
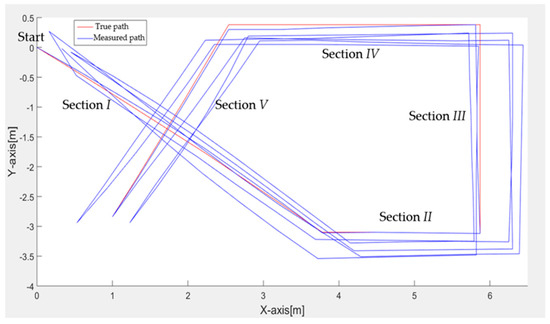
Figure 7.
Test path for validation of PDR indoor localization.
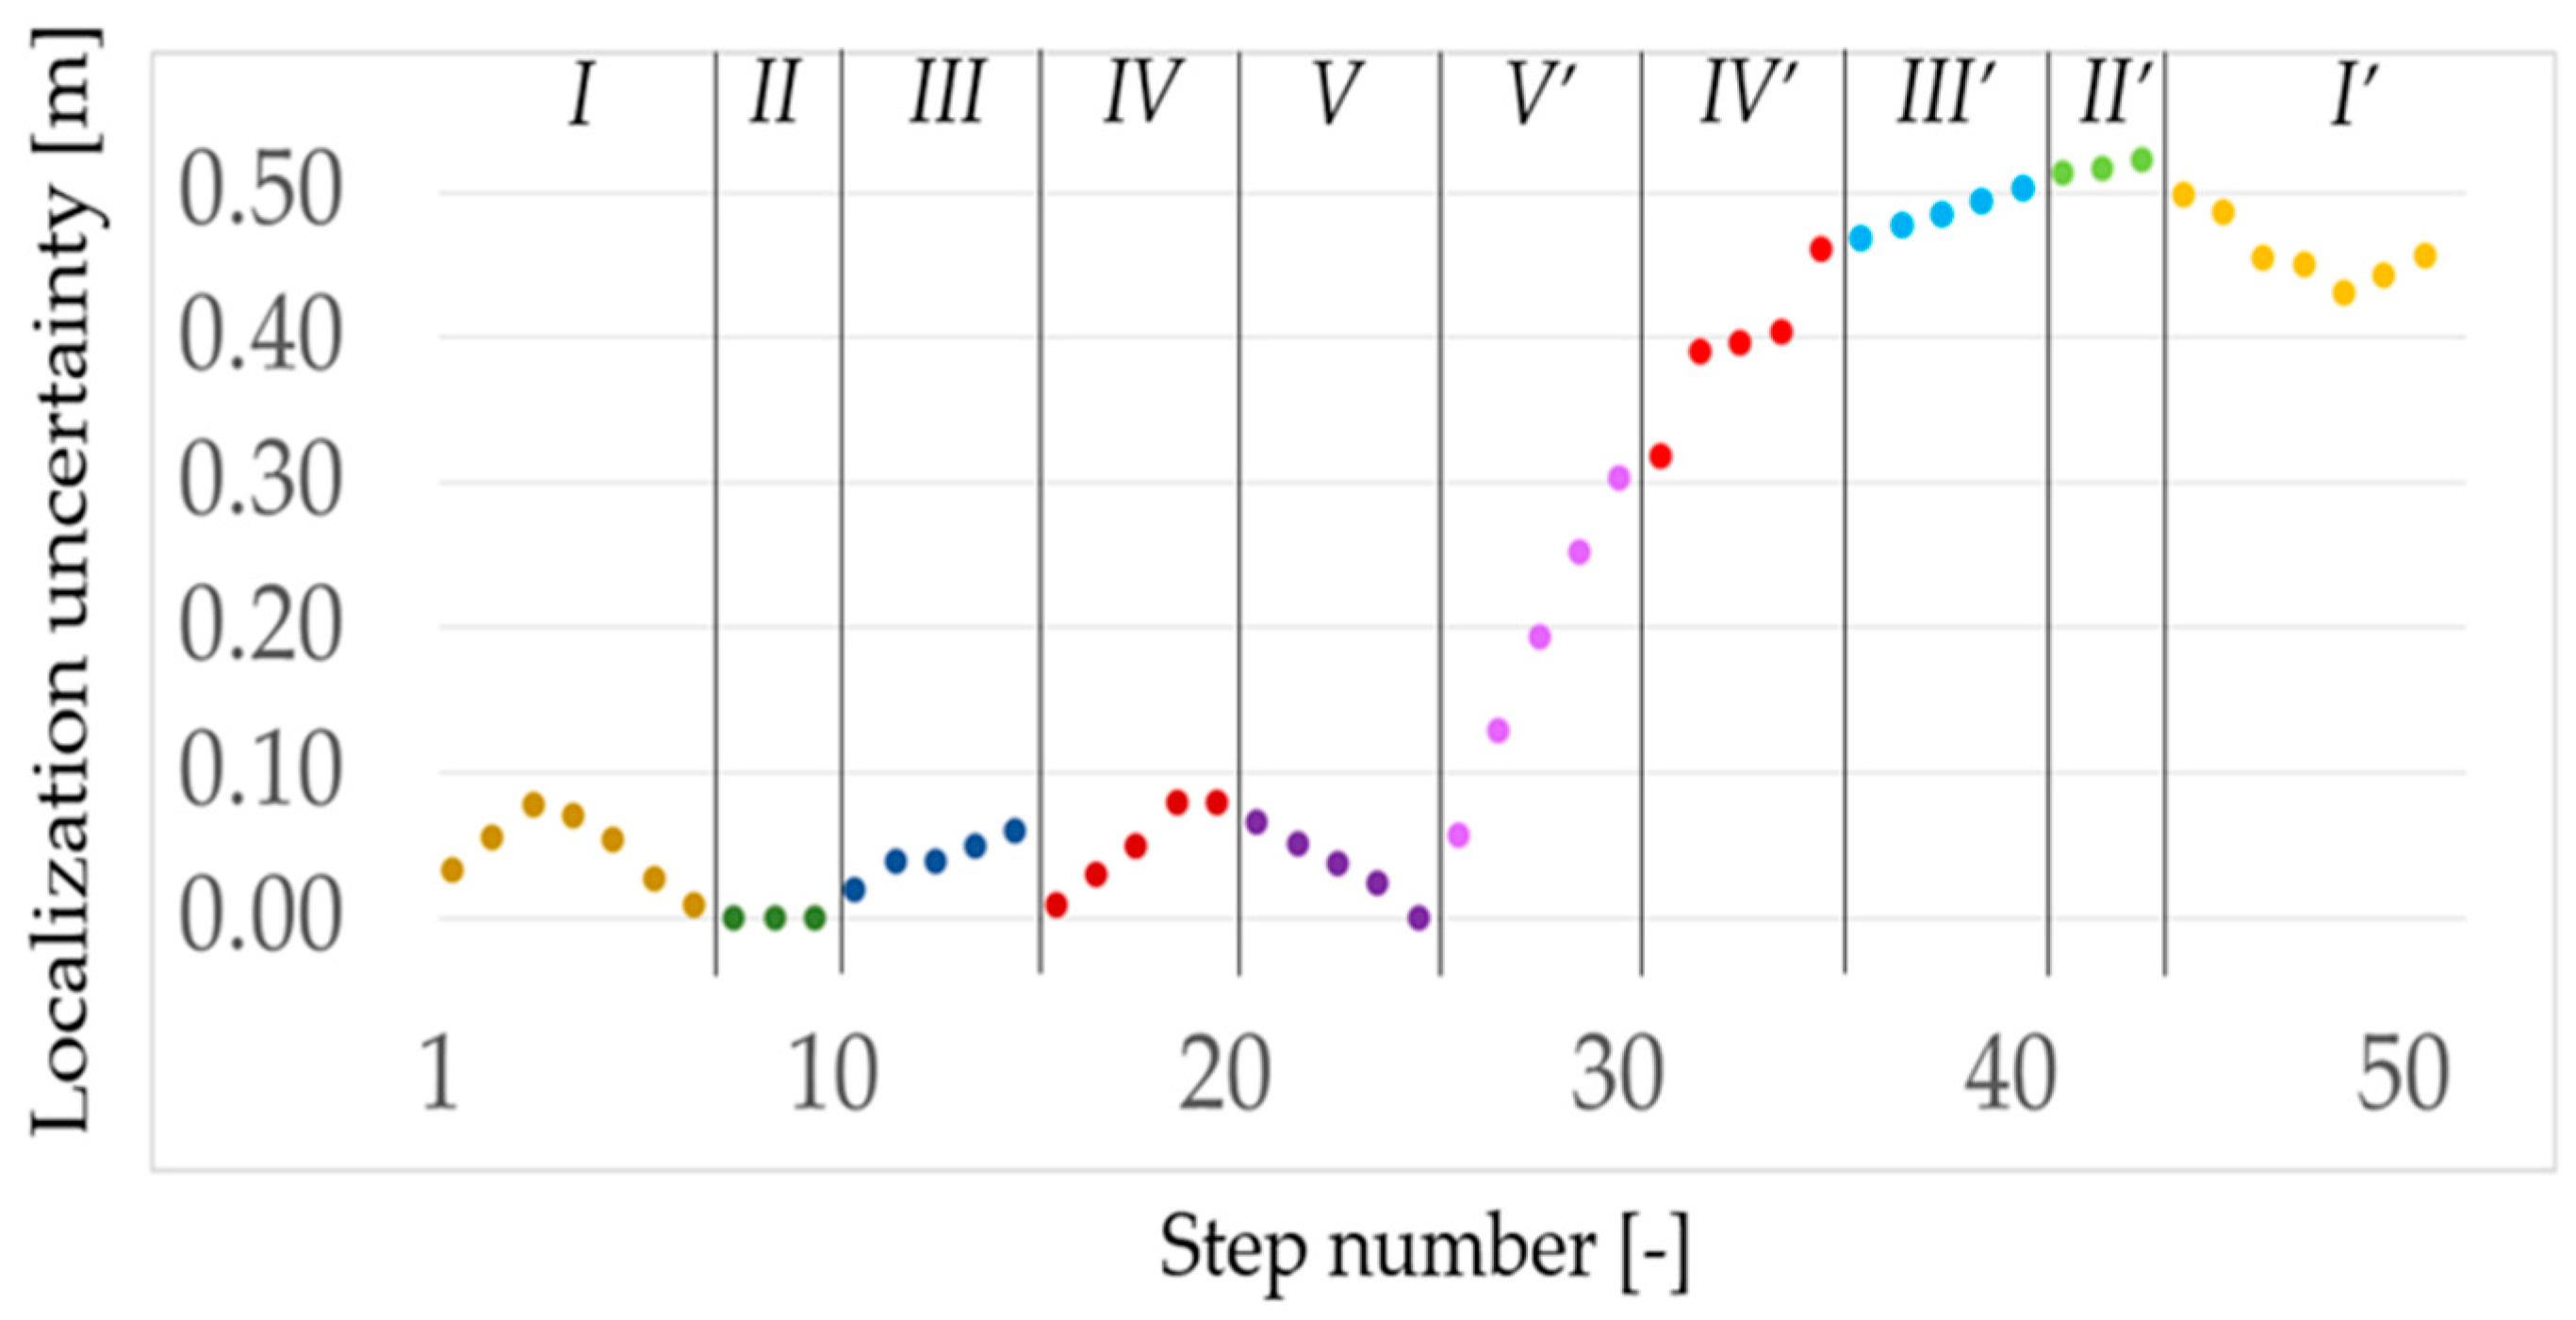
To comprehend the localization characteristics, Figure 8 shows the localization uncertainty for each step of the test’s first round with a division of the path sections for a walk back and forth. The orange dots indicate the localization uncertainty for the first seven steps ahead. The green dots show uncertainty for the three steps after the 45 ° turn to the left.
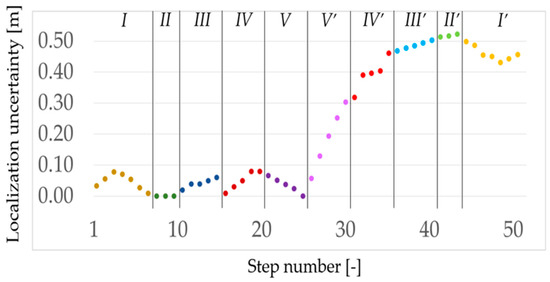
Figure 8.
PDR indoor localization uncertainty for each step of the first round of the test path from the start to the end points and in the reverse direction.
The blue dots correspond to the five steps after the 90° turn to the left; the red dots indicate the five steps ahead after another 90° turn to the left; and finally, the purple dots show the last five steps ahead after the 45° turn. For the test path of going one direction, the mean localization uncertainty is 4 cm with a standard deviation of 2 cm. However, the same quantities for the direction of returning to the origin are worse and are 40 cm and 12 cm, respectively. Nevertheless, this difference can be caused by the physiological effect of repeating exactly the same path, especially the V section. This effect is further analyzed in the following part of this section.
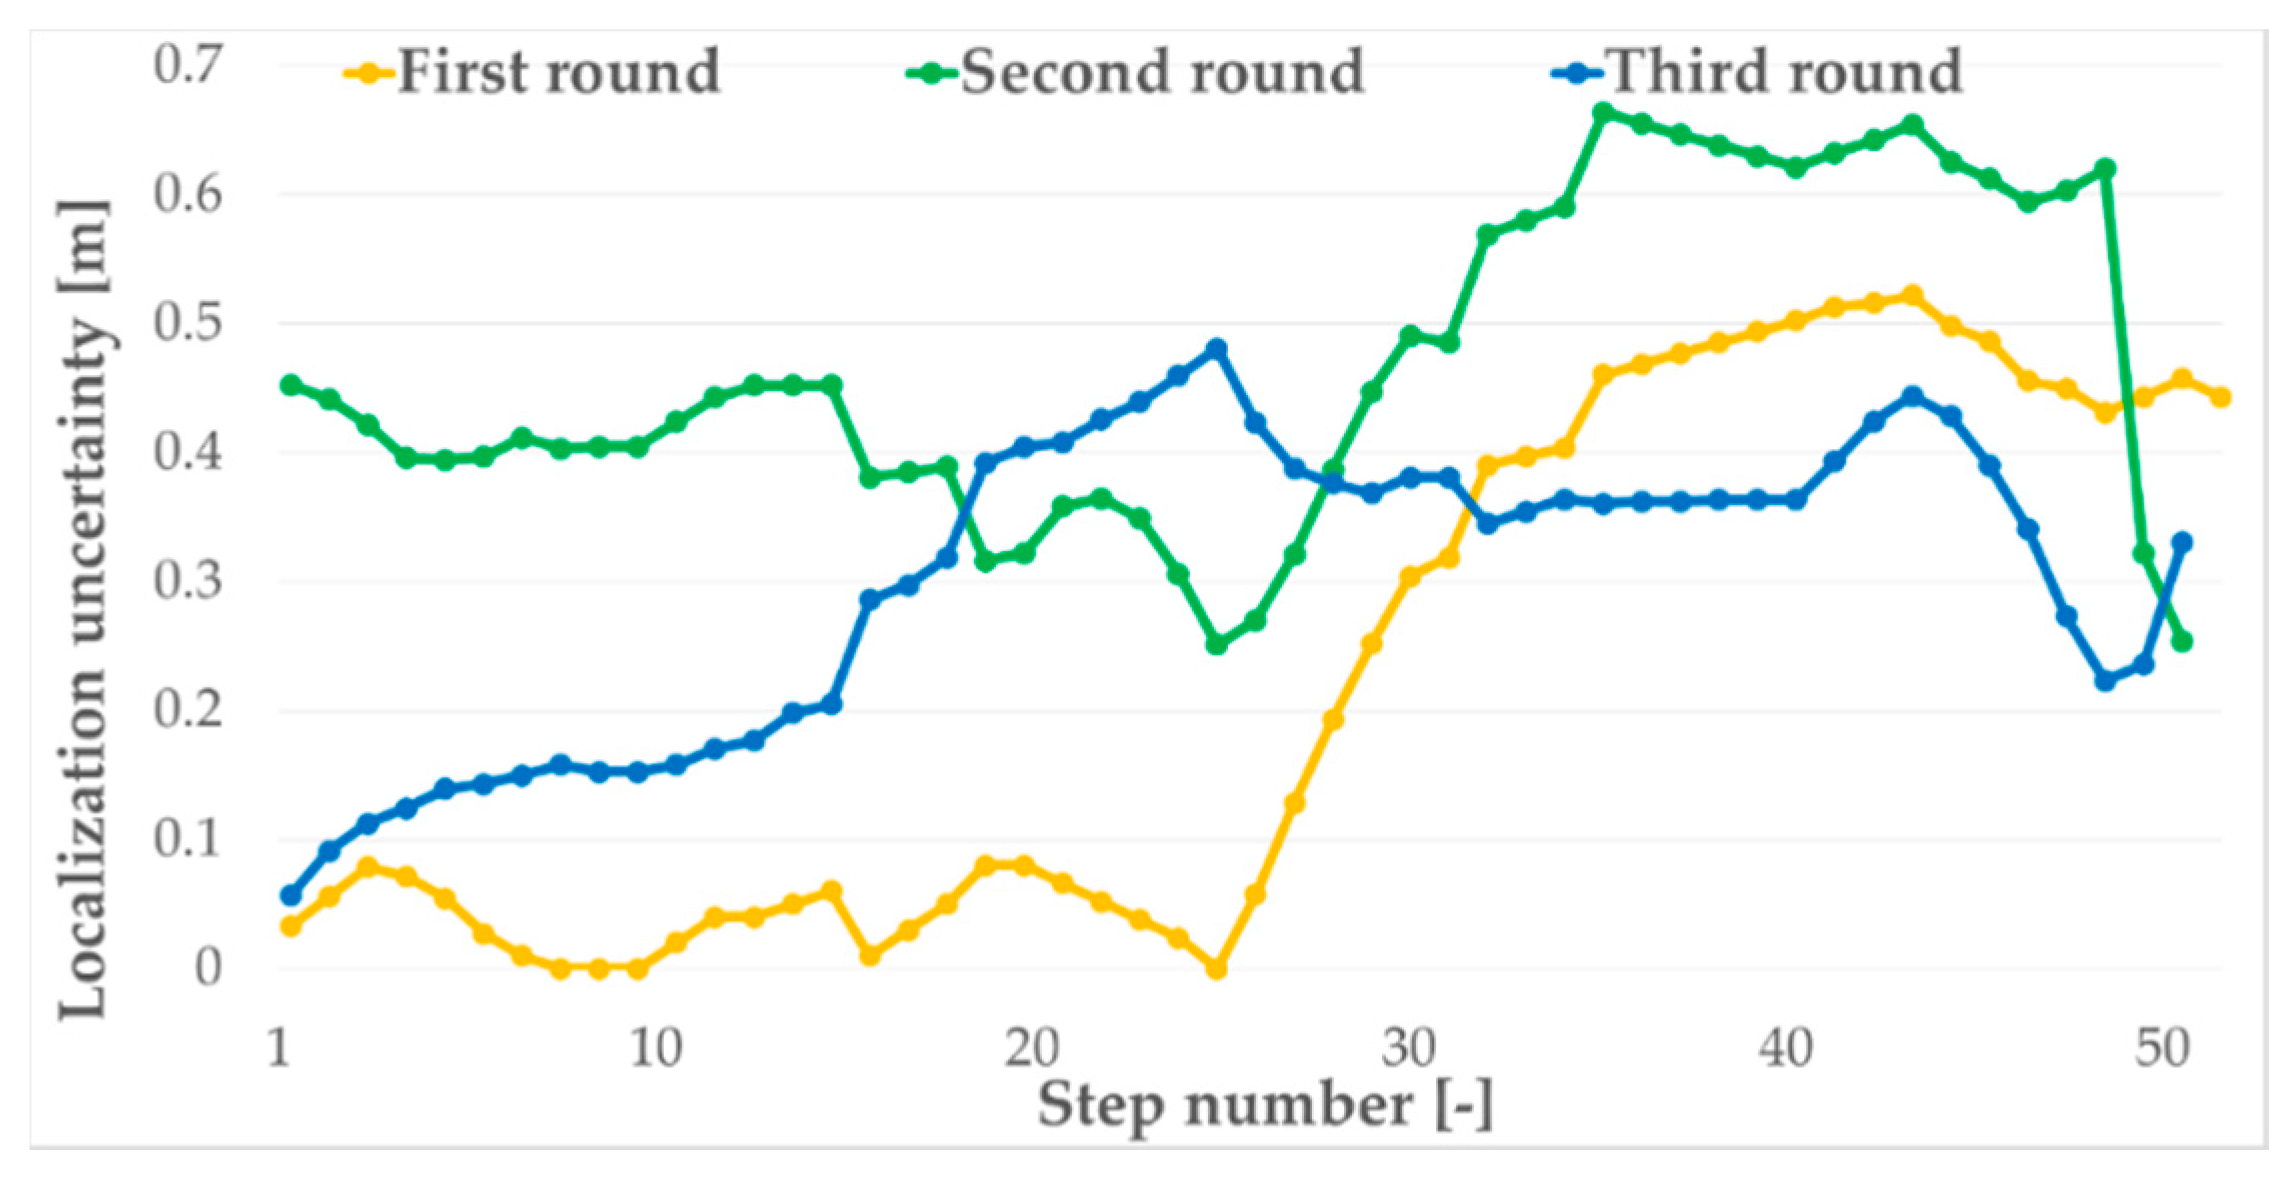
Figure 9 shows the localization uncertainty for each step of the three rounds of the test five-stage path from the start point to end and in the reverse direction. The mean localization uncertainties for each round are 22 cm, 46 cm and 30 cm, with standard deviations of 20 cm, 12 cm and 11 cm for the first, second and third round, respectively. From these data, one can see that there are clear differences in the two phases of walking back and forth. Probably, this is an effect of a test psychological bias, which cannot necessarily affect the measurements in a real environment. For the whole test path, the mean localization uncertainty is 33 cm, with a standard deviation of 18 cm and a maximal localization error of 66 cm.
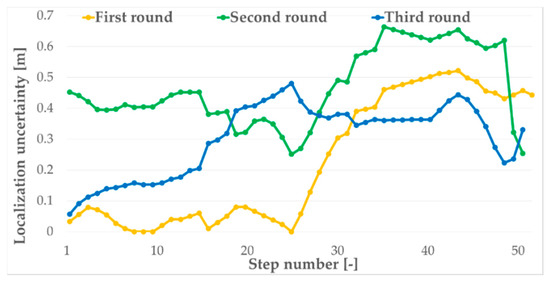
Figure 9.
PDR indoor localization uncertainty for each step of three rounds of the test path from the start to end points and in the reverse direction.
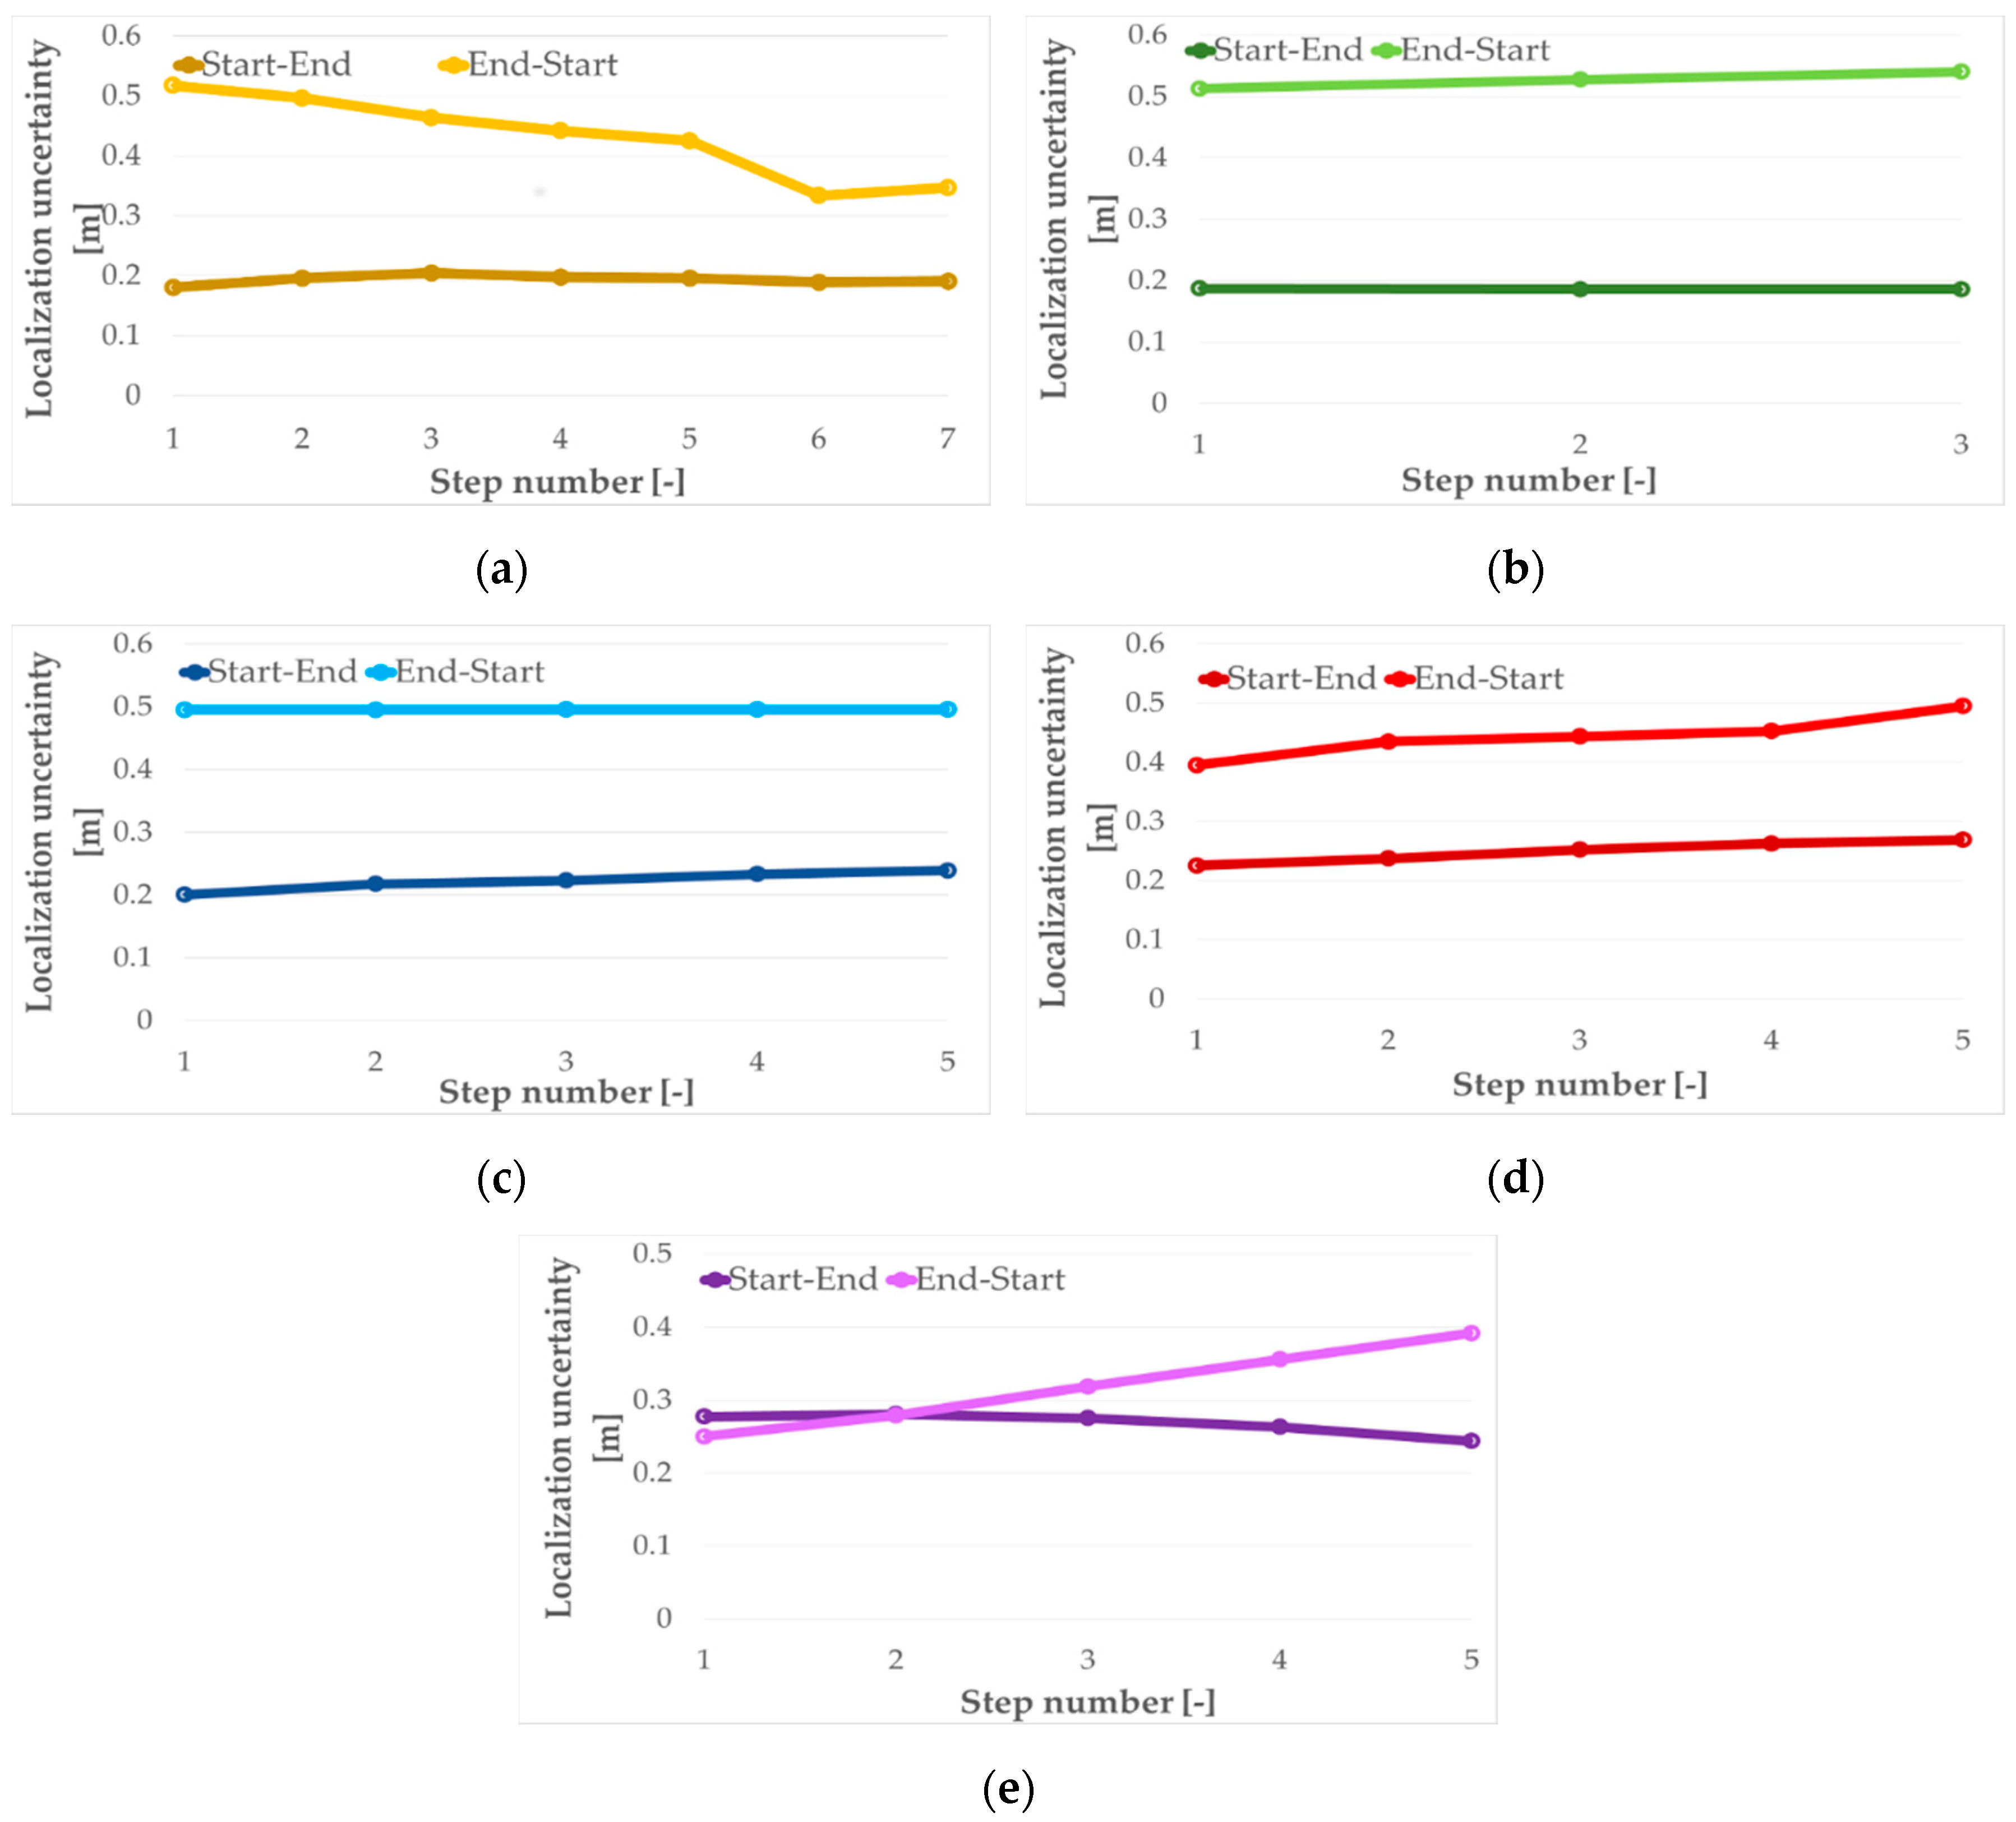
Figure 10 shows the averaging of the three rounds of localization uncertainty for each step with distinction for each path section for the two directions. The average of the mean uncertainty for the forward direction is almost the same and equal, about 21 cm. However, the same uncertainty for the back direction is about double and equal, almost 40 cm. The exception is the section V when both directions have almost the same average values. It is noticeable that the standard deviations of the measurements are much smaller than the mean uncertainty. It seems that the turns are the cause of the increasing localization uncertainty.
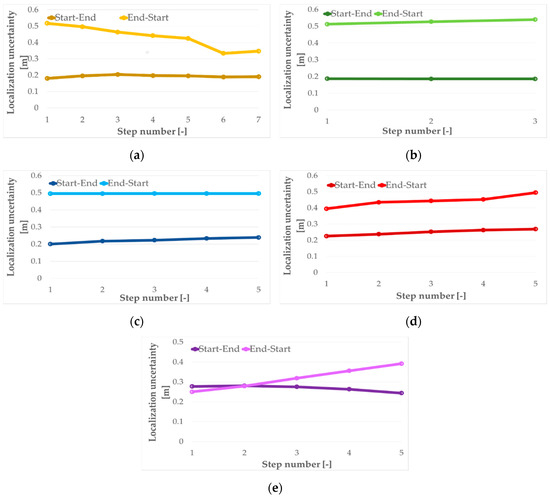
Figure 10.
Localization uncertainty for each step for the two directions of the test path sections: (a) for I; (b) for II; (c) for III; (d) for IV; (e) for V.
The performed tests prove that the localization accuracy of the proposed algorithm is sufficient for the requirement of the four room-zone level accuracy. However, it also indicates that the longer use of the algorithm causes localization drift, which could lead to losing calibration. Therefore, the load sensors, similar as in car seats, are used as re-calibration points. Those distinguishable sensors, with fixed x and y coordinates, should be mounted at the most frequently-used places, such as the bed, armchair, sofa or kitchen chair. Moreover, those sensors can even be used for the primary calibration of the system. The presented results are consistent with the results reported in [26].
6.4.2. Form of Activity Recognition
One of the requirements, stated by the future users and stakeholders, was to detect a fall of the monitored person in a distinguishable way from the other activities such as standing, sitting, lying down and walking. In order to perform the activity recognition, the SMV and accelerations in the x-, y- and z-axis are measured, and based on the test data, the appropriate identification thresholds for each activity have been justified and set.
To adjust the identification thresholds of a fall, the SMV and accelerations in the x-, y- and z-axis of fall tests of two volunteers were analyzed. Figure 11 presents an example of accelerations in the x-, y- and z-axis along with the SMV measurement of the forward fall test. As one can see, due to the characteristic peaks concerning the beginning of the fall and the contact with the floor, it is possible to justify such thresholds to recognize the fall. Moreover, the decreased levels in the y- and z-axis indicate that the person is lying, which also confirms a fall if at the initial instant, standing positions were recognized.
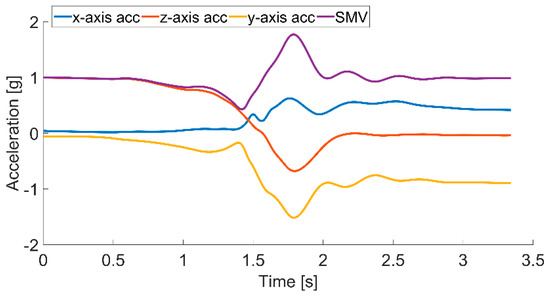
Figure 11.
Forward fall test: accelerations in x-, y- and z-axis and SMV characteristic.
The final fall test consisted of 350 different falls including forward, backward, lateral falls to left or right, fainting with rotation to the left or right side and tumbling preceded by flexing the knees, 50 times each case. Up to 342 falls were identified correctly, which gives a satisfying fall detection validity of 98%.
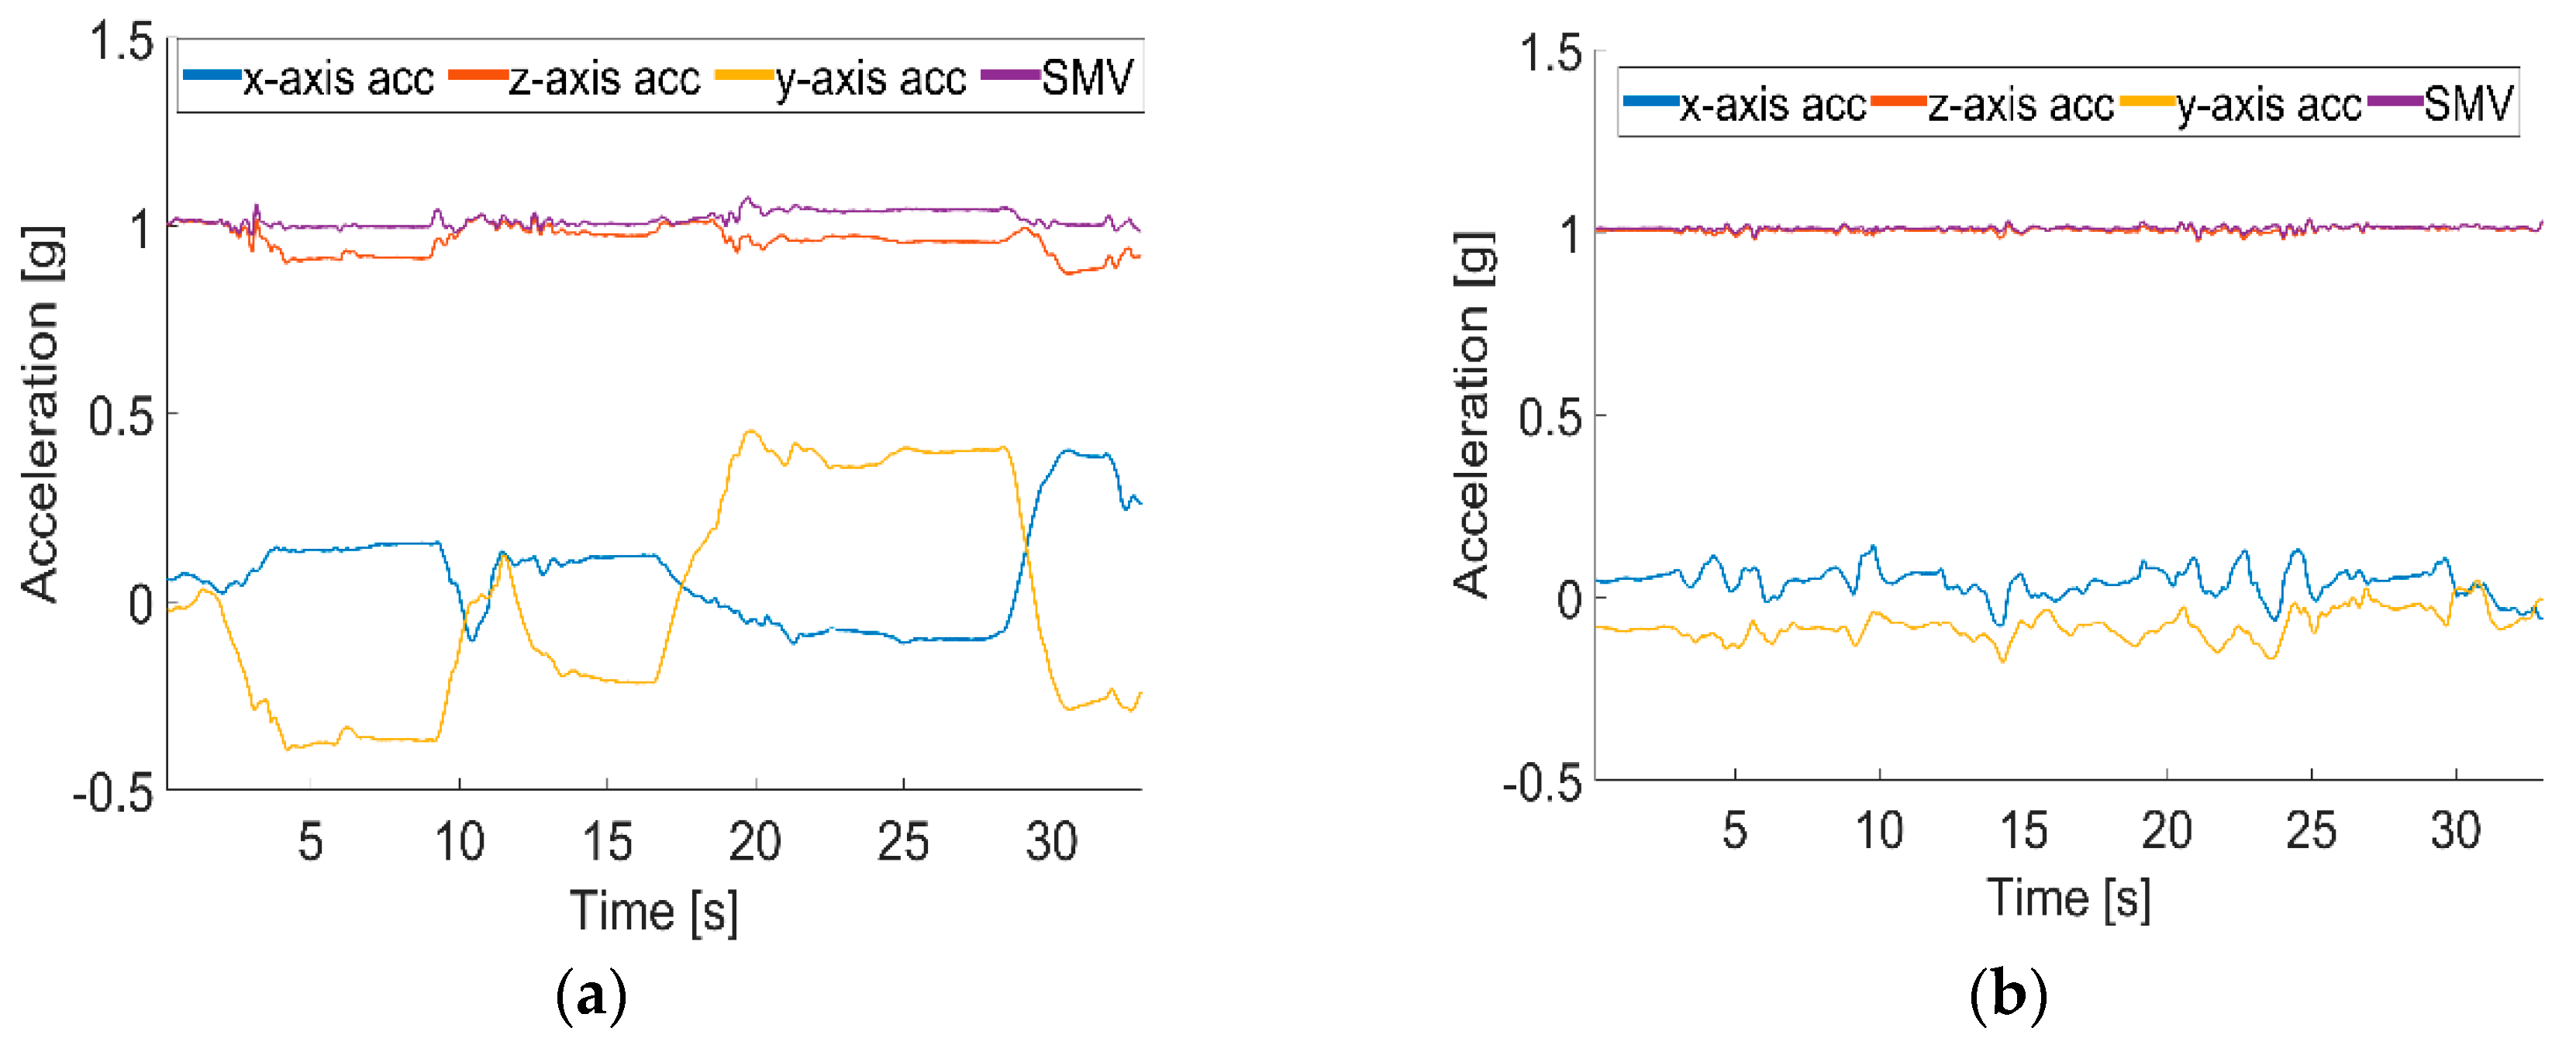
As was predicted, the proposed system cannot directly distinguish between standing and sitting postures, which can be seen in Figure 12a,b, presenting the SMV along with accelerometer readings from the x-, y- and z-axes for standing and sitting activities, respectively. The signals of all four measured variables are not specific for different activities, and the noticeable changes around of the x- and y-axis in Figure 12a occur due to the natural movement of the body. Therefore, it proves that the observed differences are not sufficient to distinguish between these two activities.
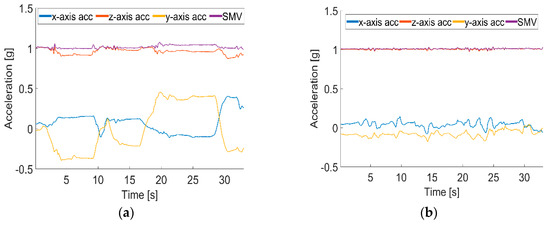
Figure 12.
Accelerations in the x-, y- and z-axis and SMV readings during activities: (a) standing; (b) sitting.
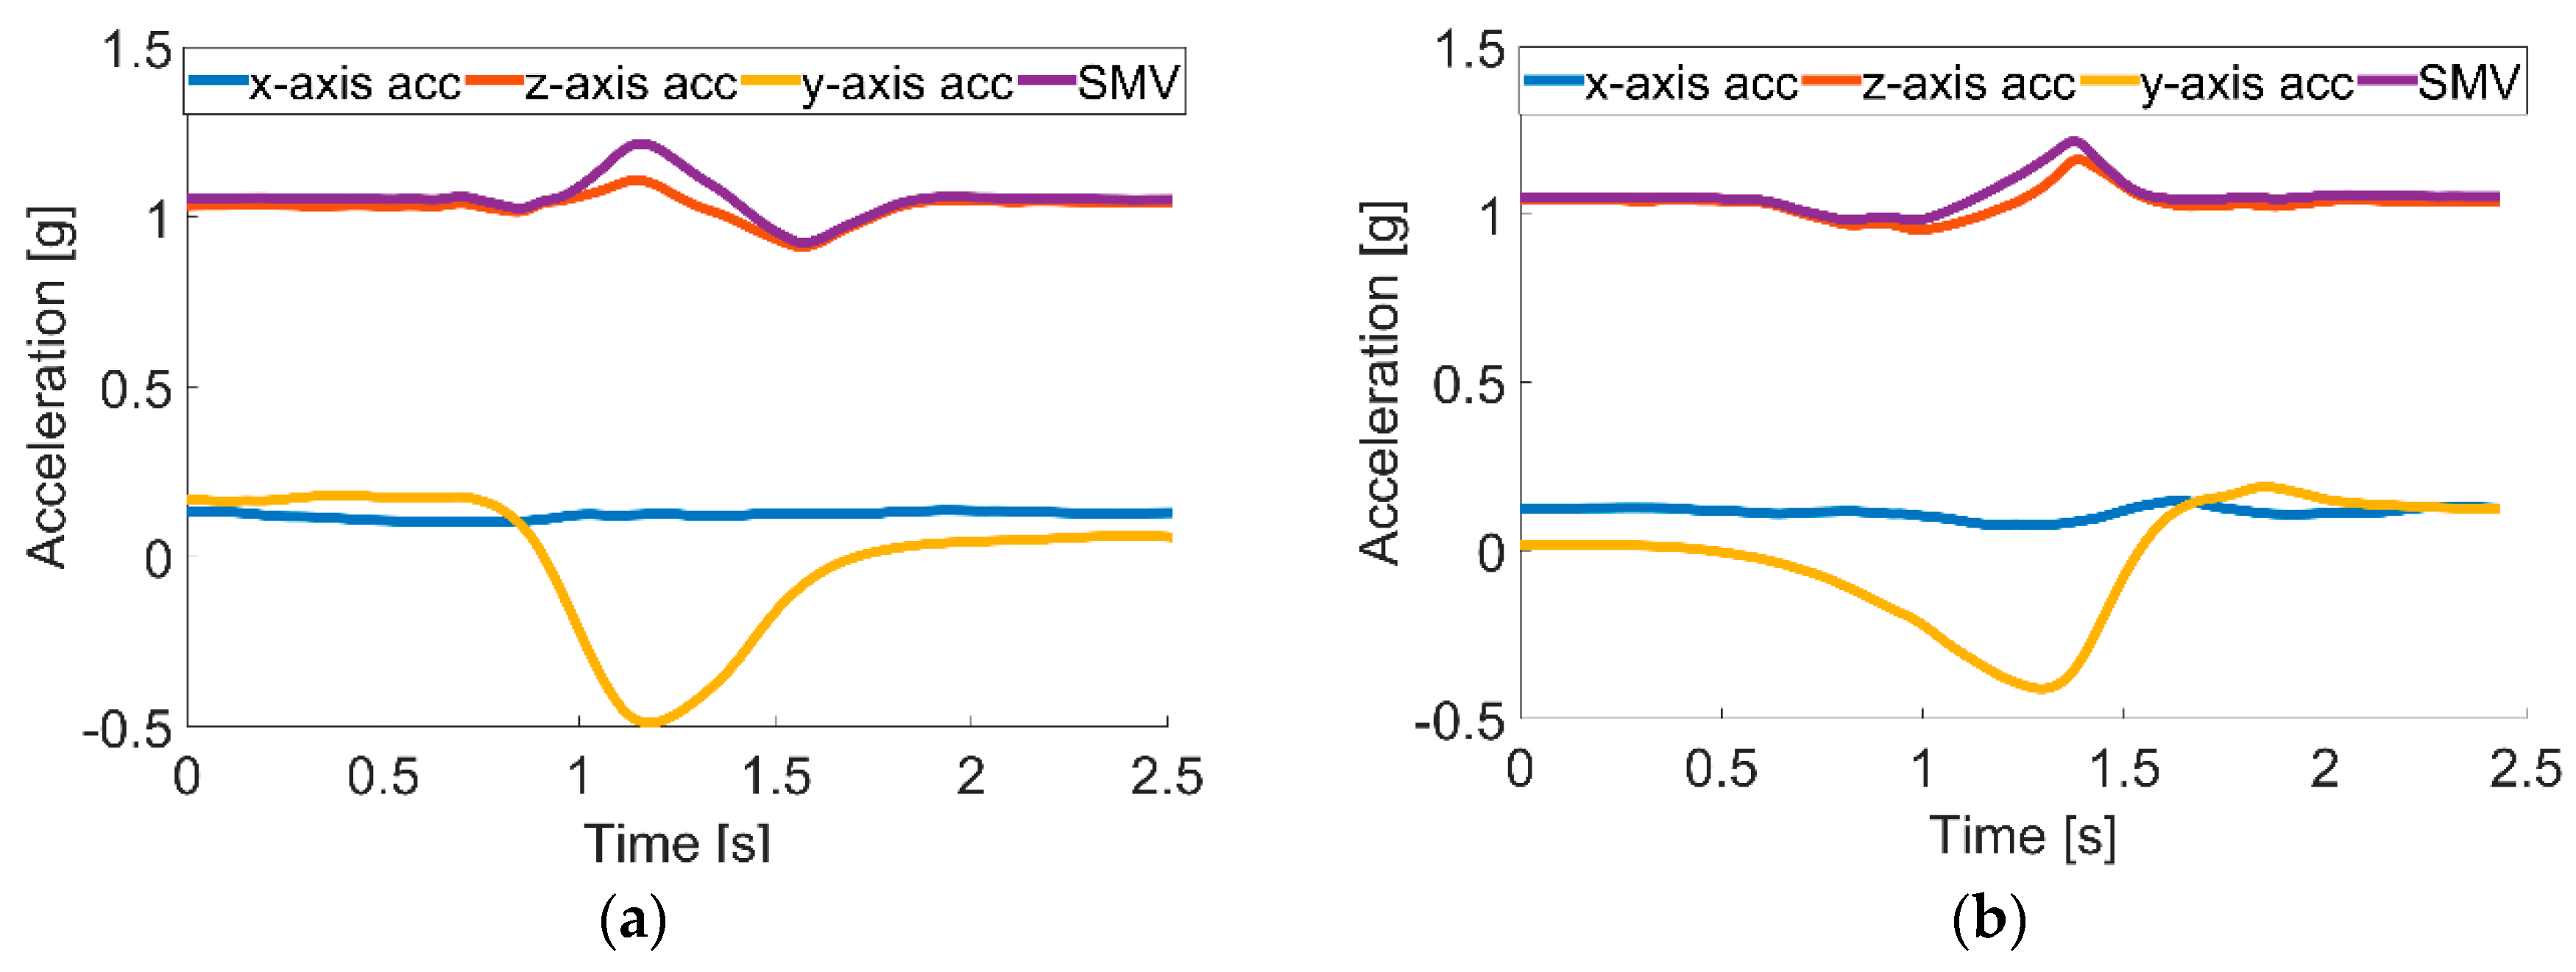
The solution of the problem could be to identify the dynamic activities of sitting down and standing up along with lying down and getting up, instead of static activities of sitting or standing. The volunteers were asked to perform the activities of getting up and sitting down, shown in Figure 13a,b, respectively. As is visible, when the activity of getting up starts, the acceleration in the y-axis and hence SMV changes quickly, and when the volunteer straightens, both acceleration in the y-axis and SMV gently stabilize. During the sitting down activity, the curves are opposite, while bending, the change is mild, and at the end of sitting down, both acceleration in the y-axis and SMV changes quickly. These differences allow for finding the identification thresholds to distinguish between the activities of standing up and sitting down.
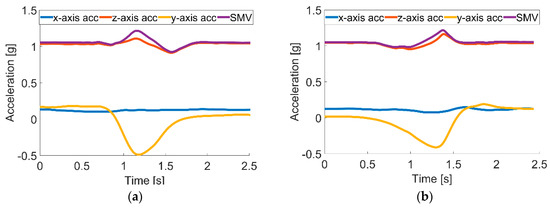
Figure 13.
Accelerations in the x-, y- and z-axis and SMV readings during activities: (a) getting up and (b) sitting down.
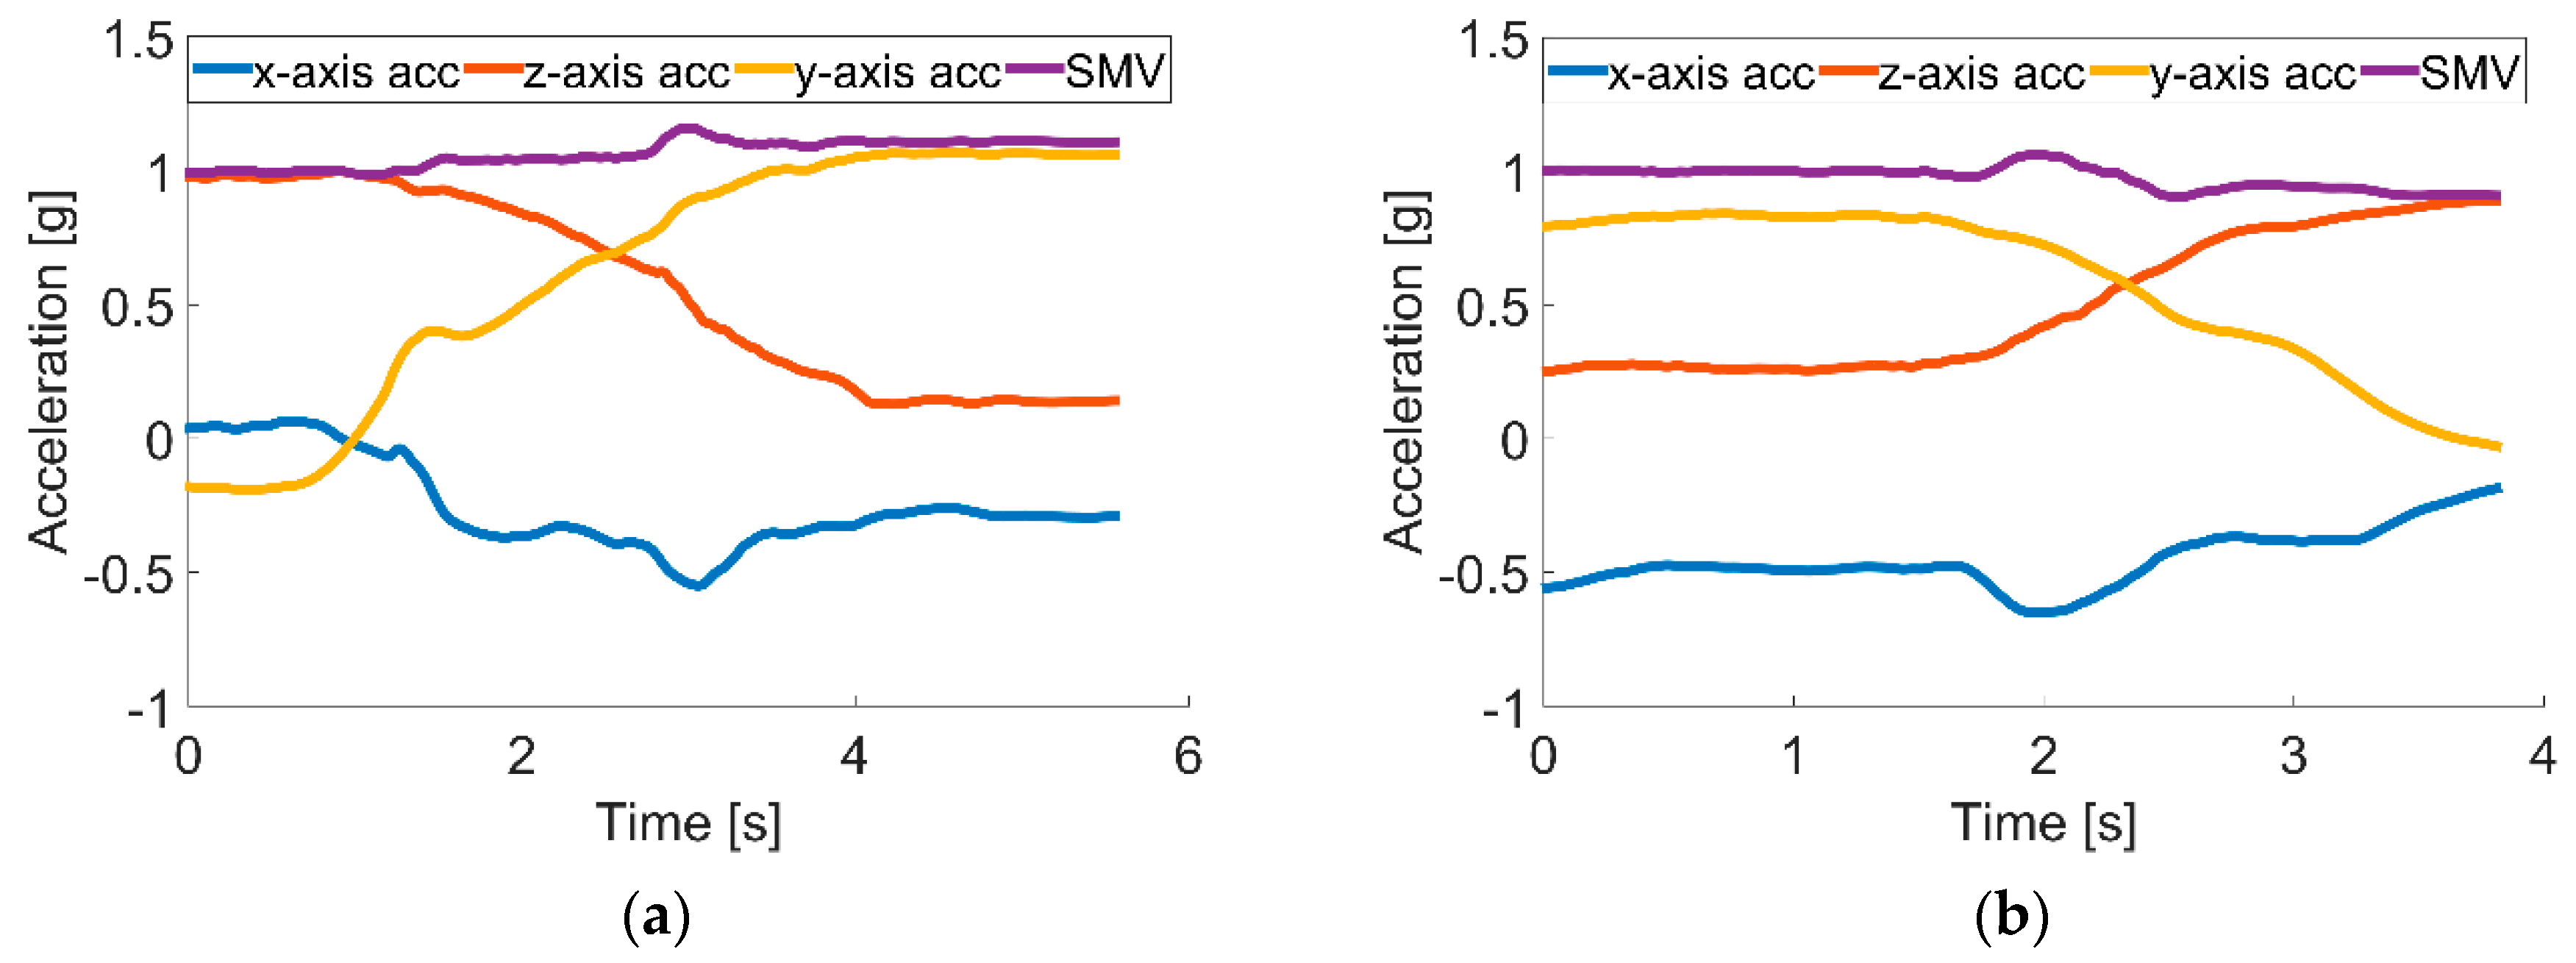
Figure 14 shows the SMV and accelerometer readings for the activities of lying down on a bed or sofa and getting up from them. During the activity of lying down shown in Figure 14a, the acceleration in the z-axis rapidly decreases, and the acceleration of the y-axis sharply increases, which is caused by an orientation change of the accelerometer and shifting of an axis, which is most influenced by the gravity force. During the activity of getting up presented in Figure 14b, the acceleration curves of the z- and y-axes behave conversely; the z-axis rapidly increases; and the acceleration of the y-axis sharply decreases. These phenomena allow one to distinguish between those two activities.

Figure 14.
Accelerations in the x-, y- and z-axes and SMV readings during activities: (a) lying down; (b) getting up.
To validate the proposed solution, volunteers performed different activities: they fell 350 times, laid down almost 200 times, stood over 200 times, sat 400 times down and performed 200 walks. Table 3 summaries the recognition accuracy reached for each activity.
Table 3.
Activity recognition accuracy.
The overall system activity detection and identification accuracy was 95.5%, while 2.5% of activities were recognized incorrectly, and 2.0% were not detected at all. The achieved accuracies do not differ from those reported in [27,30].
6.4.3. Behavior Classification
In general, we distinguish three classes of behaviors: normal, suspicious and dangerous. The behaviors identified as dangerous or suspicious require further dedicated actions. The behavior classification procedure starts with the establishing of pattern database of normal, suspicious and dangerous behaviors. Timeframes of the normal behavior are chosen based on the monitoring of three elderly people, two females and one male, during their daily activities for three days. Based on the observation data, the suspicious behavior timeframes are set between 101% and 150% of the timeframes of the normal ones, whereas the timeframes of dangerous behavior exceed the timeframes of normal and suspicious behaviors. However, some activities in an unusual time or place, e.g., standing on a bed, are considered as suspicious or dangerous situations, independently of their timeframes. The behavior classification training-database consists of more than 1200 situations coded as combinations of five variables: ToD, SoA, ZoA, FoA and DoA, similarly as in Table 4, which consists of examples of normal, suspicious and dangerous behaviors from the data gathered during monitoring tests of volunteers. These examples include the morning teeth brushing, sitting on the floor in the middle of the living room and too long standing in one place during the night.
Table 4.
Classification of exemplary behaviors.
The created training database was applied to six different machine learning techniques to establish patterns of normal, suspicious and dangerous behaviors. Using the behavior classification, training-database, the five-fold cross-validation method [42] was applied to evaluate and grade the machine learning techniques. The tested machine learning techniques are: the I and II decision trees, the I and II support vector machines and the I and II k-nearest neighbor classifiers. The I and II decision tree classifiers differ from each other with the maximum possible numbers of splits, which are 20 and 100, respectively. The I and II SVMs differ from each other with the kernel functions, which are linear and cubic, respectively. The difference between I and II KNNs is a distance metric, which is Euclidean and cosine, respectively.
Table 5 shows the percentage of overall classification validity and classification validity including normal, suspicious and dangerous behaviors for the tested machine learning techniques.
Table 5.
Classification validity of validated machine learning techniques.
The II decision tree along with I and II KNNs show the highest classification validity; therefore, they were applied for the optimization by tuning their parameters. However, the tuning of I and II KNN classifiers did not lead to improvement of their overall classification validity. Nevertheless, increasing the number of splits up to 140, in the II decision tree classifier, enhances the overall classification validity up to 99.1%. The further increasing of the number of splits did not increase the classification validity.
Table 6 shows the confusion matrix for the optimized decision tree with the maximum possible number of splits, up to 140. The behavior classification validity of normal is at a level of 99.1%, suspicious at a level of 98.4% and dangerous at a level of 99.5%. It is noteworthy that only 0.2% of tested dangerous behaviors were classified as normal, which can be treated as a critical mistake, and 0.3% of them were classified as suspicious, which is less critical since the suspicious behavior should be checked anyway. The classification validity of the proposed method can be justified as up to the mark.
Table 6.
Confusion matrix for the optimized decision tree.
For the final verification of the designed behavior classification method, the tuned decision tree was fed with 50 different behaviors with randomly-chosen timeframes. The test resulted with overall classification accuracy at a level of 100%, and all of the 25 normal, 7 suspicious and 18 dangerous behaviors were classified correctly.
7. Results Discussion
The system design process was conducted using the proposed DM, and based on validation results, the stakeholders and future users approved the solution and continued the project towards implementation and commercialization. The applied DM resulted in the system consisting of hardware and software components, shown in Table 1, suitable to realize required functionalities and fulfilling general constraints.
The presented system validation concerned the crucial requirements of stakeholders and future users such as a four room-zones level localization accuracy, fall detection, activity recognition and classification of normal, suspicious and dangerous situations.
The 1500-step test proved that the proposed step detection method, based on data gathered with the three-axial accelerometer and magnetometer, together with the signal magnitude vector and the pedestrian dead reckoning algorithm, shows a high robustness of 98%. The direction estimation test gave 1.33° of the mean uncertainty of the angular walking direction with a standard deviation of 1.15° and maximal error of 3°. Such high accuracy and sensitivity confirm the usefulness of the method for indoor location monitoring.
However, the further investigation indicated that small natural motions of the body during walking caused up to a 1-m error in the position estimation. Therefore, the 6° threshold filter was applied, which resulted in the reduction of uncertainty in position estimation by up to 40 cm.
For the walk test path consisting of five sections performed back and forth and repeated three times, the mean localization uncertainty was 33 cm with a standard deviation of 18 cm where the maximal localization error was 66 cm. The same test’s results indicated that for one round of the walk from the start to end points, the mean localization uncertainty was just 4 cm with a standard deviation of 2 cm. However, for a walk in reverse order, the mean value and standard deviation increased up to 40 cm and 12 cm, respectively. The detailed analysis of the test data resulted in the mean localization uncertainties for each round of 22 cm, 46 cm and 30 cm, with standard deviations of 20 cm, 12 cm and 11 cm for the first, second and third round, respectively. Moreover, average localization uncertainties for the forward direction are almost the same and equal about 21 cm, and the same uncertainty for the back direction is about double and equal to almost 40 cm. This means that the proposed localization algorithm has a small localization uncertainty, and the most distortive movements are turns. It seems that the turns are the cause of the increasing localization uncertainty. The test results verified that the designed method is sufficient for the four room-zone level accuracy requirement.
Analysis of test results of forward fall accelerations in the x-, y- and z-axes and SMV, showing the characteristic peaks concerning the beginning of the fall and the contact with the floor, was applied to define the signal thresholds used to recognize the fall. Moreover, the acceleration change in the z-axis, which the gravity force influences the most, indicating the lying position of the monitored person, is used for the fall confirmation. The performed tests proved that the designed method of fall detection is valid in 98% of cases.
The data gathered during standing and sitting activities indicated that the observed differences in accelerations in the x-, y- and z-axes and SMV are not sufficient to distinguish between these two activities. However, possible identification of getting up and sitting down activities can be used to recognize standing and sitting activities. The beginning of the getting up activity causes the acceleration in the z-axis; hence, SMV changes quickly, and at the end of the activity both acceleration in the z-axis and SMV gently stabilize. In turn, the start of the sitting down activity causes the mild change in acceleration in the z-axis, and at the end of the activity, both acceleration in the z-axis and SMV change quickly. Based on appropriate thresholds, the identification for both of these changes allows one to distinguish between those two activities. Similar analysis can be used to distinguish between lying down and rising activities. When lying down, due to an orientation change of the accelerometer causing a shift of the axis that the gravity force influences the most, the acceleration in the y-axis rapidly decreases, and acceleration of the z-axis sharply increases; while when rising, the acceleration curves of the y- and z-axes behave conversely; the y-axis rapidly increases; and acceleration of the z-axis sharply decreases. These phenomena are used to distinguish these two activities. The proposed activity recognition method was validated based on tests consisting of 350 falls, 200 lying down, 200 standing up, 400 sitting down and 200 walks, and the results are summarized in Table 3. The overall validity of the system activity recognition was 95.5%, where 2.5% of activities were recognized incorrectly and 2.0% not detected at all.
The activity categorization in class of behavior as normal, suspicious or dangerous is based on the analysis of five components: time of day, section of apartment, zone of activity, form of activity and duration of activity. The classification procedure is grounded on the comparison of current measures with the existing behavior database. The behavior database was created from regular three-day observation of three volunteers’ activities. From six evaluated machine learning techniques, the decision trees II, KNN I and KNN II showed the highest classification validity of 94.8%, 96.0% and 95.8%, respectively. The conducted optimization of the three best methods indicated that only the tuned decision trees II increased classification accuracy up to 99.1%. The confusion matrix for the tuned decision tree indicates that only 0.2% of the tested dangerous behaviors were classified as normal, which can be treated as a critical mistake, and 0.3% of them were classified as suspicious, which is less critical since the suspicious behavior should be verified anyway. The chosen behavior classification technique of highest validity was verified with a set of 25 normal, 7 suspicious and 18 dangerous behaviors of random timeframes, and as a result, 100% of them were classified correctly.
8. Conclusions and Future Work
Due to the lengthening of life expectancy, society is aging, and more and more people live to an older age. Therefore, it is highly important to assure life quality and safety. Existing and emerging technologies can provide tools that can support elderly people in their everyday life, making it easy and safe. This paper concerns the design methodology of such tools especially for indoor and outdoor localization, health monitoring, fall detection and behavior recognition and classification.
The authors propose the design methodology for the IoT-based home care information system intended for indoor and outdoor environment use. The presented DM approaches the home care problem not only from the designer’s perspective, but also considering the contracting authority’s and potential users’ requirements, which means that apart from the technical requirements, the design procedure considers the multifarious constraints, including the lifetime, energy issue, usage comfort and even the price.
The proposed DM was verified with a case study of real-life scenarios where there is a need for supporting elderly people, especially those of limited mobility living alone. The desire stated by the stakeholders and future users required the system for identifying people’s position and their vital signs, but also to be able to recognize basic activities, especially falls, and to classify them as normal, suspicious or dangerous.
The outcome of the conducted design procedure is the system based on IMU, with a built-in three-axis accelerometer, gyroscope, magnetometer and altimeter. It is also equipped with Wi-Fi, GPS and heart rate modules. For an in-apartment localization with four room-zone level resolution, the IMU with PDR algorithm is used. For in-building localization with floor level accuracy, the BarFi algorithm based on pressure and Wi-Fi fingerprints is proposed. For an outdoor localization with an accuracy of at least ten meters, the GPS module and PDR algorithm are applied. In order to detect activities of falling, lying, standing, sitting and walking, the IMU and thresholding algorithms are used. As a method for classifying activities as normal, suspicious or dangerous, the authors developed the six-element behavior vector and used it together with a decision tree algorithm.
The validation procedure performed for the most crucial requirements of the four room-zone level in apartment localization, fall detection, activity recognition and its classification as normal, suspicious and dangerous situations proves that the system works according to the required functionalities and constraints.
The future works concern the verification step, conducted together with the stakeholders and future users, of designed modules and algorithms for a multi-story building environment and nearby outdoor environments. Another future improvement of this system could be further recognition of specific activities like teeth brushing, cooking, watching TV or taking medication. Such information would be informative for caregivers whether the monitored person skipped a meal or forgot to take a medication. Moreover, it could be also included in the behavior vector and inform caregivers about behavior changes within a given period. The other improvement of the system may concern the usefulness of additional sensors for monitoring vital signs. The lifetime extension of the device by means of energy-saving algorithms and methods is another direction for future work.
Acknowledgments
The authors would like to express their thanks to Dariusz Gaszczyk and Robert Dega from the Blekinge Institute of Technology, Sweden, for their support while gathering data used in this research.
Author Contributions
Damian Dziak performed the experimental part, modelled, analyzed data and reported the results. Bartosz Jachimczyk contributed to the experimental part and result analysis. Wlodek J. Kulesza guided the whole research and supported the structure of the paper.
Conflicts of Interest
The authors declare no conflict of interest.
Abbreviations
The following abbreviations are used in this manuscript:
| BLE | Bluetooth Low Energy |
| BV | Behavior Vector |
| CoB | Class of Behavior |
| DM | Design Methodology |
| DoA | Duration of Activity |
| ECG | Electrocardiography |
| FoA | Form of Activity |
| GPS | Global Positioning System |
| IMU | Inertial Measurement Unit |
| IoT | Internet of Things |
| KNN | k-Nearest Neighbor |
| MEMS | Micro-Electro-Mechanical Systems |
| PDR | Pedestrian Dead Reckoning |
| RFID | Radio Frequency Identification |
| RSS | Received Signal Strength |
| SMV | Signal Magnitude Vector |
| SoA | Section of Apartment |
| SVM | Support Vector Machine |
| ToD | Time of Day |
| UWB | Ultra-Wide Band |
| WSN | Wireless Sensor Networks |
| ZoA | Zone of Activity |
References
- GHO (By Category). Life Expectancy (Data by Country). Available online: http://apps.who.int/gho/data/node.main.688 (accessed on 20 April 2017).
- Kontis, V.; Bennett, J.E.; Mathers, C.D.; Li, G.; Foreman, K.; Ezzati, M. Future life expectancy in 35 industrialised countries: Projections with a Bayesian model ensemble. Lancet 2017, 389, 1323–1335. [Google Scholar] [CrossRef]
- McKnight, A. Flexible design methodology management. In Proceedings of the IEE Colloquium on Design Management Environments in CAD, London, UK, 31–31 January 1991; pp. 1/1–1/6. [Google Scholar]
- Prasad, R.; Kobayashi, H. Multi-methodology design: An experimental comparison. In Proceedings of the IEEE International Verilog HDL Conference, Santa Clara, CA, USA, 26–28 February 1996; pp. 45–49. [Google Scholar]
- Mengel, S.A.; Adams, W.J.; Hagler, M.O. Using a hypertext instructional design methodology in engineering education. In Proceedings of the Frontiers in Education 1997 27th Annual Conference, Teaching and Learning in an Era of Change, Pittsburgh, PA, USA, 5–8 November 1997; pp. 648–652. [Google Scholar]
- Eskelinen, H. Improving the productivity of complex electronic systems design by utilizing applied design methodologies. IEEE Aerosp. Electron. Syst. Mag. 2001, 16, 26–28. [Google Scholar] [CrossRef]
- Wang, F.; Hannafin, M.J. Design-based research and technology-enhanced learning environments. Educ. Technol. Res. Dev. 2005, 53, 5–23. [Google Scholar] [CrossRef]
- Saini, A.; Yammiyavar, P. Weak eyesight therapy: A case study in designing an application for m-health systems. In Proceedings of the 2013 International Conference on Human Computer Interactions (ICHCI), Chennai, India, 23–24 August 2013; pp. 1–8. [Google Scholar]
- Ahmad, M. Designing for the Internet of Things: A paradigm shift in reliability. In Proceedings of the 2015 IEEE 65th Electronic Components and Technology Conference (ECTC), San Diego, CA, USA, 26–29 May 2015; pp. 1758–1766. [Google Scholar]
- Coetzee, L.; Eksteen, J. The Internet of Things—Promise for the future? An introduction. In Proceedings of the 2011 IST-Africa Conference Proceedings, Gaborone, Botswana, 11–13 May 2011; pp. 1–9. [Google Scholar]
- Ruffieux, D.; Contaldo, M.; Enz, C. MEMS-based all-digital frequency synthesis for ultralow-power radio for WBAN and WSN applications. In Proceedings of the 2011 IEEE International Symposium on Circuits and Systems (ISCAS), Rio de Janeiro, Brazil, 15–18 May 2011; pp. 157–160. [Google Scholar]
- Mainetti, L.; Patrono, L.; Vilei, A. Evolution of wireless sensor networks towards the Internet of Things: A survey. In Proceedings of the SoftCOM 2011, 19th International Conference on Software, Telecommunications and Computer Networks, Split, Croatia, 15–17 September 2011; pp. 1–6. [Google Scholar]
- Khalil, N.; Abid, M.R.; Benhaddou, D.; Gerndt, M. Wireless sensors networks for Internet of Things. In Proceedings of the 2014 IEEE Ninth International Conference on Intelligent Sensors, Sensor Networks and Information Processing (ISSNIP), Singapore, 21–24 April 2014; pp. 1–6. [Google Scholar]
- Rotariu, C.; Manta, V. Wireless system for remote monitoring of oxygen saturation and heart rate. In Proceedings of the 2012 Federated Conference on Computer Science and Information Systems (FedCSIS), Wroclaw, Poland, 9–12 September 2012; pp. 193–196. [Google Scholar]
- Chung, W.-Y.; Lee, S.-C.; Toh, S.-H. WSN based mobile u-healthcare system with ECG, blood pressure measurement function. In Proceedings of the 2008 30th Annual International Conference of the IEEE Engineering in Medicine and Biology Society, Vancouver, BC, Canada, 20–25 August 2008; pp. 1533–1536. [Google Scholar]
- Tan, S.-L.; Garcia-Guzman, J.; Villa-Lopez, F. A wireless body area network for pervasive health monitoring within smart environments. In Proceedings of the 2012 IEEE International Conference on Consumer Electronics (ICCE-Berlin), Berlin, Germany, 3–5 September 2012; pp. 47–51. [Google Scholar]
- Wannenburg, J.; Malekian, R. Body sensor network for mobile health monitoring, a diagnosis and anticipating system. IEEE Sens. J. 2015, 15, 6839–6852. [Google Scholar] [CrossRef]
- Shchekotov, M. Indoor localization methods based on Wi-Fi lateration and signal strength data collection. In Proceedings of the 2015 17th Conference of Open Innovations Association (FRUCT), Yaroslavl, Russia, 20–24 April 2015; pp. 186–191. [Google Scholar]
- Youn, J.H.; Ali, H.; Sharif, H.; Deogun, J.; Uher, J.; Hinrichs, S.H. WLAN-based real-time asset tracking system in healthcare environments. In Proceedings of the Third IEEE International Conference on Wireless and Mobile Computing, Networking and Communications (WiMob 2007), White Plains, NY, USA, 8–10 October 2007; p. 71. [Google Scholar]
- Chen, W.H.; Chang, H.H.; Lin, T.H.; Chen, L.K.; Hwang, S.J.; Yen, D.H.J.; Yuan, H.S.; Chu, W.C. Dynamic indoor localization based on active RFID for healthcare applications: A shape constraint approach. In Proceedings of the 2009 2nd International Conference on Biomedical Engineering and Informatics, Tianjin, China, 17–19 October 2009; pp. 1–5. [Google Scholar]
- Palumbo, F.; Barsocchi, P.; Chessa, S.; Augusto, J.C. A stigmergic approach to indoor localization using Bluetooth Low Energy beacons. In Proceedings of the 2015 12th IEEE International Conference on Advanced Video and Signal Based Surveillance (AVSS), Karlsruhe, Germany, 25–28 August 2015; pp. 1–6. [Google Scholar]
- Wyffels, J.; Brabanter, J.D.; Crombez, P.; Verhoeve, P.; Nauwelaers, B.; Strycker, L.D. Distributed, signal strength-based indoor localization algorithm for use in healthcare environments. IEEE J. Biomed. Health Inform. 2014, 18, 1887–1893. [Google Scholar] [CrossRef] [PubMed]
- Redondi, A.; Tagliasacchi, M.; Cesana, M.; Borsani, L.; Tarrío, P.; Salice, F. LAURA—LocAlization and Ubiquitous monitoRing of pAtients for health care support. In Proceedings of the 2010 IEEE 21st International Symposium on Personal, Indoor and Mobile Radio Communications Workshops (PIMRC Workshops), Istanbul, Turkey, 26–30 September 2010; pp. 218–222. [Google Scholar]
- Jachimczyk, B.; Dziak, D.; Kulesza, W.J. RFID-hybrid scene analysis-neural network system for 3D indoor positioning optimal system arrangement approach. In Proceedings of the 2014 IEEE International Instrumentation and Measurement Technology Conference (I2MTC) Proceedings, Montevideo, Uruguay, 12–15 May 2014; pp. 191–196. [Google Scholar]
- Shen, X.; Chen, Y.; Zhang, J.; Wang, L.; Dai, G.; He, T. BarFi: Barometer-aided Wi-Fi floor localization using crowdsourcing. In Proceedings of the 2015 IEEE 12th International Conference on Mobile Ad Hoc and Sensor Systems (MASS), Dallas, TX, USA, 19–22 October 2015; pp. 416–424. [Google Scholar]
- Kang, W.; Han, Y. SmartPDR: Smartphone-based pedestrian dead reckoning for indoor localization. IEEE Sens. J. 2015, 15, 2906–2916. [Google Scholar] [CrossRef]
- Gjoreski, H.; Lustrek, M.; Gams, M. Accelerometer placement for posture recognition and fall detection. In Proceedings of the 2011 7th International Conference on Intelligent Environments (IE), Dallas, TX, USA, 19–22 October 2011; pp. 47–54. [Google Scholar]
- Liu, X.Q.; Cai, W.M. The alarm system of elder tumble at the geracomium based on ZigBee. In Proceedings of the 2011 International Conference on Electronics and Optoelectronics (ICEOE), Dalian, China, 29–31 July 2011; pp. 38–40. [Google Scholar]
- Wang, L.; Gu, T.; Chen, H.; Tao, X.; Lu, J. Real-time activity recognition in wireless body sensor networks: From simple gestures to complex activities. In Proceedings of the 2010 IEEE 16th International Conference on Embedded and Real-Time Computing Systems and Applications (RTCSA), Macau, China, 23–25 August 2010; pp. 43–52. [Google Scholar]
- Martin, H.; Iglesias, J.; Cano, J.; Bernardos, A.M.; Casar, J.R. Towards a fuzzy-based multi-classifier selection module for activity recognition applications. In Proceedings of the 2012 IEEE International Conference on Pervasive Computing and Communications Workshops (PERCOM Workshops), Lugano, Switzerland, 19–23 March 2012; pp. 871–876. [Google Scholar]
- Aranki, D.; Kurillo, G.; Yan, P.; Liebovitz, D.M.; Bajcsy, R. Real-time tele-monitoring of patients with chronic heart-failure using a smartphone: Lessons learned. IEEE Trans. Affect. Comput. 2016, 7, 206–219. [Google Scholar] [CrossRef]
- Wu, C.; Yang, Z.; Xu, Y.; Zhao, Y.; Liu, Y. Human mobility enhances global positioning accuracy for mobile phone localization. IEEE Trans. Parallel Distrib. Syst. 2015, 26, 131–141. [Google Scholar] [CrossRef]
- Sun, L.; Zhang, D.; Li, B.; Guo, B.; Li, S. Activity recognition on an accelerometer embedded mobile phone with varying positions and orientations. In Ubiquitous Intelligence and Computing; Springer: Berlin, Germany, 2010; pp. 548–562. [Google Scholar]
- Millner, H.; Ebelt, R.; Hoffmann, G.; Vossiek, M. Wireless 3D localization of animals for trait and behavior analysis in indoor and outdoor areas. In Proceedings of the IEEE MTT-S International Microwave Workshop on Wireless Sensing, Local Positioning, and RFID, Cavtat, Croatia, 24–25 September 2009; pp. 1–4. [Google Scholar]
- Gonzalez, J.; Blanco, J.L.; Galindo, C.; Ortiz-de-Galisteo, A.; Fernandez-Madrigal, J.A.; Moreno, F.A.; Martinez, J.L. Combination of UWB and GPS for indoor-outdoor vehicle localization. In Proceedings of the 2007 IEEE International Symposium on Intelligent Signal Processing, Alcala de Henares, Spain, 3–5 October 2007; pp. 1–6. [Google Scholar]
- Kuo, W.H.; Chen, Y.S.; Jen, G.T.; Lu, T.W. An intelligent positioning approach: RSSI-based indoor and outdoor localization scheme in Zigbee networks. In Proceedings of the 2010 International Conference on Machine Learning and Cybernetics, Qingdao, China, 11–14 July 2010; pp. 2754–2759. [Google Scholar]
- The ZigBee Alliance. Control Your World. Available online: http://www.zigbee.org/ (accessed on 6 June 2017).
- Tabish, R.; Ghaleb, A.M.; Hussein, R.; Touati, F.; Mnaouer, A.B.; Khriji, L.; Rasid, M.F.A. A 3G/WiFi-enabled 6LoWPAN-based U-healthcare system for ubiquitous real-time monitoring and data logging. In Proceedings of the 2nd Middle East Conference on Biomedical Engineering, Doha, Qatar, 17–20 February 2014; pp. 277–280. [Google Scholar]
- Fielden, G.D.R. Engineering Design; HANSARD: London, UK, 1975. [Google Scholar]
- Banzi, M. Getting Started with Arduino, 3rd ed.; O’Reilly Media: Sebastopol, CA, USA, 2008. [Google Scholar]
- Dziak, D.; Jachimczyk, B.; Kulesza, W.J. Wirelessly interfacing objects and subjects of healthcare system—IoT approach. Elektronika ir Elektrotechnika 2016, 22, 66–73. [Google Scholar] [CrossRef]
- Refaeilzadeh, P.; Tang, L.; Liu, H. Cross-validation. In Encyclopedia of Database Systems; Liu, L., Özsu, M.T., Eds.; Springer: New York, NY, USA, 2009; pp. 532–538. [Google Scholar]


© 2017 by the authors. Licensee MDPI, Basel, Switzerland. This article is an open access article distributed under the terms and conditions of the Creative Commons Attribution (CC BY) license (http://creativecommons.org/licenses/by/4.0/).