Abstract
The aim of the presented study was to compare changes in acid-base balance during high-intensity exercise preceded and not preceded by a warm-up that ended with breathing using additional respiratory dead space volume (ARDSv). The study involved 24 cyclists. Each participant completed two 3 min exercise tests performed at 110% of maximal power from a graded exercise test. A standardized warm-up preceded each 3 min test. Between the warm-up and the test was an 8 min passive rest, during which, in one test, participants breathed using ARDSv increased by 1000 mL, in the second test, ARDSv was not used. After the warm-up and after the 3 min test, a sample of arterialized blood was taken to measure changes in hydrogen ion concentration (ΔH+), lactate (ΔLa−), blood gas parameters, and morphological parameters, and changes in plasma volume (ΔPV) were calculated. Additionally, after the 3 min tests, the rating of perceived exertion (RPE) was assessed. It was demonstrated that ΔH+ (20.4 ± 6.3 and 17.5 ± 6.3, respectively; p = 0.016) and ΔPV (−8.25 ± 4.81 and −4.86 ± 5.58, respectively; p = 0.029) were greater in the test not preceded by breathing restrictions compared with the test preceded by breathing using ARDSv. Simultaneously, no significant differences in ΔH+ were found between tests when post-exercise values were corrected for changes in plasma volume. Furthermore, lower RPE was observed after ARDSv use (Z = 1.97, p = 0.048). Breathing using ARDSv between a warm-up and a high-intensity 3 min exercise induces mild respiratory acidosis, limits the exercise-induced increase in H+ concentration and changes in plasma volume, while affecting lower RPE.
1. Introduction
Performance in endurance sports disciplines is primarily associated with the body’s ability to generate large amounts of energy through aerobic metabolism [1]. A warm-up is a means of increasing the rate of aerobic energy production during the initial phase of high-intensity exercise [2]. During a warm-up, vasodilation of capillary vessels occurs, which is one of the factors that enable increased oxygen availability in the muscles [3]. Vasodilation results from the action of metabolites (including nitric oxide, carbon dioxide, adenosine, hydrogen ions, and potassium) and reduced sympathetic nervous system influence on vascular tone [4,5,6]. As a result of the widening of capillary vessel lumens, oxygen transport to the muscles becomes facilitated, ultimately increasing the rate of oxygen-dependent energy production [7]. For this reason, a warm-up should precede efforts in which high intensity is expected immediately after the exercise starts [8]. After cessation of exercise, vasodilation persists partly due to activation of histamine receptors stimulated by nitric oxide and histamine [9,10], a phenomenon described by Dawson et al. [11] as supranormalization. However, the extent of vasodilation after exercise is smaller compared with that during exercise, partly due to a reduced rate of metabolite production after cessation of physical effort [12]. Therefore, if athletes end their warm-up several minutes before a race, the warm-up effect may diminish. In individual time trials in cycling, mountain biking, or mass-start cross-country skiing, athletes may be positioned at the start line and presented on television for several minutes. During this period, their physical activity is minimal, which may reduce vasodilation before the race begins.
In a previous article [13], the hypothesis that using additional respiratory dead space volume (ARDSv), augmented by 1000 mL, could slow the decline of the warm-up effect during the rest period preceding high-intensity exercise was examined. It was shown that oxygen uptake during the exercise test was higher when participants breathed through ARDSv for 7 min after the warm-up, compared with the procedure without breathing modification [13]. This may have resulted from reduced withdrawal of the vasodilatory effect after the warm-up, due to inhalation of carbon dioxide lingering in the ARDSv after preceding breaths. Inhalation of air with increased carbon dioxide leads to elevated partial pressure of carbon dioxide in the blood [14]. Carbon dioxide exerts a vasodilatory effect on capillary vessels [4] because a decrease in pH opens potassium channels and relaxes smooth muscle around these vessels [15]. On the one hand, this effect could have resulted in greater oxygen uptake during high-intensity exercise by increasing blood flow through muscle capillaries [13]. On the other hand, breathing through ARDSv leads to respiratory acidosis [14]. Disturbances in acid-base balance negatively affect the ability to exercise [16]. However, mild disturbances in acid-base balance following a warm-up are not considered a limiting factor in exercise performance because compensatory mechanisms develop simultaneously, such as increased muscle blood flow, which helps reduce the magnitude of oxygen deficit [17]. For example, in a study by Robergs et al. [18], blood hydrogen ion concentration increased to about 46 nmol·L−1 after a warm-up. In the same study, the increase in hydrogen ions and lactate during high-intensity exercise was smaller in participants who had completed a warm-up compared with those who had not.
Based on the available literature and previous studies, it was hypothesized that preceding high-intensity exercise with breathing through ARDSv would induce a mild disturbance in acid-base balance. Importantly, in contrast to the use of ARDSv during exercise, post-warm-up breathing modification does not interfere with movement mechanics or increase respiratory load during performance itself, while potentially preserving favorable vascular and metabolic conditions established by the warm-up. This transition phase is particularly relevant in competitive settings, where athletes often experience several minutes of passive rest between warm-up completion and race start (e.g., positioning at the start line, staging procedures, media presentation), during which the beneficial effects of warm-up on muscle perfusion and oxygen delivery may progressively diminish. From a practical perspective, even small physiological advantages achieved at exercise onset may translate into meaningful performance benefits in elite sport, where outcomes are frequently determined by marginal gains. Such marginal physiological gains may be particularly relevant in disciplines where performance differences are measured in fractions of seconds.
The aim of the present study was to assess disturbances in blood acid-base balance after high-intensity exercise preceded and not preceded by breathing through ARDSv.
2. Materials and Methods
2.1. Participants
The presented study involved 24 trained young cyclists aged 18–22 years. The participants were characterized by a mean body mass of 69.2 ± 7.1 kg and a body height of 1.78 ± 0.06 m. Their aerobic performance level was reflected by a mean VO2max of 58.9 ± 5.5 mL·kg−1·min−1. The maximal power output achieved during the graded exercise test was 357.2 ± 42.8 W, corresponding to 5.18 ± 0.57 W·kg−1, indicating a high training status. The athletic level of the participants was assessed as 3 on the five-point scale by De Pauw et al. [19]. Using G-Power software (version 3.1.9.2; Kiel University, Kiel, Germany), it was calculated that a minimum of 19 participants was required to detect moderate statistical effects. More than 19 individuals were recruited to meet statistical assumptions in the event of exclusions or participant withdrawal. Each participant could be excluded from the exercise tests based on preliminary screening results, which included measurements of arterial blood pressure and blood morphology. Individuals were excluded if, within the 10 days preceding the study, they had experienced an infection, had diastolic blood pressure exceeding 90 mmHg, or had haematocrit levels exceeding 50%. Additionally, each participant was required to have at least 3 years of cycling experience, train a minimum of 450 h per year, and have experience performing a graded exercise test (GXT) (at least 2 tests annually, including one within 2 months before participation in the experiment).
All participants were informed about the study procedure and provided written informed consent to participate. The study was conducted in accordance with the Declaration of Helsinki, and approval was obtained from the Institutional Ethics Committee for Scientific Research.
2.2. Experimental Procedure
During the 48 h preceding the first laboratory test, participants refrained from performing intense exercise lasting more than 60 min at intensities exceeding the power at the first ventilatory threshold (measured during assessments preceding the experiment). Before the exercise tests, preliminary screening was performed: arterial blood pressure was measured using an Omron device (Omron Healthcare, Hoofddorp, The Netherlands), and blood morphology parameters were assessed using an ABX Micros OT 16 analyser (Horiba ABX SAS, Grabels, France). Admission to the exercise tests was based on the results of these assessments. Each participant who qualified for the exercise tests was required to have medical clearance for performing high-intensity exercise issued by a sports medicine physician. Anthropometric parameters, body mass and height, were also measured during the preliminary assessment. Exercise tests were performed on a Lode Excalibur Sport cycle ergometer (Lode BV, Groningen, The Netherlands). A graded exercise test and the verification stage for maximal oxygen uptake were performed first. At 48 and 72 h after completing a graded exercise test, 3 min exercise tests with constant load were carried out. A randomized crossover study design was applied to determine the order of the ARDSv and non-ARDSv conditions. Participants were tested in weekly blocks of four individuals. Balanced randomization (equal number of participants starting with each condition) was used to minimize potential order effects. Specifically, two participants performed the 3 min test with ARDSv first, and two participants performed the non-ARDSv test first. The second 3 min test was conducted in the opposite condition to complete the crossover. The 48–72 h interval between the two 3 min tests was used as a washout period to minimize potential carry-over effects. A schematic of the study design is presented in Figure 1.
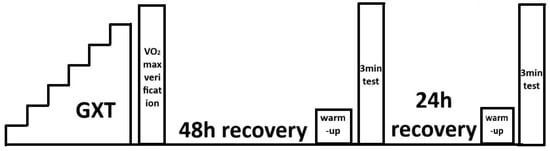
Figure 1.
Schematic representation of the exercise testing procedures [13].
2.3. Graded Exercise Test with Verification Phase
The test began at a workload of 40 W, which was increased by 40 W every 3 min. The test was terminated when participants failed to maintain a cadence above 60 rpm or voluntarily stopped the exercise. Maximal power output (Pmax) was determined as the workload of the final completed stage minus 0.22 W for each second missing to complete that stage [20]. After a graded exercise test, a 10 min active recovery period followed, during which participants cycled at 20 W. Then, the workload was increased to 110% of Pmax to verify maximal oxygen uptake. Participants were instructed to continue cycling at this intensity for as long as possible. The verification phase ended when cadence dropped below 60 rpm or when the participant refused to continue [21]. During these tests, oxygen uptake (VO2), carbon dioxide output (VCO2), minute pulmonary ventilation (VE), end-tidal oxygen pressure (PETO2), and end-tidal carbon dioxide pressure (PETCO2) were measured using a Quark ergospirometer (Cosmed, Rome, Italy). Values were averaged over 30-s intervals, and the highest recorded VO2 was considered maximal oxygen uptake (VO2max). Two qualified evaluators determined the power output at the first ventilatory threshold (VT1), based on the nonlinear increase in VE/VO2 and PETO2, and at the second ventilatory threshold (VT2), based on the nonlinear increase in VE/VCO2 and decrease in PETCO2 [22]. If their assessments differed, thresholds were established based on a third evaluator’s judgment.
2.4. Three-Minute Non-ARDSv Test
The test was preceded by a 15 min warm-up: participants cycled for 5 min at power corresponding to VT1, followed by 10 min at power determined as Power = (VT1 + VT2)/2. After the warm-up, an 8 min passive rest period followed. Participants then performed a 3 min cycling test at 110% Pmax. Immediately before the test and at the third minute after completing it, arterialized capillary blood samples were collected from the fingertip. Using a Siemens Rapidlab 348 analyser (Siemens Healthcare, Erlangen, Germany), blood gas parameters were assessed. Measurements taken after the warm-up but before the 3 min non-ARDSv test were marked using the subscript “w”, and those taken post-3 min non-ARDSv test using the subscript “e”. Measurements included the negative logarithm of hydrogen ion concentration (pHw and pHe), bicarbonate ion activity (HCO3−actw and HCO3−acte), bicarbonate concentration standardized to reference conditions (HCO3−stdw and HCO3−stde), partial pressure of oxygen (pO2w and pO2e), partial pressure of carbon dioxide (pCO2w and pCO2e), buffering base excess/deficit (BEw and BEe), and oxygen saturation (O2satw and O2sate). Lactate concentration (La−w and La−e) was measured using a Lange LP 400 photometer (Dr Lange, Berlin, Germany). Blood morphology parameters, haematocrit (HCTw and HCTe), red blood cell count (RBCw and RBCe), haemoglobin concentration (HGBw and HGBe), and white blood cell count (WBCw and WBCe) were measured using the ABX Micros OT 16 analyser. Before the warm-up and after completing the 3 min non-ARDSv test, respiratory muscle strength was assessed using a MicroRPM device (CareFusion, Yorba Linda, CA, USA). Maximal inspiratory pressure (MIPw and MIPe) and maximal expiratory pressure (MEPw and MEPe) were measured. Immediately after the 3 min non-ARDSv test, the rating of perceived exertion (RPE) was assessed using the Borg scale [23,24].
2.5. Three-Minute ARDSv Test
The procedure used in the 3 min ARDSv test was similar to that applied in the 3 min non-ARDSv test. The only difference was the use of breathing through the ARDSv during the 8 min passive rest period between the warm-up and the test. The ARDSv volume was 1000 mL, created by connecting a mask and a tube with a diameter of 2.8 cm [13,25]. Participants put on the ARDSv device immediately after completing the warm-up and removed it 50 s before beginning the 3 min exercise test at 110% Pmax (the time required to prepare for ergospirometric measurements).
2.6. Calculations
Hydrogen ion concentrations (H+w and H+e) were calculated based on the formula: pH = −log10[H+].
Changes in blood plasma volume (∆PV) resulting from the 3 min non-ARDSv test (ΔPVnon-ARDSv) and the 3 min ARDSv test (ΔPVARDSv) were calculated using the Dill and Costill [26] equation:
where
HGBw—haemoglobin concentration in the blood before the 3 min test,
HGBe—haemoglobin concentration in the blood after the 3 min test,
HCTe—haematocrit after the 3 min test,
HCTw—haematocrit before the 3 min test.
Subsequently, the post-test lactate and hydrogen ion measurements obtained after the 3 min non-ARDSv test (La−e(ΔPV)non-ARDSv, H+e(ΔPV)non-ARDSv) and after the 3 min ARDSv test (La−e(ΔPV)ARDSv, H+e(ΔPV)ARDSv) were corrected for changes in blood plasma volume.
The difference between hydrogen ion concentrations (ΔH+non-ARDSv and ΔH+(ΔPV)non-ARDSv) and lactate concentrations (ΔLa−non-ARDSv and ΔLa−(ΔPV)non-ARDSv) measured after and before the 3 min non-ARDSv test was also calculated, as well as the difference between hydrogen ion concentrations (ΔH+ARDSv and ΔH+(ΔPV)-ARDSv) and lactate concentrations (ΔLa−ARDSv and ΔLa−(ΔPV)ARDSv) measured after and before the 3 min ARDSv test. Analogous differences were calculated for blood morphological parameters in the 3 min non-ARDSv test (ΔWBCnon-ARDSv, ΔRBCnon-ARDSv, ΔHGBnon-ARDSv, ΔHCTnon-ARDSv) and in the 3 min ARDSv test (ΔWBCARDSv, ΔRBCARDSv, ΔHGBARDSv, ΔHCTARDSv).
2.7. Statistical Analysis
The Shapiro–Wilk test was used to compare the distribution of the analysed variables with the normal distribution. When the dependent variables demonstrated a distribution similar to the normal distribution, one-way repeated measures ANOVA and the Scheffé post hoc test were applied. When variables differed significantly from the normal distribution, the Friedman ANOVA was used. In such cases, the Wilcoxon paired test served as the post hoc procedure. To compare differences (e.g., comparison of ΔHCTnon-ARDSv with ΔHCTARDSv), a Student’s t-test was applied, and Cohen’s D effect size was calculated. Pearson’s analysis was used to calculate the strength of correlation. In all statistical analyses, the level of statistical significance was set at p < 0.05.
3. Results
The present study demonstrated that pHw-non-ARDSv, H+w-non-ARDSv, HCO3−actw-non-ARDSv, HCO3−stdw-non-ARDSv, BEw-non-ARDSv, O2satw-non-ARDSv, La−w-non-ARDSv, pO2w-ARDSv, La−w-ARDSv, pCO2e-ARDSv, pO2e-ARDSv, O2sate-ARDSv, La−e-ARDSv, La−e(ΔPV)-ARDSv, MIPe-non-ARDSv, MEPw-ARDSv, MEPe-ARDSv, RPEnon-ARDSv, and RPEARDSv differed significantly from the normal distribution.
3.1. Main Results
In the presented study, statistically significant lower blood pH, higher H+ ion concentration, and higher pCO2 were observed after the warm-up followed by ARDSv breathing compared to the warm-up followed by non-ARDSv breathing. Statistically significant higher pO2 and higher O2sat were observed after the 3 min ARDSv test compared to the 3 min non-ARDSv test (Table 1).

Table 1.
Blood gas parameters and biochemical parameters measured in cyclists in the non-ARDSv test and the ARDSv test.
A detailed description of the above observations is as follows: using the Friedman analysis, a statistically significant effect of repeated measurements was demonstrated for all measured blood gas parameters and biochemical parameters: pH (χ2 = 60.5; W = 0.84; p = 0.000), H+ (χ2 = 60.5; W = 0.84; p = 0.000), pCO2 (χ2 = 60.4; W = 0.84; p = 0.000), pO2 (χ2 = 55.0; W = 0.76; p = 0.000), HCO3−act (χ2 = 57.9; W = 0.80; p = 0.000), HCO3−std (χ2 = 57.4; W = 0.80; p = 0.000), BE (χ2 = 58.2; W = 0.81; p = 0.000), O2sat (χ2 = 29.0; W = 0.40; p = 0.000), La− (χ2 = 58.3; W = 0.81; p = 0.000). Using the Wilcoxon post hoc test, statistically significant differences were demonstrated between pHw-non-ARDSv and pHw-ARDSv (Z = 2.47, p = 0.013), H+w-non-ARDSv and H+w-ARDSv (Z = 2.49, p = 0.013), pCO2w-non-ARDSv and pCO2w-ARDSv (Z = 2.87, p = 0.004), pO2e-non-ARDSv and pO2e-ARDSv (Z = 2.50, p = 0.012), and O2sate-non-ARDSv and O2sate-ARDSv (Z = 3.02, p = 0.002) (Table 1).
After correcting the biochemical parameters measured after the 3 min ARDSv and non-ARDSv test for changes in plasma volume, a statistically significant repeated measures effect was found for H+ (χ2 = 60.5; W = 0.84; p = 0.000) and La− (χ2 = 58.6; W = 0.81; p = 0.000). No statistically significant differences were observed for H+ₑ(ΔPV)-non-ARDSv and H+ₑ(ΔPV)-ARDSv, nor for La−ₑ(ΔPV)-non-ARDSv and La−ₑ(ΔPV)-ARDSv (Table 2).
Table 2.
Post-exercise hydrogen ion and lactate ion concentrations corrected for changes in plasma volume in cyclists during the non-ARDSv test and the ARDSv test.
In the presented study, statistically significant smaller ΔH+, smaller ΔPV, and lower RPE were observed after the 3 min ARDSv test compared to the 3 min non-ARDSv test (Table 3).
Table 3.
Changes in hydrogen ion and lactate ion concentrations, changes in plasma volume, and rating of perceived exertion in cyclists following the non-ARDSv and ARDSv tests.
A detailed description of the above observations is as follows: using the Student’s t-test, statistically significant differences were found between ΔH+non-ARDSv and ΔH+ARDSv (t = 2.61, p = 0.016), and ΔPVnon-ARDSv and ΔPVARDSv (t = −2.33, p = 0.029). Using the paired Wilcoxon test, statistically significant differences were found between RPEnon-ARDSv and RPEARDSv (Z = 1.97, p = 0.048) (Table 3).
3.2. Details Results
In the presented study, statistically significant smaller ΔRBC, ΔHGB, and ΔHCT were observed after the 3 min ARDSv test compared to the 3 min non-ARDSv test (Table 4).
Table 4.
Blood morphology parameters and respiratory muscle strength parameters in cyclists during the non-ARDSv test and the ARDSv test.
A detailed description of the above observations is as follows: analysis of variance revealed a statistically significant repeated measures effect for WBC (F = 149.90, p = 0.000, ƞ2 = 0.867), RBC (F = 19.41, p = 0.000, ƞ2 = 0.458), HGB (F = 22.57, p = 0.000, ƞ2 = 0.495), and HCT (F = 17.54, p = 0.000, ƞ2 = 0.433). Post hoc analysis showed that statistically significant differences occurred between post-exercise and baseline measurements in both the ARDSv and non-ARDSv tests. No statistically significant differences were found when comparing post-exercise blood morphology parameters between the ARDSv and non-ARDSv test (Table 4).
Using the Friedman ANOVA, no statistically significant repeated measures effects were found for MIP (χ2 = 0.63; W = 0.01; p = 0.890) or MEP (χ2 = 4.23; W = 0.06; p = 0.238) (Table 4).
Using the Student’s t-test, statistically significant differences were found between ΔRBCnon-ARDSv and ΔRBCARDSv (t = 2.73, p = 0.012), ΔHGBnon-ARDSv and ΔHGBARDSv (t = 2.10, p = 0.047), and ΔHCTnon-ARDSv and ΔHCTARDSv (t = 2.34, p = 0.028) (Table 4).
Pearson correlation analysis showed that H+w-ARDSv was significantly correlated with ΔRBCARDSv (r = 0.41, p < 0.05), and ΔH+ARDSv was significantly correlated with ΔPVARDSv (r = 0.42, p < 0.05), ΔRBCARDSv (r = 0.47, p < 0.05), and ΔHGBARDSv (r = 0.50, p < 0.05). Furthermore, ΔLa−ARDSv was significantly correlated with ΔPVARDSv (r = −0.54, p < 0.05), ΔRBCARDSv (r = 0.51, p < 0.05), ΔHGBARDSv (r = 0.51, p < 0.05), and ΔHCTARDSv (r = 0.51, p < 0.05) (Figure 2).
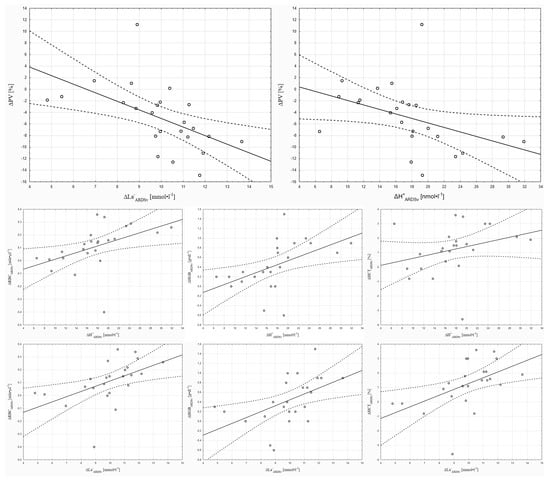
Figure 2.
Correlations of selected parameters with changes in hydrogen ion and lactate ion concentrations in the 3 min ARDSv test.
4. Discussion
The present study demonstrated that cyclists who breathed through ARDSv after the warm-up began the intensive 3 min test with a higher hydrogen ion concentration compared with cyclists who did not use any modification of breathing. This effect was expected and confirms earlier observations [14]. However, the degree of acid-base imbalance resulting from breathing through ARDSv was small. This is indicated by the arterialized blood pH value, which, before the start of the intensive 3 min test, was approximately 7.36. This value was close to the blood pH reported by other authors after a warm-up [18,27]. In the study by Chiron et al. [27], conducted on members of the French national track and field team before a 400 m race, blood pH values ranged from 7.30 to 7.33. In the study by Robergs et al. [18], blood pH before a swimming sprint reached about 7.34. A mild acidosis during exercise may be conducive to aerobic muscle energetics, as lower pH shifts the oxyhaemoglobin dissociation curve to the right in accordance with the Bohr effect. Under such conditions, oxygen dissociates more efficiently from haemoglobin into the tissues [28]. Moreover, in the present study, the 3 min ARDSv test showed higher pCO2 compared with the 3 min non-ARDSv test. It is well known that carbon dioxide promotes vasodilation and increases blood flow in capillary vessels [4], as well as supporting the Bohr effect [28]. These mechanisms may have contributed to achieving a higher oxygen uptake during the short, intensive 3 min test performed after breathing through ARDSv in the break between the warm-up and the intensive exercise test [13]. Achieving higher oxygen uptake during intensive exercise was one of the goals of conducting a warm-up [29,30]. Due to the enhancement of aerobic metabolism following a warm-up, the oxygen deficit and the intensity of anaerobic metabolism may be reduced [23]. When anaerobic metabolic intensity is lower, lactate production decreases, which slows the rate of blood and muscle pH decline [31,32]. In the present study, data corrected for exercise-induced changes in plasma volume indicated that the smaller ΔH+ARDSv compared with ΔH+non-ARDSv could not only be an effect of reduced H+ production but could also be the result of smaller changes in blood plasma volume during the 3 min exercise test.
The hydrogen ion impairs skeletal muscle contraction by inhibiting ATPase activity [33] and reducing the affinity of troponin C for calcium [34]. These mechanisms are considered important contributors to the decline in muscle power during exercise [33]. Therefore, the lower concentration of hydrogen ions during intensive effort following breathing through ARDSv may have contributed to greater work output in the exercise tests. This hypothesis was supported by the lower RPEARDSv compared with RPEnon-ARDSv.
During intensive exercise, blood pressure in the capillaries increases in response to the rise in metabolite concentration in the muscles and the increased oxygen demand of the muscles [12]. According to Starling’s principle, this leads to increased filtration of fluid from the capillaries into the interstitial space [35]. As a result of fluid shifts, the concentration of blood morphotic elements increases [36,37]. The present study showed that ΔPVARDSv, ΔRBCARDSv, ΔHGBARDSv, and ΔHCTARDSv were significantly smaller than ΔPVnon-ARDSv, ΔRBCnon-ARDSv, ΔHGBnon-ARDSv, and ΔHCTnon-ARDSv, respectively, suggesting attenuated capillary filtration following the 3 min ARDSv test.
A possible cause of these findings was greater engagement of the respiratory muscles during breathing through ARDSv. Higher minute pulmonary ventilation and greater respiratory muscle work during breathing through ARDSv may have resulted from stimulation of cardiovascular chemoreceptors by hypercapnia [25,38]. Potentially, blood may have been redistributed from the blood vessels of the limb muscles to the blood vessels of the respiratory muscles, similar to the mechanisms examined by Dominelli et al. [39]. Blood redistribution could reduce the hydrostatic pressure of the blood in the muscles, which may limit capillary fluid filtration [40]. However, these mechanisms cannot be directly confirmed within the present study, as pulmonary ventilation and respiratory muscle activity were not assessed. Accordingly, this interpretation should be regarded as a hypothesis requiring verification in future investigations incorporating direct measurements of ventilatory parameters and respiratory muscle function during breathing through ARDSv. Nevertheless, previously published results [13] showed higher oxygen uptake during the ARDSv condition compared with non-ARDSv, despite similar pulmonary ventilation, tidal volume, and respiratory rate. These findings are consistent with evidence that added respiratory dead space induces controlled hypercapnia and graded ventilatory responses. Zatoń and Smołka [41] demonstrated that progressive dead space (up to 1600 cm3) enlargement increases ventilation (primarily via tidal volume) and elevates arterial pCO2 while lowering blood pH, without inducing hypoxemia or enhancing anaerobic metabolism. From a respiratory control perspective, dead space loading augments ventilation through chemoreceptor-mediated mechanisms, similarly to genuine increases in metabolic CO2 production, while elevated arterial CO2 also modulates vascular reactivity and blood flow distribution [42]. In the present study, higher post-exercise pO2 and O2sat in the ARDSv protocol further suggest improved pulmonary capillary gas exchange, which may have contributed to attenuated peripheral fluid shifts during intensive exercise.
The above discussion describes how the magnitude of ΔPV in the present study may have been modulated by blood redistribution to the pulmonary capillaries because of ARDSv application. The results of the obtained correlations, in turn, indicate that, following ARDSv application, the magnitude of ΔPV was linked to the degree of acid-base imbalance. Based on these correlations, it can be stated that greater accumulation of metabolites in the locomotor muscles may have intensified local vasodilation and filtration. Nitric oxide, potassium, and prostaglandins are considered the primary factors regulating vascular blood flow [43]. However, the hydrogen ion can affect smooth muscle tone by reducing intracellular calcium concentration and stimulating smooth muscle hyperpolarization by increasing membrane permeability to potassium ions [43]. Regardless of pH changes, lactate may also mediate vasodilation, for example, through the release of endothelial nitric oxide (NO) and activation of calcium-activated potassium channels (KCa) [44]. In summary, muscle metabolites such as H+ and La− could play a significant role in modulating local vasodilation and filtration, thereby influencing ΔPV during exercise preceded by breathing through ARDSv.
As mentioned above, the use of additional respiratory dead space volume [14] induces respiratory acidosis [45] and increases minute ventilation via stimulation of cardiovascular chemoreceptors by elevated partial pressure of CO2. Increased respiratory work may lead to the development of respiratory muscle fatigue [45]. Respiratory muscle fatigue may limit the ability to perform intensive exercise because it reflexively induces vasoconstriction in the skeletal muscles of the limbs [46,47]. A popular measure for assessing respiratory muscle fatigue is the pressure exerted on the membrane of a respiratory muscle strength meter [48]. In the present study, the results indicated that the use of ARDSv before the intensive 3 min exercise test did not cause a decrease in MIP or MEP following the exercise. This means that any potential support of the warm-up through the application of ARDSv should not exacerbate fatigue effects within the respiratory muscles.
The limitation of the present study is the use of a test with fixed intensity (110%Pmax) and fixed duration (3 min). Such a test does not allow for assessment of work capacity. Therefore, the next stage of investigating the use of ARDSv to enhance warm-up effects should involve maximal tests (at maximal power or with unlimited duration). Another limitation was the small number of participants in the present study—24 individuals. However, it is difficult to recruit a large number of participants among trained individuals. The results and conclusions obtained in this study pertain to a specific group of participants: cyclists. Therefore, these conclusions cannot be generalized to a broader research group, such as other sports disciplines, untrained individuals, or women. Furthermore, in the present study, the same respiratory dead space volume of 1000 mL was used for all participants. Future studies would be worthwhile to examine the effects of different respiratory dead space volumes in different participants and across different ages.
Practical Applications
Findings from the presented study indicate that athletes and coaches may consider incorporating an additional respiratory dead space volume (ARDSv) of 1000 mL (mask and tube) during a passive break that occurs between the warm-up and the main part of the training or between the warm-up and the start of the race.
Breathing through ARDSv between the warm-up and an intensive 3 min exercise test leads to transient and mild respiratory acidosis at the beginning of intensive exercise. Subsequently, during the main intensive exercise, a smaller acid-base imbalance, a smaller increase in hydrogen ion concentration, smaller changes in blood plasma volume, and higher blood oxygen saturation were observed compared with exercise not preceded by breathing through ARDSv. Simultaneously, applying ARDSv between the warm-up and intensive 3 min exercise test does not affect the degree of respiratory muscle fatigue. In addition, after using ARDSv, there was a lower rating of perceived exertion.
The use of post-warm-up breathing through ARDSv in sports practice may be beneficial, because in sports competition, during a race, “every second counts”.
These findings should be regarded as preliminary and specific to the tested protocol (1000 mL, ~8 min break), and further studies are needed to verify their generalizability across different durations, intensities, athlete populations, and genders.
5. Conclusions
Breathing through ARDSv between a warm-up and high-intensity 3 min exercise test induced mild respiratory acidosis, limited the exercise-induced increase in hydrogen ion concentration and changes in plasma volume, while resulting in a lower rating of perceived exertion.
Author Contributions
Conceptualization, R.H., P.H. and N.D.; methodology, R.H. and N.D.; software, R.H. and N.D.; validation, P.H., R.H. and N.D.; formal analysis, R.H. and P.H.; investigation, R.H.; resources, R.H. and P.H.; data curation, R.H. and N.D.; writing—original draft preparation, R.H. and P.H.; writing—review and editing, N.D., R.H. and P.H.; visualization, R.H., P.H. and N.D.; supervision, R.H.; project administration, P.H.; funding acquisition, P.H., R.H. and N.D. All authors have read and agreed to the published version of the manuscript.
Funding
This research was funded by the Ministry of Science and Higher Education, Republic of Poland, under the Science for the Society II Program. Project number: NdS-II/SP/0219/2024/01.
Institutional Review Board Statement
The study was conducted in accordance with the Declaration of Helsinki and approved by the Institutional Ethics Committee for Scientific Research (protocol code: 14/2024; date of approval: 29 May 2024).
Informed Consent Statement
Informed consent was obtained from all subjects involved in the study.
Data Availability Statement
Data will be provided upon request.
Acknowledgments
The authors would like to express their sincere gratitude to all participants in the study, the cyclists and their coaches, for their valuable contribution to the successful execution of this study.
Conflicts of Interest
The authors declare no conflicts of interest. The funders had no role in the design of the study; in the collection, analyses, or interpretation of data; in the writing of the manuscript; or in the decision to publish the results.
Abbreviations
The following abbreviations are used in this manuscript:
| BM | Body mass |
| BH | Body height |
| VO2max | Maximal oxygen uptake |
| Pmax | Maximal power output in a graded exercise test |
| VE | Minute ventilation |
| VO2 | Oxygen uptake |
| VCO2 | Carbon dioxide output |
| RER | Respiratory exchange ratio |
| PETO2 | End-tidal partial pressure of oxygen |
| PETCO2 | End-tidal partial pressure of carbon dioxide |
| VT1 | First ventilatory threshold |
| VT2 | Second ventilatory threshold |
| HGBw | Haemoglobin concentration in the blood before the 3 min test |
| HGBe | Haemoglobin concentration in the blood after the 3 min test |
| HCTe | Haematocrit after the 3 min test |
| HCTw | Haematocrit before the 3 min test |
| pH | Negative decimal logarithm of the hydrogen ion concentration |
| H+ | Hydrogen ion concentration |
| pCO2 | Partial pressure of carbon dioxide |
| pO2 | Partial pressure of oxygen |
| HCO3-act | Actual bicarbonate concentration |
| HCO3-std | Bicarbonate concentration adjusted to standard conditions |
| BE | Buffering base |
| O2sat | Haemoglobin oxygen saturation |
| La− | Lactate concentration |
| w | Measurement taken after the warm-up and immediately before the start of the 3 min test |
| e | Measurement taken after the 3 min test |
| LCI-UCI | Lower and upper confidence interval |
| non-ARDSv | Measurement taken in the test without additional respiratory dead space volume |
| ARDSv | Measurement taken in the test with additional respiratory dead space volume |
| H+(ΔPV) | Hydrogen ion concentration corrected for changes in plasma volume |
| La−(ΔPV) | Lactate ion concentration corrected for changes in plasma volume |
| ΔH+ | Changes in hydrogen ion concentration following the 3 min tests |
| ΔLa− | Changes in lactate ion concentration following the 3 min tests |
| ΔPV | Changes in plasma volume following the 3 min tests |
| ΔH+(ΔPV) | Changes in hydrogen ion concentration following the 3 min tests calculated after correcting post-exercise values for changes in plasma volume |
| ΔLa−(ΔPV) | Changes in lactate ion concentration following the 3 min tests calculated after correcting post-exercise values for changes in plasma volume |
| WBC | White blood cell count |
| RBC | Red blood cell count |
| HGB | Haemoglobin concentration |
| HCT | Haematocrit |
| MIP | Maximal inspiratory pressure |
| MEP | Maximal expiratory pressure |
| ΔWBC ΔRBC ΔHGB ΔHCT | Changes in blood morphology parameters following the 3 min tests |
| RPE | Rate of perceived exertion |
References
- Joyner, M.J.; Coyle, E.F. Endurance exercise performance: The physiology of champions. J. Physiol. 2008, 586, 35–44. [Google Scholar] [CrossRef]
- Wittekind, A.L.; Beneke, R. Effect of warm-up on run time to exhaustion. J. Sci. Med. Sport 2009, 12, 480–484. [Google Scholar] [CrossRef] [PubMed]
- Demachi, K.; Yoshida, T.; Kume, M.; Tsuji, M.; Tsuneoka, H. The influence of internal and skin temperatures on active cutaneous vasodilation under different levels of exercise and ambient temperatures in humans. Int. J. Biometeorol. 2013, 57, 589–596. [Google Scholar] [CrossRef]
- Ramanlal, R.; Gupta, V. Physiology, Vasodilation; StatPearls: Tampa, FL, USA, 2025. Available online: https://www.ncbi.nlm.nih.gov/books/NBK557562/ (accessed on 15 October 2025).
- Salvagno, M.; Sterchele, E.D.; Zaccarelli, M.; Mrakic-Sposta, S.; Welsby, I.J.; Balestra, C.; Taccone, F.S. Oxidative Stress and Cerebral Vascular Tone: The Role of Reactive Oxygen and Nitrogen Species. Int. J. Mol. Sci. 2024, 25, 3007. [Google Scholar] [CrossRef] [PubMed]
- Teixeira, A.L.; Garland, M.; Lee, J.B.; Nardone, M.; Millar, P.J. Assessing functional sympatholysis during rhythmic handgrip using Doppler ultrasound and near-infrared spectroscopy: Sex differences and test-retest reliability. Am. J. Physiol.-Regul. Integr. Comp. Physiol. 2022, 323, R810–R821. [Google Scholar] [CrossRef]
- Park, H.K.; Jung, M.K.; Park, E.; Lee, C.Y.; Jee, Y.S.; Eun, D.; Cha, J.Y.; Yoo, J. The effect of warm-ups with stretching on the isokinetic moments of collegiate men. J. Exerc. Rehabil. 2018, 14, 78–82. [Google Scholar] [CrossRef] [PubMed]
- Gray, S.; Nimmo, M. Effects of active, passive or no warm-up on metabolism and performance during high-intensity exercise. J. Sports Sci. 2001, 19, 693–700. [Google Scholar] [CrossRef]
- Brito, L.C.; Ely, M.R.; Sieck, D.C.; Mangum, J.E.; Larson, E.A.; Minson, C.T.; Forjaz, C.L.M.; Halliwill, J.R. Effect of time of day on sustained postexercise vasodilation following small muscle-mass exercise in humans. Front. Physiol. 2019, 10, 762. [Google Scholar] [CrossRef]
- Halliwill, J.R.; Buck, T.M.; Lacewell, A.N.; Romero, S.A. Postexercise hypotension and sustained postexercise vasodilatation: What happens after we exercise? Exp. Physiol. 2013, 98, 7–18. [Google Scholar] [CrossRef]
- Dawson, E.A.; Green, D.J.; Cable, N.T.; Thijssen, D.H. Effects of acute exercise on flow-mediated dilatation in healthy humans. J. Appl. Physiol. 2013, 115, 1589–1598. [Google Scholar] [CrossRef]
- Joyner, M.J.; Casey, D.P. Regulation of increased blood flow (hyperemia) to muscles during exercise: A hierarchy of competing physiological needs. Physiol. Rev. 2015, 95, 549–601. [Google Scholar] [CrossRef]
- Hebisz, P.; Hebisz, R.; Danek, N. Prolonging the warm-up effect by using additional respiratory dead space volume after the cessation of warm-up exercise. J. Clin. Med. 2025, 14, 7049. [Google Scholar] [CrossRef]
- Danek, N.; Michalik, K.; Zatoń, M. Warm-up with added respiratory dead space volume mask improves the performance of the cycling sprint interval exercise: Crossover study. Front. Physiol. 2022, 13, 812221. [Google Scholar] [CrossRef] [PubMed]
- Hein, T.W.; Razavi, H.M.; Xu, X.; Somvanshi, S.; Muthuchamy, M.; Kuo, L. Activation of smooth muscle Kir2.1 channels and Na+/K+-ATPase mediates dilation of porcine coronary arterioles at physiological levels of potassium. Int. J. Mol. Sci. 2025, 26, 2654. [Google Scholar] [CrossRef] [PubMed]
- Chycki, J.; Kurylas, A.; Maszczyk, A.; Golas, A.; Zajac, A. Alkaline water improves exercise-induced metabolic acidosis and enhances anaerobic exercise performance in combat sport athletes. PLoS ONE 2018, 13, e0205708. [Google Scholar] [CrossRef] [PubMed]
- Bishop, D. Warm up I: Potential mechanisms and the effects of passive warm up on exercise performance. Sports Med. 2003, 33, 439–454. [Google Scholar] [CrossRef]
- Robergs, R.A.; Costill, D.L.; Fink, W.J.; Williams, C.; Pascoe, D.D.; Chwalbinska-Moneta, J.; Davis, J.A. Effects of warm-up on blood gases, lactate and acid-base status during sprint swimming. Int. J. Sports Med. 1990, 11, 273–278. [Google Scholar] [CrossRef]
- De Pauw, K.; Roelands, B.; Cheung, S.S.; de Geus, B.; Rietjens, G.; Meeusen, R. Guidelines to classify subject groups in sport-science research. Int. J. Sports Physiol. Perform. 2013, 8, 111–122. [Google Scholar] [CrossRef]
- Hebisz, R.; Hebisz, P. Greater improvement in aerobic capacity after a polarised training program including cycling interval training at low cadence (50–70 RPM) than freely chosen cadence (above 80 RPM). PLoS ONE 2024, 19, e0311833. [Google Scholar] [CrossRef]
- Hebisz, P.; Jastrzębska, A.D.; Hebisz, R. Real assessment of maximum oxygen uptake as a verification after an incremental test versus without a test. Front. Physiol. 2021, 12, 739745. [Google Scholar] [CrossRef]
- Pallarés, J.G.; Morán-Navarro, R.; Ortega, J.F.; Fernández-Elías, V.E.; Mora-Rodriguez, R. Validity and reliability of ventilatory and blood lactate thresholds in well-trained cyclists. PLoS ONE 2016, 11, e0163389. [Google Scholar] [CrossRef]
- Opialla, T.; Gollasch, B.; Kuich, P.H.J.L.; Klug, L.; Rahn, G.; Busjahn, A.; Spuler, S.; Boschmann, M.; Kirwan, J.A.; Luft, F.C.; et al. Exercise blood-drop metabolic profiling links metabolism with perceived exertion. Front. Mol. Biosci. 2022, 9, 1042231. [Google Scholar] [CrossRef]
- Borg, G.A. Psychophysical bases of perceived exertion. Med. Sci. Sports Exerc. 1982, 14, 377–381. [Google Scholar] [CrossRef]
- Danek, N.; Michalik, K.; Smolarek, M.; Zatoń, M. Acute effects of using added respiratory dead space volume in a cycling sprint interval exercise protocol: A crossover study. Int. J. Environ. Res. Public Health 2020, 17, 9485. [Google Scholar] [CrossRef]
- Dill, D.B.; Costill, D.L. Calculation of percentage changes in volumes of blood, plasma, and red cells in dehydration. J. Appl. Physiol. 1974, 37, 247–248. [Google Scholar] [CrossRef]
- Chiron, F.; Erblang, M.; Gulören, B.; Bredariol, F.; Hamri, I.; Leger, D.; Hanon, C.; Tiollier, E.; Thomas, C. Exploring the influence of acid-base status on athletic performance during simulated three-day 400 m race. Nutrients 2024, 16, 1987. [Google Scholar] [CrossRef]
- Malte, H.; Lykkeboe, G. The Bohr/Haldane effect: A model-based uncovering of the full extent of its impact on O2 delivery to and CO2 removal from tissues. J. Appl. Physiol. 2018, 125, 916–922. [Google Scholar] [CrossRef] [PubMed]
- Yanaoka, T.; Iwata, R.; Yoshimura, A.; Hirose, N. A 1-minute re-warm up at high-intensity improves sprint performance during the Loughborough intermittent shuttle test. Front. Physiol. 2021, 11, 616158. [Google Scholar] [CrossRef] [PubMed]
- McGowan, C.J.; Pyne, D.B.; Thompson, K.G.; Rattray, B. Warm-up strategies for sport and exercise: Mechanisms and applications. Sports Med. 2015, 45, 1523–1546. [Google Scholar] [CrossRef]
- Sahlin, K. Muscle energetics during explosive activities and potential effects of nutrition and training. Sports Med. 2014, 44, S167–S173. [Google Scholar] [CrossRef]
- Joyner, M.J.; Dominelli, P.B. Central cardiovascular system limits to aerobic capacity. Exp. Physiol. 2021, 106, 2299–2303. [Google Scholar] [CrossRef]
- Woodward, M.; Debold, E.P. Acidosis and phosphate directly reduce myosin’s force-generating capacity through distinct molecular mechanisms. Front. Physiol. 2018, 9, 862. [Google Scholar] [CrossRef]
- Parsons, B.; Szczesna, D.; Zhao, J.; Van Slooten, G.; Kerrick, W.G.; Putkey, J.A.; Potter, J.D. The effect of pH on the Ca2+ affinity of the Ca2+ regulatory sites of skeletal and cardiac troponin C in skinned muscle fibres. J. Muscle Res. Cell Motil. 1997, 18, 599–609. [Google Scholar] [CrossRef]
- Himeno, Y.; Ikebuchi, M.; Maeda, A.; Noma, A.; Amano, A. Mechanisms underlying the volume regulation of interstitial fluid by capillaries: A simulation study. Integr. Med. Res. 2016, 5, 11–21. [Google Scholar] [CrossRef]
- Ciekot-Sołtysiak, M.; Kusy, K.; Podgórski, T.; Pospieszna, B.; Zieliński, J. Changes in red blood cell parameters during incremental exercise in highly trained athletes of different sport specialisations. PeerJ 2024, 12, e17040. [Google Scholar] [CrossRef]
- Hebisz, P.; Hebisz, R.; Bakońska-Pacoń, E.; Zatoń, M. Acute hematological response to a single dose of sprint interval training in competitive cyclists. Sci. Sports 2017, 32, 369–375. [Google Scholar] [CrossRef]
- Thompson, A.J.; Wright, M.D.; Mann, L.M.; Pulford-Thorpe, A.E.; Dominelli, P.B. Ventilatory response of peripheral chemoreceptors to hypercapnia during exercise above the respiratory compensation point. J. Appl. Physiol. 2024, 137, 125–135. [Google Scholar] [CrossRef] [PubMed]
- Dominelli, P.B.; Archiza, B.; Ramsook, A.H.; Mitchell, R.A.; Peters, C.M.; Molgat-Seon, Y.; Henderson, W.R.; Koehle, M.S.; Boushel, R.; Sheel, A.W. Effects of respiratory muscle work on respiratory and locomotor blood flow during exercise. Exp. Physiol. 2017, 102, 1535–1547. [Google Scholar] [CrossRef] [PubMed]
- Korthuis, R.J. Skeletal muscle circulation. In Chapter 5, Microvascular Fluid and Solute Exchange in Skeletal Muscle; Morgan & Claypool Life Sciences: San Rafael, CA, USA, 2011. Available online: https://www.ncbi.nlm.nih.gov/books/NBK57134/ (accessed on 10 November 2025).
- Zatoń, M.; Smołka, Ł. Circulatory and respiratory response to exercise with added respiratory dead space. Hum. Mov. 2011, 12, 88–94. [Google Scholar] [CrossRef]
- Moriyama, S.; Ichinose, M.; Dobashi, K.; Matsutake, R.; Sakamoto, M.; Fujii, N.; Nishiyasu, T. Hypercapnia elicits differential vascular and blood flow responses in the cerebral circulation and active skeletal muscles in exercising humans. Physiol Rep. 2022, 10, e15274. [Google Scholar] [CrossRef]
- Clifford, P.S.; Hellsten, Y. Vasodilatory mechanisms in contracting skeletal muscle. J. Appl. Physiol. 2004, 97, 393–403. [Google Scholar] [CrossRef] [PubMed]
- Wu, P.; Zhu, T.; Huang, Y.; Fang, Z.; Luo, F. Current understanding of the contribution of lactate to the cardiovascular system and its therapeutic relevance. Front. Endocrinol. 2023, 14, 1205442. [Google Scholar] [CrossRef]
- Jonville, S.; Delpech, N.; Denjean, A. Contribution of respiratory acidosis to diaphragmatic fatigue at exercise. Eur. Respir. J. 2002, 19, 1079–1086. [Google Scholar] [CrossRef]
- Deliceoğlu, G.; Kabak, B.; Çakır, V.O.; Ceylan, H.İ.; Raul-Ioan, M.; Alexe, D.I.; Stefanica, V. Respiratory muscle strength as a predictor of VO2max and aerobic endurance in competitive athletes. Appl. Sci. 2024, 14, 8976. [Google Scholar] [CrossRef]
- Romer, L.M.; Polkey, M.I. Exercise-induced respiratory muscle fatigue: Implications for performance. J. Appl. Physiol. 2008, 104, 879–888. [Google Scholar] [CrossRef] [PubMed]
- Tsukamoto, T.; Maruyama, H.; Kato, M.; Uchida, M.; Kubo, A. Characteristics of respiratory muscle fatigue upon inhalation resistance with a maximal inspiratory mouth pressure of 50. J. Phys. Ther. Sci. 2019, 31, 318–325. [Google Scholar] [CrossRef] [PubMed]


Disclaimer/Publisher’s Note: The statements, opinions and data contained in all publications are solely those of the individual author(s) and contributor(s) and not of MDPI and/or the editor(s). MDPI and/or the editor(s) disclaim responsibility for any injury to people or property resulting from any ideas, methods, instructions or products referred to in the content. |
© 2026 by the authors. Licensee MDPI, Basel, Switzerland. This article is an open access article distributed under the terms and conditions of the Creative Commons Attribution (CC BY) license.