Article

Solid-State Fermentation with Macrofungi: A Strategy for Improving the Nutritional and Bioactive Profile of Carioca Bean and Rice Flours

by
Suélen C. Frantz
1,2,
Bruno Melgar
1,
Daiana Wischral
2,
Guilherme C. da Silva
2,
Ricardo C. Calhelha
1,
Félix G. de Siqueira
2,
Tiane C. Finimundy
1,*,
Priscila Z. Bassinello
3,* and
Lillian Barros
1
1
CIMO, SusTEC, Instituto Politécnico de Bragança, Campus de Santa Apolónia, 5300-253 Bragança, Portugal
2
Embrapa Agroenergy, Brasília C.P. 70297-400, Brazil
3
Embrapa Rice and Beans, Santo Antônio de Goiás C.P. 75375-000, Brazil
*
Authors to whom correspondence should be addressed.
Appl. Sci. 2026, 16(11), 5334; https://doi.org/10.3390/app16115334
Submission received: 13 March 2026 / Revised: 16 April 2026 / Accepted: 13 May 2026 / Published: 26 May 2026
(This article belongs to the Special Issue Bioactive Compounds in Plant-Based Foods)

Abstract

Macrofungi are renowned for their rich nutritional and bioactive compounds. This study aimed to assess bioactive compounds, amino acids, and functional properties of flours produced through solid-state fermentation of bean and rice co-products with macrofungi. Three species (Pycnoporus sanguineus, Fistulina hepatica, and Laetiporus cincinnatus) were cultivated in humidified and sterilized broken ‘carioca’ beans or in a mixture of broken beans (70%), rice bran (20%) and broken rice (10%). Following fermentation, the colonized biomass was dried and milled into flour. The sample derived from broken beans cultivated with F. hepatica (102F) exhibited significantly higher β-glucans content (50.75 mg/g) of flour. All fermented flour samples showed elevated essential amino acid levels surpassing those reported in the literature for carioca beans. Phenolic compounds exhibited a notable increase, exceeding threefold in total phenolic content in the fermented samples. Sample 102F particularly excelled in antioxidant and cytotoxic activities. Principal component analysis revealed that these properties were linked to the highest content of β-glucans and specific phenolic compounds, such as sinapic and ellagic acids. These findings indicate that solid-state fermentation effectively enhances the nutritional and bioactive profile of bean and rice co-products, with F. hepatica emerging as the most promising treatment for bean and the bean–rice mixture.

1. Introduction

Macrofungi, commonly known as mushrooms, belong to the phyla Basidiomycota and Ascomycota within the kingdom Fungi. They form diverse fruiting bodies, either above (epigeous) or below (hypogeous) the ground. Among the approximately 14,000 to 17,000 identified species, around 2000 have medicinal or edible properties [1,2].
Mushrooms, including their fruiting bodies, mycelia, and biomass from submerged fermentations, are rich in nutritional and bioactive compounds [3]. Among these, Fistulina hepatica (beefsteak fungus), Laetiporus cincinnatus (chicken of the woods), and Pycnoporus sanguineus were chosen for their well-documented bioactive properties and metabolic activity in solid-state fermentation.
Specifically, F. hepatica is recognized for its high phenolic content, particularly ellagic acid, which exhibits strong antioxidant and cytotoxic activities [4]. L. cincinnatus produces a variety of secondary metabolites, including sterols, triterpenes, and sesquiterpenes, contributing to its antimicrobial and anti-inflammatory effects [5]. Meanwhile, P. sanguineus, a ligninolytic fungus, is known for its rich content of phenolic compounds and β-glucans, which have been linked to immunomodulatory and anticancer properties [6]. These characteristics suggest that their metabolic activity could significantly enhance the bioactive profile of fermented bean and rice co-products. Vaz et al. [4] investigated the composition of seventeen wild mushrooms in Portugal and discovered the highest amount of phenolic compound in Fistulina hepatica. Its composition included five phenolic compounds (caffeic, p-coumaric and ellagic acids, hyperoside, and quercetin) and six organic acids (oxalic, aconitic, citric, malic, ascorbic, and fumaric acids). Laetiporus cinccinatus has been reported to contain, in addition to fatty acids and other lipids, approximately 80 other molecules, including 15 sterols, 29 triterpenes, 10 sesquiterpenes, 5 polyenes, and 21 other compounds [5]. The 20-day-old mycelium of Pycnoporus sanguineus, characterized by its bright orange-red color, is a mushroom containing nine groups of fungal chemicals, encompassing triterpenes, flavonoids, tannins, phenols, steroids, alkaloids, anthraquinones, anthrones, and fatty acids [6]. Phenolic compounds and polysaccharides, such as β-glucans, are among the bioactive components attributed to activities like antimicrobial, anticancer, antioxidant, hepatoprotective, anti-inflammatory, and antidiabetic activities [5]. Indigenous populations in Brazil have historically used Pycnoporus sanguineus staunch bleeding [7]. Recent in vitro research on Laetiporus genus fungi, including Laetiporus sulphureus, has indicated antioxidant activity, α-amylase and α-glucosidase inhibition, neuroprotective effects, and cytotoxicity (ranging from 211.590 to 362.770 μg/mL) against human embryonic lung fibroblast (MRC-5), human colon cancer (HCT-116), human breast cancer (MCF-7), human cervical adenocarcinoma (HeLa), and human colonic adenocarcinoma (LS174T) cell lines [8].
While fruiting bodies and mycelium cultivated in solid or submerged state have been the focus of previous research, recent studies have demonstrated that the solid-state cultivation of grains and co-products with macrofungi can significantly enrich the resulting products in terms of nutritional, chemical, and bioactive properties [9,10]. Carioca beans and rice co-products (called ‘split grains’ or ‘bandinha’ in Brazil) offer promising substrates for macrofungi solid-state cultivation due to their cost effectiveness and high content of plant proteins and carbohydrates. Additionally, these materials contain bioactive compounds such as peptides, γ-oryzanol, ferulic acid, tocopherol, and polyunsaturated fatty acids [11,12].
Solid-state fermentation efficiency is strongly influenced by both the fungal species and the physicochemical characteristics of the substrate, including its protein, starch, fiber, and bound phenolic composition. Previous studies have shown that different raw materials, such as cereals, legumes, and agro-industrial co-products, respond differently to fungal colonization, leading to distinct degrees of protein hydrolysis, release of phenolic compounds, modification of polysaccharides, and improvement in functional properties. Therefore, the combined selection of substrate and fungal strain is a critical factor for maximizing nutritional and bioactive enrichment. In this context, carioca bean and rice co-products represent an interesting but still underexplored substrate combination for macrofungal solid-state fermentation, particularly regarding the simultaneous modulation of phenolic compounds, β-glucans, amino acids, and bioactivities.
Thus, the present study aimed to evaluate the effect of growing macrofungi in substrates based on carioca bean co-product or a mixture of bean and rice co-product on the content of β-glucans, amino acids, and phenolic compounds profiles of the resulting flours. Furthermore, we have evaluated the cellular antioxidant activity and cytotoxicity against six cell lines (MCF-7, AGS, CaCo2, NCI-H460, VERO, and RAW) of extracts from these flours.

2. Material and Methods

2.1. Microorganisms and Substrates

The macrofungi species selected for this study—Pycnoporus sanguineus, Fistulina hepatica, and Laetiporus cincinnatus—were obtained from the culture collection of Embrapa Agroenergy. These species have been previously reported to improve the nutritional profile of plant-based substrates through enzymatic activity and bioactive metabolite production. They were reactivated on Potato Dextrose Agar plates (28 °C/7 days) before inoculation in co-products of beans or rice. Table 1 shows substrates, codes, and the microorganisms of each sample produced in macrofungi treatment.

Colonization of Flours

Macrofungi were cultivated in two types of substrates: (i) broken ‘carioca’ beans, and (ii) a mixture composed of broken beans (70%), rice bran (20%), and broken rice (10%), According to previous reports, flours obtained from carioca bean (Phaseolus vulgaris L.) typically present protein contents around 20–22 g/100 g and high levels of carbohydrates and dietary fiber, confirming their role as nutrient-dense legume ingredients. Rice bran, in turn, contains approximately 11–17 g/100 g protein, 12–22 g/100 g lipids, and 6–14 g/100 g fiber, as well as a relevant fraction of bioactive compounds such as γ-oryzanol, ferulic acid, tocopherols and unsaturated fatty acids. Therefore, the combined use of carioca bean co-products with rice bran and broken rice provides a mixed substrate rich in proteins, starch, lipids, and dietary fiber, which is suitable for fungal colonization and for the generation of value-added fermented flours. The beans-only substrate was prepared by macerating 100 g of broken beans in tap water for 2 h in glass flasks. The mixed substrate followed the same procedure, using the specific proportion of each ingredient. After maceration, the water was drained through 8 mm holes in the flasks, closed, and sterilized by autoclave (121 °C for 30 min at 103 kPa) (Prismatec, CS, Itu, Brazil). After cooling, the mycelium from the fungi in the PDA plate (90 mm) was inoculated, using one plate for each flask, fully colonized Petri dishes were obtained after 7 days at 28 °C. One full PDA plate was aseptically cut into pieces and transferred to each flask, distributing the mycelial agar fragments throughout the substrate surface with a sterile spatula. The inoculated material was placed in a dark and humid (95% of relative humidity) place for full substrate colonization, for approximately 30 days, in flasks closed with breathable cotton plugs and incubated in a humidified incubator to maintain high relative humidity. Fungal growth was monitored visually every few days, and flasks were considered fully colonized when the entire substrate surface was covered by a dense mycelial mat without visible uncolonized particles. No quantitative biomass measurements were performed. Then, the colonized substrates from flasks were dried in a forced-circulation oven at 60 °C for 5 days. The dry masses were ground using a 0.5 mm sieve in a bench mill. This procedure was performed in triplicate for each macrofungi species, and a control was prepared (without microorganisms) for each substrate.

2.2. Analytical Methods for Component Assessment

2.2.1. Beta-Glucans

The beta-glucan content was determined using a commercial enzymatic Beta-Glucan Assay Kit (Megazyme, Bray, County Wicklow, Ireland), following the extraction and quantification method recommended by the manufacturer, with minor adaptations. Briefly, ground samples (100 mg, dry basis) were suspended in the extraction buffer and heated to solubilize glucans, followed by enzymatic hydrolysis with lichenase to release soluble oligosaccharides and subsequent treatment with β-glucosidase to convert them into free glucose. Glucose was quantified by a colorimetric/enzymatic reaction using GOPOD reagent, and absorbance was measured at 510 nm using a spectrophotometer. The method is based on enzymatic hydrolysis and quantification of released free sugars, making it possible to determine the content of total glucans and α-glucans. The difference between these results determines the beta-glucan content (mg/g).

2.2.2. Amino Acids

The quantification of amino acids in fungal cultures was carried out in an outsourced laboratory (CBO Laboratory, Valinhos, São Paulo, Brazil). The quantification of tryptophan followed the methodology described by Lucas and Sotelo [13]. Briefly, approximately 200 mg of sample was treated with sodium hydroxide solution, heated in sealed tubes, and the released tryptophan was quantified after neutralization by reversed-phase HPLC using UV detection at the appropriate wavelength, with external calibration.
For the remaining amino acids, including essential (threonine, valine, methionine, isoleucine, leucine, phenylalanine, lysine) and non-essential amino acids, samples were submitted to acid hydrolysis following the procedures described by White et al. [14]. Approximately 200 mg of sample was hydrolyzed with 6 mol/L hydrochloric acid under a nitrogen atmosphere at 110 °C for 24 h. After filtration, evaporation to dryness and reconstitution in a suitable buffer, free amino acids were separated in an ion-exchange chromatographic system coupled with post-column derivatization with ninhydrin and spectrophotometric detection. Individual amino acids were identified by comparison with the retention times of standards and quantified using calibration curves constructed with certified amino acid standard mixtures. The results were expressed as g/100 g of sample (dry basis). Each sample was analyzed once.

2.2.3. Preparation of Extracts for Chemical Characterization and Bioactivities

Each of the samples and controls (2 g) was subjected to extraction by maceration with 30 mL of ethanol/water solution (80:20, v/v) at room temperature, with magnetic stirring (150 rpm) for 1 h. Then, the material was filtered through filter paper (Whatman No. 4) and the process was repeated. Finally, the ethanolic fraction of the obtained extracts was evaporated under pressure (100 rpm, 40 °C) (rotary evaporator, Heidolph, Schwabach, Germany). The aqueous phase was frozen and lyophilized (Labconco Freeze Zone 6, Kansas City, MO, USA) for both chemical characterization and bioactivity assessments.

2.2.4. Phenolic Compounds Analysis

For analysis of the profile of phenolic compounds of the samples, the hydroalcoholic extracts obtained as described in Section 2.2.3 were redissolved in 1 mL of ethanol/water solution (20:80, v/v). The composition of phenolic compounds was determined by high-performance liquid chromatography coupled with a photodiode array detector (Thermo Fisher Scientific, Sunnyvale, CA, USA) (280, 330, and 370 nm as wavelengths) and an electrospray ionization mass spectrometer (HPLC-DAD-ESI/MS) (Thermo Fisher Scientific, Bremen, Germany), as previously described by Bessada et al. [15]. The identification of compounds was based on a comparison with commercial standards and information available in the literature. Quantification was performed using the standard calibration curve. The results were expressed as mg/g of extract.

2.2.5. Antioxidant Activity by CAA

To evaluate the cellular antioxidant activity (CAA), the sample and control extracts were dissolved in water to obtain a concentration of 8 mg/mL, from which successive dilutions were made with 2′,7′-dichlorohydrofluorescein (DCFH) prepared with ethanol and diluted with HBSS (50 μM), obtaining the concentrations to be tested (500–2000 μM). This procedure was followed as Wolfe & Liu [16] described. The cell line used was RAW 246.7 (murine macrophages), maintained in an incubator at 37 °C, with a humidified atmosphere and 5% CO2 and DMEM culture medium supplemented with L-glutamine, penicillin (100 U/mL), streptomycin (100 μg/mL), fetal bovine serum (10%) and non-essential amino acids (2 mM). Murine macrophages were separated with a cell scraper and the contents were transferred to a falcon tube. The solution was centrifuged for 5 min at 16,000× g. The medium was discarded, and the new medium was added according to the pellet size obtained. A solution with a 70,000 cells/mL cell density was then prepared. An aliquot of the prepared solution (300 μL) was transferred to black microplates with a transparent bottom (SPL Lifesciences, Pocheon-si, Gyeonggi-do, Korea) and incubated for 48 h. After the incubation period, the medium was discarded and the cells were washed with HBSS (2×, 100 μL), treated with different extract concentrations (200 μL; 32.5–2000 μM), and incubated for 1 h. Then, the cells were washed with HBSS (2×, 100 µL) and a solution of 2,2 2′-azobis(2-methylpropionamide) dihydrochloride (AAPH) (100 µL; 600 µM) was added. Fluorescence was analyzed every 5 min for 1 h (Biotek FLx800 microplate reader, BioTek Instruments, Winooski, VT, USA) at 485 nm excitation and 538 nm emission. Quercetin was used as a positive control and dichlorohydroflurescein and DMEM culture medium were used as a negative control.

2.2.6. Cytotoxicity

The cytotoxic activity of sample and control extracts was tested on six cell lines: MCF-7 (breast adenocarcinoma), AGS (stomach adenocarcinoma), CaCo2 (colorectal adenocarcinoma), NCI-H460 (lung cancer), VERO (monkey kidney cells) and RAW (murine macrophages) according to the methodology described in [17]. The sulforhodamine B assay was performed to assess cytotoxic potential. Ellipticin was employed as a positive control and the result was expressed as GI50 values, corresponding to the extract concentration inhibiting 50% of cell growth. A GI50 value greater than 400 μg/mL is typically considered non-cytotoxic [17].
The Selectivity Index (SI) was calculated as the ratio between the cytotoxic concentration that reduces cell viability by 50% (IG50) in non-cancerous cells and the half-maximal inhibitory grow (IG50) in cancer cells. SI values greater than 2 indicate selective cytotoxicity towards cancer cells, whereas lower values suggest non-selective toxicity.
S I = I G 50 ( n o r m a l   c e l l s ) I G 50 ( c a n c e r   c e l l s )

2.2.7. Data Processing

The dataset was imported from an Excel file and preprocessed using R version 4.3.1 (R Foundation for Statistical Computing, Vienna, Austria). Non-relevant variables were removed, and min–max normalization was applied to scale the data between 0 and 1. Principal component analysis (PCA) was performed to explore the variance structure of phenolic compounds, amino acids, and beta-glucans. Heatmaps and PCA biplots were generated to visualize clustering patterns and variable contributions. Pearson’s correlation coefficients were calculated to explore linear relationships among variables, and correlation matrices and heatmaps () were generated after min–max normalization. All analyses were conducted using the R packages FactoMineR, ggplot2, pheatmap, and tidyverse. The complete data-processing pipeline is available at https://github.com/Bruno-melgar/Beans2/ accessed on 5 February 2026.

2.2.8. Statistical Analysis

To evaluate the statistical effects of the addition of solid-state fermentation with different macrofungi species, analysis of variance (ANOVA) and Tukey’s test were performed on Statistic 7.0 software (Statsoft, Tulsa, OK, USA).

3. Results and Discussion

3.1. Phenolic Compounds and Antioxidant Activity

Table 2 presents the phenolic composition of control (non-fermented) flours and of flours obtained after solid-state fermentation with the different macrofungi. Protocatechuic acid, gallic acid, chlorogenic acid, 4-Hydroxybenzoic acid (−)-epicatechin, vanillic acid, and sinapic acid were among the compounds identified in control samples (CF and CFA), differing only in the concentration of each compound. These results partially align with those obtained by Telles et al. [18], who identified, in addition to protocatechuic acid, gallic acid, chlorogenic acid, 4-Hydroxybenzoic acid (−)- and vanillin, caffeic acid, syringic acid, p-coumaric acid, and ferulic acid in the phenolic composition of carioca beans. Notably, the beans in their study had not undergone any processing. Both pre-processing and the bean cultivar variations can alter the profile of compounds identified [19].
Beyond the direct accumulation of fungal metabolites, the bioconversion of bean- and rice-based substrates during solid-state fermentation likely contributed to the observed compositional changes. Bean co-products provide a protein-rich matrix, whereas rice bran and broken rice contribute starch, lipids, and structurally distinct phenolic constituents. During fungal colonization, extracellular enzymes may partially degrade cell wall polysaccharides and storage macromolecules, facilitating nutrient assimilation by the fungi and releasing matrix-bound compounds or lower-molecular-weight metabolites. These substrate-dependent transformations may help explain the differences observed among treatments, especially regarding amino acid profile, phenolic composition, and functional responses. Since enzymatic activities and substrate degradation were not directly monitored, these mechanisms should be interpreted as literature-supported hypotheses. It should be noted that total carbon and nitrogen contents of the substrates were not measured in this study, which limits a more mechanistic interpretation of fungal growth and substrate utilization in relation to the C/N ratio.
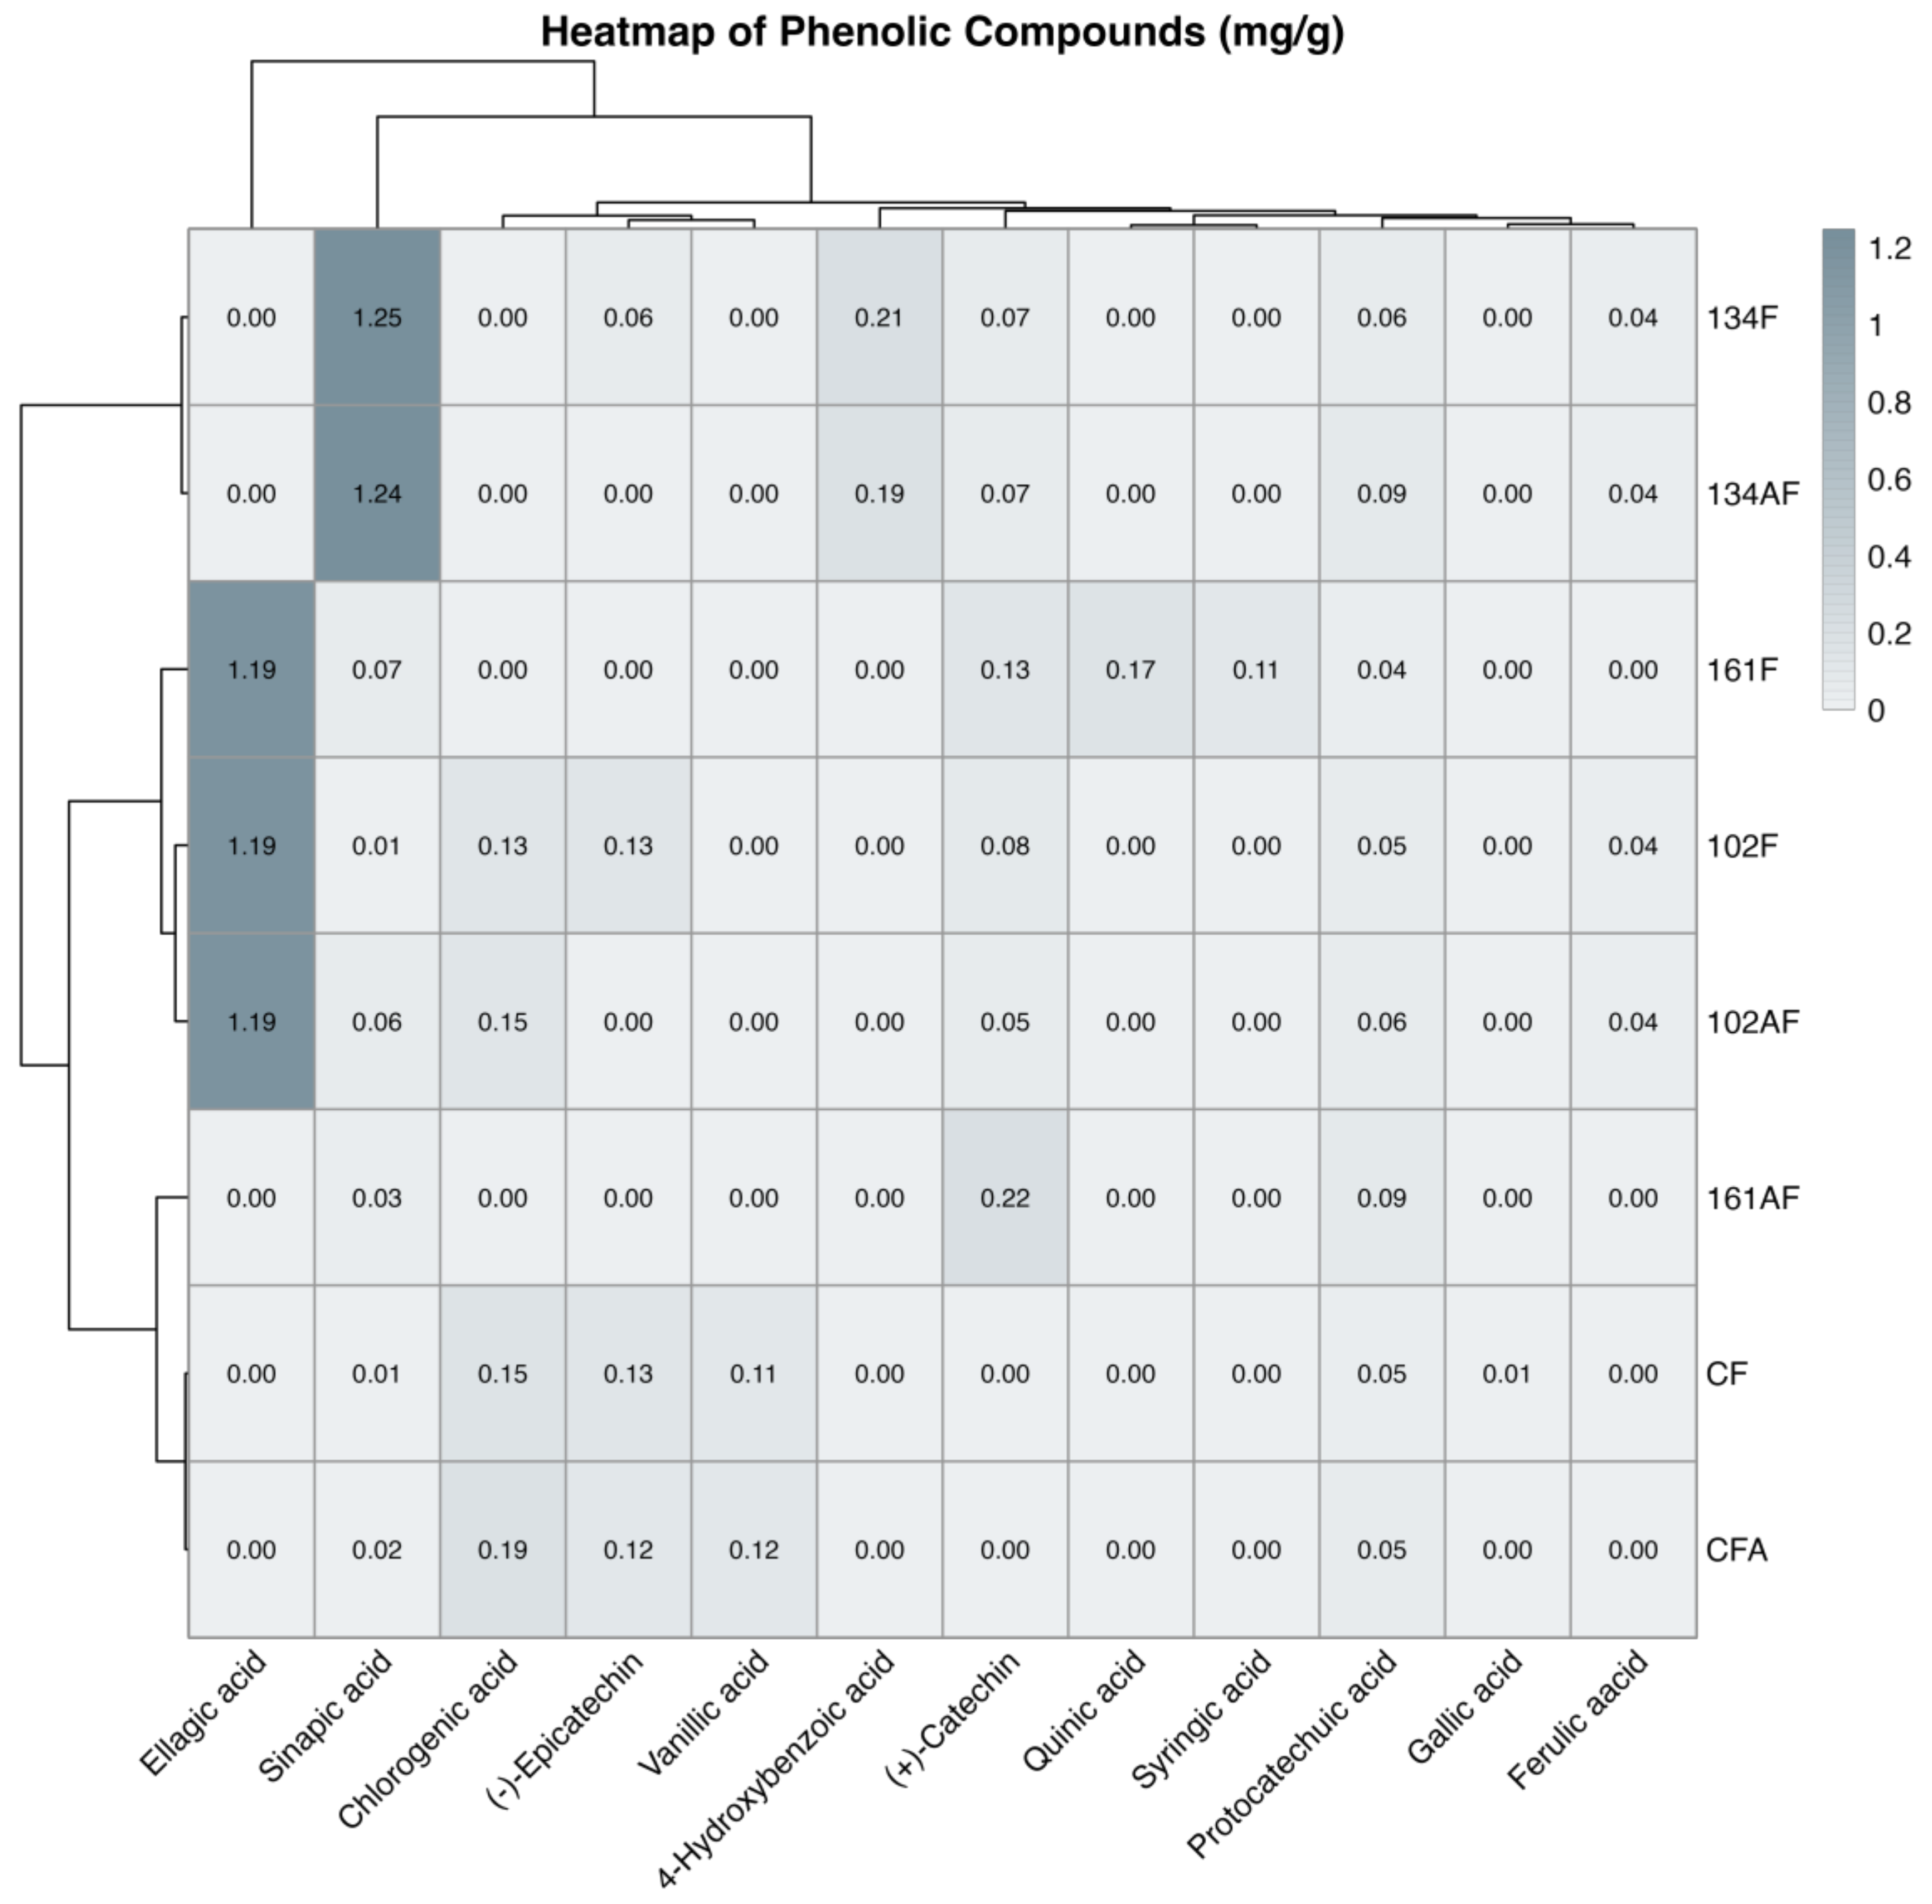
As illustrated in Figure 1, the hierarchical heatmap provides a visual representation of the phenolic composition across samples, facilitating pattern recognition. Control samples (CF and CFA) exhibit relatively low and more homogeneous distributions of phenolic compounds, with modest contributions from chlorogenic acid, (−)-epicatechin, and vanillic acid. In contrast, fermented samples display more heterogeneous profiles, where specific compounds dominate depending on the treatment. For example, ellagic acid is notably prominent in 102F, 102AF, and 161F, whereas sinapic acid is markedly elevated in 134F and 134AF. Additionally, some samples such as 161AF show a lower overall phenolic content with a more selective presence of compounds, particularly (+)-catechin. The clustering pattern appears to be influenced primarily by the relative abundance of dominant phenolics rather than total phenolic content, reflecting distinct compositional shifts associated with each treatment. Overall, this heatmap should be interpreted as an exploratory visualization to aid in understanding trends and differences among samples rather than as a basis for statistical inference. These changes can be plausibly associated with fungal enzymatic activity during solid-state fermentation. Previous studies have shown that secreted tannases and other hydrolytic enzymes can hydrolyze ellagitannins and release free ellagic acid, and that ligninolytic enzymes (e.g., laccases and peroxidases) may contribute to the formation of syringic acid from lignin-derived structures. In addition, β-glucosidases and esterases have been reported to deconjugate phenolic compounds bound to carbohydrates or proteins. Although enzyme activities were not directly measured in the present work, these literature-based mechanisms provide a reasonable explanation for the strain-specific reconfiguration of the phenolic profile observed here.
This selective bioconversion highlights the potential of fungal treatment as a biotechnological strategy to enhance the bioactive profile of plant-based food matrices. Moreover, fungal growth on the substrates was only evaluated qualitatively by visual inspection of mycelial coverage, and no direct biomass or ergosterol measurements were obtained, which prevents a more detailed comparison of growth efficiency among strains and substrates.
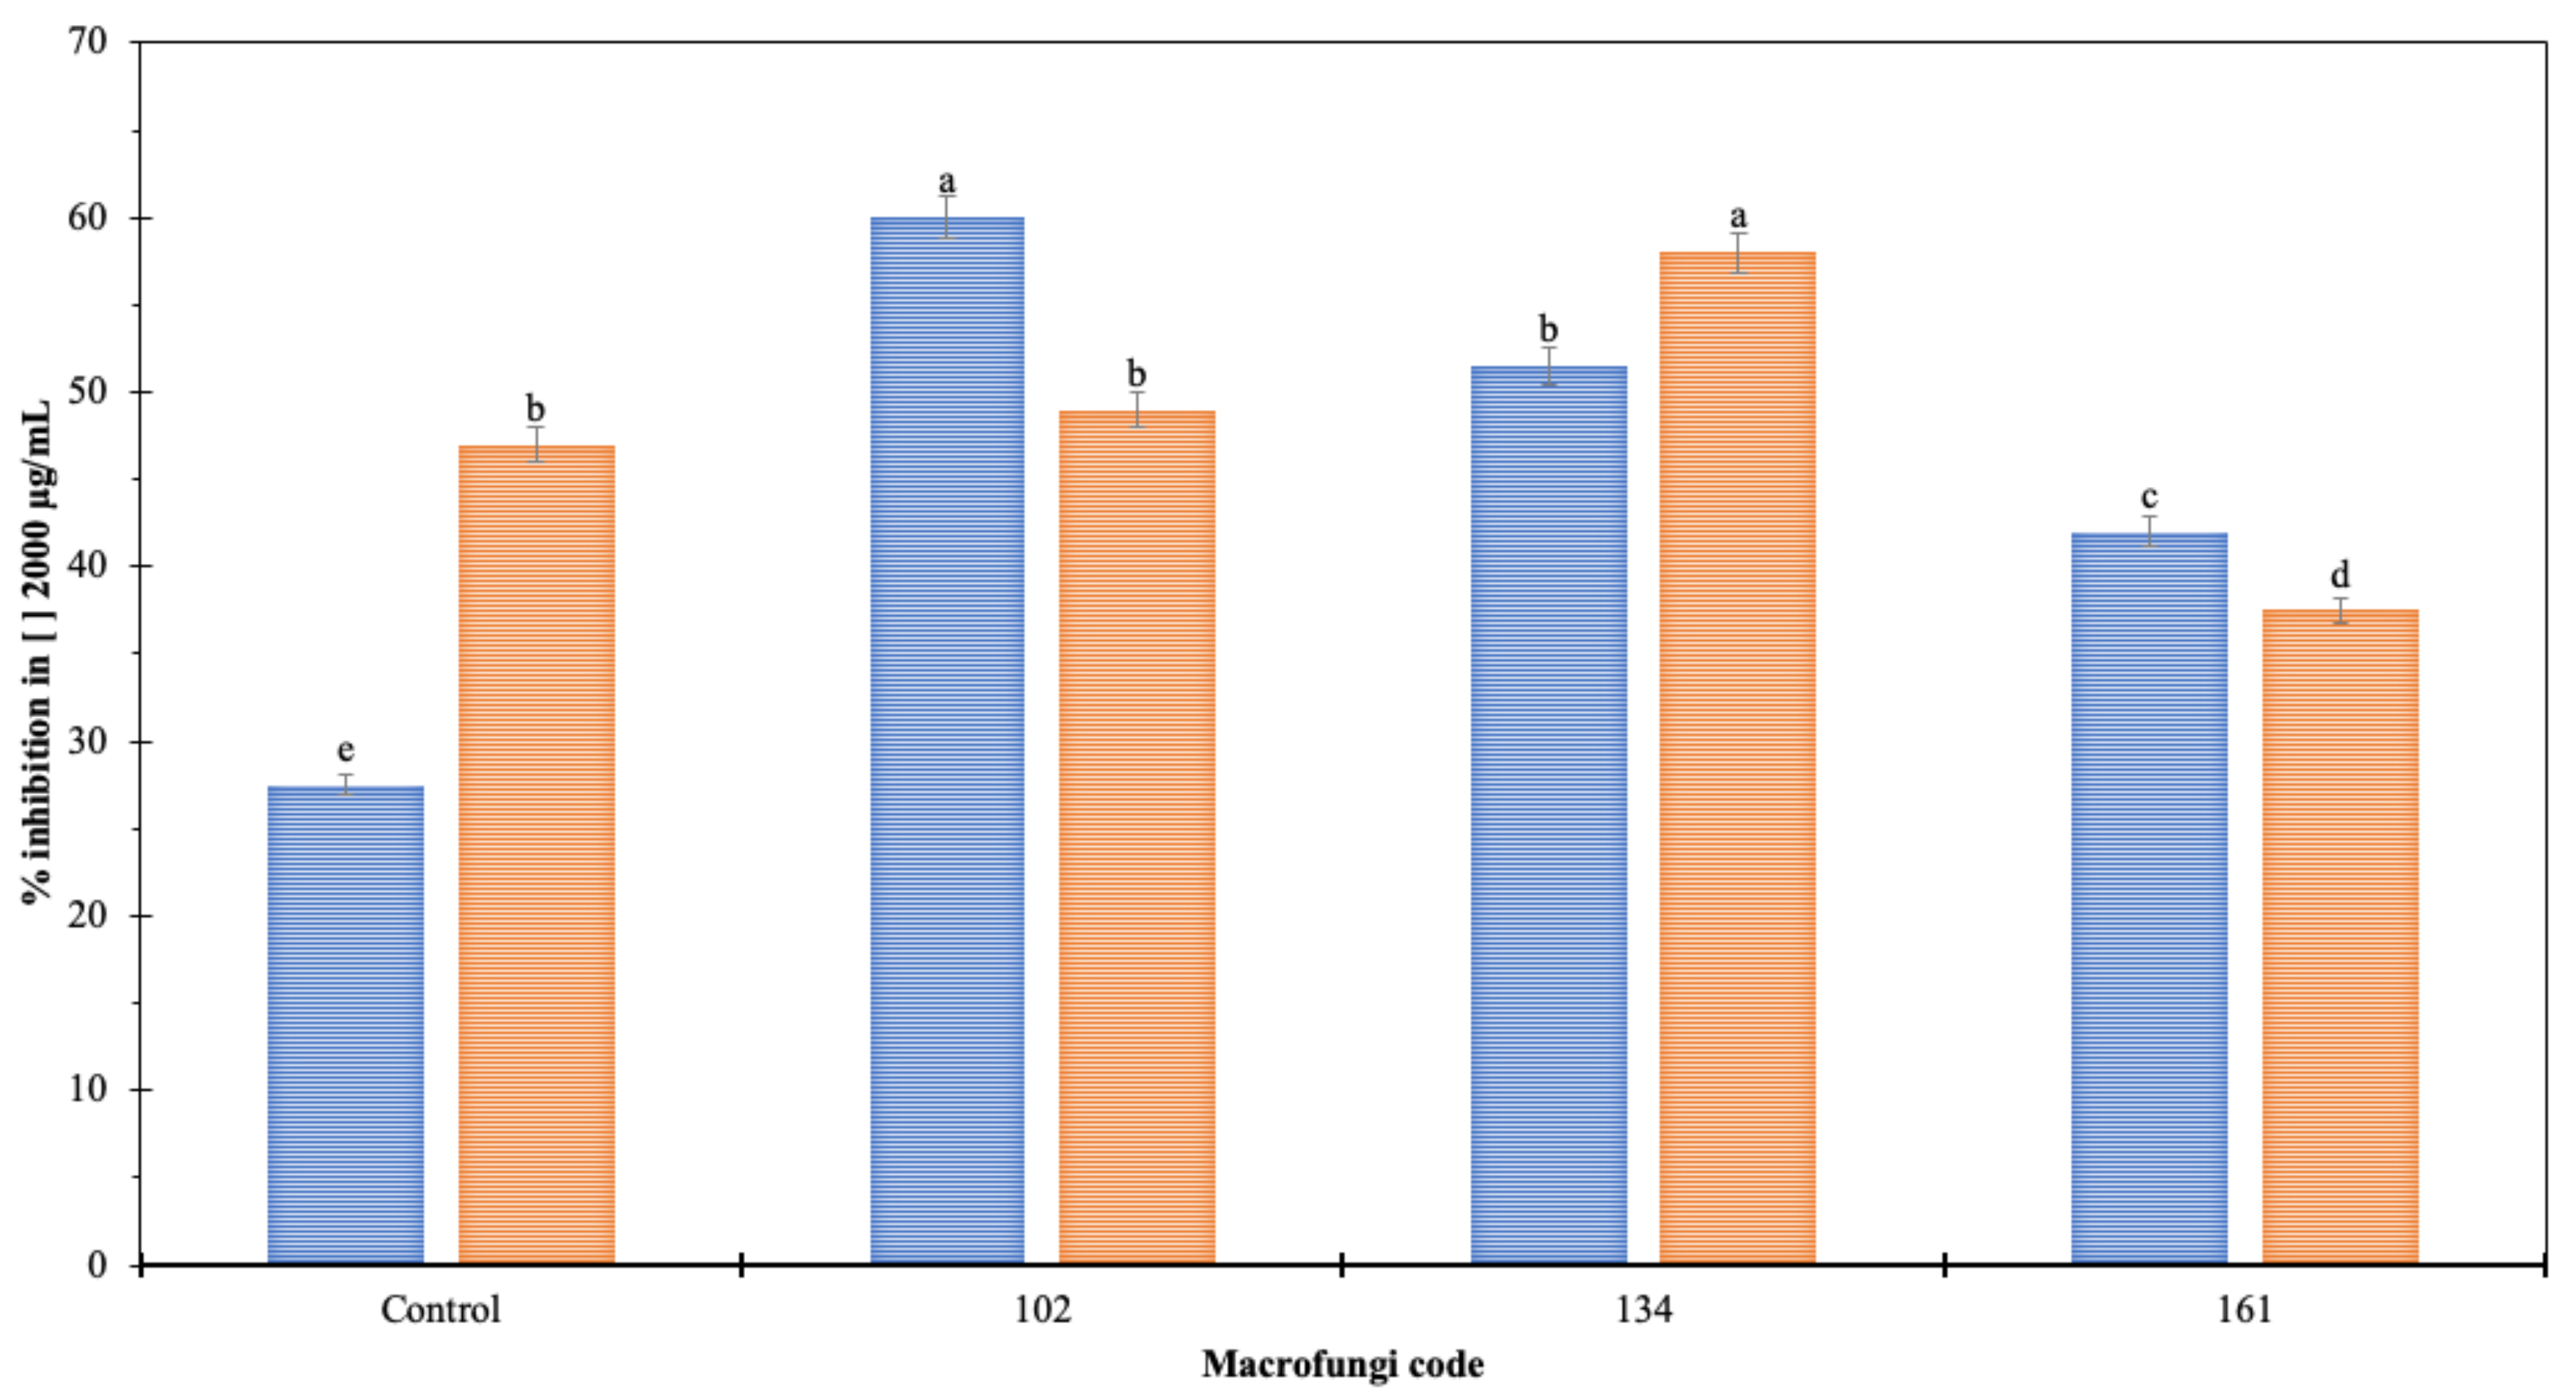
Figure 2 displays the results of cellular antioxidant activity (CAA) for extracts from flour samples. Concentrations ranging from 500 to 2000 µg/mL were tested, but only the highest concentration inhibited cell oxidation. The highest percentage of inhibition at this concentration was 60 ± 0.4% for sample 102F, which was not statistically different from the results obtained for sample 134AF, where the percentage of inhibition was approximately 58%.
Only a limited number of studies have evaluated cellular antioxidant activity concerning fermentative processes. When compared with other studies on fermentation-derived antioxidants, the CAA levels observed for sample 102F at 2 mg/mL (≈60% inhibition) are within the range reported for purified ferulic acid from fermented wheat bran and polysaccharide-rich extracts from Inonotus hispidus solid-state cultures, evaluated in cellular or ex vivo oxidative stress models. This suggests that macrofungal fermentation of bean and rice co-products can generate extracts with cellular antioxidant activity similar to that obtained from more conventional cereal-based substrates Yin et al. [20] extracted ferulic acid from wheat bran fermented in a solid state with Aspergillus niger, obtaining a purity of 93.8%. They tested the potential for inhibition of erythrocyte hemolysis using the extracted compound at compounds 100 µg/mL, with hemolysis rate of only 15%, indicating an 85% inhibition potential. Liu et al. [21] isolated polysaccharides (IHSFP-1 and IHSFP-2) from the solid-state fermentation substrate with Inonotus hispidus, a mushroom species, and evaluated their potential to reduce H2O2-induced cellular damage in liver cells. At a concentration of 2 mg/mL of IHSFP-2, they observed an increase in cell survival rate to approximately 88%. These studies underscore the significance of characterizing fermentation products, and the antioxidant potential of substances derived from them. This selective bioconversion highlights the potential of fungal treatment as a biotechnological strategy to enhance the bioactive profile of plant-based food matrices.

3.2. Multivariate Analysis and Correlations of Global Responses

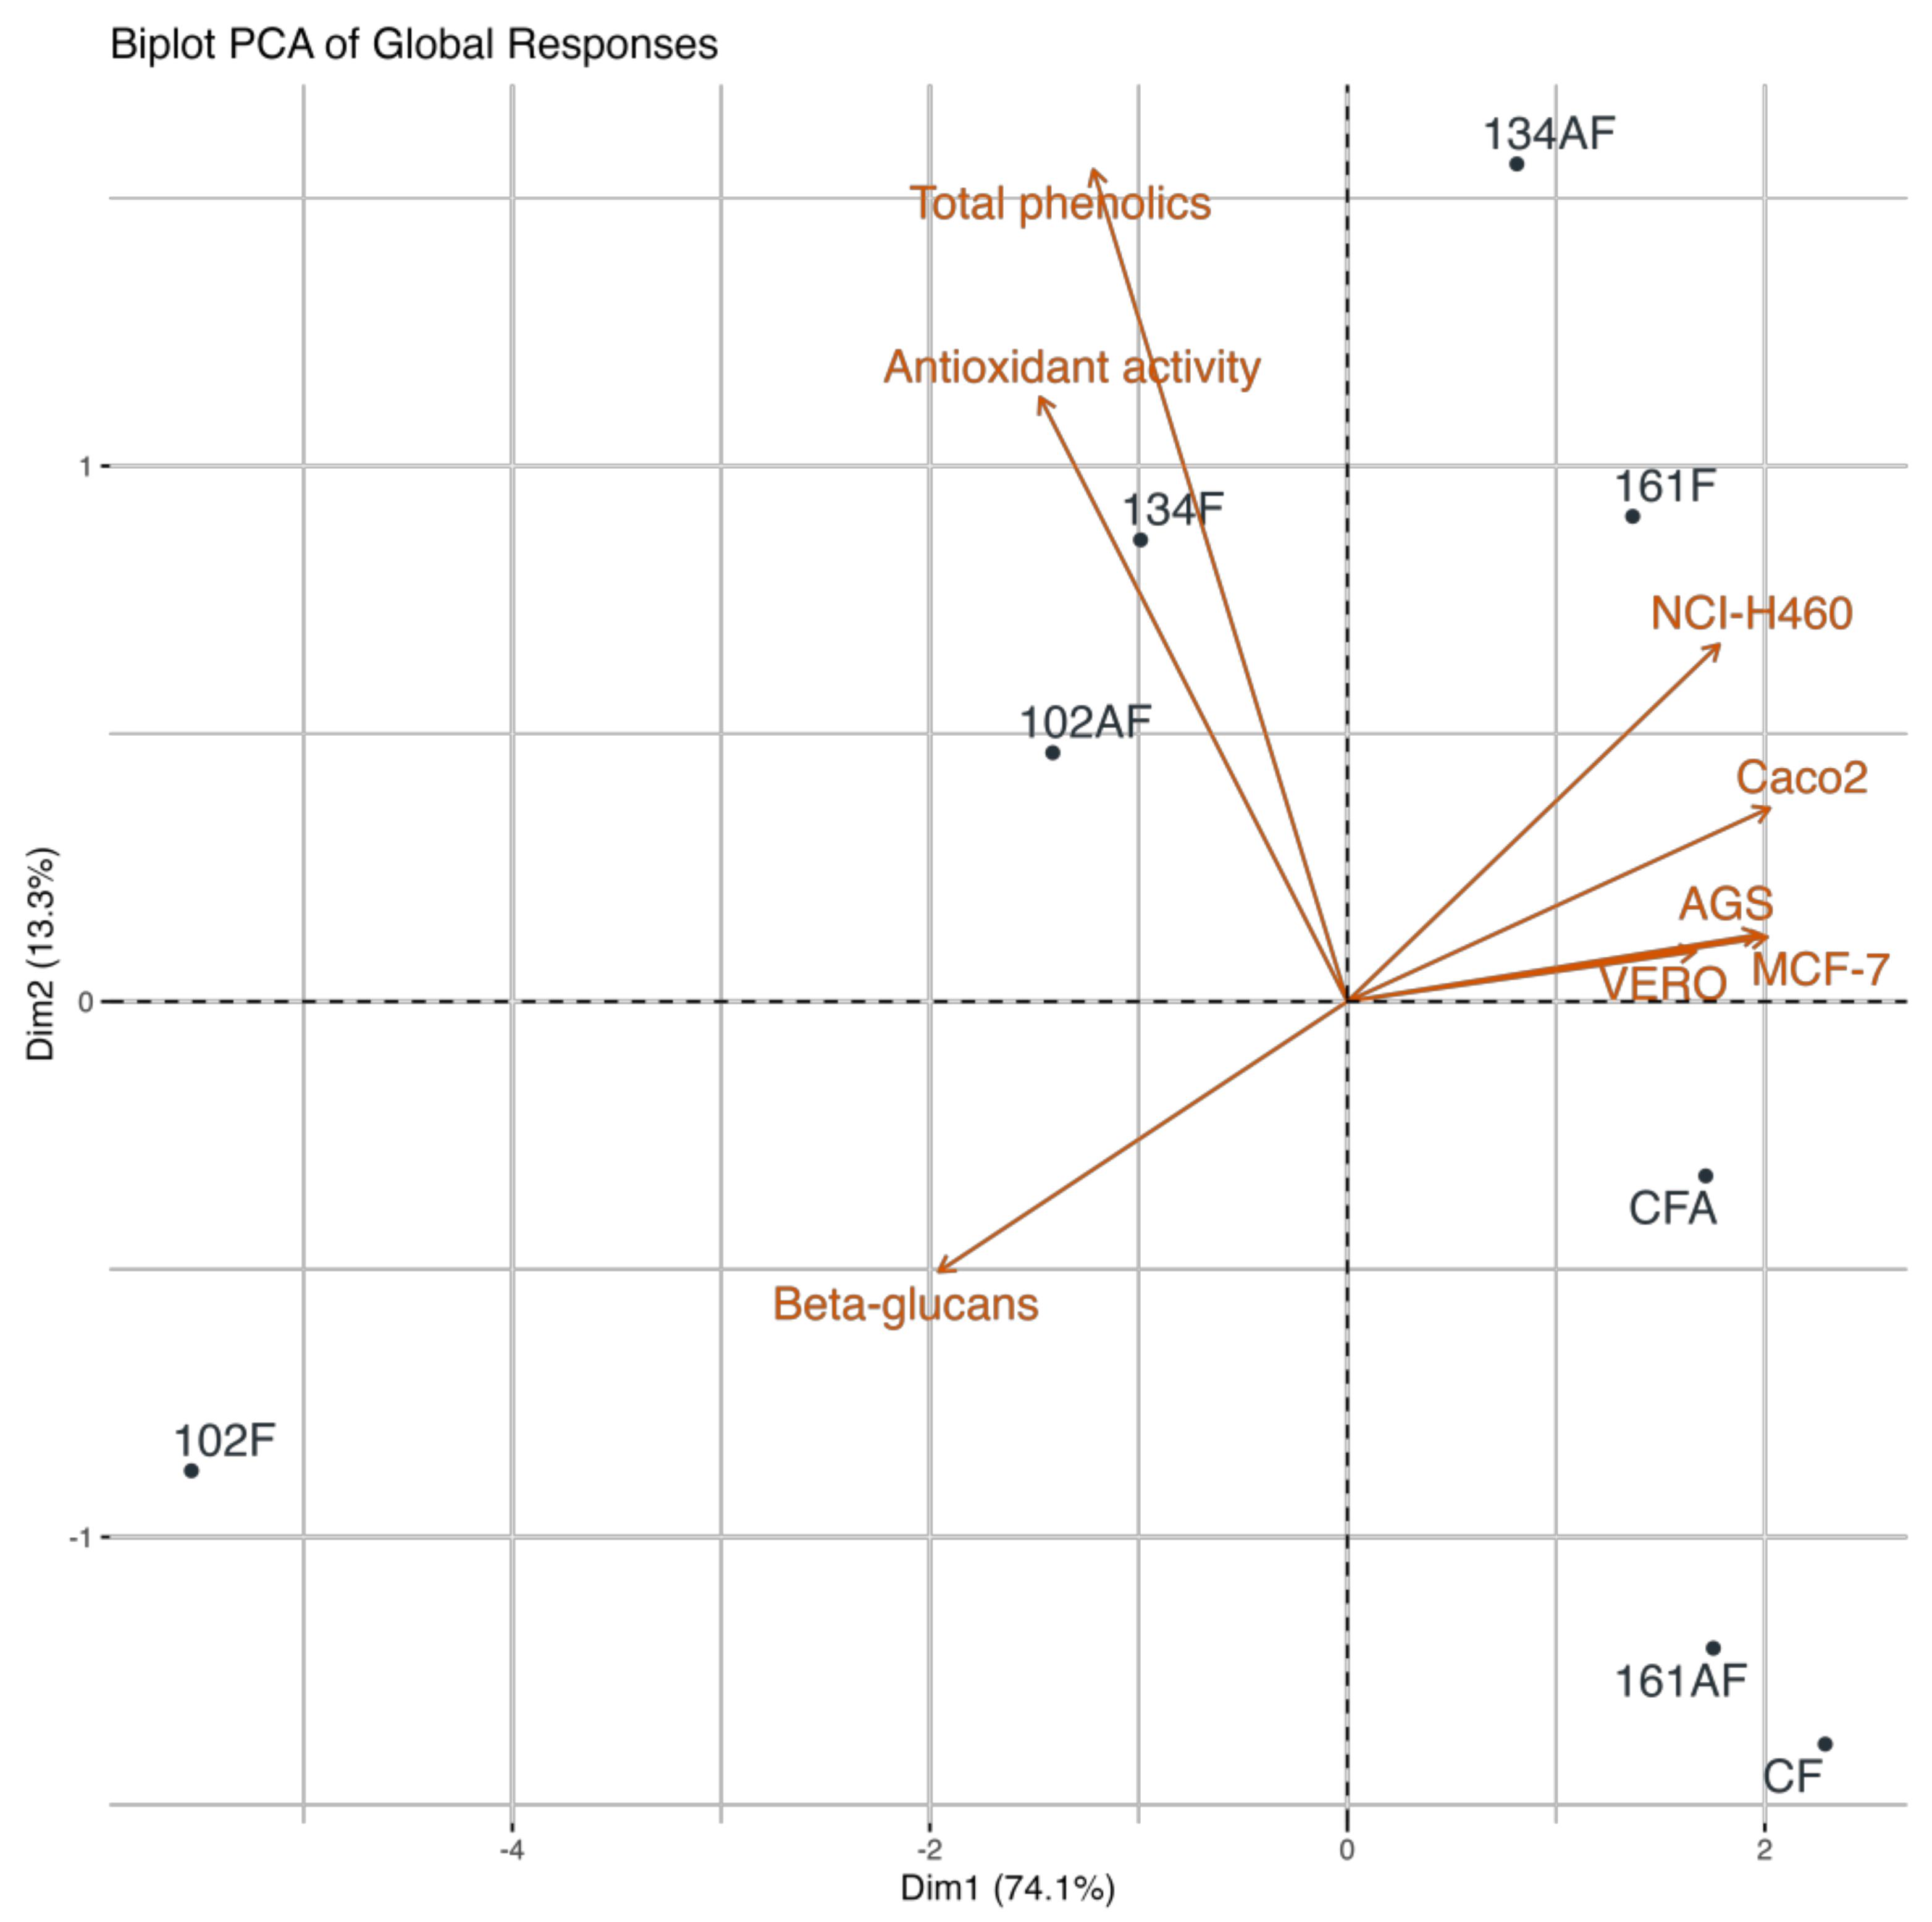
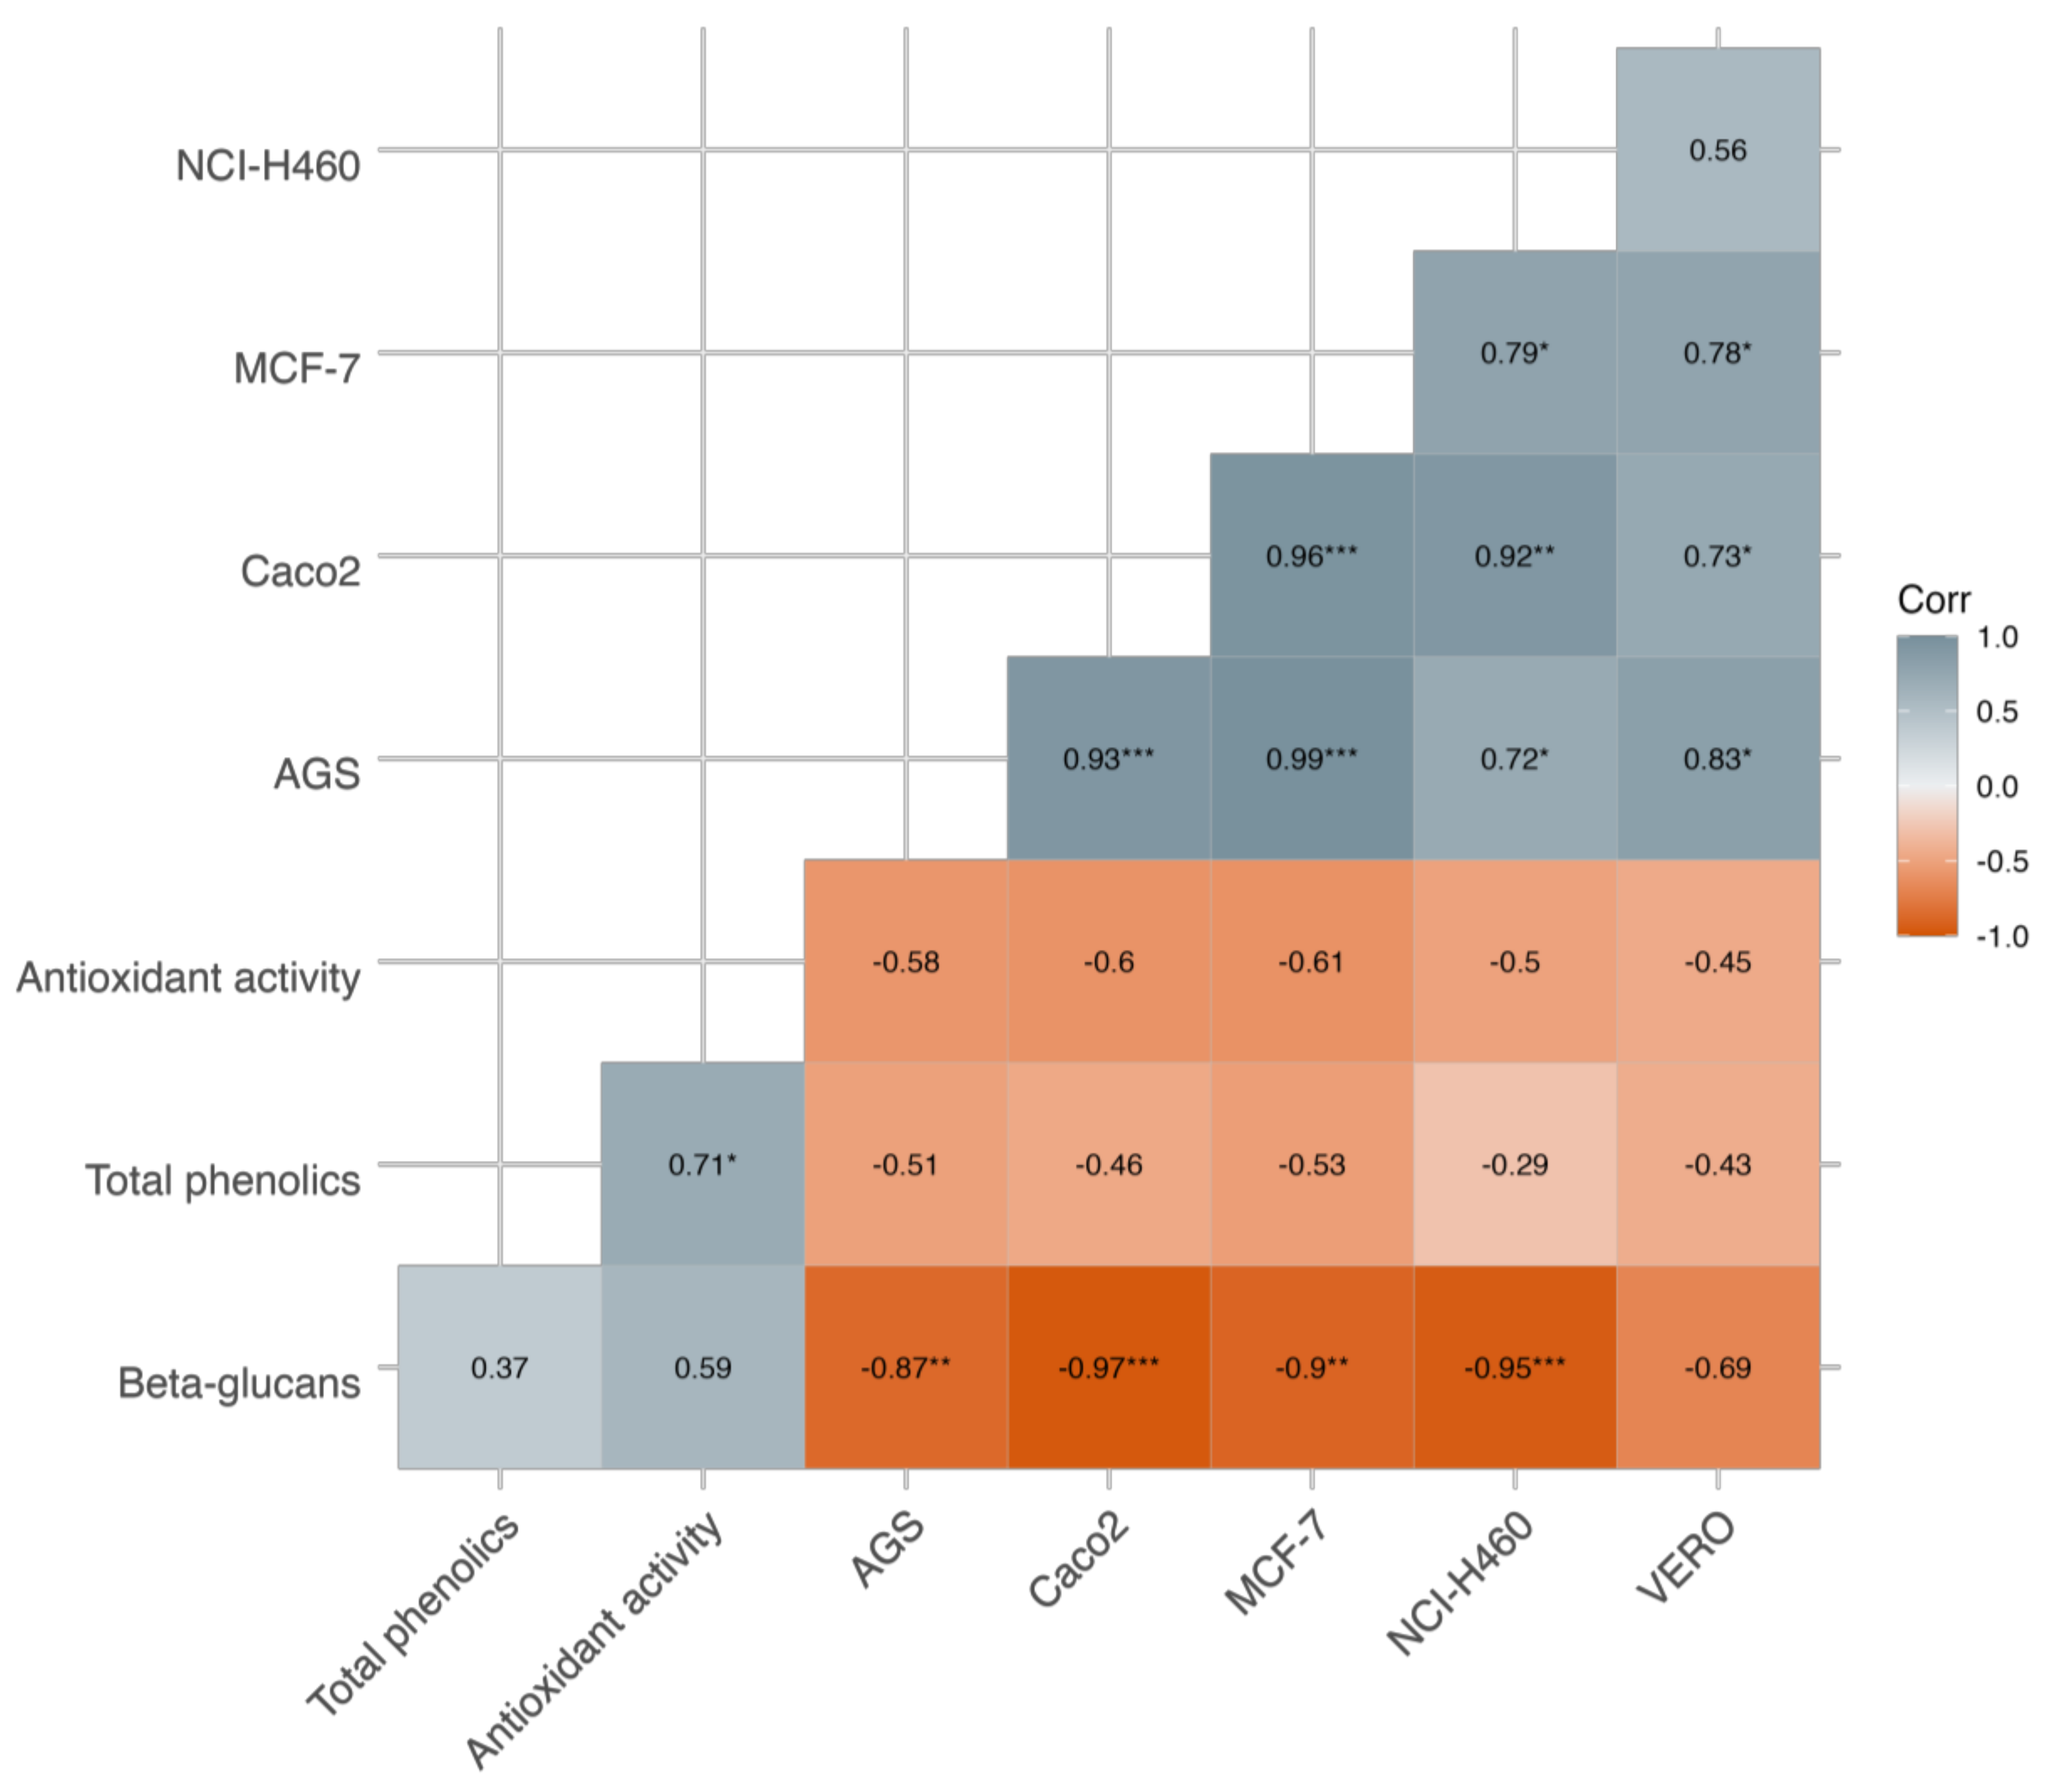
The principal component analysis (PCA) presented in Figure 3 captured a significant proportion of the experimental variability, with the first component (PC1) accounting for 74.1% and the second component (PC2) explaining 13.3% of the total variance. The PCA plot reveals a clear separation of variables: cellular assays cluster on the right side, while total phenolics, β-glucans, and antioxidant activity are distributed on the left. Notably, total phenolics and antioxidant activity follow the same directional trend, suggesting a strong interrelation between these bioactive compounds. Figure 4 summarizes the Pearson’s correlation coefficients between bioactive compounds, β-glucans and cellular responses, highlighting the strong negative associations between β-glucans and most tumor cell lines. Furthermore, β-glucans exhibit an almost perfect negative correlation with cellular responses, a trend further confirmed by Pearson’s correlation analysis (Figure 4). Specifically, antioxidant activity and phenolics display a moderate positive correlation (r = 0.71), whereas the various cellular assays are highly correlated with each other (ranging from r = 0.56 to r = 0.99). In contrast, β-glucans show a strong negative correlation with most cell lines (values close to −0.9, except for VERO, which presents −0.69), and the relationship between β-glucans and phenolic compounds is weak.
These findings reinforce the role of β-glucans in cytotoxic activity against tumor cells, potentially through immune activation and inhibition of cell proliferation. Additionally, their function as soluble dietary fibers highlights their potential for functional food applications, particularly in gut health improvement.
The enhancement in bioactive compounds in bean and rice flours through macrofungal solid-state fermentation suggests promising applications for the food and nutraceutical industries. The increased levels of β-glucans and phenolic compounds indicate that these fermented flours could be incorporated into functional food products aimed at improving gut health, immune function, and antioxidant capacity. In particular, β-glucans have been widely recognized for their role in modulating the immune response and lowering cholesterol levels, making these flours potential ingredients for health-oriented formulations [22].
In addition to their enhanced nutritional profile, these fermented flours present a promising alternative as sustainable protein sources for plant-based food applications. The enzymatic activity during fermentation is likely to improve both digestibility and amino acid composition, supporting their potential use in meat substitutes, high-protein bakery goods, and functional beverages—key sectors in the expanding alternative protein market.
Despite these advantages, large-scale implementation of this process requires further investigation. Factors such as cost effectiveness, sensory attributes, and consumer acceptance must be assessed to ensure commercial viability. Additionally, potential changes in flavor and texture due to fungal metabolism should be analyzed to maintain product appeal. Food safety concerns, including microbial stability and allergenicity, must also be considered before commercialization. Future studies should explore these aspects to bridge the gap between laboratory findings and real-world applications.
The results of glucan (total, α, and β) quantification are presented in Figure S1 in the Supplementary Materials. By observing Figure S1, it becomes evident that the sample 102F, corresponding to broken beans cultivated with F. hepatica, exhibited the highest β-glucan content (p < 0.05), with a concentration of 50.75 mg/g of flour. Samples 102AF and 134F were closely followed in the second position, with approximately 11 mg of β-glucans per g of flour. Several studies have focused on quantifying and production of fungal β-glucans. For instance, Ji & Ra [23], obtained an impressive 9.34% (w/w), around 93 mg/g, of β-glucans in solid-state fermentation of brown rice with Aspergillus oryzae, surpassing the results found here. Lee & Ra [24] optimized the solid-state fermentation of hulled barley, considering several responses, including β-glucans. Although the β-glucan content found in sample 102F (50.75 mg/g flour) was lower than the values reported for brown rice and barley solid-state fermentations with Aspergillus oryzae (up to 93 mg/g and 14.6% w/w, respectively), it still represents a marked enrichment when compared with typical legume and cereal matrices. In addition, the use of agro-industrial co-products as substrates positions the present approach closer to circular economy strategies than studies relying exclusively on refined grains. They increased the β-glucan content from 3.03% (w/w) to 14.6% (w/w), demonstrating the potential for process optimization in this regard. Fungal glucans are polymers of D-glucopyranose with variable structures and are integral components of mycelia, fruiting bodies, and other parts of micro- or macromycetes [25]. Beta-glucans have shown anticarcinogenic activity, immunity-stimulating effects, and roles in various physiological processes in the human body. Consequently, their presence in the samples is highly desirable [22].

3.3. Selectivity Index Assessment in Cellular Assays

Only samples cultivated with macrofungi showed cytotoxicity against the studied cells, suggesting that this property may be linked to fungal mycelium present in the sample or secondary metabolites from fermentation, rather than the substrates themselves. The results, expressed as GI50, (extract concentration inhibiting 50% of cell growth) were used to calculate a selectivity index (SI) in order to evaluate treatment efficacy against tumor cell lines while preserving those that should remain unaffected. The resulting heatmap (Figure S2) demonstrates that samples with high selectivity index values across multiple cell lines represent promising candidates for therapeutic applications. Specifically, three fungi fermentations were identified: 102F (with selectivity index between 1.47–10.15), 134F (0.95–1.92), and 102AF (0.63–1.3), with 102F exhibiting the most pronounced effect, particularly against CaCo2 and MCF-7 cell lines with values of selectivity index of 10.15 and 5.19, respectively. These results support the hypothesis that certain strains may be prioritized for further studies, as they achieve an optimal balance between reducing tumor cell viability and preserving non-target cell lines.
However, samples with SI values lower than 1 showed higher cytotoxicity against VERO cells (monkey kidney cells) than that of the specific carcinogenic cell line calculated; therefore, although this result presents an immediate drawback, it must be leveraged the other potential benefits.
Previous studies have reported cytotoxic and antiproliferative activities of lupine, quinoa, and wheat extracts, previously fermented with probiotic bacteria, against CaCo2 and MCF-7 cells. The results were expressed as the percentage (%) of inhibition after 72 h of incubation, reaching 71% for fermented lupin. The cytotoxic and antiproliferative activities were attributed to the production of bioactive peptides and polysaccharides during bacterial growth [26,27]. In contrast, Spaggiari et al. [12] tested three crop side streams (from rice and sunflower) and the products of fermentation with dikaryotic and monokaryotic strains of Pleurotus sapidus against tumor (MCF-7, NCI-H460, HeLa, and HepG2) and non-tumor (PLP2—porcine liver primary cells) cell lines to assess possible cytotoxicity. The selective cytotoxic effects observed for 102F, particularly against CaCo2 and MCF-7 cells, are consistent with previous reports showing that fermentation processes can enhance the antiproliferative potential of cereal and legume-based products. In probiotic-fermented lupin, quinoa and wheat, Ayyash et al. [26] reported inhibition percentages up to 71% against CaCo2 and MCF-7 cells after 72 h, which were attributed to bioactive peptides and polysaccharides generated during fermentation. Conversely, Spaggiari et al. [12] described mostly non-cytotoxic profiles for rice and sunflower side streams fermented with Pleurotus sapidus, highlighting that both substrate composition and fungal strain strongly influence the balance between safety and bioactivity. Within this context, the high SI values obtained for 102F suggest that macrofungal fermentation of bean co-products can yield extracts with selective antitumor potential comparable to the best-performing fermented legume systems described so far. Only the extract obtained from non-fermented sunflower seed hulls (SHs) showed cytotoxic effects against HeLa tumor cells (GI50 value of 292 ± 18 μg/mL), while the remaining samples had GI50 values greater than 400 μg/mL. The authors associated the observed cytotoxicity in SHs with the highest content of phenolic compounds in the sample.

3.4. Amino Acid Profile and Proteolytic Enzymatic Activity

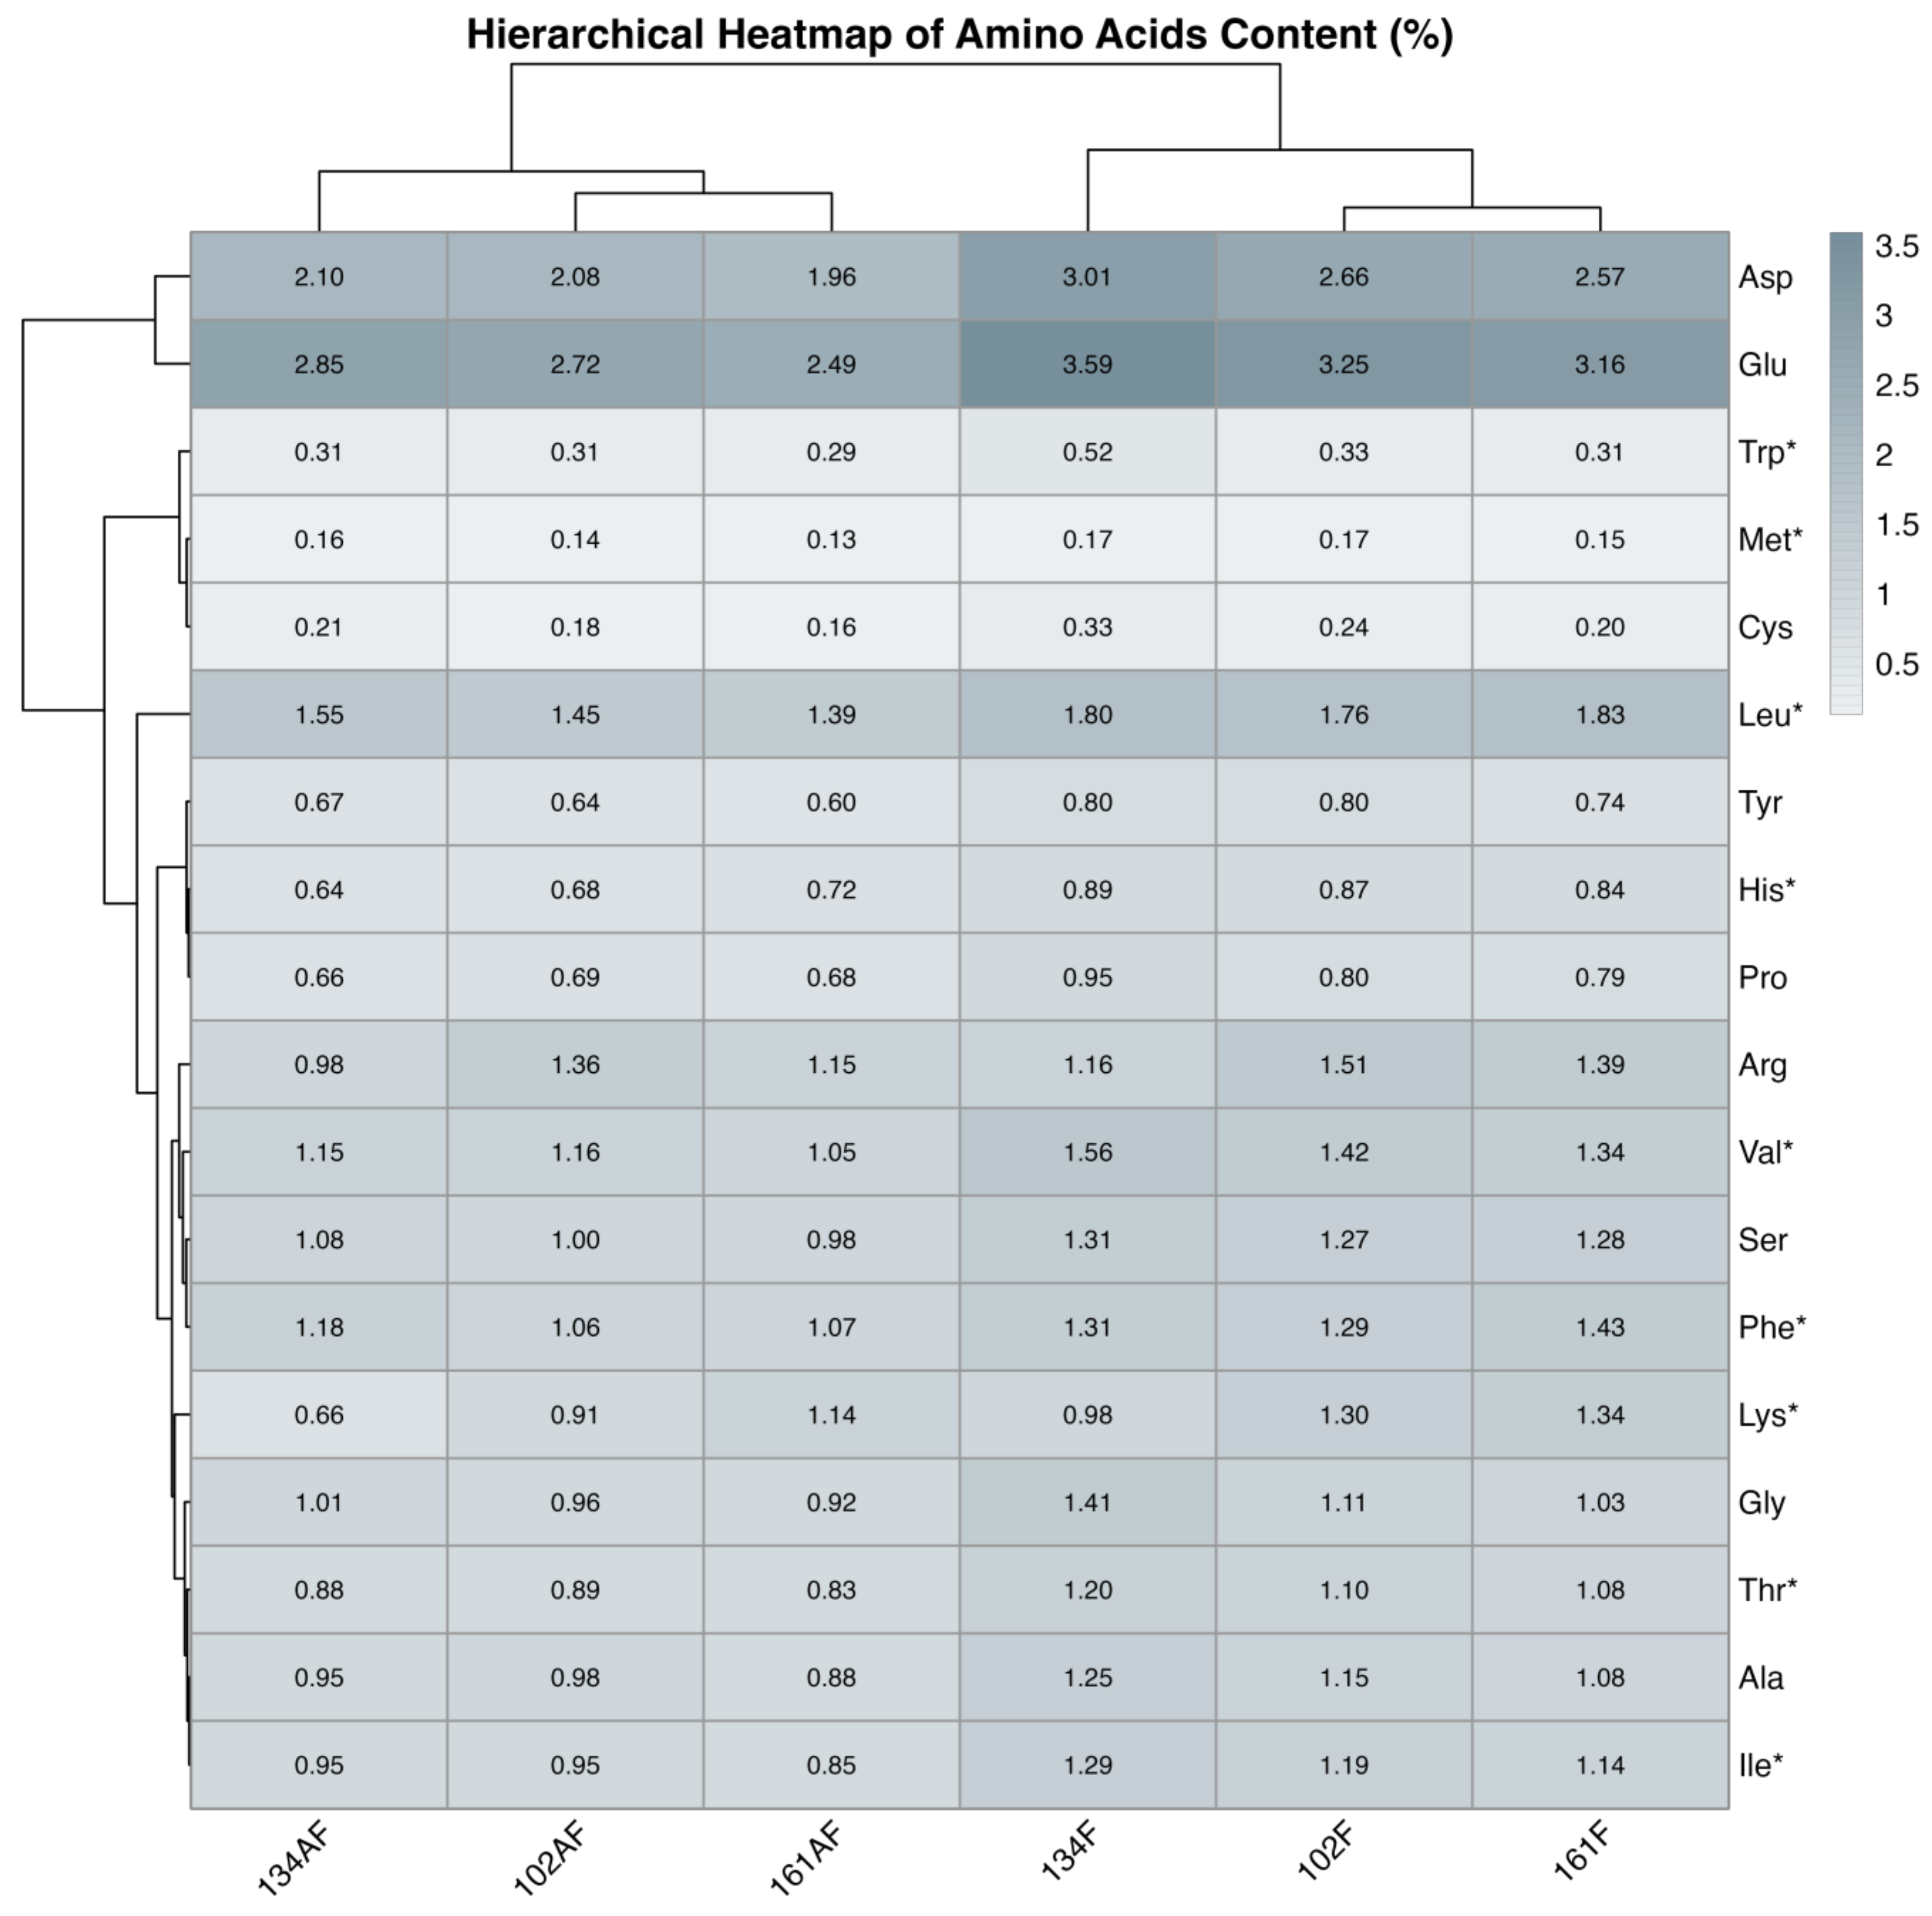
The heatmap in Figure 5 was generated using hierarchical clustering and Euclidean distances after normalization to visualize the grouping of samples according to their amino acid profiles. The amino acid profile analysis was conducted separately due to the absence of control data. The hierarchical clustering heatmap (Figure 5) revealed a clear distinction between samples fermented exclusively with beans and those obtained from the combination of beans and rice. This separation is likely due to the inherently higher protein content in beans, which, when subjected to enzymatic proteolysis during fermentation, facilitates the release and accumulation of free amino acids. Among them, Asp, Glu, and Leu were the most abundant. The presence of high proteolytic activity is consistent with a robust fermentation process and may have implications for nutrient bioavailability and the generation of bioactive peptides.
The results of amino acid quantification, including essential amino acids such as threonine, valine, methionine, isoleucine, leucine, phenylalanine, lysine, and tryptophan, are presented. Unfortunately, there were no available data regarding the amino acid composition of the control samples. This lack of control measurements prevents a direct within-experiment comparison between non-fermented and fermented samples and should be considered a major limitation of the present study. However, when compared to the literature data, the fermented products displayed higher concentrations of essential amino acids than those found in various types of carioca beans [28,29]. For example, sample 161F, fermented with L. cinccinatus, reached a maximum concentration of 1.83% for leucine, while the highest value in different types of carioca beans was 0.76% (after unit conversion). These increases agree with previous observations that fermentation and processing can improve the amino acid profile and protein quality of common beans by enhancing protein digestibility and altering the relative abundance of essential amino acids. However, the absence of experimental control data for non-fermented samples in the present work means that these improvements must be interpreted primarily in relation to literature values rather than to direct internal controls.
It is worth noting that methionine, an essential sulfur amino acid, is typically found in low concentrations in beans but is commonly present in rice. Therefore, the combination of rice and beans serves as a complementary source of amino acids and warrants further studies. Methionine, along with other amino acids, acts as a precursor to glutathione, playing a vital role in hepatic drug detoxification [30]. Additionally, it is observable that, apart from tryptophan, other essential amino acids tend to be more concentrated in samples obtained from broken beans than in those obtained from the mixture, underscoring the substantial influence of the substrate on the results. It should also be highlighted that amino acid data were obtained from single determinations per sample, which may increase analytical variability and should be considered when interpreting small differences among treatments.

3.5. Strain Selection and Final Considerations

It is noteworthy that samples cultivated with macrofungi also contain ergosterol in their composition (quantified in previous studies, unpublished data). This compound serves as a precursor of vitamin D and possesses confirmed antioxidant, anti-inflammatory, and antimicrobial properties. Future investigations should also consider evaluating the production of other polysaccharides and peptides during fermentation as potential bioactive compounds.
By integrating the information from multivariate, correlation, and compound profile analyses, it can be proposed that the 102F sample (Fistulina hepatica) emerges as the primary candidate for future applications. This sample not only exhibited significantly high β-glucan content but also demonstrated a favorable cellular response in combination with high phenolic concentrations and antioxidant activity. Additionally, the 102AF sample could also be considered, particularly in the context of bean–rice mixtures, as it exhibited consistent cellular responses and a competitive amino acid profile. Overall, the combined enrichment in β-glucans, phenolic compounds and essential amino acids observed in the present study is in line with the general trend reported for cereal and legume substrates subjected to fungal or bacterial fermentation, but extends this evidence to underutilized co-products of carioca bean and rice processed by macrofungi, a combination that has been scarcely explored to date.
In summary, the results support the hypothesis that macrofungal fermentation can effectively modulate the biochemical and biological profile of the samples. β-glucans and proteolytic enzymatic activity play crucial roles in generating antitumor effects and transforming the protein matrix, opening new perspectives for the development of innovative therapeutic and nutritional strategies. These findings provide strong evidence for strain and treatment selection, underscoring the relevance of these processes in applied biotechnology.

4. Conclusions

Solid-state fermentation of bean and rice co-products significantly increased the content of β-glucans and phenolic compounds in the resulting flour. Consequently, fermented samples showed enhanced cellular antioxidant activity and cytotoxic effects. Particularly, flours from F. hepatica-fermented broken beans and P. sanguineus-fermented beans, as well as mixed bean–rice co-products with F. hepatica, exhibited the highest cytotoxicity and antioxidant activity. Principal component analysis underscored the positive correlation between bioactivity and the presence of specific compounds, such as β-glucans, ferulic acid, and ellagic acid. These findings suggest the potential of these compounds as bioactive agents.
Future studies should prioritize optimizing the production of peptides and bioactive polysaccharides during fermentation, aiming to further improve the nutritional and functional properties of these co-products. Additionally, isolating and characterizing specific bioactive compounds with demonstrated health benefits could broaden their potential applications in functional foods, pharmaceuticals, and plant-based protein innovations. To facilitate commercial adoption, it is essential to assess the sensory attributes, stability, and cost effectiveness of these fermented flours, ensuring their viability for large-scale production. Furthermore, additional research is required to evaluate the potential applications of this fermented flour in food production. This should include an assessment of the impact of cultivating macrofungi on the sensory characteristics of the flour produced with these fermented co-products.


Supplementary Materials

The following supporting information can be downloaded at: https://www.mdpi.com/article/10.3390/app16115334/s1, Figure S1: Heatmap of Phenolic compounds; Figure S2: Selectivity index heatmap; Table S1: Content of each phenolic compound and total phenolics of flours from bean and rice co-products cultivated with macrofungi; Table S2: Cytotoxicity of extracts of flours from bean and rice co-products, fermented and non-fermented; Table S3: Amino acid profile (%) of flours from bean and rice co-products cultivated with macrofungi.

Author Contributions

S.C.F.: Conceptualization, Data Curation, Formal Analysis, Investigation, Methodology, Writing—Original Draft; B.M.: Data Curation, Formal Analysis, Writing—Original Draft; D.W.: Writing—Review and Editing, T.C.F.: Investigation, Methodology; Writing—Methodology, Review and Editing, G.C.d.S.: Investigation, Writing—Methodology; R.C.C.: Investigation, Methodology; F.G.d.S.: Writing—Review and Editing, Conceptualization, Funding Acquisition; P.Z.B.: Conceptualization, Writing—Review and Editing, Funding Acquisition and Supervision; L.B.: Writing—Review and Editing, Funding Acquisition and Supervision. All authors have read and agreed to the published version of the manuscript.

Funding

This research was funded by the Foundation for Science and Technology (FCT, Portugal) through national funds FCT/MCTES (PIDDAC), within the projects CIMO (UIDB/00690/2020 and UIDP/00690/2020) and SusTEC (LA/P/0007/2020).

Data Availability Statement

Data Availability Statement: The statistically analyzed datasets generated during the current study are publicly available in the GitHub repository https://github.com/Bruno-melgar/Beans2/ (accessed on 5 February 2026). The complete data-processing pipeline is also available at this repository.

Acknowledgments

The authors are grateful to the Foundation for Science and Technology (FCT, Portugal) for financial support through national funds FCT/MCTES (PIDDAC) to CIMO (UIDB/00690/2020 and UIDP/00690/2020) and SusTEC (LA/P/0007/2020). L. Barros thanks the national funding by FCT, P.I. and S. C. Frantz thanks the Coordenação de Aperfeiçoamento de Pessoal de Nível Superior—Brasil (CAPES)—Finance Code 001. P. Z. Bassinello thanks the National Council for Scientific and Technological Development (CNPq)/Finance process 308574/2022-2.

Conflicts of Interest

The authors declare no conflict of interest.

References

  1. Lu, H.; Lou, H.; Hu, J.; Liu, Z.; Chen, Q. Macrofungi: A review of cultivation strategies, bioactivity, and application of mushrooms. Compr. Rev. Food Sci. Food Saf. 2020, 19, 2333–2356. [Google Scholar] [CrossRef] [PubMed]
  2. Rathore, H.; Prasad, S.; Kapri, M.; Tiwari, A.; Sharma, S. Medicinal importance of mushroom mycelium: Mechanisms and applications. J. Funct. Foods 2019, 56, 182–193. [Google Scholar] [CrossRef]
  3. Michalska, A.; Sierocka, M.; Drzewiecka, B.; Świeca, M. Antioxidant and Anti-Inflammatory Properties of Mushroom-Based Food Additives and Food Fortified with Them—Current Status and Future Perspectives. Antioxidants 2025, 14, 519. [Google Scholar] [CrossRef] [PubMed]
  4. Vaz, J.A.; Barros, L.; Martins, A.; Morais, J.S.; Vasconcelos, M.H.; Ferreira, I.C.F.R. Phenolic profile of seventeen Portuguese wild mushrooms. LWT Food Sci. Technol. 2011, 44, 343–346. [Google Scholar] [CrossRef]
  5. Duan, Y.; Qi, J.; Gao, J.; Liu, C. Bioactive components of Laetiporus species and their pharmacological effects. Appl. Microbiol. Biotechnol. 2022, 106, 5929–5977. [Google Scholar] [CrossRef]
  6. Wilson, C.M.; Rich Milton, R.D.; Mary Jhane, G.V.; Renato, G.R. Mycelial biomass and biological activities of Philippine mushroom Pycnoporus sanguineus in time-course submerged culture. J. Appl. Biol. Biotechnol. 2020, 8, 88–93. [Google Scholar] [CrossRef]
  7. Fidalgo, O. Conhecimento micológico dos índios brasileiros. Rickia 1965, 2, 1–10. [Google Scholar]
  8. Petrović, N.; Tosti, T.; Srbljak, I.; Đurić, A.; Kosanić, M. Biochemical characterization and bioactivity of methanolic and acetonic extracts of Laetiporus sulphureus basidiocarps. J. Food Meas. Charact. 2023, 17, 1748–1763. [Google Scholar] [CrossRef]
  9. Stoffel, F.; Santana, W.d.O.; Gregolon, J.G.N.; Kist, T.B.L.; Fontana, R.C.; Camassola, M. Production of edible mycoprotein using agroindustrial wastes: Influence on nutritional, chemical and biological properties. Innov. Food Sci. Emerg. Technol. 2019, 58, 102227. [Google Scholar] [CrossRef]
  10. Stoffel, F.; Santana, W.D.O.; Fontana, R.C.; Gregolon, J.G.N.; Kist, T.B.L.; De Siqueira, F.G.; Mendonça, S.; Camassola, M. Chemical features and bioactivity of grain flours colonized by macrofungi as a strategy for nutritional enrichment. Food Chem. 2019, 297, 124988. [Google Scholar] [CrossRef]
  11. Lopes, C.; Ferruccio, C.A.; de Albuquerque Sales, A.C.; Tavares, G.M.; de Castro, R.J.S. Effects of processing technologies on the antioxidant properties of common bean (Phaseolus vulgaris L.) and lentil (Lens culinaris) proteins and their hydrolysates. Food Res. Int. 2023, 172, 113–190. [Google Scholar] [CrossRef]
  12. Spaggiari, M.; Dall’Asta, C.; Galaverna, G.; del Castillo Bilbao, M.D. Rice bran by-product: From valorization strategies to nutritional perspectives. Foods 2019, 10, 85. [Google Scholar] [CrossRef] [PubMed]
  13. Lucas, B.; Sotelo, A. Effect of different alkalies, temperature, and hydrolysis times on tryptophan determination of pure proteins and of foods. Anal. Biochem. 1980, 109, 192–197. [Google Scholar] [CrossRef]
  14. White, J.; Hart, R.J.; Fry, J.C. An Evaluation of The Waters Pico-Tag System for the Amino-Acid-Analysis of Food Materials. J. Autom. Chem. 1986, 8, 170–177. [Google Scholar] [CrossRef]
  15. Bessada, S.M.F.; Barreira, J.C.M.; Barros, L.; Ferreira, I.C.F.R.; Oliveira, M.B.P.P. Phenolic profile and antioxidant activity of Coleostephus myconis (L.) Rchb.f.: An underexploited and highly disseminated species. Ind. Crops Prod. 2016, 89, 45–51. [Google Scholar] [CrossRef]
  16. Wolfe, K.L.; Liu, R.H. Cellular Antioxidant Activity (CAA) Assay for Assessing Antioxidants, Foods, and Dietary Supplements. J. Agric. Food Chem. 2007, 55, 8896–8907. [Google Scholar] [CrossRef] [PubMed]
  17. Sousa, Z.L.; de Oliveira, F.F.; da Conceição, A.O.; Silva, L.A.; Rossi, M.H.; Santos Jda, S.; Andrioli, J.L. Biological activities of extracts from Chenopodium ambrosioides Lineu and Kielmeyera neglecta Saddi. Ann. Clin. Microbiol. Antimicrob. 2012, 11, 20. [Google Scholar] [CrossRef]
  18. Telles, A.C.; Kupski, L.; Furlong, E.B. Phenolic compound in beans as protection against mycotoxins. Food Chem. 2017, 214, 293–299. [Google Scholar] [CrossRef]
  19. Bento, J.A.C.; Pinto, J.V.; Brazaca, S.G.C.; Carvalho, R.N.; Bassinello, P.Z. Nutritional composition, anti-nutritional, and technological properties of flours from Brazilian common bean genotypes. Rev. Bras. De Ciências Agrárias 2023, 18, e3313. [Google Scholar] [CrossRef]
  20. Yin, Z.N.; Wu, W.J.; Sun, C.Z.; Liu, H.F.; Chen, W.B.; Zhan, Q.P.; Lei, Z.G.; Xin, X.; Ma, J.J.; Yao, K.; et al. Antioxidant and Anti-inflammatory Capacity of Ferulic Acid Released from Wheat Bran by Solid-state Fermentation of Aspergillus niger. Biomed. Environ. Sci. 2019, 32, 11–21. [Google Scholar] [CrossRef]
  21. Liu, X.; Hou, R.; Xu, K.; Chen, L.; Wu, X.; Lin, W.; Zheng, M.; Fu, J. Extraction, characterization and antioxidant activity analysis of the polysaccharide from the solid-state fermentation substrate of Inonotus hispidus. Int. J. Biol. Macromol. 2019, 123, 468–476. [Google Scholar] [CrossRef] [PubMed]
  22. Rop, O.; Mlcek, J.; Jurikova, T. Beta-glucans in higher fungi and their health effects. Nutr. Rev. 2009, 67, 624–631. [Google Scholar] [CrossRef]
  23. Bin Ji, S.; Ra, C.H. Coproduction of Enzymes and Beta-glucan by Aspergillus oryzae using Sloid-state fermentation of brown rice. J. Microbiol. Biotechnol. 2016, 31, 1028–1034. [Google Scholar] [CrossRef]
  24. Lee, S.Y.; Ra, C.H. Comparison of Liquid and Solid-State Fermentation Processes for the Production of Enzymes and Beta-Glucan from Hulled Barley. J. Microbiol. Biotechnol. 2022, 32, 317–323. [Google Scholar] [CrossRef]
  25. Ruiz-Herrera, J.; Ortiz-Castellanos, L. Cell wall glucans of fungi. A review. Cell Surf. 2019, 5, 100022. [Google Scholar] [CrossRef]
  26. Ayyash, M.; Johnson, S.K.; Liu, S.-Q.; Mesmari, N.; Dahmani, A.; Al Dhaheri, A.S.; Kizhakkayil, J. In vitro investigations of bioactivities of solid-state fermented lupin, quinoa and wheat using Lactobacillus spp. Food Chem. 2019, 275, 50–58. [Google Scholar] [CrossRef]
  27. Ayyash, M.; Johnson, S.K.; Liu, S.-Q.; Al-Meheiri, A.; Abushelaibi, A. Cytotoxicity, antihypertensive, antidiabetic and antioxidant activities of solid-state fermented lupin, quinoa and wheat by Bifidobacterium species: In-Vitro investigations. LWT 2018, 95, 295–302. [Google Scholar] [CrossRef]
  28. Bento, J.A.C.; Ribeiro, P.R.V.; Bassinello, P.Z.; de Souza Neto, M.A.; Carvalho, R.N.; de Brito, E.S.; Caliari, M.; Júnior, M.S.S. Functional properties and chemical profile of aged carioca beans and cooked under thesteam of autoclave. Ciência Rural. 2023, 53, e20220342. [Google Scholar] [CrossRef]
  29. Rezende, A.A.; Pacheco, M.T.B.; da Silva, V.S.N.; de Ferreira, T.A.P.C. Nutritional and protein quality of dry Brazilian beans (Phaseolus vulgaris L.). Food Sci. Technol. 2017, 38, 421–427. [Google Scholar] [CrossRef]
  30. Reed, D.J.; Orrenius, S. The role of methionine in glutathione biosynthesis by isolated hepatocytes. Biochem. Biophys. Res. Commun. 1977, 77, 1257–1264. [Google Scholar] [CrossRef]
Figure 1. Heatmap of phenolic compounds (mg/g) in fermented and non-fermented flours from bean (F) and bean–rice co-products (AF). 102F, 102AF, 134F, 134AF, 161F, and 161AF correspond to samples fermented with Fistulina hepatica, Pycnoporus sanguineus, and Laetiporus cincinnatus, respectively. CF and CFA represent non-fermented control samples. The color gradient indicates concentration levels, with darker shades representing higher values. Clustering reveals distinct phenolic profiles among treatments.
Applsci 16 05334 g001
Figure 2. Cellular antioxidant activity of extracts of flours from bean and rice co-products, fermented and non-fermented. 102 = samples of flours cultivated with Fistulina hepatica; 134 = samples of flours cultivated with Pycnoporus sanguineus; 161 = samples of flours cultivated with Laetiporus cincinnatus. Means followed by the same letter do not differ statistically from each other (p < 0.05).
Applsci 16 05334 g002
Figure 3. Biplot principal component analysis, individuals (sample codes) and variables (orange lines) representation. CF = Control, broken ‘carioca’ beans without colonization; CFA = Mixture (70% broken ‘carioca’ beans + 20% rice bran + 10% broken rice), without colonization; 102F = flour from broken carioca beans cultivated with Fistulina hepatica; 134F = flour from broken carioca beans cultivated with Pycnoporus sanguineus; 161F = flour from broken carioca beans cultivated with Laetiporus cincinnatus; 102AF = flour from the mixture, cultivated with Fistulina hepatica; 134AF = flour from the mixture, cultivated with Pycnoporus sanguineus; 161AF = flour from the mixture, cultivated with Laetiporus cincinnatus.
Applsci 16 05334 g003
Figure 4. Correlation heatmap of phenotypic parameters across diverse bioactive compounds and cellular models. The heatmap displays correlation coefficients between seven response metrics in all the control and treatment conditions. Color gradient indicates correlation strength and direction, ranging from negative (orange) to positive (blue) associations. Parameters include cell lines antioxidant activity, total phenolics, and beta-glucan levels. Statistical significance is indicated by asterisks, where p < 0.05 (*), p < 0.01 (**), and p < 0.001 (***).
Applsci 16 05334 g004
Figure 5. Hierarchical heatmap of amino acid content (%) in fermented bean and rice flour samples. The heatmap illustrates the percentage composition of 16 amino acids across six fermented samples. Hierarchical clustering was performed using Euclidean distance for both amino acids and samples. Amino acids percentage in in fermented and non-fermented flours from bean (F) and bean–rice co-products (AF). 102, 134, and 161 correspond to samples fermented with Fistulina hepatica, Pycnoporus sanguineus, and Laetiporus cincinnatus, respectively.
Applsci 16 05334 g005
Table 1. Substrates, codes, and the microorganism of each sample produced in macrofungi treatment.
SubstrateCodeMacrofungiFungi BRM Code
Broken beansCFControl (broken beans without colonization)-
102 FFistulina hepatica047114
134 FPycnoporus sanguineus60013
161 FLaetiporus cincinnatus60015
Mixture broken beans + rice co- productsCFAControl (70% broken beans + 20% rice bran + 10% broken rice)-
102 FAFistulina hepatica047114
134 FAPycnoporus sanguineus60013
161 FALaetiporus cincinnatus60015
Table 2. Phenolic compounds identified and quantified in control (non-fermented) flours and in flours obtained after solid-state fermentation with different macrofungi. Values are expressed as mg/g extract.
Rt (min)λmax (nm)[M-H] m/zMS2 (m/z)Tentative IdentificationCalibration Curve
4.45285191173 (100), 127 (6)Quinic acidy = 208,604x + 173,056
4.71294153135 (100), 109 (23)Protocatechuic acidy = 214,168x + 27,102
5.92272169125 (100)Gallic acidy = 131,538x + 292,163
6.81283289245 (100)(+)-Catechiny = 84,950x − 23,200
7.24278197182 (100), 153 (11)Syringic acidy = 376,056x + 141,329
7.47322353191 (100), 179 (23), 161 (11)Chlorogenic acidy = 168,823x − 161,172
8.04255137137 (100), 109 (12), 93 (5)4-Hydroxybenzoic acidy = 208,604x + 173,056
9.61280289245 (100)(−)-Epicatechiny = 84,950x − 23,200
12.32260167123 (100)Vanillic acidy = 29,751x − 28,661
14.29320223208 (100), 179 (33)Sinapic acidy = 197,337x + 30,036
20.58358301135 (100)Ellagic acidy = 26,719x − 317,255
22.51309193134 (100), 177 (31), 149 (6)Ferulic acidy = 633,126x − 185,462
Disclaimer/Publisher’s Note: The statements, opinions and data contained in all publications are solely those of the individual author(s) and contributor(s) and not of MDPI and/or the editor(s). MDPI and/or the editor(s) disclaim responsibility for any injury to people or property resulting from any ideas, methods, instructions or products referred to in the content.