Abstract
In response to the shortage of theoretical support for negative sample selection and the imbalance between positive and negative samples in landslide susceptibility assessment (LSA), this study presents a dual optimization framework of sampling strategy and sample ratio based on the frequency ratio (FR) model and evaluates its performance in the Heishui River Basin using the random forest (RF) model. At the level of negative sample optimization, FR is used to quantify the spatial associations between landslides and environmental factors, delineate non-landslide zones as the source region for negative samples, and systematically compare the performance of five sampling strategies—random, buffer-zone, low-slope, low-density, and FR-optimized sampling. At the level of ratio adjustment, an innovative positive–negative sample ratio model based on the area ratio between susceptible and non-susceptible zones (1:1.3) is proposed, and four additional schemes (1:1, 1:2, 1:2.5, and 1:3) are designed for comparison. The results show that the FR-optimized sampling strategy provides the best discriminative performance, with AUC (area under the curve) = 0.992, Kappa = 0.964, accuracy = 0.982, and F1 score = 0.982, and achieves the highest mean metric value (0.980) and the lowest standard deviation (0.008). The 1:1.3 ratio scheme maintains the highest mean performance (0.982) and the lowest standard deviation (0.007), while yielding the optimal Kappa (0.968) and F1 score (0.982), confirming its advantages in classification balance and model stability. Spatial prediction results indicate that very high and high susceptibility zones are concentrated along both sides of the middle and lower reaches of the Heishui River Basin, occupying only 18.52% of the total area but containing 98.38% of the mapped landslide points, which strongly supports the reliability of the proposed model in identifying landslide risk hotspots. The proposed dual optimization framework not only enhances the robustness of susceptibility mapping but can also be directly applied to risk screening for territorial spatial planning and engineering development in the Heishui River Basin.
1. Introduction
Landslides, as a typical type of geological hazard that is widely distributed and highly destructive, exhibit persistently high occurrence frequency and broad spatial impacts on a global scale, which is particularly evident in tectonically active mountainous and hilly regions and in areas with concentrated monsoonal rainfall [1,2,3]. The occurrence of landslides is essentially the result of the long-term interaction between endogenic and exogenic geological processes and the evolution of the near-surface geological environment. When a rock–soil mass is in a state of critical equilibrium under gravity, prolonged intense rainfall [4], earthquakes [5], or improper human engineering activities [6] often act as key triggers that induce slope failure. In recent years, under the background of global climate change, the increasing frequency of extreme meteorological events, together with accelerated urbanization driven by socioeconomic development and the continuous extension of transportation networks and other engineering projects into mountainous areas with complex geological conditions, has greatly intensified human disturbance and modification of natural slopes, significantly altering regional hydrogeological conditions and slope stress fields, and consequently leading to a further increase in landslide risk in many regions worldwide [7,8,9]. Landslides not only pose a direct threat to human lives and property but also frequently cause a series of secondary disasters, such as traffic interruption, damage to infrastructure, and river blockage, leading to the formation of landslide-dammed lakes, thereby posing serious challenges to the sustainable development of society and the security of regional ecosystems. Therefore, developing a more accurate and reliable system for landslide susceptibility assessment (LSA) and, on this basis, advancing process-based capabilities for hazard early warning and forecasting have become widely recognized key research directions and frontier scientific issues in the international field of geohazard prevention and mitigation and risk management [10,11,12,13].
LSA is a core technical component within the quantitative assessment and management framework for geological disaster risk, and its scientific and practical significance has been increasingly highlighted with the advancement of geospatial technologies and data-analysis methods [14,15,16]. This technique aims to systematically analyze the intrinsic relationships between historical landslide events and a series of predisposing environmental factors (e.g., geology, topography, hydrology, and land use) and to construct a coupled environmental factors–hazard response statistical or machine learning model, thereby enabling the prediction and visualization of the spatial probability of landslide occurrence within a region [17,18,19,20]. The final product—a landslide susceptibility zonation map—constitutes an indispensable basis for decision-making in scientific territorial spatial planning, the siting of major engineering projects, and the formulation of efficient emergency management and disaster mitigation strategies. Over several decades of development, the research paradigm of LSA has undergone a profound transformation from qualitative to quantitative approaches and from empirical to mechanism-oriented perspectives. Early studies predominantly relied on traditional quantitative models based on statistical analysis, such as the frequency ratio (FR) [21,22], the information value [23,24], and the weights of evidence [25]. In recent years, however, with breakthroughs in artificial intelligence, machine learning algorithms represented by support vector machine (SVM) [26,27,28], artificial neural network (ANN) [29,30,31,32], and extreme gradient boosting (XGBoost) [33,34], owing to their powerful nonlinear fitting capabilities and advantages in handling high-dimensional data, have gradually become the mainstream modeling tools in this field. Among these models, the random forest (RF) algorithm, due to its robustness, effectiveness in processing high-dimensional datasets, low sensitivity to overfitting, and ability to provide rankings of factor importance, stands out from many other machine learning approaches and has become one of the most widely used and generally reliable models for LSA [35,36,37,38].
However, the ultimate predictive performance of a machine learning model is not only determined by the algorithm itself but also, to a large extent, depends on the quality of the input data [39]. For landslide susceptibility assessment (LSA) modeling, sample quality—including positive samples that represent the locations of past landslides and negative samples that represent stable areas—constitutes the core basis for effective model learning and predictive accuracy [40]. Positive samples can generally be obtained with relatively high reliability through increasingly accurate field investigations, multi-temporal remote sensing interpretation, and historical disaster inventories [41]. By contrast, negative sample selection involves greater scientific uncertainty and remains a technical bottleneck and a relatively underdeveloped component in current LSA modeling [42]. A review of existing studies indicates three major issues related to negative sample selection and positive–negative sample configuration: (1) The spatial positioning of negative samples is often arbitrary and weakly grounded in geology [43]; (2) the constraints used to delineate negative samples are frequently single-factor and fail to account for multi-factor interactions [44]; and (3) positive–negative sample ratios are commonly set mechanically and experience-driven, lacking objective quantitative criteria [45].
Specifically, the scientific rigor of existing approaches to negative sample positioning needs further improvement. Simple random sampling entirely ignores the inherent spatial heterogeneity and zonation of geological environments [46]. Buffer-zone sampling, although partly considering spatial proximity, often adopts buffer radii without rigorous geomechanical or geomorphological justification, making it prone to collecting pseudo-negative samples within the potential influence zones of known landslides [47]. Regarding the constraints used to delineate negative samples, current studies exhibit clear tendencies toward simplification and bias. For example, sampling only in low-slope areas overemphasizes topography and overlooks the possibility of landslides occurring on gentle slopes under specific lithological or hydrological conditions [48]. Alternatively, sampling only in low-density areas of historical landslide points focuses narrowly on the spatial pattern of past events while neglecting the synergistic effects of other controlling factors [49]. The issue of sample ratio specification is particularly prominent: Fixed ratios such as 1:1, 1:2, or 1:3 are widely adopted based on previous studies or subjective preference, without objective quantitative standards tailored to the regional stability background, historical landslide density, and other geological–geographical characteristics of the study area [50,51,52]. Such configurations hinder objective cross-comparison and validation of model performance across studies [53] and constrain the standardization of LSA workflows [54].
This study focuses on the Heishui River Basin, a typical region of high landslide susceptibility in China, and aims to address key scientific and technical challenges associated with negative sample construction by proposing and implementing a dual optimization scheme that integrates both sampling strategy optimization and sample ratio optimization. Specifically, with respect to sampling strategy, we move beyond traditional negative sample selection based on random sampling or simple spatial constraints and introduce the frequency ratio (FR) model. Using the minimum susceptibility index corresponding to historical landslide locations as a threshold, we delineate non-landslide areas with relatively stable geological conditions, thereby providing geological justification and explicit spatial boundaries for negative sample selection. With respect to the sample ratio, we abandon fixed, experience-based configurations and construct a dynamically adjustable model based on the area ratio between susceptible and non-susceptible zones, to reveal the intrinsic quantitative relationship between the sample ratio and regional stability characteristics and to shift ratio setting from subjective experience to objective feature adaptation. With respect to validation, we design systematic controlled experiments by comparing five negative-sample sampling strategies and five positive–negative sample ratios to quantitatively examine the response relationship between spatial constraint conditions and model predictive accuracy and to identify the optimal combination of sampling strategy and sample ratio. The main innovations of this study include (1) a negative-sample zoning approach based on the minimum FR threshold derived from known landslide samples, and (2) a sample-ratio estimation method based on the area ratio between susceptible and non-susceptible zones, thereby providing quantifiable and reusable methodological support and decision-making evidence for sample construction in LSA.
2. Study Area and Data Sources
2.1. Study Area
The Heishui River Basin is located in the southeastern part of the Aba Tibetan and Qiang Autonomous Prefecture in Sichuan Province, China (Figure 1a). Its main stem, the Heishui River, is the largest tributary in the upper reaches of the Min River. The basin is characterized by highly rugged terrain, with elevations ranging from 1649 to 5218 m and a maximum vertical relief of 3569 m, exhibiting typical alpine gorge landforms. The region has a plateau monsoon climate with distinct dry and wet seasons, and precipitation is mainly concentrated from June to September. Short-duration intense rainfall events provide ample hydrodynamic conditions for the development of geological hazards. Superimposed on this complex setting are regional neotectonic movements, earthquakes, and strong fluvial incision and erosion, which together create an environment of high susceptibility to geological disasters. In recent years, with increasingly frequent human engineering activities, geological hazards in the basin have shown a pronounced upward trend. According to records from the Resource and Environment Science and Data Center (https://www.resdc.cn/, accessed on 13 February 2025), a total of 195 historical landslides have been documented in the study area. In this study, we systematically re-examined the original landslide inventory using Google Earth imagery and visual interpretation and—following the landslide-type classification concept adopted in Loche et al. (2022) based on the IFFI national inventory—excluded 9 points after verification [55]. Finally, 186 valid landslides were identified, with Complex landslides being the dominant type, and a small number classified as Shallow or Translational, as shown in Figure 1b.
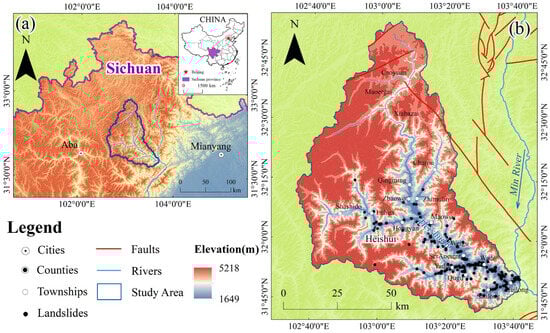
Figure 1.
Study area and distribution of landslides: (a) Location of the study area; (b) Landslide distribution in the study area.
2.2. Data Sources and Processing
Based on an analysis of the formation mechanisms of landslide hazards, 12 environmental factors for LSA are initially selected, including both continuous and discrete variables. The continuous factors comprise elevation, slope, plan curvature, profile curvature, topographic relief, the normalized difference vegetation index (NDVI), and the topographic wetness index (TWI). The discrete factors include aspect, distance to roads, distance to rivers, lithology (engineering geological rock groups), and land use. The basic data sources are listed in Table 1.

Table 1.
Data sources and types.
Elevation, slope, aspect, plan curvature, profile curvature, topographic relief, and TWI factors are extracted from the digital elevation model (DEM). Lithological data are integrated according to litho-mechanical properties, and a lithology factor representing engineering geological rock groups is generated through vector-to-raster conversion. Road and river features are analyzed using multi-level buffer analysis, and the distance to roads and distance to rivers factors are obtained via vector-to-raster conversion. Discrete factors retain their original categorical characteristics, whereas continuous factors are classified using the natural breaks method. To ensure consistency in spatial analysis, all environmental factors are resampled to a spatial resolution of 30 m. The classification results of the factors are shown in Figure 2.

Figure 2.
Classification of environmental factors.
3. Methodology
This study proposes an FR-optimized negative-sample sampling strategy and an area ratio–optimized positive–negative sample ratio model, which together enhance the predictive accuracy and reliability of machine learning-based LSA. The technical workflow (Figure 3) comprises four steps: (1) basic data construction, in which multi-source geospatial datasets are systematically integrated to build a fundamental database including a spatial landslide inventory and a set of environmental factors; (2) sampling strategy design, in which the FR model is used to delineate landslide susceptibility zones, negative samples are selected within non-susceptible areas, and four comparative sampling schemes—random, buffer-zone, low-slope, and low-density sampling—are constructed, and their impacts on RF performance are evaluated using multiple accuracy metrics; (3) ratio-optimized modeling, in which the area ratio between susceptible and non-susceptible zones is used to determine the positive–negative sample ratio, thereby establishing a dynamically adjustable sample-ratio model optimized by area ratio, while an additional series of fixed-ratio experiments from 1:1 to 1:3 is conducted for comparison; (4) comprehensive predictive evaluation, in which model performance under different sampling strategies and sample-ratio settings is systematically compared and the final landslide susceptibility zonation under the dual optimization framework is produced.
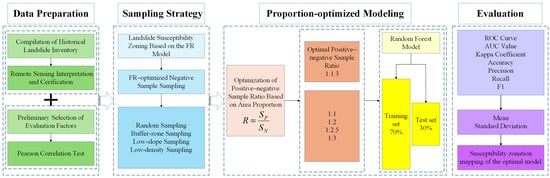
Figure 3.
Technical flowchart.
3.1. FR-Optimized Negative Sample Selection
The FR model quantifies the spatial correlations between environmental factors and landslide occurrences, thereby characterizing the degree to which each factor influences landslide development. Its mathematical expression is given as follows:
where FR is the frequency ratio; Fj denotes the number of landslides falling within a given class interval of a specific factor; F is the total number of landslides in the study area; Cj represents the number of grid cells (or the area) corresponding to that factor class; and C is the total number of grid cells (or the total area) in the study area.
Based on the above definitions, this study first uses Equation (1) to calculate the FR values for each class interval of all environmental factors and overlays the FR rasters of these factors to obtain a landslide susceptibility index raster for the study area. This index is then extracted at the locations of all historical landslide points, and the corresponding values are ranked. The minimum susceptibility index associated with the landslide points is taken as a threshold: Areas with index values lower than this threshold are delineated as non-landslide zones, whereas the remaining areas are defined as susceptible zones.
On this basis, random sampling of negative samples is performed within the non-landslide zones, with two additional spatial constraints: (1) A 500 m buffer is constructed around all landslide points and excluded from the candidate area, and (2) the minimum distance between any two negative sample points is constrained to 500 m. This strategy, while ensuring that all positive samples fall within the susceptible zones, effectively enhances the spatial representativeness of non-landslide samples and reduces sample contamination, thereby providing a relatively reliable set of positive and negative samples for training the subsequent LSA models.
3.2. RF Model
The RF model is an ensemble learning algorithm based on multiple decision trees [56,57]. Its basic idea is to employ the bagging technique to randomly generate, with replacement, k bootstrap samples from the original training set, each having the same size as the original dataset. A total of k decision trees are then constructed on these bootstrap samples, and their classification results are aggregated using a majority-voting scheme to obtain the final prediction. The core hyperparameters of the model mainly include the size of the forest (i.e., the number of trees) and the number of features considered at each split. Although increasing the number of features can enhance the representational capacity of the model, it also leads to a substantial increase in computational complexity.
The focus of this study is to compare the effects of different sampling strategies and sample ratios on model performance. To control for the influence of other variables, the RF model parameters are kept constant and configured as follows: The forest size is fixed at 120 decision trees; the minimum number of samples in a leaf node during tree growth is set to 10; and, at each node split, 2 feature variables are randomly selected for optimal partitioning. This parameter configuration ensures satisfactory model accuracy while effectively balancing computational efficiency and the risk of overfitting.
3.3. Area Ratio–Optimized Sample Ratio
In LSA, the susceptibility zonation derived from the FR model has a clear geological meaning: Susceptible zones represent favorable areas for landslide development, whereas non-susceptible zones correspond to regions with relatively stable geological conditions. In view of the sensitivity of the RF algorithm to sample balance, this study proposes a novel area ratio–optimized strategy for dynamically adjusting the positive–negative sample ratio. The specific implementation steps are as follows: First, landslide susceptibility zonation is performed using the FR model; second, the areas of the landslide susceptible zone (source region of positive samples) and the non-susceptible zone (source region of negative samples) are calculated separately; and finally, the optimal ratio between positive and negative samples is established according to the following equation:
where R is the quantitative ratio between positive and negative samples, SP is the area of the susceptible zone, and SN is the area of the non-susceptible zone. To facilitate horizontal comparison among different ratios, the original area ratio is converted, by taking its reciprocal, into a standard form expressed as 1: (1/R).
3.4. Model Evaluation Metrics
The receiver operating characteristic (ROC) curve has been widely used to evaluate and validate the performance of susceptibility prediction models [58]. This method calculates the true positive rate (TPR) and false positive rate (FPR) of a model under different threshold settings and plots them in a two-dimensional coordinate system, thereby providing an intuitive visualization of classifier performance. The closer the ROC curve is to the upper-left corner and the closer the area under the curve (AUC) is to 1, the better the classification performance of the model.
Meanwhile, to provide a more systematic evaluation of model performance, a multidimensional assessment framework is constructed by introducing the Kappa coefficient [59] together with accuracy, precision, recall, and F1 score [60]. The Kappa coefficient evaluates model reliability by comparing the agreement between the observed classification and a random classification; accuracy quantifies the overall proportion of correct predictions; precision measures the reliability of positive predictions; recall characterizes the completeness of identifying positive samples; and the F1 score, as the harmonic mean of precision and recall, is used to balance the trade-off between these two types of errors. Given the positive correlations between these accuracy metrics and model performance, the mean values of these indices are used to assess the average performance of the model, while the standard deviation (SD) is employed to analyze the degree of dispersion. In this way, the stability and generalization capability of the model can be quantitatively evaluated.
4. Results
4.1. Selection of Environmental Factors
In LSA, strong correlations among environmental factors may lead to multicollinearity, thereby affecting the accurate evaluation of each factor’s contribution to the model. In this study, the Pearson correlation coefficient is employed to test the correlations among the initially selected factors. The heat map of the Pearson correlation matrix (Figure 4) shows that the correlation coefficients between slope and topographic relief, and between distance to roads and distance to rivers, both exceed 0.8, suggesting strong correlations. Although both slope and topographic relief are derived from the DEM, the current factor set already includes plan curvature and profile curvature, which characterize terrain relief; therefore, topographic relief is removed as a redundant factor. In addition, since the road network in the study area largely follows river valleys, distance to roads and distance to rivers exhibit spatial coupling. Considering that land-use type already effectively reflects the impact of human activities, distance to rivers is preferentially retained. Ultimately, 10 environmental factors are selected for LSA.
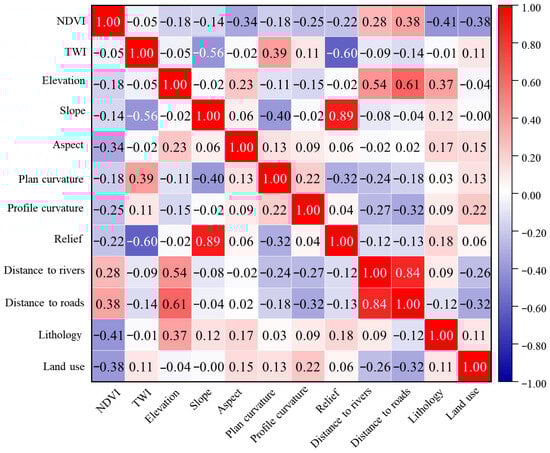
Figure 4.
Heat map of the Pearson correlation matrix.
4.2. FR Calculation for Factor Classes
The spatial correlation analysis based on the FR model (Figure 5) reveals the quantitative response relationships between each environmental factor and landslide development, with the main characteristics summarized as follows.

Figure 5.
FR values of classified environmental factors.
- (1)
- Topographic factors: The elevation interval of 1649–2568 m exhibits the highest FR value (9.16), indicating that this elevation band exerts a strong control on landslide development. The FR value for slopes between 44.56° and 76.79° reaches 1.37, reflecting that steep slopes are more prone to stress concentration on the slope surface. Aspect analysis shows that north-facing slopes are the most sensitive (FR = 1.62), followed by northeast-, east-, southeast-, and northwest-facing slopes, whereas west-, southwest-, and south-facing slopes are relatively more stable. Plan curvature values in the range of 66.51–81.47° (FR = 1.62) and profile curvature values in the range of 23.21–48.31° (FR = 2.44) are associated with pronounced landslide development, confirming that terrain breakpoints are prone to shear failure.
- (2)
- Environmental factors: For TWI, the interval 9.30–15.86 shows a high FR value of 2.83, underscoring the critical role of hydrological conditions in slope stability. The NDVI interval 0.67–0.79 has an FR value of 1.76, indicating that areas with moderate vegetation cover are more susceptible to instability. The analysis of distance to rivers shows that the FR value within the 500 m buffer reaches 5.76 and decreases with increasing distance, reflecting a strong spatial effect of fluvial erosion.
- (3)
- Geological and land-use factors: The FR value of the soft–hard interbedded rock group reaches 2.81, indicating that differences in lithological assemblage exert a significant control on slope stability. Among land-use types, areas adjacent to water bodies exhibit the highest susceptibility (FR = 5.75), followed by cropland, forest, and grassland, which reflects the combined influence of human activities and natural processes.
4.3. FR-Optimized Negative Sample Selection and Sample Ratio
By calculating and superimposing the frequency ratios of all environmental factors, a landslide susceptibility index is obtained for the Heishui River Basin. The susceptibility index is then extracted at the locations of the identified landslide points, and the corresponding FR values are sorted in ascending order, yielding a minimum value of FR = 8.156. This value is taken as the threshold, and a histogram of the susceptibility index for the entire study area is constructed and divided into two classes accordingly (Figure 6). The histogram of the susceptibility index shows an overall skewed distribution, with the main peak concentrated in the range 7–9. The threshold line FR = 8.156 is located on the right shoulder of the main peak, and raster cells decay towards higher index values in a long tail.

Figure 6.
Histogram of the landslide susceptibility index.
Using the threshold FR = 8.156, areas with FR ≥ 8.156 are defined as susceptible zones, and areas with FR < 8.156 are defined as non-susceptible zones, thereby accomplishing the spatial partitioning of positive and negative samples. Under this scheme, the susceptible zone in the study area covers an area of SP = 3098 km2, while the non-susceptible zone covers SN = 4066 km2. According to Equation (2), the resulting area ratio is R ≈ 0.76, which can be standardized and expressed as 1:1.3.
Since the threshold is determined by the minimum FR value corresponding to the landslide points, all known landslide points fall within the susceptible zone, while the non-susceptible zone serves as the candidate area for negative samples. Accordingly, all landslide points are extracted as positive samples, and negative samples are randomly drawn from the non-susceptible zone based on the area ratio of approximately 1:1.3, thereby constructing a relatively balanced sample set (Figure 7). Spatial overlay verification indicates that positive and negative samples are effectively separated, providing a reliable data foundation for subsequent LSA.

Figure 7.
Spatial distribution of positive and negative samples.
4.4. Results of Susceptibility Assessment Under the Dual Optimization Strategy
The landslide susceptibility zonation derived from the RF model constructed using the dual optimization strategy is shown in Figure 8. Overall, the susceptibility classes exhibit a strong spatial coupling with the distribution of historical landslides. Very high susceptibility zones are concentrated along both sides of the valley in the middle and lower reaches of the Heishui River, where slopes are characterized by highly fractured structures and intensive human engineering activities. High susceptibility zones extend laterally in a dendritic pattern along the tributaries of the Heishui River. Moderate susceptibility zones are mainly distributed in the upper reaches of the Heishui River. In contrast, very low and low susceptibility zones are located in high-altitude uninhabited areas, which are characterized by relatively intact terrain structures and good vegetation cover.
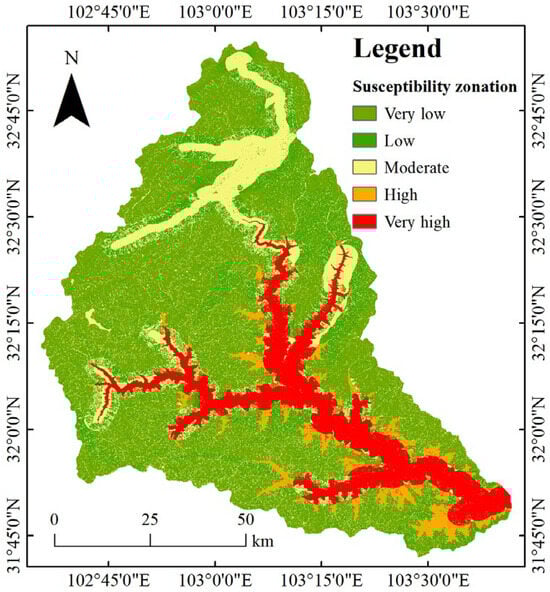
Figure 8.
Landslide susceptibility zoning under the dual optimization strategy.
By calculating, for each susceptibility class, the ratio between the proportion of landslide points and the proportion of area (i.e., the FR value), the degree of agreement between susceptibility classes and the spatial distribution of landslides is evaluated (Table 2). If the very high and high susceptibility zones exhibit markedly increased FR values, whereas the very low and low susceptibility zones show clearly reduced FR values, the model can be considered to have strong spatial discriminative capacity and high predictive accuracy [61]. The results show that the very high susceptibility zone, which occupies 13.74% of the study area, contains 90.32% of the landslide points, and its FR value (6.57) is significantly higher than those of the other classes. In sharp contrast, the very low susceptibility zone, covering 45.13% of the area, records only two landslides, with an FR value as low as 0.02. In addition, although the high (4.78%) and moderate (17.90%) susceptibility zones contain 15 and 1 landslides, respectively, their FR values differ by a factor of 56, revealing the model’s pronounced ability to distinguish transitional risk areas. Overall, the very high and high susceptibility zones together account for only 18.52% of the study area but accommodate 98.38% of the recorded landslides, which fully verifies the reliability of the model in identifying key high-risk zones.
Table 2.
Statistics of landslide susceptibility zonation.
5. Discussion
5.1. Comparison of Model Performance Under Different Negative-Sample Selection Strategies
In the construction of negative samples, the sampling strategy determines the purity and representativeness of non-landslide samples, thereby directly influencing the predictive accuracy of the model [62,63,64]. To identify potential selection biases introduced by different strategies, this section conducts a methodological comparison under a controlled sample size and a unified modeling workflow. We designed a set of comparative experiments comprising random, buffer-zone, low-slope, low-density, and FR-optimized sampling, while keeping the RF model configuration fixed (positive–negative sample ratio of 1:1, total sample size of 372, and a training–test split of 7:3).
The susceptibility zoning (Figure 9) indicates marked differences in model performance under different sampling strategies. For all models, the continuous susceptibility index is reclassified into five classes—very low, low, moderate, high, and very high—using the natural breaks method. Under random sampling, high and very high susceptibility zones roughly follow the main valley, but high-value patches are fragmented, transitions to medium–low classes are abrupt, and many non-landslide points fall inside or adjacent to high-value areas, leading to a blurred spatial discrimination. Buffer-zone sampling and low-density sampling improve this pattern to some extent, producing more continuous high-value belts along valleys and a more reasonable correspondence between landslides and high/very high classes, yet local clustering of non-landslide points still occurs near landslide clusters. Low-slope sampling further reduces the proportion of non-landslide points in high-value zones and maintains reasonable coverage of landslide points, but high susceptibility areas tend to expand outward, and some stable regions are misclassified as medium–high susceptibility. In contrast, the FR-optimized sampling strategy produces narrow, continuous belts of high and very high susceptibility along the main channel and major tributaries that closely match the landslide distribution, with clear, gradual transitions toward medium, low, and very low classes. Non-landslide points are concentrated mainly in very low and low susceptibility zones and rarely intrude into high-value areas, highlighting the superior clarity of zonation and spatial discrimination of this strategy compared with the other four.

Figure 9.
Landslide susceptibility zoning: (a) random, (b) buffer-zone, (c) low-slope, (d) low-density, and (e) FR-optimized; areas A and B are two representative sub-areas selected for subsequent experiments.
The model accuracy evaluation results (Figure 10) show that the FR-optimized sampling strategy achieves the best overall performance, with AUC = 0.992, Kappa = 0.964, accuracy = 0.982, and F1 score = 0.982, outperforming all other strategies. Its mean performance is 2.83% higher than that of the second-best low-slope sampling strategy and 17.79% higher than that of the weakest random sampling. Notably, it also exhibits a substantial advantage in terms of stability, with a standard deviation of only 0.008, representing a 72.41–90.70% reduction compared with the other methods. The low-slope sampling strategy ranks second in AUC (0.992) and F1 score (0.953), but its recall (0.927), although comparable to that of buffer-zone sampling, is clearly lower than that of the FR-optimized sampling (0.982). The Kappa coefficients of buffer-zone sampling and low-density sampling are 0.782 and 0.836, respectively, indicating room for improvement in classification agreement. Random sampling performs worst across all metrics, particularly in Kappa (0.673), mean performance (0.832), and standard deviation (0.086), highlighting the limitations of unstructured sampling.

Figure 10.
Accuracy metrics under different sampling strategies: (a) ROC curves and (b) radar chart of accuracy metrics.
To further refine the comparison of prediction results, two demonstration areas (A and B) containing known landslide points are selected (Figure 11). The analysis shows that the FR-optimized sampling strategy has a clear advantage in controlling the spatial distribution of negative samples. In area A, it increases the proportion of very high susceptibility to 84.03%, far exceeding the range of other strategies (16.67–52.78%), while reducing the area of high susceptibility to 15.97%, which is 67 percentage points lower than under random sampling. In area B, the very high susceptibility zone accounts for 67.42%, and the high susceptibility zone only 3.79%, representing a reduction of 66 percentage points compared with low-density sampling. Notably, this strategy completely eliminates misclassified very low susceptibility zones in area B. Overall, the results indicate that FR-optimized sampling enhances the identification of very high-risk areas while simultaneously suppressing bias in medium–high susceptibility zones, demonstrating superior spatial focusing capability.
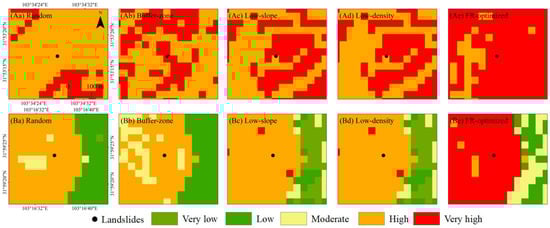
Figure 11.
Detailed comparison of LSA in demonstration areas A (Aa–Ae) and B (Ba–Be): random, buffer-zone, low-slope, low-density, and FR-optimized sampling.
Thus, the strategy and quality of selecting non-landslide points (negative samples) are critical to landslide susceptibility modeling. FR has been widely used to delineate negative-sample source areas or to optimize sampling; for example, Zhu et al. (2024) used normalized FR < 0.5 to extract negative samples (AUC = 0.8579) [65], Liu et al. (2022) enhanced buffer-zone sampling by adding cells with FR ≥ 1 and FR < 1 as supplementary positive and negative samples, respectively (AUC = 0.94) [66], and Zhu et al. (2025) selected negative samples from very low susceptibility zones (best AUC = 0.864) [67]. Compared with these approaches, our FR-based optimized sampling shows improved performance in this study because the threshold is determined by the minimum FR value at known landslide locations, reducing the subjectivity of experience-based cutoffs (e.g., 0.5 or 1) and better matching the characteristics of the study area.
5.2. Comparison of Model Performance Under Different Positive–Negative Sample Ratios
From the perspective of sample configuration, the ratio between positive and negative samples is an important factor influencing the accuracy of machine learning-based LSA. In real geomorphic settings, non-landslide units are far more numerous than landslide units, so the sample set is highly imbalanced [68,69]. Many previous studies have commonly adopted an equal number of non-landslide samples and landslide samples, i.e., fixing the positive–negative sample ratio at 1:1 [70]. However, this configuration effectively inflates the relative proportion of landslides in the study area from a statistical viewpoint, which may bias the model toward the landslide class and reduce its overall generalization ability. Some studies have pointed out that moderately increasing the number of non-landslide samples can provide richer stable-area information to the model, helping the algorithm more clearly distinguish between susceptible and non-susceptible zones [71]. Nevertheless, an excessive number of negative samples is prone to introducing data contamination. To strike a balance between information gain and data contamination, previous work has explored multiple ratios such as 1:1, 1:2, and 1:3 in search of a compromise solution. For example, some studies have found 1:2 to be optimal for their study areas [72], whereas others have shown that model accuracy tends to be higher when the positive–negative sample ratio is closer to the true occurrence frequency [73].
This study divides the study area into landslide and non-landslide zones using a minimum-threshold method within the framework of FR-optimized sampling, thereby yielding a positive–negative sample ratio of approximately 1:1.3. To verify the effectiveness of this configuration, five comparative experiments with ratios of 1:1, 1:1.3, 1:2, 1:2.5, and 1:3 are designed. The susceptibility zoning results based on the RF model at different ratios are shown in Figure 12. The number of negative samples has a pronounced impact on the spatial extent and transitions of high susceptibility zones. With a 1:1 ratio, very high and high susceptibility zones form continuous belts along the main valley and tributaries, but the high-value zones are overly wide and partially extend into basins and gentle slopes, leading to blurred boundaries with medium–low classes and a tendency toward overestimation. When the ratio is adjusted to 1:1.3, the high-susceptibility belts remain continuous along the valleys but become moderately narrower, with zone widths more consistent with terrain relief and a clearer, banded gradient from very high to very low susceptibility; this configuration avoids large-scale overestimation while still capturing the full extent of unstable belts along the valleys. As the ratio further increases to 1:2 and 1:2.5, very high and high susceptibility zones shrink, some high-value belts along tributaries and upstream reaches become fragmented, and the continuity of high-susceptibility zones on both valley sides weakens, reflecting a conservative mapping tendency. At a ratio of 1:3, very high susceptibility is confined to a few narrow segments of the main valley, and some known high-risk areas are downgraded to moderate or low susceptibility, indicating a clear underestimation of potential danger. Overall, as the negative sample ratio increases from 1 to 3, high-susceptibility zones evolve from overly expanded to overly contracted, with the 1:1.3 configuration providing the best balance between high-value extent, spatial gradients, and risk representation, and thus serving as the preferred ratio for this study area.
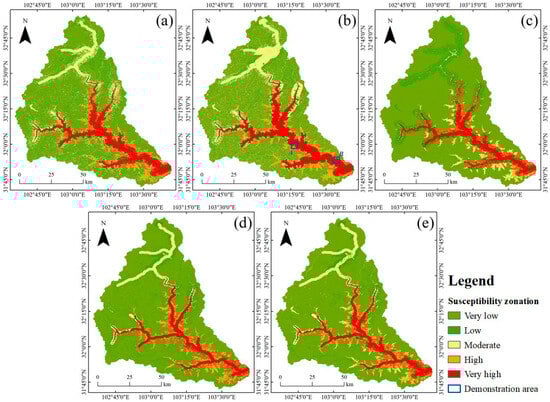
Figure 12.
Landslide susceptibility zoning under different ratios: (a) 1:1, (b) 1:1.3, (c) 1:2, (d) 1:2.5, and (e) 1:3; areas A and B are two representative sub-areas selected for subsequent experiments.
The model evaluation results are shown in Figure 13. The model achieves its best overall performance at a positive–negative sample ratio of 1:1.3, with a Kappa coefficient of 0.968 and an F1 score of 0.982, while simultaneously attaining the highest mean performance (0.982) and the lowest standard deviation (0.007). This indicates the best balance between classification performance and stability. It is noteworthy that at a ratio of 1:2.5, the AUC reaches an anomalously high value of 1; however, the simultaneous decreases in precision (0.948) and F1 score (0.974) suggest a potential risk of overfitting. This provides an important warning for sample-ratio selection, namely that pursuing the maximization of a single metric may impair the generalization ability of the model.
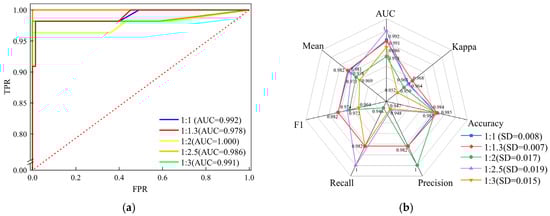
Figure 13.
Accuracy metrics under different ratios: (a) ROC curves and (b) radar chart of accuracy metrics.
Although the 1:1 ratio does not represent the theoretical optimum, it still maintains a relatively high level of performance (mean = 0.981), and its recall (0.982) is identical to that of the optimal 1:1.3 ratio, demonstrating that traditional balanced sampling remains practically useful in engineering applications. When the ratio is further increased to 1:3, model performance exhibits a systematic decline: The F1 score decreases by 1.83%, the mean performance decreases by 1.32%, and the standard deviation increases by 114.29%, indicating that sample imbalance has a pronounced negative effect on model stability. These findings provide quantitative support for determining sample ratios in LSA: On the basis of maintaining an approximately balanced configuration (1:1), moderately increasing the number of negative samples to 1:1.3 can significantly enhance model stability (with a 12.50% reduction in standard deviation), offering a new solution to the sample-ratio problem in machine learning-based modeling.
Analysis of prediction performance under different positive–negative sample ratios in demonstration areas A and B shows that the 1:1.3 ratio likewise yields the best model performance (Figure 14). In area A, when the 1:1.3 ratio is applied, the very high susceptibility zone accounts for 95.14% of the area, markedly higher than under the other ratios, while the high susceptibility zone is reduced to a minimum of 4.86%. Area B similarly highlights the advantage of the 1:1.3 ratio, with the very high susceptibility zone covering 71.21% of the area and the distracting presence of very low and low susceptibility zones being completely eliminated. In contrast, the other ratios exhibit abnormal fluctuations in the proportion of high susceptibility or generate unnecessary low-risk zones, indicating that the 1:1.3 configuration can more precisely focus on the core landslide-risk areas and optimize the spatial focusing of the prediction results.

Figure 14.
Detailed comparison of LSA in demonstration areas A (Aa–Ae) and B (Ba–Be): 1:1, 1:1.3, 1:2, 1:2.5, and 1:3.
In recent years, determining the positive–negative sample ratio in machine learning-based landslide susceptibility assessment has become a research focus. Some studies adopt ratios based on expert judgement or prior practice; for example, Deng et al. (2025) used a fixed 1:2 ratio to compare predictive performance across multiple models [72]. Others explore optimal ratios through gradient tests: Li et al. (2025) evaluated ratios from 1:1 to 1:200 using gradient random sampling and identified 1:5 as the optimal ratio [70], while Tang et al. (2023) tested ratios from 1:1 to 1:16 in the Three Gorges Reservoir area and found that 1:2 performed best in their overall evaluation [50]. However, ratio selection in existing studies often remains highly subjective. To address this limitation, our approach quantifies the positive–negative sample ratio by incorporating the landslide occurrence pattern and environmental characteristics of the study area, thereby reducing subjective bias introduced by experience-based settings. It should be noted that the current validation is limited to the Heishui River Basin, and cross-regional comparisons and transferability tests have not yet been conducted; therefore, the general applicability of the proposed method needs further verification across regions with different geomorphic settings and geological backgrounds.
5.3. Limitations and Future Research Directions
It should be noted that this study still has several limitations that warrant further improvement in future work. The Heishui River Basin is characterized by strong neotectonic activity, and fault structures play an important role in controlling landslide initiation and slope failure. However, the 1:250,000-scale fault dataset used in this study has relatively low spatial resolution, resulting in an insufficient characterization of the fault system in the study area (only three major faults in the northern sector were identified). This may lead to an underestimation of tectonic controls in the model, thereby affecting the completeness of the predisposing-environment characterization and the accuracy of susceptibility assessment. Future studies should incorporate 1:50,000-scale (or finer) structural–geological data or integrate high-resolution remote sensing interpretation with field verification to develop more detailed fault-related indicators (e.g., fault density, activity/gradation, and fault proximity), thereby improving model interpretability and predictive reliability.
In addition, this study used random forest as the primary classifier to investigate negative-sample sampling strategies and positive–negative sample ratio optimization. Although random forest is generally robust and exhibits strong generalization ability, machine learning is not necessarily superior to statistical models under all spatial scales and data conditions [74]. For large-scale applications or in cases where high-quality baseline data are available, statistical or threshold-based models may yield interpretable results at substantially lower computational cost, whereas complex machine learning models are often more sensitive to computational resources, parameter settings, and sample construction. Therefore, future work should, while maintaining experimental comparability, introduce additional models (e.g., XGBoost, SVM, neural networks, and deep-learning/ensemble approaches) to cross-validate the proposed dual optimization workflow and benchmark it against representative statistical models, so as to systematically evaluate its applicability, efficiency, and boundary conditions.
Finally, it should be emphasized that this study was validated only in the Heishui River Basin. Landslide samples were obtained from an existing hazard inventory and further updated through systematic re-examination using Google Earth imagery and visual interpretation, resulting in generally high data quality. Nevertheless, the modeling in this study was conducted primarily within a binary framework (landslide vs. non-landslide) and did not further distinguish among landslide types; consequently, the differences among landslide processes and their coupling with geomorphological and structural–geological conditions were not fully discussed. Future studies may follow the landslide-type classification scheme of the IFFI national inventory to conduct type-specific labeling and statistical analysis, thereby strengthening the linkage between landslide types and the geomorphological–tectonic background.
In light of these limitations, future research may be advanced through coordinated efforts in three directions—data refinement, model systematization, and integration with dynamic data—while further supporting regional sustainable development goals. In terms of data refinement, priority should be given to incorporating 1:50,000-scale (or finer) structural and geological datasets, together with high-resolution remote sensing interpretation and field verification, to develop a more detailed fault–geology indicator system; meanwhile, where data permit, landslide inventories should be classified and checked for consistency following standards such as the IFFI scheme, so as to improve the completeness of environmental characterization and the reliability of susceptibility zoning. In terms of model systematization, multi-model benchmarking and cross-validation (e.g., XGBoost, SVM, ensemble learning, and deep learning, along with comparisons against representative statistical models) can be conducted within the existing dual optimization sample-construction framework, and cross-regional transfer tests should be performed to systematically assess applicability and stability. In terms of integration with dynamic data, future work may incorporate triggering factors such as rainfall, ground deformation, and earthquakes to extend static susceptibility products toward more management-oriented risk assessment. From a sustainability perspective, these directions are expected to provide more robust scientific evidence and decision support for territorial spatial planning and resilient community development (SDG 11), safer layout and resilience enhancement of roads and lifeline infrastructure (SDG 9), and disaster-risk governance and adaptive management under climate change (SDG 13).
6. Conclusions
By developing a dual optimization framework that jointly considers the strategy for negative sample selection and the positive–negative sample ratio, this study effectively alleviates the long-standing problems of negative sample selection and sample imbalance in machine learning-based LSA. The main conclusions are as follows:
- (1)
- The FR-optimized negative-sample selection strategy significantly improves sample quality by quantitatively characterizing the spatial relationships between landslides and environmental factors and by delineating geologically stable non-landslide zones as the source region of negative samples. Compared with random sampling, buffer-zone sampling, low-slope sampling, and low-density sampling, the FR-optimized strategy achieves the best overall performance, with AUC = 0.992, Kappa = 0.964, accuracy = 0.982, and F1 score = 0.982, as well as the highest mean metric value (0.980) and the lowest standard deviation (0.008). These results demonstrate its strong capacity to accurately identify non-landslide areas and to enhance model stability.
- (2)
- The area ratio–optimized 1:1.3 positive–negative sample ratio model overcomes the limitations of conventional empirical ratios (1:1–1:3). While maintaining the highest mean performance (0.982) and the lowest dispersion (standard deviation of 0.007), it raises the Kappa coefficient and F1 score to 0.968 and 0.982, respectively. This indicates that the 1:1.3 configuration can effectively balance the classifier’s recognition of landslide and non-landslide zones, mitigate the adverse effects of class imbalance, and improve the generalization performance of the RF model.
- (3)
- The spatial prediction results of the dual optimization model are highly consistent with the distribution of historical landslides: 98.38% of the landslide points are concentrated within only 18.52% of the area classified as very high and high susceptibility. This confirms the reliability of the proposed framework in identifying landslide risk hotspots, and the resulting susceptibility zonation can provide a scientific basis for geohazard prevention and control in the Heishui River Basin. The methodological framework developed in this study also offers a transferable reference for sample construction in machine learning-based LSA in other mountainous regions.
Overall, this study develops a frequency ratio–guided dual optimization framework for sampling strategy and sample ratio. The framework improves model discriminative accuracy and stability while enabling more reliable spatial identification of risk hotspots, thereby providing a quantifiable and reusable methodological pathway for sample construction in landslide susceptibility assessment. Future work should conduct transferability tests across regions with diverse geological settings and incorporate higher-resolution data together with dynamic conditioning factors such as rainfall to further enhance the general applicability of the approach and its decision-making utility. The proposed framework can be applied in the Heishui River Basin to support landslide risk mitigation and guide resource allocation for geohazard prevention.
Author Contributions
Conceptualization, Z.Y., M.S. and H.M.; methodology, Z.Y., M.S. and M.Z.; software, M.S. and J.Y.; formal analysis, Z.Y. and L.W.; data curation, Z.Y., M.S. and H.M.; writing—original draft preparation, Z.Y. and M.S.; writing—review and editing, H.M., M.Z., J.Y. and L.W.; project administration, Z.Y.; funding acquisition, Z.Y. All authors have read and agreed to the published version of the manuscript.
Funding
This research was funded by the Natural Science Research Project of Anhui Educational Committee (Grant NO. 2024AH050384).
Institutional Review Board Statement
Not applicable.
Informed Consent Statement
Not applicable.
Data Availability Statement
The data supporting the findings of this study are available from the corresponding author upon reasonable request.
Conflicts of Interest
The authors declare no conflicts of interest.
References
- Reichenbach, P.; Rossi, M.; Malamud, B.D.; Mihir, M.; Guzzetti, F. A Review of Statistically-Based Landslide Susceptibility Models. Earth-Sci. Rev. 2018, 180, 60–91. [Google Scholar] [CrossRef]
- Remondo, J.; Sánchez-Díaz, M.; Cuesta-Albertos, J.A. An increasing trend of landslides as a consequence of the global change. Earth Syst. Environ. 2025, 1–14. [Google Scholar] [CrossRef]
- Duan, Y.; Ding, M.; He, Y.; Zheng, H.; Delgado-Téllez, R.; Sokratov, S.; Dourado, F.; Fuchs, S. Global projections of future landslide susceptibility under climate change. Geosci. Front. 2025, 16, 102074. [Google Scholar] [CrossRef]
- Fang, Z.; Barasal Morales, A.; Wang, Y.; Lombardo, L. Climate change has increased rainfall-induced landslide damages in central China. Int. J. Disaster Risk Reduct. 2025, 119, 105320. [Google Scholar] [CrossRef]
- Huang, C.; Hu, Q.; Cai, Q.; Li, M. Post-earthquake spatiotemporal evolution characteristics of typical landslide sources in the Jiuzhaigou meizoseismal area. Bull. Eng. Geol. Environ. 2024, 83, 242. [Google Scholar] [CrossRef]
- Tian, N.; Lan, H.; Li, L.; Peng, J.; Fu, B.; Clague, J.J. Human activities are intensifying the spatial variation of landslides in the Yellow River Basin. Sci. Bull. 2025, 70, 263–272. [Google Scholar] [CrossRef] [PubMed]
- Zhu, H.; Zhu, X.; Xu, Q.; Fu, X.; Li, M.; Jia, X.; Fan, Z. From Hazard Mapping to Risk Governance: 20-Year Trajectory of Land Use/Cover Change Impacts on Landslide Susceptibility via Multi-Modal Scientometrics. Humanit. Soc. Sci. Commun. 2025, 12, 1609. [Google Scholar] [CrossRef]
- Depicker, A.; Govers, G.; Jacobs, L.; Campforts, B.; Uwihirwe, J.; Dewitte, O. Interactions between deforestation, landscape rejuvenation, and shallow landslides in the North Tanganyika–Kivu rift region, Africa. Earth Surf. Dyn. 2021, 9, 445–462. [Google Scholar] [CrossRef]
- Ozturk, U.; Bozzolan, E.; Holcombe, E.A.; Shukla, R.; Pianosi, F.; Wagener, T. How climate change and unplanned urban sprawl bring more landslides. Nature 2022, 608, 262–265. [Google Scholar] [CrossRef]
- Han, Y.; Semnani, S.J. Important considerations in machine learning-based landslide susceptibility assessment under future climate conditions. Acta Geotech. 2025, 20, 475–500. [Google Scholar] [CrossRef]
- Xu, S.; Wang, Z.; Liu, J.; Ma, X.; Zhou, T.; Tang, Q. Landslide susceptibility assessment using lightweight dense residual network with emphasis on deep spatial features. Sci. Rep. 2025, 15, 12552. [Google Scholar] [CrossRef]
- Kudaibergenov, M.; Nurakynov, S.; Iskakov, B.; Iskaliyeva, G.; Maksum, Y.; Orynbassarova, E.; Akhmetov, B.; Sydyk, N. Application of artificial intelligence in landslide susceptibility assessment: Review of recent progress. Remote Sens. 2025, 17, 34. [Google Scholar] [CrossRef]
- Gao, X.; Wang, B.; Dai, W.; Liu, Y. A landslide susceptibility assessment method using SBAS-InSAR to optimize Bayesian network. Front. Environ. Sci. 2025, 13, 1522949. [Google Scholar] [CrossRef]
- Merghadi, A.; Abderrahmane, B.; Tien Bui, D. Landslide susceptibility assessment at Mila Basin (Algeria): A comparative assessment of prediction capability of advanced machine learning methods. ISPRS Int. J. Geo-Inf. 2018, 7, 268. [Google Scholar] [CrossRef]
- Nhu, V.-H.; Mohammadi, A.; Shahabi, H.; Bin Ahmad, B.; Al-Ansari, N.; Shirzadi, A.; Clague, J.J.; Jaafari, A.; Chen, W.; Nguyen, H. Landslide susceptibility mapping using machine learning algorithms and remote sensing data in a tropical environment. Int. J. Environ. Res. Public Health 2020, 17, 4933. [Google Scholar] [CrossRef]
- Ado, M.; Amitab, K.; Maji, A.K.; Jasińska, E.; Gono, R.; Leonowicz, Z.; Jasiński, M. Landslide susceptibility mapping using machine learning: A literature survey. Remote Sens. 2022, 14, 3029. [Google Scholar] [CrossRef]
- Hou, M.; Wang, Y.; Bai, X.; Yuan, R. Evaluation of landslide susceptibility in the northern section of the Xiaojiang fault zone based on factor optimization. Landslides 2025, 22, 1743–1760. [Google Scholar] [CrossRef]
- Li, X.; Chong, J.; Lu, Y.; Li, Z. Application of information gain in the selection of factors for regional slope stability evaluation. Bull. Eng. Geol. Environ. 2022, 81, 407. [Google Scholar] [CrossRef]
- Wubalem, A.; Meten, M. Landslide Susceptibility Mapping Using Information Value and Logistic Regression Models in Goncha Siso Eneses Area, Northwestern Ethiopia. SN Appl. Sci. 2020, 2, 807. [Google Scholar] [CrossRef]
- Guo, Z.; Guo, F.; Zhang, Y.; He, J.; Li, G.; Yang, Y.; Zhang, X. A Python system for regional landslide susceptibility assessment by integrating machine learning models and its application. Heliyon 2023, 9, e21542. [Google Scholar] [CrossRef]
- Silalahi, F.E.S.; Hidayat, F.; Jetten, V. Landslide susceptibility assessment using frequency ratio model in Bogor, West Java, Indonesia. Geosci. Lett. 2019, 6, 10. [Google Scholar] [CrossRef]
- Meng, X.; Liu, X.; Wang, Y.; Zhang, H.; Guo, X. Submarine landslide susceptibility assessment integrating frequency ratio with supervised machine learning approach. Appl. Ocean. Res. 2024, 153, 104237. [Google Scholar] [CrossRef]
- Kumar, A.; Kanga, S.; Choudhury, U.; Singh, S.K.; Rana, R.S.; Meraj, G.; Kumar, P. Landslide susceptibility mapping using statistical information value model: A case study of part of Chamoli District, Uttarakhand India. Risk Anal. 2025. [Google Scholar] [CrossRef] [PubMed]
- Cao, X.; Wu, B.; Shang, Y.; Wang, W.; Xu, T.; Li, Q.; Meng, H. Evaluation of landslide susceptibility in Tekes County, Yili Prefecture based on the information quantity method. Appl. Sci. 2024, 14, 6053. [Google Scholar] [CrossRef]
- Cui, Y.; Chen, C.; Zhu, L.; Xu, C.; Xu, M.; Zheng, J. Spatial distribution law of landslides and landslide susceptibility assessment in the eastern Himalayan syntaxis region. Q. J. Eng. Geol. Hydrogeol. 2024, 57, qjegh2023-144. [Google Scholar] [CrossRef]
- Ladel, L.; Mastere, M.; Kader, S.; Spalević, V.; Dudić, B. Machine learning methods for landslide mapping studies: A comparative study of SVM and RF algorithms in the Oued Aoulai watershed (Morocco). Open Geosci. 2025, 17, 20220740. [Google Scholar] [CrossRef]
- Duan, G.; Hu, J.; Deng, L.; Fu, J. Landslide susceptibility prediction by gray wolf optimized support vector machine model under different factor states. J. Appl. Remote Sens. 2023, 17, 044510. [Google Scholar] [CrossRef]
- Luo, J.; Zhao, Z.; Li, W.; Huang, L.; Zhao, W. Landslide hazard assessment of an urban agglomeration in central Guizhou Province based on an information value method and SVM, bagging, DNN algorithm. Sci. Rep. 2025, 15, 2483. [Google Scholar] [CrossRef]
- Nanehkaran, Y.A.; Chen, B.; Cemiloglu, A.; Chen, J.; Anwar, S.; Azarafza, M.; Derakhshani, R. Riverside landslide susceptibility overview: Leveraging artificial neural networks and machine learning in accordance with the United Nations (UN) sustainable development goals. Water 2023, 15, 2707. [Google Scholar] [CrossRef]
- Liu, H.; Ding, Q.; Yang, X.; Liu, Q.; Deng, M.; Gui, R. A knowledge-guided approach for landslide susceptibility mapping using convolutional neural network and graph contrastive learning. Sustainability 2024, 16, 4547. [Google Scholar] [CrossRef]
- Amato, G.; Fiorucci, M.; Martino, S.; Lombardo, L.; Palombi, L. Earthquake-triggered landslide susceptibility in Italy by means of artificial neural network. EarthArXiv, 2021; preprint. [Google Scholar] [CrossRef]
- Youssef, K.; Shao, K.; Moon, S.; Bouchard, L.S. Landslide susceptibility modeling by interpretable neural network. Commun. Earth Environ. 2023, 4, 162. [Google Scholar] [CrossRef]
- Khan, D.; Akram, W.; Ullah, S. Enhancing landslide susceptibility predictions with XGBoost and SHAP: A data-driven explainable AI method. Geocarto Int. 2025, 40, 2514725. [Google Scholar] [CrossRef]
- Rondinone, M.; Dal Sasso, S.F.; Aung, H.H.; Contillo, L.; Dimola, G.; Schiattarella, M.; Fiorentino, M.; Telesca, V. Assessing flood and landslide susceptibility using XGBoost: Case study of the Basento River in southern Italy. Appl. Sci. 2025, 15, 5290. [Google Scholar] [CrossRef]
- Dou, J.; Yunus, A.P.; Bui, D.T.; Merghadi, A.; Sahana, M.; Zhu, Z.; Chen, C.-W.; Khosravi, K.; Yang, Y.; Pham, B.T. Assessment of advanced random forest and decision tree algorithms for modeling rainfall-induced landslide susceptibility in the Izu-Oshima volcanic island, Japan. Sci. Total Environ. 2019, 662, 332–346. [Google Scholar] [CrossRef]
- Bammou, Y.; Benzougagh, B.; Ouallali, A.; Kader, S.; Raougua, M.; Igmoullan, B. Improving landslide susceptibility mapping in semi-arid regions using machine learning and geospatial techniques. DYSONA-Appl. Sci. 2025, 6, 269–290. [Google Scholar] [CrossRef]
- Zhang, W.; He, Y.; Wang, L.; Liu, S.; Meng, X. Landslide susceptibility mapping using random forest and extreme gradient boosting: A case study of Fengjie County, Chongqing, China. Geol. J. 2023, 58, 2372–2387. [Google Scholar] [CrossRef]
- Wu, X.; Song, Y.; Chen, W.; Kang, G.; Qu, R.; Wang, Z.; Wang, J.; Lv, P.; Chen, H. Analysis of geological hazard susceptibility of landslides in Muli County based on random forest algorithm. Sustainability 2023, 15, 4328. [Google Scholar] [CrossRef]
- Gaidzik, K.; Ramírez-Herrera, M.T. The importance of input data on landslide susceptibility mapping. Sci. Rep. 2021, 11, 19334. [Google Scholar] [CrossRef] [PubMed]
- Achu, A.L.; Aju, C.D.; Di Napoli, M.; Prakash, P.; Gopinath, G.; Shaji, E.; Chandra, V. Machine-learning based landslide susceptibility modelling with emphasis on uncertainty analysis. Geosci. Front. 2023, 14, 101657. [Google Scholar] [CrossRef]
- Novellino, A.; Pennington, C.; Leeming, K.; Taylor, S.; Alvarez, I.G.; McAllister, E.; Arnhardt, C.; Winson, A. Mapping landslides from space: A review. Landslides 2024, 21, 1041–1052. [Google Scholar] [CrossRef]
- Guo, Z.; Tian, B.; Zhu, Y.; He, J.; Zhang, T. How Do the Landslide and Non-Landslide Sampling Strategies Impact Landslide Susceptibility Assessment?—A Catchment-Scale Case Study from China. J. Rock Mech. Geotech. Eng. 2024, 16, 877–894. [Google Scholar] [CrossRef]
- Rabby, Y.W.; Li, Y.; Hilafu, H. An objective absence data sampling method for landslide susceptibility mapping. Sci. Rep. 2023, 13, 1740. [Google Scholar] [CrossRef] [PubMed]
- Gu, T.; Duan, P.; Wang, M.; Li, J.; Zhang, Y. Effects of non-landslide sampling strategies on machine learning models in landslide susceptibility mapping. Sci. Rep. 2024, 14, 7201. [Google Scholar] [CrossRef] [PubMed]
- Yang, C.; Liu, L.-L.; Huang, F.; Huang, L.; Wang, X.-M. Machine Learning-Based Landslide Susceptibility Assessment with Optimized Ratio of Landslide to Non-Landslide Samples. Gondwana Res. 2023, 123, 198–216. [Google Scholar] [CrossRef]
- Dornik, A.; Drăguţ, L.; Oguchi, T.; Hayakawa, Y.; Micu, M. Influence of sampling design on landslide susceptibility modeling in lithologically heterogeneous areas. Sci. Rep. 2022, 12, 2106. [Google Scholar] [CrossRef]
- Zhou, C.; Wang, Y.; Cao, Y.; Singh, R.P.; Ahmed, B.; Motagh, M.; Wang, Y.; Chen, L.; Tan, G.; Li, S. Enhancing Landslide Susceptibility Modelling through a Novel Non-Landslide Sampling Method and Ensemble Learning Technique. Geocarto Int. 2024, 39, 2327463. [Google Scholar] [CrossRef]
- Fu, Z.; Wang, F.; Dou, J.; Nam, K.; Ma, H. Enhanced Absence Sampling Technique for Data-Driven Landslide Susceptibility Mapping: A Case Study in Songyang County, China. Remote Sens. 2023, 15, 3345. [Google Scholar] [CrossRef]
- Fu, Y.; Fan, Z.; Li, X.; Wang, P.; Sun, X.; Ren, Y.; Cao, W. The Influence of Non-Landslide Sample Selection Methods on Landslide Susceptibility Prediction. Land 2025, 14, 722. [Google Scholar] [CrossRef]
- Tang, L.; Yu, X.; Jiang, W.; Zhou, J. Comparative study on landslide susceptibility mapping based on unbalanced sample ratio. Sci. Rep. 2023, 13, 5823. [Google Scholar] [CrossRef]
- Yang, S.; Tan, J.; Luo, D.; Li, B.; Chen, Q.; Xie, F. Sample size effects on landslide susceptibility models: A comparative study of heuristic, statistical, machine learning, deep learning and ensemble learning models with SHAP analysis. Comput. Geosci. 2024, 193, 105723. [Google Scholar] [CrossRef]
- Xu, Z.; Wang, S.; Yin, M.; Zhang, X.; Lu, Z.; Yu, S.; Huang, J. Landslide susceptibility assessment via imbalanced data augmentation with tabular variational autoencoder and quality–diversity post-selection. Appl. Sci. 2025, 15, 11965. [Google Scholar] [CrossRef]
- Felsberg, A.; Poesen, J.; Bechtold, M.; Vanmaercke, M.; De Lannoy, G.J.M. Estimating Global Landslide Susceptibility and Its Uncertainty through Ensemble Modeling. Nat. Hazards Earth Syst. Sci. 2022, 22, 3063–3082. [Google Scholar] [CrossRef]
- Xiao, T.; Huang, W.; Wang, L.; Yang, B.; Qin, Z.; Liu, X.; Xiao, Y. Uncertainty-Aware Ensemble Learning and Dynamic Threshold Optimization for Landslide Susceptibility Mapping. Comput. Geosci. 2026, 206, 106042. [Google Scholar] [CrossRef]
- Loche, M.; Alvioli, M.; Marchesini, I.; Bakka, H.; Lombardo, L. Landslide susceptibility maps of Italy: Lesson learnt from dealing with multiple landslide types and the uneven spatial distribution of the national inventory. Earth-Sci. Rev. 2022, 232, 104125. [Google Scholar] [CrossRef]
- Breiman, L. Random Forests. Mach. Learn. 2001, 45, 5–32. [Google Scholar] [CrossRef]
- Belgiu, M.; Drăguţ, L. Random Forest in Remote Sensing: A Review of Applications and Future Directions. ISPRS J. Photogramm. Remote Sens. 2016, 114, 24–31. [Google Scholar] [CrossRef]
- Fawcett, T. An Introduction to ROC Analysis. Pattern Recognit. Lett. 2006, 27, 861–874. [Google Scholar] [CrossRef]
- Yilmaz, A.E.; Demirhan, H. Weighted kappa measures for ordinal multi-class classification performance. Appl. Soft Comput. 2023, 134, 110020. [Google Scholar] [CrossRef]
- Rainio, O.; Teuho, J.; Klén, R. Evaluation metrics and statistical tests for machine learning. Sci. Rep. 2024, 14, 6086. [Google Scholar] [CrossRef]
- Yang, Z.; Jiang, X.; Zheng, M.; Guo, Q. Effects of SBAS-InSAR Deformation Integration Methods and Machine Learning Model Selection on Landslide Susceptibility Mapping. IEEE Access 2025, 13, 98622–98638. [Google Scholar] [CrossRef]
- Wang, J.; Wang, Y.; Li, M.; Qi, Z.; Li, C.; Qi, H.; Zhang, X. Improved Landslide Susceptibility Assessment: A New Negative Sample Collection Strategy and a Comparative Analysis of Zoning Methods. Ecol. Indic. 2024, 169, 112948. [Google Scholar] [CrossRef]
- Jiang, W.; Li, L.; Niu, R. Impact of Non-Landslide Sample Sampling Strategies and Model Selection on Landslide Susceptibility Mapping. Appl. Sci. 2025, 15, 2132. [Google Scholar] [CrossRef]
- Tu, L.; Chen, M.; Leng, P.; Liu, S.; Liu, M.; Luo, W.; Mao, Y. Improving Landslide Susceptibility Assessment Through Non-Landslide Sampling Strategies. Land 2025, 14, 2059. [Google Scholar] [CrossRef]
- Zhu, Y.; Sun, D.; Wen, H.; Zhang, Q.; Ji, Q.; Li, C.; Zhou, P.; Zhao, J. Considering the effect of non-landslide sample selection on landslide susceptibility assessment. Geomat. Nat. Hazards Risk 2024, 15, 2392778. [Google Scholar] [CrossRef]
- Liu, L.-L.; Zhang, Y.-L.; Xiao, T.; Yang, C. A frequency ratio–based sampling strategy for landslide susceptibility assessment. Bull. Eng. Geol. Environ. 2022, 81, 360. [Google Scholar] [CrossRef]
- Zhu, Y.; Liu, S.; Yin, K.; Zeng, T.; Guo, Z.; Liu, Z.; Yang, H. Impact of negative sampling strategies on landslide susceptibility assessment. Adv. Space Res. 2025, 76, 592–613. [Google Scholar] [CrossRef]
- Zhao, L.; Ma, H.; Dong, J.; Wu, X.; Xu, H.; Niu, R. A Comparative Study of Landslide Susceptibility Mapping Using Bagging PU Learning in Class-Prior Probability Shift Datasets. Remote Sens. 2023, 15, 5547. [Google Scholar] [CrossRef]
- Wang, H.; Wu, W.; Yang, W.; Liu, M. Examining the Contribution of Lithology and Precipitation to the Performance of Earthquake-Induced Landslide Hazard Prediction. Front. Earth Sci. 2024, 12, 1431203. [Google Scholar] [CrossRef]
- Li, M.; Tian, H. Insights from Optimized Non-Landslide Sampling and SHAP Explainability for Landslide Susceptibility Prediction. Appl. Sci. 2025, 15, 1163. [Google Scholar] [CrossRef]
- Wu, X.; Qi, X.; Peng, B.; Wang, J. Optimized Landslide Susceptibility Mapping and Modelling Using the SBAS-InSAR Coupling Model. Remote Sens. 2024, 16, 2873. [Google Scholar] [CrossRef]
- Deng, J.-H.; Guo, H.-Y.; Cui, H.-Z.; Ji, J. Optimizing Landslide Susceptibility Mapping with Non-Landslide Sampling Strategy and Spatio-Temporal Fusion Models. Water 2025, 17, 1778. [Google Scholar] [CrossRef]
- Shao, X.; Ma, S.; Xu, C.; Zhou, Q. Effects of Sampling Intensity and Non-Slide/Slide Sample Ratio on the Occurrence Probability of Coseismic Landslides. Geomorphology 2020, 363, 107222. [Google Scholar] [CrossRef]
- Mirus, B.B.; Belair, G.M.; Wood, N.J.; Jones, J.; Martinez, S.N. Parsimonious high-resolution landslide susceptibility modeling at continental scales. AGU Adv. 2024, 5, e2024AV001214. [Google Scholar] [CrossRef]
Disclaimer/Publisher’s Note: The statements, opinions and data contained in all publications are solely those of the individual author(s) and contributor(s) and not of MDPI and/or the editor(s). MDPI and/or the editor(s) disclaim responsibility for any injury to people or property resulting from any ideas, methods, instructions or products referred to in the content. |
© 2025 by the authors. Licensee MDPI, Basel, Switzerland. This article is an open access article distributed under the terms and conditions of the Creative Commons Attribution (CC BY) license.