Abstract
Fe3+ and Fe2+ are widely present in red sandstone. However, systematic studies on the establishment of a quantitative relationship between the Fe3+/Fe2+ ratio and weathering degree of rock are scarce. In this study, on the basis of the coexistence characteristics of Fe2+ and Fe3+, as well as the ability of Fe2+ to form a stable orange–red complex with o-phenanthroline, an optimized o-phenanthroline spectrophotometric method for the multitarget determination of total iron, Fe2+, and Fe3+ was proposed and used to measure trace iron in the vertical profile of red sandstone. The effectiveness and reliability of the proposed method were validated via X-ray fluorescence spectroscopy (XRFS) and potassium dichromate titration. The results demonstrate that o-phenanthroline spectrophotometry offers advantages such as a low detection limit, high precision, and simple operation for the determination of trace iron in red sandstone. The vertical distribution pattern of the Fe2+/Fe3+ ratio is generally consistent with the macroscopic weathering intervals indicated by traditional chemical weathering indices. These findings suggest that the Fe2+/Fe3+ ratio has the potential to characterize vertical weathering zones and can serve as a simple auxiliary indicator for the rapid preliminary identification and classification of the relative weathering zones of red sandstone.
1. Introduction
Red sandstone, a widely distributed sedimentary rock, plays a significant role in engineering construction, geological disaster prevention, and ecological environmental protection because of its weathering and degradation processes [1,2,3]. As one of the countries with the most extensive distribution of red layers, China has an exposed red layer area of 9.16 × 10⁵ km2, approximately 9.5% of its total land area [4]. The weathering evolution mechanisms and stability assessment of red sandstone have drawn ongoing attention from both academia and the engineering community. Currently, the evaluation of weathering degree in red sandstone largely relies on physical and mechanical indicators (such as uniaxial compressive strength, porosity, and wave velocity) or chemical weathering indices based on major element migration (e.g., the Chemical Index of Alteration (CIA), Chemical Index of Weathering (CIW), and Index of Compositional Variability (ICV)) [5,6,7,8,9,10,11]. Although these methods reflect weathering effects at the macro level, they are limited in capturing the microscopic processes of redox transformations of iron and their response relationships.
In red sandstone, iron, a typical mineral component, exists mainly in the forms of Fe2+ and Fe3+. The transformation and content variations of iron not only reflect the oxidation—reduction conditions of the surrounding environment but are also key factors driving changes in rock color, mechanical properties, and overall stability degradation [12,13,14]. Therefore, accurately revealing the transformation patterns of iron during the weathering process is crucial for understanding the weathering mechanisms of red sandstone and for quantitatively assessing its degree of weathering.
Current iron analysis techniques, such as atomic absorption spectroscopy, X-ray fluorescence spectroscopy (XRF), and potassium dichromate titration, mostly measure the total iron content or face challenges when Fe2+ and Fe3+ are measured simultaneously, including complex processing, cumbersome operation, and difficulty in achieving accurate multitarget measurements within the same system [15,16,17,18,19]. Especially in iron-rich lithologies such as red sandstone, there is still a lack of efficient, accurate, and simple methods for the simultaneous analysis of multivalent iron, which severely limits the in-depth study and practical application of the redox behavior of iron and its relationship to weathering responses.
Spectrophotometry, owing to its simplicity, low cost, and high sensitivity, has been widely used for determining the iron content in geological samples. Among these methods, the o-phenanthroline spectrophotometric method, a classical technique, has shown good potential in the analysis of silicate rocks, soils, and water bodies [20,21,22,23,24,25,26]. Current approaches require multiple and complex pretreatment steps (e.g., repeated digestion and extraction), resulting in lengthy workflows that are difficult to adapt to continuous analysis of large numbers of samples over extended periods. Moreover, most conventional methods focus on the determination of total iron content and cannot achieve simultaneous and accurate quantification of Fe2+ and Fe3+. When separate determination of iron valence states is required, additional steps such as digestion and interference masking must be introduced, further reducing analytical efficiency. Consequently, existing methods fail to meet the demand in red sandstone geological studies for rapid, efficient, and low-cost analysis of multivalent iron. The core limitations of existing methods constitute precisely the starting point for the innovation of the ‘simultaneous multivalent iron determination method’ proposed in this study—by simplifying the pretreatment workflow and optimizing the valence-state identification scheme, both analytical efficiency and accuracy are substantially improved.
Therefore, this study focuses on red sandstone from the Chishui Danxia landform area and aims to optimize the o-phenanthroline spectrophotometric method to establish an accurate, simple, and efficient multitarget chemical analysis method capable of simultaneously determining the total iron, Fe2+, and Fe3+ contents. On the basis of this method, this study analyzed the variation characteristics of the iron content with depth in vertical profile samples of red sandstone, further exploring the intrinsic relationship between the redox state of iron (e.g., the Fe2+/Fe3+ ratio) and weathering. The feasibility and applicability of quantitative weathering analysis of red sandstone with Fe2+ and Fe3+ as core indicators are also preliminarily assessed. This research provides new analytical tools for the study of weathering mechanisms in red sandstone.
2. Materials and Methods
2.1. Materials
2.1.1. Samples
This study examined fluvial-facies red sandstone from the Jiading Formation (Kjd) of the Cretaceous Jiading Group, which is widely distributed in the Chishui Danxia landform area (Figure 1a). In the field, massive red sandstone sections were selected for sampling (Figure 1b). Vertical drilling was performed with a handheld electric drill under dry conditions (Figure 1c). The drilled cores were sectioned into 5 mm layers, which were subsequently ground into powder via a handheld diamond-bit grinder (Figure 1d). The powdered material was sieved through a 200-mesh nylon sieve, dried, sealed, and stored in a desiccator for subsequent analysis.
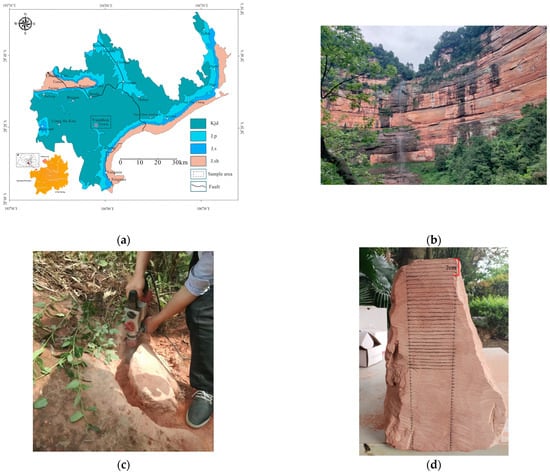
Figure 1.
Study sample details: (a) Geological map showing the sampling locations in the study area; (b) Natural characteristics of red sandstone; (c) Drilling site for rock block sampling; (d) Powdered sample slices, each 5 mm thick.
Scanning electron microscopy and polarized light microscopy (100×) observations (Figure 2) revealed that the red sandstone has a medium-grained texture and a quartz content exceeding 90%. The quartz grains are mostly irregular and poorly sorted. Minor components include feldspar, iron, clay, and other trace materials. Iron primarily occurs as cement between grains.
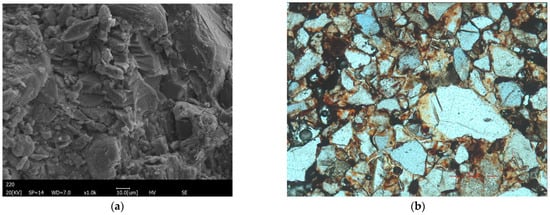
Figure 2.
Microscopic characteristics of red sandstone in the study area: (a) Scanning electron micrograph (SEM); (b) Photomicrograph under polarized light (100×).
2.1.2. Reagents
- A 25 mg/L Fe2+ standard solution was prepared by dissolving 0.702 g of ferrous ammonium sulfate in 50 mL of 50% sulfuric acid and diluting the solution to 100 mL. An aliquot of 25 mL was then transferred to a 100 mL volumetric flask and diluted to volume.
- A 3.6 mol/L dilute sulfuric acid solution was obtained by mixing one part concentrated sulfuric acid with 4 parts deionized water and then cooling the mixture to room temperature.
- A 0.5% o-phenanthroline solution (chromogenic agent) was prepared by dissolving 0.5 g of o-phenanthroline (Tianjin Comio Chemical Reagent Co., Ltd., Tianjin, China) in 40 mL of deionized water. Three to five drops of concentrated hydrochloric acid were added to facilitate dissolution, after which the solution was diluted to 100 mL for immediate use. The reaction between o-phenanthroline and Fe2+ formed a stable, orange Fe2+–Phen complex within a pH range of 2–9.
- A 10% hydroxylamine hydrochloride solution (reducing agent) was prepared by dissolving 10 g of hydroxylamine hydrochloride (Tianjin Comio Chemical Reagent Co., Ltd., Tianjin, China) in 40 mL of deionized water and diluting it to 100 mL. This reagent reduced all the Fe3+ to Fe2+ in solution.
- A 40% acetic acid-ammonium acetate buffer solution (buffer solution) was prepared by dissolving 40 g of ammonium acetate (Chengdu Jinshan Chemical Reagent Co., Ltd., Chengdu, China) in a volumetric flask and then adding 50 mL of glacial acetic acid (Tianjin Fuyu Fine Chemical Co., Ltd., Tianjin, China) before diluting to 100 mL. This buffer solution maintained a stable pH for color development of the Fe2+–Phen complex.
- High-purity hydrofluoric acid (Shanghai Wokai Biotechnology Co., Ltd., Shanghai, China), a highly reactive reagent toward siliceous materials, was used to dissolve the quartz in the red sandstone and to mask the presence of Fe3+.
All reagents, except concentrated sulfuric and hydrochloric acid obtained from the laboratory, were of analytical reagent grade (AR) and met national purity standards. Deionized water was freshly prepared for all the experiments.
2.2. Methods
The core of this study lies in the strategic utilization of the ability of o-phenanthroline and Fe2+ to rapidly form a stable orange–red Fe2+–Phen complex within the pH range of 2–9. Specifically, the sample is first subjected to acid digestion via a sulfuric acid—fluoric acid—phenanthroline system. During the heating process in a water bath that facilitates sample dissolution, the released Fe2+ immediately complexes with o-phenanthroline in the solution, forming a stable Fe2+–Phen complex. This “in situ complexation protection” strategy effectively prevents the oxidation of Fe2+ by air under acidic heating conditions, thus ensuring the accuracy of subsequent Fe2+ measurements.
On the basis of the resulting clear solution, this method allows for the separate determination of Fe2+ and total iron, and the Fe3+ content is subsequently calculated by difference. The specific procedure was as follows: a measured volume of the clear solution was diluted, and the absorbance was measured to determine the Fe2+ concentration. Another measured volume of the clear solution was treated with hydroxylamine hydrochloride to completely reduce Fe3+ to Fe2+. Owing to the excess o-phenanthroline present in the solution, the newly formed Fe2+ quickly complexed with it. After reaching a constant volume, the absorbance was measured to determine the total iron concentration. This design significantly reduces reagent consumption and operational steps, successfully addressing the issues of complex procedures and excessive reagent use in traditional methods. This enables the efficient and accurate simultaneous determination of total iron, Fe2+, and Fe3+ in the same solution.
Given the high reactivity of Fe2+ in solution, any factors that may lead to the oxidation of Fe2+ will result in an underestimation of the Fe2+ concentration, thereby affecting the reliability of the total iron and Fe3+ data. Therefore, it is crucial to precisely follow each step in the experiment to ensure the accuracy and reliability of the final analytical results.
2.2.1. Equipment
A UV-752 N UV—visible spectrophotometer (Shanghai Yuanxi Instrument Co., Ltd., Shanghai, China) equipped with a 10 mm glass cuvette was used for absorbance measurements.
2.2.2. Dissolution
A 50 mg sample of powdered red sandstone (200 mesh) was weighed and transferred to a transparent centrifuge tube. Next, 1.0 mL of chromogenic agent, 8.0 mL of 3.6 mol/L dilute sulfuric acid, and 0.8 mL of hydrofluoric acid were added sequentially. The mixture was then heated in a constant-temperature water bath at 90 °C for 2 h. Maintaining this temperature ensured complete dissolution of the sample while avoiding interference from water boiling, resulting in a clear solution, referred to as the “mother liquor,” which was used for subsequent aliquot sampling and analysis. The volume of “mother liquor” was not subjected to any additional volume adjustment; rather, the final volume after the dissolution reaction was completed and the solution had cooled to room temperature was used.
2.2.3. Color Development
For Fe2+ determination, 3.0 mL of clear solution (mother liquor) was transferred to a colorimetric tube. Subsequently, 0.5 mL of the chromogenic agent and 5.0 mL of the buffer solution were added sequentially, and the final volume was adjusted to 10.0 mL. Volume adjustments were made as needed to optimize color development. For total iron determination, 0.5 mL of the clear solution was transferred to a colorimetric tube, followed by the addition of 1.0 mL of 10% hydroxylamine hydrochloride to reduce Fe3+ to Fe2+. Next, 0.5 mL of the chromogenic agent and 5.0 mL of the buffer solution were added to reach a constant volume. These steps produced the chromogenic solution for measurement. The sequence of added reagents—dissolving the sample, adding the clear solution, reducing agent (for total iron), chromogenic agent, and finally the buffer solution—was strictly maintained, as it critically influences color development.
2.2.4. Colorimetry
The freshly prepared chromogenic solution was incubated in a water bath at 30 °C for 20−40 min. When the ambient temperature exceeded 25 °C, the solution was allowed to develop at room temperature. The spectrophotometer was calibrated at 510 nm using a 10 mm glass cuvette, with the blank (nonsample) serving as the reference. Absorbance measurements for Fe2+ and total iron were then performed separately.

2.3. Standard Curve
Various volumes of 25 mg/L Fe2+ standard solution were pipetted into colorimetric tubes. Each tube received 1 mL of 30% hydrochloric acid, 1 mL of 10% hydroxylamine hydrochloride, 2 mL of 0.5% o-phenanthroline, and 5 mL of 40% acetic acid-ammonium acetate buffer solution, after which the mixture was diluted to a final volume of 50 mL. The samples were incubated in a water bath at 30 °C for 20 min, after which the absorbance was measured at 510 nm. A solution without Fe2+ served as the blank reference. The standard curve relating the Fe2+ concentration to absorbance was established as shown in Equation (1), with a correlation coefficient of R2 = 0.9999, indicating a strong linear relationship.
y = 4.8355x − 0.0164
3. Results and Discussion
3.1. Optimization of Experimental Conditions and Reagent Usage
3.1.1. Sample
Accurate sample weighing is critical for minimizing experimental errors. Insufficient sample mass can increase weighing and measurement errors, whereas excessive sample mass may impede complete dissolution and reduce the solution volume, amplifying pipetting errors. Therefore, achieving complete dissolution and controlling errors associated with small sampling volumes are essential. In this study, dried red sandstone samples with particle sizes of 50 mg and 200 mesh were used for analysis.
3.1.2. Dissolution Optimization
The high silica content in the red sandstone samples necessitated the use of the sulfuric acid-hydrofluoric acid method. Solution acidity plays a critical role in the dissolution rate and analytical precision. In this study, a 3.6 mol/L dilute sulfuric acid solution was used to facilitate sample dissolution and prevent Fe2+ oxidation. Hydrofluoric acid was additionally employed to dissolve silicon dioxide and to mask Fe3+ interference [21].
Insufficiently dilute sulfuric acid can result in low H+ concentrations, promoting Fe2+ oxidation, incomplete sample dissolution, and reduced Fe2+ detection. Conversely, excessive sulfuric acid enhances mineral dissolution but decreases the Fe2+ concentration, requiring larger buffer volumes for Fe2+–Phen complex formation. This increases the final solution volume, weakens the color effect, reduces the absorbance, and introduces additional errors. Similarly, inadequate hydrofluoric acid slows silica and iron dissolution, whereas excessive F− reacts with Fe2+, impeding Fe2+–Phen complexation and reducing determination accuracy. Therefore, extensive experimentation was conducted to identify the optimal acid volume.
Multiple groups of identical samples were treated with 1 mL of 0.5% o-phenanthroline and varying volumes of hydrofluoric acid and dilute sulfuric acid and then heated in a 90 °C water bath. At a constant sulfuric acid volume, increasing hydrofluoric acid accelerated mineral dissolution and caused quicker solution fading. The critical hydrofluoric acid threshold was determined to be 0.6 mL. Below this threshold, higher sulfuric acid volumes hinder solution fading and mineral dissolution. Above this threshold, the sulfuric acid volume had minimal impact, allowing complete sample dissolution within 2 h. Combinations with less than 0.6 mL of hydrofluoric acid that remained undissolved after 2 h were excluded. Optimal dissolution was achieved via the use of 8 mL of 3.6 mol/L dilute sulfuric acid and 0.8 mL of hydrofluoric acid, resulting in solution discoloration within 30 min and complete dissolution without precipitation after 70 min. This confirmed that silica can be efficiently dissolved with minimal hydrofluoric acid, while preserving Fe2+ requires sufficient sulfuric acid.
To prevent Fe2+ oxidation, o-phenanthroline was added during dissolution, facilitating the formation of stable Fe2+–Phen complexes. As illustrated in Figure 3a, five representative red sandstone samples (which may vary in mineral composition and iron content, reflecting the broader applicability of the method) were randomly selected. For each sample, two parallel experiments were performed: one with o-phenanthroline added and one without. The experimental results clearly demonstrated that, under the same acid dissolution system (sulfuric acid-hydrofluoric acid) and dissolution conditions, the absorbance values corresponding to Fe2+ measured after the addition of o-phenanthroline were consistently greater than those in the control group without o-phenanthroline. This result strongly supports the conclusion that the simultaneous addition of o-phenanthroline during the dissolution stage effectively complexes and protects the newly released Fe2+, preventing its oxidation during dissolution and thereby increasing the accuracy of the Fe2+ measurements. These complexes exhibit considerable thermal stability and remain intact throughout the dissolution process. Additionally, an appropriate concentration of F− effectively masked Fe3+, minimizing its interference with Fe2+ determination.

Figure 3.
Effect of the amount of chromogenic agent: (a) Dissolution process; (b) Color development process.
3.1.3. O-Phenanthroline Concentration
Excess o-phenanthroline is required to minimize interference from other ions and to ensure complete complexation of Fe2+ with o-phenanthroline to form the Fe2+–Phen complex. As illustrated in Figure 3b, adding 0.4 mL of o-phenanthroline reagent to the chromogenic solution produced the maximum absorbance, which remained stable with further increases in dosage. To ensure full complexation, 1 mL of o-phenanthroline was added during the dissolution step, and 0.5 mL was added during color development.
3.1.4. Hydroxylamine Hydrochloride Concentration
To determine the total iron content, excess hydroxylamine hydrochloride was added to reduce Fe3+ to Fe2+. One milliliter of 10% hydroxylamine hydrochloride was used in accordance with LY/T1262−1999 [27] (Measurement of available iron in forest soil) and HJ/T345−2007 [28] (Determination of iron in water quality o–phenanthroline spectrophotometry). Both the experimental and calculated results confirmed that this concentration effectively achieved complete reduction.
3.1.5. Buffer Solution Concentrations
The acetic acid-ammonium acetate buffer solution plays a crucial role in regulating the pH of the chromogenic solution, thereby maintaining a stable environment for the Fe2+–Phen complex. Excessive buffer solution addition during trace Fe2+ determination can inhibit color development, whereas insufficient buffering can create an overly acidic environment that weakens color formation. To ensure the stability of the Fe2+–Phen complex, the pH of the chromogenic solution must be maintained between 4 and 6. During the experiment, hydroxylamine hydrochloride and o-phenanthroline were added sequentially to the clear solution, followed by gradual addition of the buffer solution while the pH was monitored with test paper. The addition of 4 mL of buffer solution produced a pH of approximately 4, which is suitable for Fe2+ determination. For this study, 5 mL of buffer solution was selected to ensure a stable chromogenic environment. Importantly, the laboratory temperature was maintained above the freezing point of glacial acetic acid (16.6 °C) to ensure consistent experimental conditions.
3.1.6. Chromogenic Time and Temperature
After preparation, the chromogenic solution required a controlled incubation period to ensure complete complex formation. Prolonged air exposure led to the oxidation of Fe2+ to Fe3+, causing gradual fading of the color of the solution. The color development response varied with temperature. For Fe2+ determination, incubation in a 30 °C water bath for 20 min produced a maximum and stable absorbance, which began to gradually decrease after 1 h. For total iron determination, the peak absorbance was reached after 10 min and remained stable for approximately 1 h. Maintaining the chromogenic solution at 30 °C for 20−40 min effectively minimized temperature-related variability and ensured reliable measurements.
3.2. Validation of Method Effectiveness
3.2.1. Detection Limit
Table 1 displays two sets of data, which are based on the results from 20 blank experiments. The absorbance of the blank solution was measured 20 times, and the corresponding concentration values were calculated to obtain the average and standard deviation for the blank solution.

Table 1.
Absorbance values and corresponding concentrations measured for the blank solution.
- Photometric Method
According to the Bessel formula method recommended by the IUPAC, the detection limit was calculated via Equation (2) [29,30,31,32]. Here, K is the coefficient corresponding to a selected confidence level; for n ≤ 20 in this study, K = 3. S denotes the standard deviation of repeated blank absorbance measurements, and b represents the method sensitivity (b = 4.8355), as determined from the standard curve.
- Integrated Concentration Method
A water environment monitoring standard introduces an integrated concentration method that provides a more comprehensive and accurate calculation process. The calculation formula is Equation (4). Here, tf is the value at a given degree of freedom f and a one-sided significance level of 0.05. In this study, ƒ = 20, and tf = 1.7247, as obtained from the t distribution table. Sωb represents the standard deviation of the concentration values from repeated measurements of the blank solution.
The results revealed that the instrument’s detection limit determined by the photometric method was 0.0007 mg/L, whereas the detection limit obtained by the integrated concentration method was 0.0249 mg/L. The corresponding detection limits for the Fe2+ and total iron mass fractions were 0.002% and 0.01%, respectively. These results demonstrate that both the instrument and method are suitable for detecting trace levels of Fe2+ and total iron.
3.2.2. Precision
Table 2 presents measurements of total iron and Fe2+ for two samples, each analyzed in 8 replicates according to the method proposed in this paper. The total iron and Fe2+ mass percentages and standard deviations (RSD) were calculated from the average absorbance values. As shown in Table 2, the relative standard deviation (RSD) values for Fe2+ and total iron ranged from 0.4% to 1.6%, indicating low variability and high measurement precision.
Table 2.
Experimental precision analysis.
3.2.3. Pike Recovery
Table 3 shows the results of the blank spiking recovery and sample spiking recovery experiments for Fe2+, which were carried out on two samples. The blank spiking recovery experiment involved adding 0.5, 1.0, and 1.5 mL of Fe2+ spiking solution to a dissolved 0 mg sample solution, with Fe2+ measured according to the proposed method. The recovery rate was obtained by comparing the calculated and measured values. The sample spiking recovery experiment was conducted similarly; a 50 mg sample was dissolved, and 0, 0.5, 1.0, and 1.5 mL of Fe2+ spiking solution was added. Fe2+ was measured according to the proposed method, and the recovery rate was calculated by comparing the measured and calculated values. The results revealed Fe2+ recovery rates of 95.18% to 101.35% for the blank samples and 92.56% to 94.74% for the samples. For total iron, the recovery rates ranged from 103.5% to 112% in the blank samples and 95% to 114% in the samples, confirming the reliability and accuracy of the method.
Table 3.
Spike recovery data results for Fe2+ analysis.
3.2.4. Comparative Analysis
Using the method proposed in this study, the mass fractions of iron in the red sandstone of the Chishui Danxia landform were determined. The results show that Fe2+ ranges from 0.01% to 0.10%, total iron ranges from 0.70% to 1.50%, and the calculated Fe3+ falls within the range of 0.70% to 1.50%.
Indeed, as noted in the study by Jochum et al. [33], most rock reference materials currently provide certified values for total iron (TFe2O3), whereas standard reference concentrations for Fe2+ and Fe3+ are relatively scarce [6,34,35]. To verify the accuracy of the proposed method, a preliminary evaluation was conducted using two approaches. First, the total iron (TFe2O3) concentrations obtained by this method were compared with those measured by X-ray fluorescence spectroscopy (XRFS). Second, the Fe2+ concentrations determined by this method were compared with the results obtained using the classical potassium dichromate titration method.
- X-ray Fluorescence Spectrometry
X-ray fluorescence spectrometry (XRFS) revealed that the TFe2O3 content ranged from 1.3% to 1.6% (Table 4), whereas the total iron mass fraction ranged from 1.011% to 1.2444%, closely aligning with the experimental results for total iron.
Table 4.
XRF analysis results for major elements in red sandstone samples along the vertical profile.
The surface layers of red sandstone are directly exposed to the atmosphere and are subject to a range of superficial factors, such as atmospheric deposition, rainwater leaching, sun exposure, weathering, and potential localized anthropogenic activities. Therefore, the higher value of 2.58% shown in Table 4 is a localized phenomenon under specific conditions and should not be interpreted as a general threshold or a typical representation of the iron content in the entire study target.
- Potassium Dichromate Volumetric
The Fe2+ concentrations were determined via the GB/T 673.8–2016 [36] standard method for iron chemical analysis, specifically the potassium dichromate volumetric method (CMA-certified). As shown in Table 5, except for sample Y-4—which may exhibit a marked deviation (+11.83%) due to limitations of the reference method at low concentrations—the proposed o-phenanthroline spectrophotometric method (eight parallel measurements, RSD = 2%) yields results that are consistent with those of the reference method (potassium dichromate titration), with relative deviations < 6% for most samples.
Table 5.
Data analysis of different determination methods.
Repeated experiments confirmed that Fe2+ and total iron in red sandstone can be accurately measured via o-phenanthroline spectrophotometry. This method provides low detection limits, high precision, and strong reproducibility, while remaining sensitive, accurate, simple to perform, and environmentally compatible. Furthermore, it enables simultaneous determination of Fe2+ and total iron from the same solution, effectively addressing the challenges posed by complex experimental procedures and reagent systems.
3.3. Applicability and Geological Significance
3.3.1. Trace Iron
This study applied the proposed method to quantify trace iron along a vertical profile of red sandstone in the Chishui Danxia landform area. The results are shown in Figure 4. The measured total iron mass fraction ranged from 0.70% to 1.50%. The surface layer (0–5 cm) presented relatively high concentrations, while values below 5 cm stabilized at approximately 0.90%. The measured Fe2+ mass fraction, which was calculated via subtraction, ranged from 0.70% to 1.5%, accounting for 77% to 98% of the total iron, and closely parallels the trend of total iron. The measured Fe2+ mass fraction ranges from 0.01% to 0.10%, exhibiting a distinct “high–low–high” pattern along the vertical profile: concentrations are elevated at the rock surface, decrease in the middle section (5–15 cm), and rise again at depths below 15 cm. The Fe2+/Fe3+ ratio shows a pattern highly consistent with that of Fe2+—the ratio is higher and fluctuates irregularly in the surface layer (0–5 cm), decreases and becomes more stable between 5 and 15 cm, and increases again below 15 cm. These findings indicate that variations in the Fe2+/Fe3+ ratio along the vertical profile of red sandstone are strongly influenced by local redox conditions.

Figure 4.
Variation in trace iron with vertical depth in red sandstone: (a) Total iron and Fe3+; (b) Fe2+ and Fe2+/Fe3+.
As weathering progresses, the grain size and relative content of weather-resistant minerals such as quartz in the surface layers of red sandstone decrease, whereas the content of clay minerals increases due to secondary alteration. Iron minerals are prone to weathering and are often closely associated with clay minerals [37]. Consequently, in the surface weathering zone, the total volume of iron minerals per unit volume may become relatively enriched because of the loss of minerals such as quartz. This provides the material basis for the higher Fe2+ and total iron contents in the surface layers [2]. The surface of red sandstone is generally covered with black biological films, which are composed of complex microbial communities (Figure 5a). Research indicates that many natural organic materials can act as electron donors and Fe2+ stabilizers [38,39]. Specifically, organic matter (or its degradation products) can reduce Fe3+ on ferric minerals (e.g., iron oxides/hydroxides) to Fe2+ [40]. Some organic materials can form soluble complexes with Fe2+, effectively slowing down or even preventing the reoxidation of Fe2+ to Fe3+ by atmospheric oxygen (Fe3+ + C + OH− → Fe2+ + CO2/HCO3− + H2O). Therefore, in surface layers rich in microorganisms and organic matter, even in the presence of atmospheric oxygen, this strong biological—chemical reduction and complexation stabilization may dominate, resulting in the generation and stabilization of Fe2+ and even the occurrence of a maximum Fe2+ concentration.
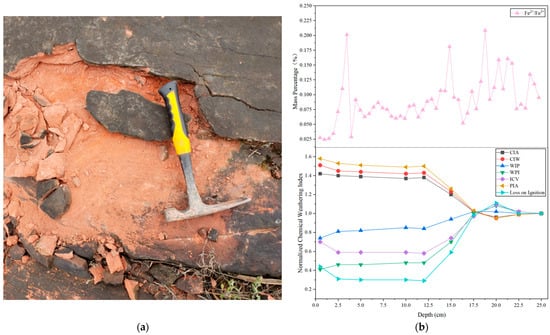
Figure 5.
(a) Flaking of red sandstone; (b) Variations in common chemical weathering indices with depth in red sandstone, along with the corresponding pattern of Fe2+/Fe3+.
For permeable red sandstone, oxygen from the atmosphere can theoretically diffuse into deeper layers through pores. In the shallow oxidation zone (5–15 cm), where the oxygen supply is relatively abundant, oxidation of Fe2+ may occur (Fe2+ + O2 + H2O → Fe3+ + OH−). If the reduction and stabilization mechanisms in this zone are insufficient to counteract oxidation, the Fe2+ concentration may decrease due to oxidation, creating a region of relatively low Fe2+ concentration or a transitional zone. In the deeper low-oxygen zone (greater than 15 cm), as depth increases, oxygen gradually becomes depleted through diffusion. In such anoxic or low-oxygen environments, the oxidation reaction of Fe2+ cannot continue, and the Fe2+ concentration may stabilize or even increase due to the weakening of oxidation or the accumulation of Fe2+.
3.3.2. Chemical Weathering Indices
Rock masses of varying lithologies exhibit distinct chemical weathering indices and varying sensitivities. To date, more than 20 chemical weathering indices have been proposed [41,42,43,44,45,46,47]. This study focuses on several commonly used indices (Table 6). The chemical weathering index for red sandstone was calculated via XRFS analysis, which measured 15 major elements along the vertical profile of the samples (Table 4). The weathering index at a depth of 25 cm was designated as the reference, and indices at other depths were normalized accordingly. This approach establishes the relationship between chemical weathering and vertical depth in rock.
Table 6.
Chemical weathering indices.
These indicators—including the Chemical Index of Alteration (CIA), Chemical Index of Weathering (CIW), Weathering Potential Index (WPI), Modified Weathering Index (MWPI), Index of Compositional Variability (ICV), Plagioclase Index of Alteration (PIA), and Loss on Ignition—exhibit distinct depth-dependent trends in red sandstone (Figure 5b). It is clear that traditional weathering indices are influenced by variations in active elements such as calcium, sodium, and potassium. On the basis of the trends of these indices, the studied profile can be divided into four characteristic zones: 0–2.5 cm, 2.5–12.5 cm, 12.5–17.5 cm, and >17.5 cm.
3.3.3. Geochemical Significance Analysis
A comparison of the Fe2+/Fe3+ ratio with various chemical weathering indices—including the CIA, CIW, WPI, ICV, and PIA—reveals that both the Fe2+/Fe3+ ratio and the indices display similar depth-dependent trends in red sandstone (Figure 5b). Although the microscopic control mechanisms of the Fe2+/Fe3+ ratio (such as biological reduction, oxidative environment, etc.) differ from those of traditional weathering indices (which are based on elemental migration), both provide consistent results in classifying the macro weathering zones (0–5 cm, 5–15 cm, >15 cm) in the red sandstone profile of this study. Given the consistency in the trends of these zones, the Fe2+/Fe3+ ratio can serve as a useful indicator for characterizing weathering zones along the vertical depth of red sandstone. Compared with traditional weathering indices, measuring the Fe2+/Fe3+ ratio offers the advantages of being simpler, faster, and more cost-effective, without the need for measuring multiple major elements. The specific conditions of our study area provide a supplementary method for quickly identifying and classifying macro weathering zones.
4. Conclusions
- A chemical analysis method for determining trace Fe2+ and total iron in red sandstone via o-phenanthroline spectrophotometry was established. This method has a low detection limit, high precision, and excellent recovery rates, confirming its reliability and practicality for trace Fe2+ and total iron determination.
- The addition of an appropriate amount of o-phenanthroline prior to sample dissolution effectively prevents Fe2+ oxidation. Simultaneously, F− from hydrofluoric acid acts as a masking agent for coexisting Fe3+, eliminating its interference. This approach enables multitarget analysis within a single solution and effectively simplifies the experimental process, reducing the need for multiple reagents in iron determination.
- The application of o-phenanthroline spectrophotometry to red sandstone samples from the Chishui Danxia landform area revealed Fe2+ contents ranging from 0.01% to 0.10% and total iron contents ranging from 0.70% to 1.50%. The calculated Fe3+ content ranged from 0.70% to 1.50%.
- In the red sandstone of the study area, the vertical distribution of the Fe2+/Fe3+ ratio tends to be consistent with the macro weathering zones (0–5 cm, 5–15 cm, and >15 cm) indicated by traditional weathering indices such as the CIA, CIW, WPI, and ICV. This suggests that, under similar geological and biogeochemical conditions, the Fe2+/Fe3+ ratio has the potential to characterize weathering zones along vertical depth and could serve as a simple auxiliary indicator for quickly identifying and delineating the relative weathering zones of red sandstone.
Author Contributions
Conceptualization, D.W., G.Y. and Y.W.; Methodology, D.W., G.Y., W.S. and Y.W.; Validation, D.W., W.S. and Y.W.; Formal analysis, D.W., G.Y., W.S. and Y.W.; Data curation, D.W., G.Y. and Y.W.; Writing—original draft, D.W.; Writing—review and editing, D.W., G.Y., W.S. and Y.W.; Supervision, W.S. and Y.W.; Project administration, G.Y., W.S. and Y.W.; Funding acquisition, G.Y. and W.S. All authors have read and agreed to the published version of the manuscript.
Funding
This research was funded by the Guizhou Provincial Basic Research Program (Natural Science) (No. ZD [2025]007) and the Geological Research Project of Guizhou Provincial Bureau of Geology and Mineral Resources (QDZKH-[2025]04).
Institutional Review Board Statement
Not applicable.
Informed Consent Statement
Not applicable.
Data Availability Statement
The original contributions presented in this study are included in the article. Further inquiries can be directed to the corresponding author.
Acknowledgments
All the authors of this paper thank the editor and reviewers for their contributions during manuscript processing.
Conflicts of Interest
The authors declare that they have no conflicts of interest.
References
- He, H.; Zheng, D.; Xu, G.; Dong, X.; Liu, W.; Zou, Y.; Wang, H. Research on the evolution mechanisms and prevention countermeasures behind a large-scale landslide in complicated-geological-structure red beds. Sci. Rep. 2025, 15, 40294. [Google Scholar] [CrossRef]
- Liu, D.; Ao, T.; Cao, K.; Meng, X. Characterization and degradation of ancient architectural red sandstone in a natural erosion environment. Appl. Sci. 2023, 13, 9159. [Google Scholar] [CrossRef]
- Yu, C.; Zhong, W.; Zhang, X.; Li, T.; Fei, Z. Study on the damage characteristics of red sandstone foundation under rainfall infiltration in the red-bed area of the sichuan basin—Taking zhongjiang county as an example. Buildings 2024, 14, 3406. [Google Scholar] [CrossRef]
- Yan, L.; Peng, H.; Zhang, S.; Zhang, R.; Kašanin-Grubin, M.; Lin, K.; Tu, X. The spatial patterns of red beds and danxia landforms: Implication for the formation factors–China. Sci. Rep. 2019, 9, 1961. [Google Scholar] [CrossRef]
- Xiao, W.; Zhang, D.; Wang, X. Experimental study on progressive failure process and permeability characteristics of red sandstone under seepage pressure. Eng. Geol. 2020, 265, 105406. [Google Scholar] [CrossRef]
- Zhang, S.; Zhao, S.; Liu, J.; Liu, Z.; Zhu, D.; Li, Y. Mechanism of damage and deterioration of red sandstone in south China under different pH treatments. Adv. Civ. Eng. 2024, 2024, 3684358. [Google Scholar] [CrossRef]
- Lin, H.; Liu, W.; Zhang, D.; Chen, B.; Zhang, X. Study on the degradation mechanism of mechanical properties of red sandstone under static and dynamic loading after different high temperatures. Sci. Rep. 2025, 15, 11611. [Google Scholar] [CrossRef] [PubMed]
- Luo, Y.; Huang, J.; Si, X.; Wu, W.; Li, S. Failure characteristics and energy properties of red sandstone under uniaxial compression: Water content effect and its application. Bull. Eng. Geol. Environ. 2025, 84, 57. [Google Scholar] [CrossRef]
- Wang, W.; Gan, Z.; Zhang, X.; Li, S.; Xu, Y. Temporal variation in the chemical index of alteration in early cretaceous black shale as a proxy for paleoclimate. J. Geol. 2022, 130, 393–411. [Google Scholar] [CrossRef]
- Kwewouo Janpou, A.; Ngueutchoua, G.; Ekoa Bessa, A.Z.; Armstrong-Altrin, J.S.; Kankeu Kayou, U.R.; Mbella Nguetnga, O.-A.N.N.; Njanko, T.; Bela, V.A.; Tiotsop, M.S.K.; Tankou, J.G. Composition, weathering, and provenance of beach sands adjacent to volcanic rocks in the northern gulf of guinea, SW cameroon. J. Afr. Earth Sci. 2022, 188, 104473. [Google Scholar] [CrossRef]
- Ulusoy, E.; Kadioğlu, Y.K. Petrography and geochemical decomposition parameters of crystalline rocks; demirköy intrusive body (DIB), NW turkey. Bull. Miner. Res. Explor. 2021, 165, 253–265. [Google Scholar] [CrossRef]
- He, W.; Yang, Z.; Du, H.; Hu, J.; Zhang, K.; Hou, W.; Li, H. Micro-mechanisms and implications of continental red beds. Minerals 2022, 12, 934. [Google Scholar] [CrossRef]
- Bábek, O.; Sracek, O.; Všianský, D.; Holá, M. Groundwater red beds in holocene fluvial sediments as a product of iron and manganese redox cycling; morava river, czechia. Sedimentology 2023, 70, 2220–2240. [Google Scholar] [CrossRef]
- Van Houten, F.B. Iron oxides in red beds. Geol. Soc. Am. Bull. 1968, 79, 399. [Google Scholar] [CrossRef]
- Gruber, A.; Müller, R.; Wagner, A.; Colucci, S.; Spasić, M.V.; Leopold, K. Total reflection X-ray fluorescence spectrometry for trace determination of iron and some additional elements in biological samples. Anal. Bioanal. Chem. 2020, 412, 6419–6429. [Google Scholar] [CrossRef]
- Zhou, S.; Yuan, Z.; Cheng, Q.; Weindorf, D.C.; Zhang, Z.; Yang, J.; Zhang, X.; Chen, G.; Xie, S. Quantitative analysis of iron and silicon concentrations in iron ore concentrate using portable X-ray fluorescence (XRF). Appl. Spectrosc. 2020, 74, 55–62. [Google Scholar] [CrossRef]
- Revenko, A.G.; Pashkova, G.V. X-ray fluorescence spectrometry: Current status and prospects of development. J. Anal. Chem. 2023, 78, 1452–1468. [Google Scholar] [CrossRef]
- Ostadrahimi, M.; Farrokhpay, S.; Karimnejad, K.; Rahimian, A.; Molavi, M.; Shahkarami, G. A comparison of Fe(III) to Fe(II) reduction methods in iron analysis via titration. Chem. Pap. 2024, 78, 5407–5414. [Google Scholar] [CrossRef]
- Chubarov, V.M.; Amosova, A.A.; Finkelshtein, A.L. X-ray fluorescence determination of ore elements in ferromanganese formations. Inorg. Mater. 2020, 56, 1423–1430. [Google Scholar] [CrossRef]
- Zhang, Y.; Liu, Y. A new 1,10-phenanthroline method for oxalate-extractable iron measurement. Appl. Geochem. 2025, 183, 106354. [Google Scholar] [CrossRef]
- Yang, L.; Yao, G. A modified spectrophotometric method for the determination of ferrous ion during the fenton process. Int. J. Environ. Anal. Chem. 2022, 102, 3194–3206. [Google Scholar] [CrossRef]
- Smith, G.L.; Reutovich, A.A.; Srivastava, A.K.; Reichard, R.E.; Welsh, C.H.; Melman, A.; Bou-Abdallah, F. Complexation of ferrous ions by ferrozine, 2,2′-bipyridine and 1,10-phenanthroline: Implication for the quantification of iron in biological systems. J. Inorg. Biochem. 2021, 220, 111460. [Google Scholar] [CrossRef]
- Tarafder, P.K.; Thakur, R. An optimised 1,10-phenanthroline method for the determination of ferrous and ferric oxides in silicate rocks, soils and minerals. Geostand. Geoanalytical Res. 2013, 37, 155–168. [Google Scholar] [CrossRef]
- Shyla, B.; Bhaskar, C.V.; Nagendrappa, G. Iron(III) oxidized nucleophilic coupling of catechol with o-tolidine/p-toluidine followed by 1,10-phenanthroline as new and sensitivity improved spectrophotometric methods for iron present in chemicals, pharmaceutical, edible green leaves, nuts and lake water samples. Spectrochim. Acta A Mol. Biomol. Spectrosc. 2012, 86, 152–158. [Google Scholar] [CrossRef] [PubMed]
- Hoshino, M.; Yasui, H.; Sakurai, H.; Yamaguchi, T.; Fujita, Y. Improved spectrophotometric determination of total iron and iron(III) with o-hydroxyhydroquinonephthalein and their characterization. Yakugaku Zasshi 2011, 131, 1095–1101. [Google Scholar] [CrossRef] [PubMed]
- Chandrakiran, P.; Kumari, A.S.; Sathwik, M.; Raghava, P. A rapid colorimetric method for the determination of iron in biological samples using o-phenanthroline method. Indo Glob. J. Pharm. Sci. 2018, 8, 76–79. [Google Scholar] [CrossRef]
- LY/T 1262−1999; Measurement of Available Iron in Forest Soil. State Forestry Administration: Beijing, China, 1999.
- HJ/T 345−2007; Determination of Iron in Water Quality o–Phenanthroline Spectrophotometry. Ministry of Ecology and Environment: Beijing, China, 2007.
- Thompson, M.; Ellison, S.L.R.; Wood, R. Harmonized guidelines for single-laboratory validation of methods of analysis: (IUPAC technical report). Pure Appl. Chem. 2002, 74, 835–855. [Google Scholar] [CrossRef]
- Huber, W. Basic calculations about the limit of detection and its optimal determination. Accredit. Qual. Assur. 2003, 8, 213–217. [Google Scholar] [CrossRef]
- Ostra, M.; Ubide, C.; Vidal, M.; Zuriarrain, J. Detection limit estimator for multivariate calibration by an extension of the IUPAC recommendations for univariate methods. Analyst 2008, 133, 532. [Google Scholar] [CrossRef]
- Allegrini, F.; Olivieri, A.C. IUPAC-consistent approach to the limit of detection in partial least-squares calibration. Anal. Chem. 2014, 86, 7858–7866. [Google Scholar] [CrossRef]
- Jochum, K.P.; Weis, U.; Schwager, B.; Stoll, B.; Wilson, S.A.; Haug, G.H.; Andreae, M.O.; Enzweiler, J. Reference Values Following ISO Guidelines for Frequently Requested Rock Reference Materials. Geostand. Geoanalytical Res. 2016, 40, 333–350. [Google Scholar] [CrossRef]
- Alcott, L.J.; Krause, A.J.; Hammarlund, E.U.; Bjerrum, C.J.; Scholz, F.; Xiong, Y.; Hobson, A.J.; Neve, L.; Mills, B.J.W.; März, C.; et al. Development of iron speciation reference materials for palaeoredox analysis. Geostand. Geoanalytical Res. 2020, 44, 581–591. [Google Scholar] [CrossRef]
- Olivares, I.R.B.; Souza, G.B.; Nogueira, A.R.A.; Toledo, G.T.K.; Marcki, D.C. Trends in developments of certified reference materials for chemical analysis—Focus on food, water, soil, and sediment matrices. TrAC Trends Anal. Chem. 2018, 100, 53–64. [Google Scholar] [CrossRef]
- GB/T 673.8–2016; Iron Ores—Determination of Iron(II) Content—Potassium Dichromate Titrimetric Method. China Iron and Steel Association: Beijing, China, 2016.
- Garzanti, E.; Resentini, A. Provenance control on chemical indices of weathering (Taiwan river sands). Sediment. Geol. 2016, 336, 81–95. [Google Scholar] [CrossRef]
- Potysz, A.; Bartz, W.; Zboińska, K.; Schmidt, F.; Lenz, M. Deterioration of sandstones: Insights from experimental weathering in acidic, neutral and biotic solutions with acidithiobacillus thiooxidans. Constr. Build. Mater. 2020, 246, 118474. [Google Scholar] [CrossRef]
- Lv, Y.; Liu, J.; Zhu, R.; Zhu, J.; Chen, Q.; Liang, X.; He, H. Photoreductive dissolution of iron (hydr)oxides and its geochemical significance. ACS Earth Space Chem. 2022, 6, 811–829. [Google Scholar] [CrossRef]
- Zhao, S.; Liu, Z.; Zhang, R.; Liu, J.; Liu, J.; Dai, Y.; Zhang, C.; Jia, H. Interfacial reaction between organic acids and iron-containing clay minerals: Hydroxyl radical generation and phenolic compounds degradation. Sci. Total Environ. 2021, 783, 147025. [Google Scholar] [CrossRef]
- Fu, H.; Jian, X.; Pan, H. Bias in sediment chemical weathering intensity evaluation: A numerical simulation study. Earth-Sci. Rev. 2023, 246, 104574. [Google Scholar] [CrossRef]
- Torabi-Kaveh, M.; Rizi, F.S.; Tajbakhsh, G.; Khodami, M.; Ménendez, B. The use of chemical and textural indices to predict geotechnical properties of granites with different degrees of weathering. Bull. Eng. Geol. Environ. 2023, 82, 362. [Google Scholar] [CrossRef]
- Pandarinath, K. Application potential of chemical weathering indices in the identification of hydrothermally altered surface volcanic rocks from geothermal fields. Geosci. J. 2022, 26, 415–442. [Google Scholar] [CrossRef]
- Nadłonek, W.; Bojakowska, I. Variability of chemical weathering indices in modern sediments of the vistula and odra rivers (poland). Appl. Ecol. Environ. Res. 2018, 16, 2453–2473. [Google Scholar] [CrossRef]
- Shao, J.; Yang, S.; Li, C. Chemical indices (CIA and WIP) as proxies for integrated chemical weathering in China: Inferences from analysis of fluvial sediments. Sediment. Geol. 2012, 265–266, 110–120. [Google Scholar] [CrossRef]
- Boukoffa, M.; Bouabsa, L.; Lamouri, B.; Fagel, N. Evaluation des indices d’alteration chimique sur un profil kaolinise cas: Tamazert (ne algerie). Courr. Du Savoir Sci. Et Tech. 2017, 23, 95–100. [Google Scholar]
- Bensharada, M.; Telford, R.; Stern, B.; Gaffney, V. Loss on ignition vs. thermogravimetric analysis: A comparative study to determine organic matter and carbonate content in sediments. J. Paleolimnol. 2022, 67, 191–197. [Google Scholar] [CrossRef]
Disclaimer/Publisher’s Note: The statements, opinions and data contained in all publications are solely those of the individual author(s) and contributor(s) and not of MDPI and/or the editor(s). MDPI and/or the editor(s) disclaim responsibility for any injury to people or property resulting from any ideas, methods, instructions or products referred to in the content. |
© 2025 by the authors. Licensee MDPI, Basel, Switzerland. This article is an open access article distributed under the terms and conditions of the Creative Commons Attribution (CC BY) license.