Abstract
This study investigated the impact coefficient of a large-span steel truss arch railroad bridge under moving train loads, with the Nanning Three Banks Yongjiang Special Bridge serving as the case study. Field tests were conducted to measure the bridge’s self-vibration characteristics, dynamic deflection, and strain. A coupled vehicle–bridge vibration model was developed using the finite element software ABAQUS 2022 for the bridge and multi-body dynamics software SIMPACK 2022 for the CRH2 train. The two models were integrated to simulate the dynamic interaction between the train and bridge under different speeds and single-/double-track operations. The results demonstrate that the joint simulation of SIMPACK and ABAQUS was an effective method for the vehicle–bridge coupled vibration analysis. The key findings include the following: the deflection and stress impact coefficients increased with the train speed, where the main span exhibited larger deflection coefficients than the side span. The stress impact coefficients varied significantly across different bridge components, where the lower chord of the side span and the ties of the main span showed the highest values. While there was no substantial difference in the deflection impact coefficients between the single- and double-track operations, the stress impact coefficients showed deviations, particularly in the side span’s lower chord and ties, highlighting their sensitivity to vehicle-induced deflection. This study concluded that the bridge’s deflection impact coefficient met design specifications, but the stress impact coefficient exceeded the specified values, suggesting that stress amplification should be carefully considered in the design of similar bridges to ensure operational safety.
1. Introduction
Steel truss arch bridges are widely used in high-speed railway construction due to their high strength, light weight, large span, and aesthetic appeal [1,2,3]. As the span of railway bridges continues to increase and train speeds continue to rise, the interaction between large-span bridges and high-speed trains has garnered increasing attention [4,5,6,7]. High-speed train operations exert significant dynamic impacts on bridges [8,9,10], affecting both the safety and economic viability of the structure. The impact coefficient is a dynamic amplification factor, which is defined in railway design standards as the ratio of the dynamic response to the static response of the structure, reflecting the magnitude of the impact effect.
In recent years, numerous researchers conducted extensive research on the impact coefficients of bridges under moving train load effects [11,12,13,14]. Li et al. [15], focusing on a large-span railway cable-stayed bridge, established a vehicle–bridge coupling model to investigate the impact on the main girder, stay cables, bearings, and bridge towers at various train speeds. Kim et al. [16], using Monte Carlo simulation techniques, modeled the effect of reinforced concrete slabs on steel bridges and studied the effect of the impact coefficient on the fatigue performance of RC slabs. Gharad et al. [17] considered three different configurations and performed finite element analysis on a full-scale 3D bridge model to determine the impact factor (IF), while also accounting for the influence of soil–structure interaction (SSI) under three different soil conditions. Moliner et al. [18] discussed the dynamic behavior of twin-box girder bridges under high-speed railway traffic and found that the predicted dynamic response might unexpectedly exceed the static effects caused by the design load, even when the maximum vertical vibration levels in the deck are not severe, potentially leading to intense impact coefficients. Jeon et al. [19] conducted field measurements on a steel plate girder bridge in operation and, considering train speeds, derived the impact coefficients for the track structure and its main girder. Sun et al. [20] analyzed the influence of vehicle speed and road roughness on a spatial Y-shaped steel arch bridge and calculated the impact coefficient of vehicles on a flat bridge deck at design speed. Kim et al. [21] investigated the vibration serviceability and impact coefficient of a seven-span continuous cable-stayed bridge planned for an expressway extension using a three-dimensional vehicle–bridge coupled vibration analysis.
Previous research on impact coefficients largely focused on simply supported beam bridges, cable-stayed bridges, suspension bridges, and other types of bridges, with relatively limited studies on large-span steel truss arch bridges for railway applications. Furthermore, most of the existing studies concentrated on the global impact coefficient of the bridge as a whole, while the local impact coefficients of the bridge are equally significant and should not be overlooked [22,23,24]. Given that steel truss arch bridges consist of numerous individual members, the impact effects on some of these members are more strongly correlated with the local dynamic characteristics of the bridge. Therefore, it is essential to investigate both the global and local impact behaviors of large-span steel truss arch bridges.
This study focused on the Nanning Three Banks Yongjiang Special Bridge and investigated the dynamic interaction between the bridge and vehicles. To conduct this analysis, advanced computational tools, including multibody dynamics software SIMPACK and finite element software ABAQUS 2022, were employed to perform a coupled simulation of the vehicle–bridge interaction system. The primary aim of this simulation was to create a robust model that could accurately replicate real-world conditions. To ensure the reliability and accuracy of the model, the simulation results were compared with actual field test data obtained from the bridge, which allowed for a validation of the model’s predictive capabilities.
Once the model was verified, it was used to examine the deflection and stress impact coefficients of the bridge under various operational conditions. Specifically, this study investigated how different train speeds and operational configurations—such as single-track versus double-track operations—affected the performance of the bridge. The deflection and stress impact coefficients were calculated for these different scenarios to assess the structural behavior and safety margins of the bridge under typical and extreme loading conditions.
Through this comprehensive approach, this study not only provided critical insights into the dynamic performance of the bridge but also offered valuable data and recommendations for the design and optimization of similar bridge types. The findings are intended to enhance the understanding of vehicle–bridge interactions and to inform future infrastructure projects, contributing to the development of safer, more efficient bridge designs.
2. Overview of the Bridge
The Three Banks Yongjiang Special Bridge is a through-type, double-track railway bridge, with a track gauge of 4.6 m and a design train speed of 250 km/h. It is a key control project on the Nanning–Qinzhou Railway. The main bridge structure is a three-span continuous steel truss arch bridge spanning the Yongjiang River, with a span arrangement of 132 + 276 + 132 m, as shown in Figure 1. The bridge is transversely equipped with two main trusses, each consisting of an N-shaped truss with a truss width of 15 m. Except for the two sections near the central support, which are 15 m long, the remaining sections are 12 m long. The side spans have an average truss height of 16 m, which gradually increases to 20 m at the central support. The central span has a span-to-rise ratio of 1/4.759, with the arch top truss height being 9 m. The main trusses are constructed with fully welded joints, while the upper and lower chords, central span tie rods, and web members use box-shaped cross-sections. The suspension rods are welded into a hexagonal cross-section. Longitudinal upper braces are placed in the upper chord plane, while stiffening legs are placed in the lower chord plane of the side spans. In the central span, the lower chord plane is equipped with longitudinal lower braces. Lateral connections are installed at every other section of the truss, with portal frames located at the side and central supports. The bridge deck adopts an orthotropic plate structure, forming an integrated steel deck.
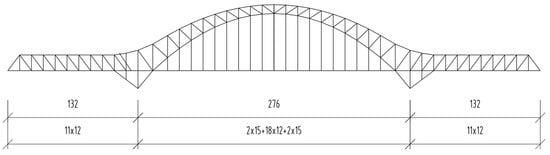
Figure 1.
Schematic diagram of bridge span arrangement (unit: m).
3. On-Site Testing
3.1. Modal Testing
For large-span structures, pulsation tests utilize the small and irregular vibrations induced by various external factors to determine the dynamic characteristics of the structure. The pulsation tests on the bridge employed JM3872G sensors (velocity mode, Yangzhou Jingming, Jiangsu, China) with 4G signal transmission and GPS data synchronization, along with 941-type vibration pick-ups. Velocity data, collected for more than 20 min under environmental random excitation, were used to calculate the natural frequencies. Spectral analysis was performed on the velocity responses of the main girder and the main arch to obtain the bridge’s inherent frequencies, mode shapes, and damping ratios. The field-testing setup is shown in Figure 2.
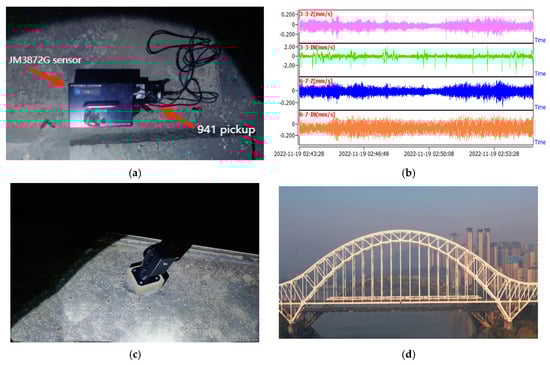
Figure 2.
On−site testing: (a) JM3872G sensor and 941 vibration sensor; (b) waveform recorded during on-site testing; (c) dynamic displacement target; (d) train crossing bridge.
Velocity measurement points were uniformly distributed on both the main arch and the bridge deck, with a total of 48 points. For the acceleration measurements, the JM3872G sensors (acceleration mode) were also used, and the data were processed with a 20 Hz low-pass filter to distinguish the bridge’s natural frequencies from forced vibrations. This instrument is used to measure speed or acceleration, where it can realize ultra-low frequency (as low as 0.072 Hz) and large displacement (1000 mm) vibration measurements. Dynamic deflection testing was conducted using the BJQN-L bridge deflection measurement system from Beijing Optoelectronics Institute(Leitu technology, Beijing, China), which provided precise measurement of dynamic displacement on the Nanning Three Banks Yongjiang Special Bridge. The measuring range of this instrument is 0.01 mm–500 m, the sampling frequency is 100 Hz, and the accuracy is 0.02 mm. A 15 Hz low-pass filter was applied to the data to ensure accuracy. The distribution of the measurement points is shown in Figure 3.
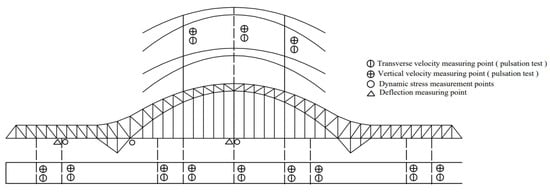
Figure 3.
Pulsation test and traveling test measurement point arrangement.
3.2. Vehicle Dynamics Testing
Since the bridge is part of an operational railway line, the vehicle test was conducted using passing trains as the loading source. The passing trains consist of 8-car CRH2 series trains, with a maximum design operating speed of 250 km/h. Train operations include both upward or downward along the longitudinal direction, with 33 trains in the upward direction and 38 trains in the downward direction per day. Field observations indicated that there were no train crossings on the bridge. Given the proximity to Nanning East Station, most trains operate at speeds around 180 km/h.
The vehicle test included dynamic strain and dynamic deflection measurements. Dynamic strain testing was performed using JM3839G sensors, with the testing period covering the time interval between two scheduled maintenance windows. Dynamic deflection testing was carried out using the BJQN-L bridge deflection measurement instrument from Beijing Optoelectronics, which precisely measured the dynamic displacement of the San’an Yongjiang Grand Bridge. The testing period spanned from 8:00 a.m. to 6:00 p.m. The layout of the vehicle test measurement points and the field-testing setup are shown in Figure 4.

Figure 4.
On-site dynamic deflection testing of the bridge.
4. Vehicle–Bridge Coupling Numerical Simulation
4.1. Vehicle Dynamics Modeling
In this study, a vehicle model for an 8-car CRH2 train (T + M + M + T + T + M + M + T, where T is trailer and M is motor car) was established using the multibody dynamics software SIMPACK 2022, as shown in Figure 5. The vehicle parameters were determined based on the relevant literature [25]. The single-car vehicle model consisted of 1 car body, 2 bogies, and 4 wheelsets, totaling 7 rigid bodies. Each rigid body had 6 degrees of freedom, including heave, sway, longitudinal displacement, roll, pitch, and yaw, which resulted in a total of 42 degrees of freedom. The precision of the model was verified by checking whether the acceleration in the initial equilibrium state was less than 0.01 m/s2. The maximum residual acceleration of the vehicle model developed in this study was found to be 1.724 × 10⁻⁶ m/s2, which met the required specifications.
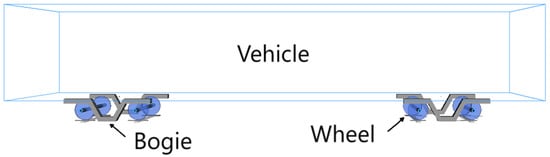
Figure 5.
Train dynamics model.
4.2. Finite Element Model of the Bridge
According to the design drawings, the bridge calculation model was established by using the general finite element analysis software ABAQUS. Steel truss beams (except suspenders) were simulated by beam elements, and suspenders were simulated by truss elements. The density was 7850 kg/m3, the elastic modulus was 206 GPa, Poisson’s ratio was 0.3, and the damping ratio was 0.05. The steel truss members were modeled using beam elements, while the suspension rods were modeled using rod elements. The developed model, as shown in Figure 6, consisted of a total of 49,851 nodes and 43,999 elements.
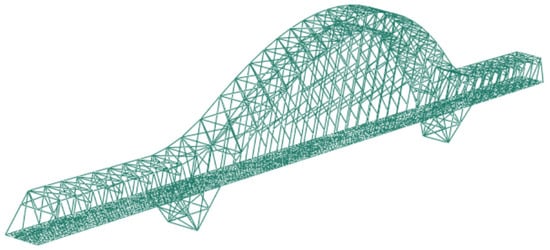
Figure 6.
Bridge finite element model.
To verify the accuracy of the dynamic characteristics of the bridge’s finite element model, the natural frequencies of the Three Banks Yongjiang Special Bridge were solved using the Lanczos method and compared with the field measurements. The first four natural frequencies are presented in Table 1. As shown in Table 1, the calculated frequencies were lower than the measured frequencies, indicating that the overall performance and stiffness of the bridge were satisfactory. The slight differences between the measured and calculated frequencies of the bridge’s beam modes were primarily attributed to factors such as the dead load in the second phase and the bearing friction. A comparison of the mode shapes from the field measurements and simulation results showed a good agreement, confirming the reliability and validity of the adopted model.

Table 1.
Main bridge self-oscillation frequency.
4.3. Vehicle–Bridge Coupled Model
The substructure analysis and modal analysis in ABAQUS were used to obtain the .sim and .inp files that contained information such as the mass, stiffness, damping matrices, geometry, and node coordinates. These files were then converted into flexible body information (.fbi) files using the conversion interface in SIMPACK. The track was modeled with 60 kg/m steel rails, and the track centerline distance was 4.6 m. The flexible track was imported using the Flextrack module provided in SIMPACK. The wheel–rail contact relationship was modeled using the equivalent elasticity method, with the tangential and normal contact forces calculated using the simplified Kalker contact nonlinear theory and the Hertz nonlinear elastic contact theory, respectively [26,27,28].
Under the condition of high-speed operation, the German track spectrum is regarded as one of the most representative standards [29,30]. The research object of this study was the long-span steel truss arch bridge of a high-speed railway, so the German low-interference track spectrum was adopted as the basis of the track irregularity analysis. The specific expressions of the orbital spectral function are as follows:
- Track irregularity:
- Ω is the spatial frequency of the track irregularity;
- Ωc, Ωs, and Ωr are the truncation frequencies;
- Av and Aa are the roughness constants;
- b is half the distance between the left and right rolling circles, and the value was 0.75 m.
The bridge and flexible track were connected through fasteners, with the fasteners simulated using force elements in SIMPACK. The vehicle–bridge coupling model is shown in Figure 7.
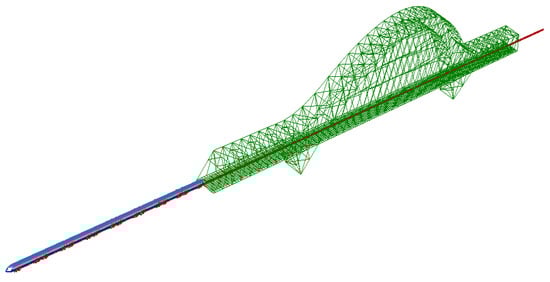
Figure 7.
Vehicle–bridge coupling vibration model.
5. Impact Coefficient Analysis of the Bridge
5.1. Deflection Impact Coefficient
Figure 8 presents the time history curves of the deflection values at the mid-span of the side span and the main span under single-track operation at 180 km/h, comparing the simulated results with the measured data. From this figure, it can be observed that under the influence of the single-track operation at 180 km/h, the maximum deflections at the mid-span of the main and side spans from the simulation were 9.175 mm and 5.671 mm, respectively, while the measured values were 8.717 mm and 5.180 mm. The differences between the simulated and measured deflections at the mid-span of the main span and side span were 5.25% and 9.48%, respectively. These differences were relatively small, and the trend of the deflection was consistent, indicating the reliability of the coupled simulation model used in this study.
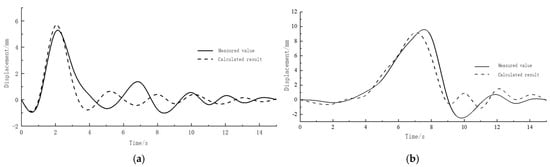
Figure 8.
Main span and side span mid−span displacement time course (180 km/h): (a) side span mid−span displacement; (b) main span mid−span displacement.
The deflection at the mid-span of the main span was greater than that of the side span, which was attributed to the larger span length of the main span and its lower vertical stiffness compared with the side span. The maximum deflection-to-span ratio at the mid-span of the main span was 8.717/276,000 = 1/31,662, while for the side span, it was 5.180/132,000 = 1/25,483. Both values are smaller than the limit of 1/1500 required by the relevant standards [23], indicating that the vertical stiffness of the bridge was satisfactory.
Impact coefficient refers to the ratio of the dynamic response to the static response of the bridge structure when it is suddenly loaded or unloaded in a static load test. This coefficient reflects the dynamic characteristics of the bridge structure and is an important index to measure the safety performance of the bridge structure. In Europe, the standard EN 1991-2 defines it as the dynamic factor [31]:
For this article, we took the most conservative for the calculation: 3 times the cross-girder spacing was 9 m. So, we could conclude that the impact coefficient was 1.334.
Table 2 presents the deflection impact coefficients at various locations—one-quarter span of the side span, side span mid-span, one-quarter span of the main span, and the main span mid-span—calculated through the coupled simulation model under different train speeds and single-/double-track operations. It can be observed that the deflection impact coefficient of the bridge increased with speed. At a train speed of 140 km/h, the deflection impact coefficient at the mid-span of the main span was 1.035, which increased to 1.059 at 240 km/h. This indicates that the train speed had a significant effect on the deflection impact coefficient. There was no notable difference in the deflection impact coefficients between the single-track and double-track operations.
Table 2.
Maximum value of bridge displacement.
At both the side span and main span, the deflection impact coefficient at the mid-span was higher than at the one-quarter span. The deflection impact coefficient at the main span was greater than that at the side span, primarily due to the smaller span and higher vertical stiffness of the side span, which resulted in a lower vertical stiffness at the one-quarter span compared with the mid-span. Therefore, in the design process, a more conservative deflection impact coefficient should be considered for the mid-span of the main span. Under all the operating conditions, the maximum deflection impact coefficient of the bridge was 1.063, which is lower than the value of 1.334 calculated according to the relevant standards.
5.2. Stress Impact Coefficient
Currently, the primary method for solving bridge stresses is the moving force method [32], which simplifies the train load as a series of vertical moving concentrated forces, with magnitudes and arrangements matching the actual train configuration.
In this study, dynamic stress calculations were performed using a coupled simulation approach involving ABAQUS and SIMPACK. In SIMPACK, the bridge and track are connected via force elements, and the force variations over time for each force element are computed as the train passes. These time-varying concentrated forces are then applied to the corresponding locations on the bridge in ABAQUS.
To verify the accuracies of the different methods and the reliability of the simulation model, a comparison was made between the moving force method, the coupled simulation, and field measurement results, as shown in Figure 9. The moving force method was calculated using the ABAQUS subroutine vdload, with an integration time step of 0.001 s. The train load was simplified into 32 moving concentrated forces, with an electric multiple unit (EMU) axle load of 132 kN and a trailer axle load of 11.8 kN. Due to space constraints, Figure 10 only presents the comparison results for the tie rod C12C13 and the suspension rod C13E13.
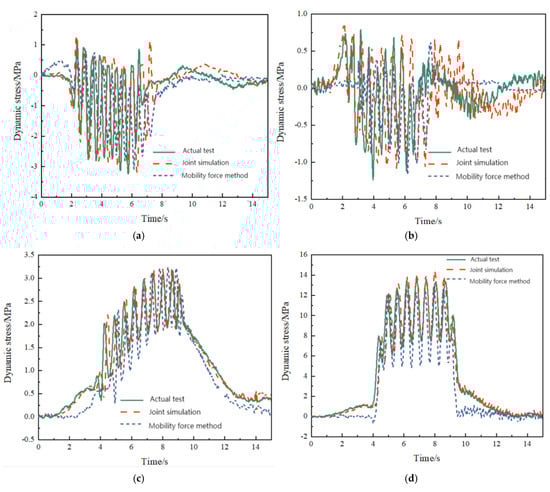
Figure 9.
Time history of dynamic stress for different components (180 km/h): (a) the lower chord member E4E5; (b) the web member E5A4; (c) the tie rod C12C13; (d) the suspension rod C13E13.
Figure 10.
Dynamic stress impact factors of structural members at different speeds: (a) the lower chord member; (b) the upper chord member; (c) the straight web member; (d) the diagonal web member; (e) the tie rod; (f) the suspension rod.
From this figure, it can be seen that among the four types of members, the suspension rod experienced the highest stress, followed by the lower chord and tie rod, and the web member exhibited the lowest stress. The results from the coupled simulation were closer to the field measurement results and show a more consistent variation pattern compared with the moving force method, further validating the reliability of the vehicle–bridge coupling analysis approach used in this study. Although the moving force method partially accounted for the dynamic effects of the train, it did not consider the interaction between the vehicle and the bridge, nor did it include the effects of the track irregularities. As a result, the discrepancies between the moving force method and the measured results were relatively large.
The impact coefficients of the bridge members under different train speeds are shown in Figure 10. From this figure, it can be observed that as the speed increased, the stress impact coefficients of different types of members exhibited an upward trend. In the side span members, the stress impact coefficient of the lower chord was the highest, followed by the web member, with the upper chord having the smallest impact coefficient. This was primarily because during the train passage, the load was first transmitted to the lower chord through the bridge deck, then through the web member to the upper chord. Due to the damping effects of the members, the dynamic effect transmitted to the upper chord was attenuated.
In the main span members, the highest stress impact coefficient was found in the tie rods, followed by the suspension rods, then the lower chord and web members, with the upper chord having the smallest impact coefficient. The stress impact coefficient of the suspension rods decreased as the rod length increased. Among all the speed conditions, the shortest suspension rod had a maximum stress impact coefficient of 1.314, while the longest suspension rod had a value of 1.207, representing a reduction of 8.14%.
The stress impact coefficients of the lower chord, tie rod, and upper chord in the side span were higher than those in the main span. Among all the bridge members, the lower chord member E4E5 had the highest stress impact coefficient of 1.444, while the upper chord member A21A22 had the lowest impact coefficient of 1.092. Most of the members exceeded the code-specified value of 1.334. Therefore, in the structural design of a bridge, it is crucial to account for the amplification of the stress impact coefficient to ensure the operational safety of the bridge.
The stress impact coefficients of different bridge members under single- and double-track operation conditions at a train speed of 180 km/h are shown in Figure 11. From this figure, it can be seen that for the lower chord members E4E5 and E21E22, the straight web member A22E22, and the tie rod C13E13, the impact coefficient under double-track operation was higher than that under single-track operation. For the remaining members, the impact coefficient under double-track operation was lower than that under single-track operation.
Figure 11.
Dynamic stress impact factors of structural members under single-line and double-line driving conditions (180 km/h).
For the members E4E5, A4E5, C13E13, and E12C13, there were certain discrepancies in the stress impact coefficients under single- and double-track operations, while the differences for the other members were relatively small. This indicates that the lower chord of the side span, side span web member, short suspension rods, and tie rods were more sensitive to the lateral load effects induced by the vehicle.
6. Conclusions
(1) As the train speed increased, the deflection impact coefficient of the bridge also increased. There was no significant difference in the impact coefficient of the bridge’s deflection under single- and double-track operations. The deflection impact coefficient of the main span was greater than that of the side span, so it was safer to consider the deflection impact coefficient at the mid-span of the main span in the design.
(2) Compared with the traditional moving force method, the coupled simulation method used in this study fully accounted for the interaction between the train and the bridge. The results were closer to the field measurements and more accurately reflected the stress conditions of the bridge.
(3) The stress impact coefficients of different bridge members varied significantly and increased with the train speed. Under both single- and double-track operations, there were certain deviations in the stress impact coefficients for the side span lower chord, side span web member, short suspension rods, and tie rods, while the differences for the other members were relatively small. The stress impact coefficients obtained using the existing codes were smaller than those observed in the actual scenario. Therefore, in the structural design of bridges, it is essential to fully consider the amplification effect of member stress impact coefficients to ensure the operational safety of the bridge.
Author Contributions
Conceptualization, Y.P. and B.J.; methodology, B.J.; software, L.C.; validation, B.J. and Z.T.; formal analysis, B.J.; investigation, J.L.; resources, B.J.; data curation, B.J.; writing—original draft preparation, B.J.; writing—review and editing, Z.L.; visualization, B.J.; supervision, B.J.; project administration, B.J.; funding acquisition, B.J. All authors have read and agreed to the published version of the manuscript.
Funding
This research received no external funding.
Institutional Review Board Statement
Not applicable.
Data Availability Statement
The data presented in this study are available through email upon request to the corresponding author.
Conflicts of Interest
Author Li Chen was employed by the company Changsha Engineering Construction Headquarters of China Railway Guangzhou Group. The remaining authors declare that the research was conducted in the absence of any commercial or financial relationships that could be construed as a potential conflict of interest.
References
- Gao, Z.; Vi, L.; Xiao, H.Z. Dashengguan Bridge-The Largest Span Steel Arch Bridge for High-Speed Railway. Struct. Eng. Int. 2010, 20, 299–302. [Google Scholar] [CrossRef]
- Shangguan, B.; Hu, H.; Ning, P.; Su, Q. Mingzhuwan Bridge: The Largest Span Three-Main-Truss Steel Arch Bridge. Struct. Eng. Int. 2022, 33, 89–95. [Google Scholar] [CrossRef]
- Zhao, H.-W.; Ding, Y.-L.; Geng, F.-F.; Li, A.-Q. RAMS evaluation for a steel-truss arch high-speed railway bridge based on SHM system. Struct. Monit. Maint. 2018, 5, 79–92. [Google Scholar] [CrossRef]
- Gao, Y.; Zhang, H.-H.; Jiang, B.-J. Analysis on the vehicle-bridge coupled vibrations of long-span cable-stayed bridge based on multiscale model. J. Vibroeng. 2015, 17, 402–410. [Google Scholar]
- Luo, Z.; Zheng, X.; Yuan, H.; Niu, X. Dynamic Coupling Analysis of Vehicle-Bridge System for Long-Span Suspension Bridge Based on Backpropagation Neural Network Method. Adv. Civ. Eng. 2020, 2020, 5878426. [Google Scholar] [CrossRef]
- Shen, H.; Chen, X.; Lu, K.; Huang, H. A New Vehicle-Bridge Coupling Analysis Method Based on Model Polycondensation. Ksce J. Civ. Eng. 2021, 25, 245–255. [Google Scholar] [CrossRef]
- Wang, L.; Jiang, P.; Hui, Z.; Ma, Y.; Liu, K.; Kang, X. Vehicle-bridge coupled vibrations in different types of cable stayed bridges. Front. Struct. Civ. Eng. 2016, 10, 81–92. [Google Scholar] [CrossRef]
- Guo, F.; Cai, H.; Li, H. Impact Coefficient Analysis of Curved Box Girder Bridge Based on Vehicle-Bridge Coupling. Math. Probl. Eng. 2022, 2022, 8628479. [Google Scholar] [CrossRef]
- Guo, F.; Cai, H.; Li, H. Impact coefficient analysis on long-span beam bridge. J. Vibroeng. 2021, 23, 436–448. [Google Scholar] [CrossRef]
- Wang, L.-B.; Jiang, P.-W. Research on the computational method of vibration impact coefficient for the long-span bridge and its application in engineering. J. Vibroeng. 2016, 18, 394–407. [Google Scholar]
- Liu, K.; De Roeck, G.; Lombaert, G. The effect of dynamic train-bridge interaction on the bridge response during a train passage. J. Sound Vib. 2009, 325, 240–251. [Google Scholar] [CrossRef]
- Ding, Y.; Wang, G. Evaluation of Dynamic Load Factors for a High-Speed Railway Truss Arch Bridge. Shock Vib. 2016, 2016, 5310769. [Google Scholar] [CrossRef]
- Ding, Y.; An, Y.; Wang, C. Field monitoring of the train-induced hanger vibration in a high-speed railway steel arch bridge. Smart Struct. Syst. 2016, 17, 1107–1127. [Google Scholar] [CrossRef]
- Ashebo, D.B.; Chan, T.H.T.; Yu, L. Evaluation of dynamic loads on a skew box girder continuous bridge—Part II: Parametric study and dynamic load factor. Eng. Struct. 2007, 29, 1064–1073. [Google Scholar] [CrossRef]
- Li, Y.; Dong, S.; Bao, Y.; Chen, K.; Qiang, S. Impact Coefficient Analysis of Long-Span Railway Cable-Stayed Bridge Based on Coupled Vehicle-Bridge Vibration. Shock Vib. 2015, 2015, 641731. [Google Scholar] [CrossRef]
- Kim, C.W.; Kawatani, M.; Kwon, Y.R. Impact coefficient of reinforced concrete slab on a steel girder bridge. Eng. Struct. 2007, 29, 576–590. [Google Scholar] [CrossRef]
- Gharad, A.M.; Sonparote, R.S. Evaluation of vertical impact factor coefficients for continuous and integral railway bridges under high-speed moving loads. Earthq. Eng. Eng. Vib. 2021, 20, 495–504. [Google Scholar] [CrossRef]
- Moliner, E.; Lavado, J.; Museros, P. Evaluation of Transverse Impact Factors in Twin-Box Girder Bridges for High-Speed Railways. J. Bridge Eng. 2016, 21, 06016002. [Google Scholar] [CrossRef]
- Jeon, B.-H.; Hak-Seung, K.; In-Young, H.; KyungHo, K. Experimental Estimation of the Impact Factor of an Open Deck Steel Plate Girder Bridge by Considering the Train Velocity. J. Korean Soc. Adv. Compos. Struct. 2020, 11, 47–53. [Google Scholar] [CrossRef]
- Sun, J.P.; Zheng, S.; Zhang, J.; Huang, R.; Xu, W.; Cheng, M. Study on vehicle-bridge coupling vibration response and impact factor of spatial Y-shaped tied arch bridge. Structures 2023, 57, 105335. [Google Scholar] [CrossRef]
- Kim, C.W.; Kimura, S.; Sugiyama, H.; Sato, A.; Ono, K. Ride comfort and impact factor of a seven-span continuous cable-stayed bridge. Adv. Struct. Eng. 2024, 27, 2790–2802. [Google Scholar] [CrossRef]
- Ho, H.; Nishio, M. Evaluation of dynamic impact factor of existing bridges with road surface damages based on dynamic response under traffic flow loading. Struct. Infrastruct. Eng. 2024, 20, 1390–1403. [Google Scholar] [CrossRef]
- Ji, W.; Deng, L.; He, W.; Liu, S.; Lin, P. Local and global impact factors analysis for PC box girder bridges with corrugated steel webs. J. Vib. Shock 2017, 36, 22–28. [Google Scholar] [CrossRef]
- Zhong, J.W.; Wang, J.; Jiang, Y.; Li, R.; Zhang, X.; Liu, Y. Simulation and Experimental Study on Bridge-Vehicle Impact Coupling Effect under Pavement Local Deterioration. Buildings 2024, 14, 2218. [Google Scholar] [CrossRef]
- Yang, H.-X.; Liu, D.-M. Numerical study on the aerodynamic noise characteristics of CRH2 high-speed trains. J. Vibroeng. 2017, 19, 3953–3967. [Google Scholar] [CrossRef]
- Chen, G.; Zhai, W.M. A new wheel/rail spatially dynamic coupling model and its verification. Veh. Syst. Dyn. 2004, 41, 301–322. [Google Scholar] [CrossRef]
- Li, Y.; Xu, X.; Zhou, Y.; Cai, C.S.; Qin, J. An interactive method for the analysis of the simulation of vehicle-bridge coupling vibration using ANSYS and SIMPACK. Proc. Inst. Mech. Eng. Part F-J. Rail Rapid Transit 2018, 232, 663–679. [Google Scholar] [CrossRef]
- Su, C.; Wu, Z.; Xian, J. Stochastic dynamic analysis of vehicle-bridge coupled systems with nonlinear Hertz contacts by explicit time-domain method. Veh. Syst. Dyn. 2022, 60, 1579–1601. [Google Scholar] [CrossRef]
- Zhang, Q.; Cai, X.; Zhong, Y.; Tang, X.; Wang, T. Dynamic response prediction of high-speed train on cable-stayed bridge based on genetic algorithm and fused neural networks. Eng. Struct. 2024, 306, 117869. [Google Scholar] [CrossRef]
- Li, S.Y.; Zheng, Z.; Yu, J.; Qian, C. Dynamic simulation and safety evaluation of high-speed trains meeting in open air. Acta Mech. Sin. 2016, 32, 206–214. [Google Scholar] [CrossRef]
- EN 1991-2; Eurocode 1: Actions on Structures–Part 2: Traffic Loads on Bridges. CEN-European Committee for Standardization: Brussels, Belgium, 2003.
- Li, H.; Xia, H.; Soliman, M.; Frangopol, D.M. Bridge stress calculation based on the dynamic response of coupled train-bridge system. Eng. Struct. 2015, 99, 334–345. [Google Scholar] [CrossRef]
Disclaimer/Publisher’s Note: The statements, opinions and data contained in all publications are solely those of the individual author(s) and contributor(s) and not of MDPI and/or the editor(s). MDPI and/or the editor(s) disclaim responsibility for any injury to people or property resulting from any ideas, methods, instructions or products referred to in the content. |
© 2025 by the authors. Licensee MDPI, Basel, Switzerland. This article is an open access article distributed under the terms and conditions of the Creative Commons Attribution (CC BY) license (https://creativecommons.org/licenses/by/4.0/).