Abstract
To achieve both safety and a lightweight design for rotary drilling rig masts, this study proposes an optimization method incorporating safety evaluation constraints. The method employs the limit state method to validate the mast structure and uses fuzzy comprehensive evaluation to quantify safety performance metrics. The optimization objective is to minimize the mast’s self-weight, with design variables defined as the geometric dimensions of key cross-sections, while imposing constraints on the strength, stiffness, stability, and safety scores. The safety score utilizes fuzzy comprehensive evaluation and a weighted aggregation method, considering indicators such as strength, stiffness, stability, and fatigue strength. An improved Salp Swarm Algorithm is utilized to execute the optimization process. Engineering case studies demonstrate that the optimized design reduces the mast’s self-weight by 6.5% under safety constraints. Compared to designs without safety constraints, the material usage increases slightly by 7.3%, but the safety performance improves by 14.74%. The findings indicate that integrating safety evaluation constraints into the optimization process not only enhances the structural safety of the mast but also achieves a favorable balance between safety and economic efficiency. This approach provides a valuable reference for the safety-focused design of rotary drilling rig masts.
1. Introduction
The rotary drilling rig is a large-scale engineering machine widely used in foundation construction for high-rise buildings, bridges, and infrastructure pile foundations. As a critical component of the rotary drilling rig, the mast bears the drilling and lifting loads, making it a key structural element. Its design quality directly influences the operational efficiency and safety of the equipment. Therefore, conducting reliable safety design for the mast holds significant research value and practical importance for ensuring engineering safety.
Numerous scholars have conducted research on structural optimization in the following areas. Wang et al. [1] optimized the main beam of double-beam bridge cranes by addressing redundancy and resonance. Using six key parameters and an improved particle swarm optimization algorithm, they enhanced stability, increased the first-order vibration frequency from 18 Hz to 27.55 Hz, and reduced the beam’s weight by 6%. Qi et al. [2] proposed a green design method for cranes, using optimization models and fuzzy mathematics to reduce weight and processing waste. The method achieved a 63.43% reduction in waste and a 27.03% decrease in girder cross-sectional area. Yu et al. [3] proposed an equal-life, lightweight design for crane girders using machine learning and optimization, achieving an improved life distribution and reduced weight for enhanced performance. Ren et al. [4] optimized crane box girder mass by focusing on stiffener dimensions, placement, and constraints on stresses and deformations. Using ANSYS APDL and multiple optimization methods, they validated results against other algorithms, achieving optimal structural performance and reduced mass. Qu et al. [5] proposed the ACAM algorithm for crane metal structure optimization, combining ant colony and mutation-based local search. The Ant Colony Algorithm with Mutation-based Local Search (ACAM) algorithm outperformed the Genetic Algorithm (GA) and Particle Swarm Optimization (PSO) approaches, achieving a 22.23% reduction in the objective function, making it a superior optimization method. Dörterler et al. [6] applied a Grey Wolf Optimizer (GWO) to optimize the weight of spur gears, achieving a lighter design compared to previous studies. This study demonstrates the GWO’s successful application in gear weight optimization for the first time. Li et al. [7] developed a rapid lightweight design system for cranes, integrating parameterization, lightweight optimization, and a two-step optimization method. The system reduced the portal’s mass by 10.5% while maintaining allowable stress and strain, significantly shortening design time and reducing calculation efforts. Kulka et al. [8] optimized the box structure of overhead crane girders using MS Excel and SolidWorks 2023, reducing weight and improving stability, demonstrated through a 50-ton crane case study. Qi et al. [2] proposed a multi-objective optimization approach for crane design, focusing on minimizing both weight and manufacturing waste. By leveraging computational intelligence and fuzzy mathematics, the method achieved a 63.43% reduction in processing waste and a 27.03% decrease in the girder cross-sectional area. Okasha et al. [9] proposed a multi-objective bridge design optimization method based on system reliability, using the MSR method and NSGA-II. The approach efficiently calculates system reliability and optimizes linked-discrete design variables, as demonstrated by redesigning an actual bridge and comparing it with traditional methods. Wang et al. [10] proposed a function integration approach for lightweight design systems, addressing functional conflicts between systems through axiomatic design. Using design matrices, the relationships of design parameters are analyzed and design concepts are evaluated by combining axiomatic design with the design structure matrix.
Safety assessment involves analyzing potential risk factors to evaluate the safety of systems or structures, identify hazards, and ensure the safety of personnel and the environment. It typically combines quantitative analysis with qualitative judgment. Zhu et al. [11] developed a crane safety assessment method combining the cloud model and ICWGT, balancing expert experience with data. Applied to a shipyard portal crane, it accurately reflects safety levels. Sadeghi et al. [12] reviewed crane safety literature using 59 risk factors from CORD, identifying eight key gaps critical for improving crane management and guiding future research. Li et al. [13] proposed a crane safety assessment method integrating entropy and cumulative prospect theory, effectively addressing inaccuracies. The method evaluates four crane samples, demonstrating its precision and feasibility. Li et al. [14] introduced an improved Variable Fuzzy Sets (IVFS) method with normal membership functions to simplify crane safety evaluation when criteria are interval-based. Applied to numerical cases, the method demonstrated its effectiveness and practicality. Barozzi et al. [15] proposed an alternative methodology for assessing old timber structures, moving beyond traditional concepts like “Knowledge Level” and “Confidence Factor”. Experimental data from timber joists were used to support the approach. Ruud et al. [16] applied the IMO’s formal safety assessment (FSA) to develop risk-based rules for offshore crane systems, proposing a cost–benefit method for target reliability and a framework for risk-based rules. Zhang et al. [17] developed a safety evaluation system for quayside container crane structures, introducing the “0–4” scoring method combined with fuzzy comprehensive evaluation (04-FCE). The approach assesses safety levels, offers risk reduction suggestions, and is validated through case analysis.
Existing optimization designs primarily focus on ultimate load conditions, with limited attention given to safety evaluation, resulting in lower safety levels in optimization outcomes. This deficiency could lead to structural failures, posing risks to personnel safety. This study proposes a multi-condition safety design methodology for rotary drilling rig masts. The approach employs cross-sectional parameters as optimization variables and aims to minimize cross-sectional area while considering constraints such as strength, stiffness, stability, fatigue, and safety evaluation. Safety evaluation is conducted by constructing a fuzzy analytic hierarchy model to comprehensively assess safety performance under multiple working conditions, considering safety evaluation indicators such as strength, stiffness, stability, and fatigue strength. The proposed method enables a thorough quantitative analysis of the mast’s safety performance and is validated through practical case studies, demonstrating the effectiveness of the evaluation system.
2. Classification of Working Conditions and Structural Mechanics Model
The main components of a rotary drilling rig include the chassis, undercarriage, mast, drill rods, drill bit, and power head, as illustrated in Figure 1. This study focuses on the mast, which is an essential component of the rotary drilling rig. It not only provides guidance for the drilling tools but also plays a critical role in support and load-bearing. As the primary executing mechanism of the rotary drilling rig, the performance and stability of the mast directly impact the operational efficiency and safety of the entire machine [18].
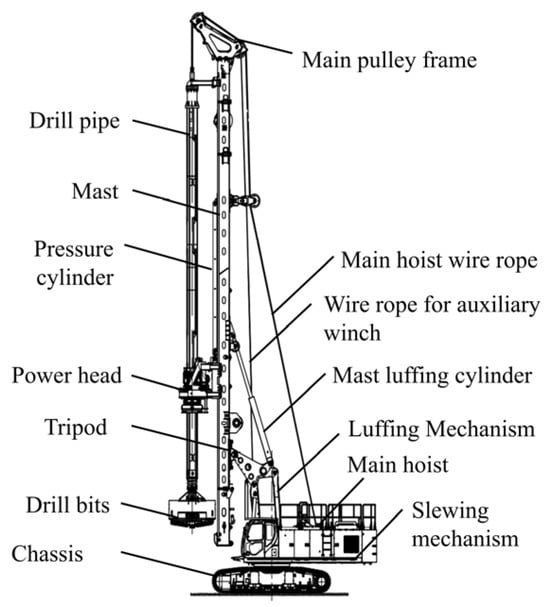
Figure 1.
Rotary drilling rig.
2.1. Classification of Operating Conditions
This study primarily analyzes the working environment and workflow of the rotary drilling rig. Based on the operational principles of the rotary drilling rig, its working conditions are classified into seven typical scenarios: the drilling condition (B1), lifting condition (B2), in-hole lifting condition (B3), spoil discharging condition (B4), soil shaking condition (B5), traveling condition (B6), and rotation condition (B7), as shown in Table 1.

Table 1.
Working conditions.
2.2. Mechanical Model
The mechanical models of the rotary drilling rig can be classified into two typical types: the drilling model and the lifting model. The differences between operating conditions are primarily reflected in variations in dynamic load coefficients and the magnitude of the applied loads. The following sections will introduce these two models in detail.
2.2.1. Drilling Mechanical Model
In the drilling mode, the forces and constraints acting on the mast are shown in Table 2. The force diagram is illustrated in Figure 2. Based on the force state diagram, the external force equilibrium equations can be established for calculations and the corresponding internal force diagrams can be drawn to facilitate a deeper analysis of the mechanical properties.
Table 2.
Forces and constraints under drilling condition.
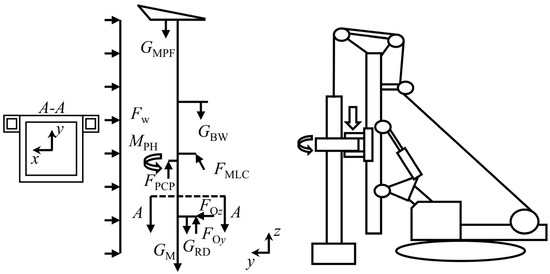
Figure 2.
Drilling model.
2.2.2. Lifting Mechanical Model
In the lifting condition, the forces and constraints acting on the mast are shown in Table 3.
Table 3.
Forces and constraints under lifting condition.
The force diagram is shown in Figure 3.
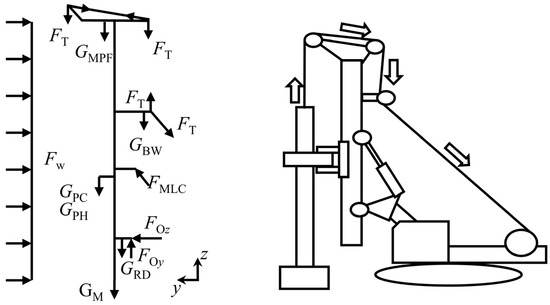
Figure 3.
Lifting model.
2.3. Load-Bearing Capacity Analysis
Based on the two typical mechanical models described above, this study conducts an evaluation of the load-bearing capacity. In the lifting condition, the drilling mast is considered an eccentrically loaded column, whereas in the drilling condition influenced by the pressure cylinder, the mast is analyzed as a tension member. Therefore, it is necessary to verify the load-bearing capacities of these two extreme conditions separately. According to engineering experience, the cross-section of the large disc is selected as the critical section for analysis [20]. Subsequently, an analysis is conducted at the critical points. Points 1 and 3 are subjected to the maximum bending stresses along the x-axis and y-axis directions, while points 2 and 4 are located at the intersection of the midlines of the box-shaped section, resulting in a more complex stress state characterized by spatial stress conditions, as illustrated in Figure 4.
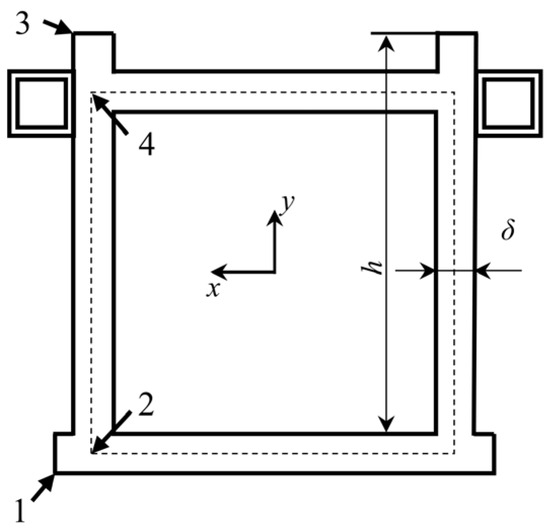
Figure 4.
Critical points.
2.3.1. Strength Analysis
- Drilling Model
In the drilling condition, the cross-section is subjected to axial forces, shear forces, bending moments, and torques, resulting in a complex stress state, as illustrated in Figure 5.
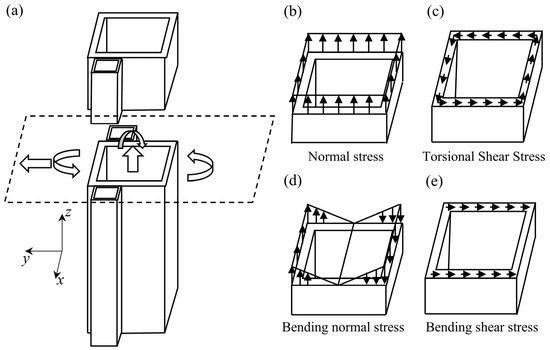
Figure 5.
Drilling conditions: (a) internal forces in the cross-section; (b) cross-sectional normal stress distribution; (c) cross-sectional torsional shear stress distribution; (d) cross-sectional bending normal stress distribution; and (e) cross-sectional bending shear stress distribution.
During the pressurized drilling phase with the hydraulic cylinder, the drilling mast acts as a tension member. The formula for calculating the normal stress [21] is given in Equation (1).
In the equation, N represents the axial force on the calculated cross-section; Aj denotes the net cross-sectional area of the member; and Mx and My are the bending moments about the x-axis and y-axis at the calculated cross-section, respectively. The moment about the x-axis primarily originates from the moment generated by the applied or lifting force acting on the centroid, while the y-axis primarily arises from the eccentric load of the main pulley frame; and Wjx and Wjy are the section modulus for bending about the x-axis and y-axis for the net cross-sectional area of the member. For box-section structures, the constrained bending stress should be calculated. To simplify, a coefficient method is used, taking it as 0.1 times the free bending stress.
In addition, it is also subjected to bending shear stress, which is calculated using the following formula, as shown in Equation (2):
In the equation, F represents the shear force; h is the height of the web; and denotes the thickness of the web.
In addition to the aforementioned normal stress and shear stress due to bending, the section under pressurized drilling also experiences torque. The simplified calculation formula for the torsional shear stress is given by Equation (3) as follows:
In the equation, A0 represents the area enclosed by the midline of the closed section plate thickness, while δmin denotes the minimum plate thickness of the section.
Due to constrained torsion, both sector shear stress and sector normal stress are present. The sector shear stress is generally negligible compared to the torsional shear stress. For the sector normal stress, a coefficient method is applied, assuming it to be 0.05 times the free bending normal stress.
The types of stress at the critical points are shown in Table 4.
Table 4.
Types of stress at critical points under drilling conditions.
For points 2 and 4, which are under a three-dimensional stress state, it is necessary to calculate the von Mises stress to convert the three-dimensional stress state into a uniaxial stress state, as shown in Equations (4) and (5).
In Equation (4), the subscripts 1, 2, and 3 denote the principal stresses, which represent the normal stresses acting on the principal planes where shear stress is zero.
- Lifting Model
For the inner lifting condition, the drill mast behaves as an eccentric compression member, subjected to axial force, shear force, and bending moment, as illustrated in Figure 6.
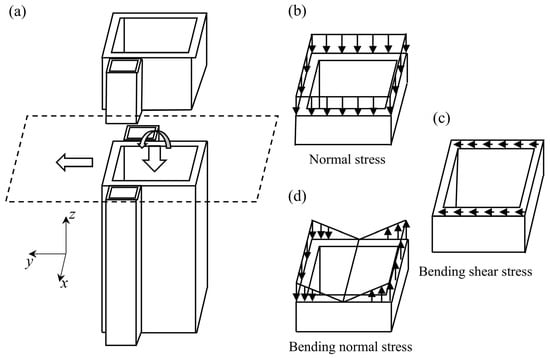
Figure 6.
In-hole lifting conditions: (a) internal forces in the cross-section; (b) cross-sectional normal stress distribution; (c) cross-sectional bending shear stress distribution; (d) cross-sectional bending normal stress distribution.
For the inner lifting condition, the limit compression of the rotary drilling rig mast is characterized as a compressive-bending member. The axial stress is given by Equation (6):
In the equation, NEx and NEy represent the nominal critical Euler force of the member, as defined in Equation (7). When N/NE < 0.1, the axial stress can be calculated using Equation (1), with the remaining parameters as described above.
In addition, it is also subjected to bending shear stress, the calculation formula for which is given in Equation (2).
The stresses experienced by the critical points of the dangerous section of the drill mast are shown in Table 5.
Table 5.
Types of stress at critical points under in-hole lifting conditions.
2.3.2. Stiffness Analysis
In engineering, the slenderness ratio is commonly used to check stiffness, as shown in Equation (8):
In the equation, λ is the slenderness ratio of the member. l0 represents the effective length, . r denotes the minimum radius of gyration of the gross cross-section, . [λ] is the allowable slenderness ratio.
2.3.3. Overall Stability
The column is a thin-walled structure. To ensure its safe and normal operation, it is essential to guarantee not only the strength and stiffness of the column but also its stability. Therefore, a stability analysis of the column is necessary [22]. Based on the most critical load condition, which is the internal lifting condition under compression, its overall stability is assessed using the following Equation (9):
In the equation, N represents the axial force; is the stability coefficient; A denotes the gross cross-sectional area of the member; Mx and My are the primary bending moments about the x-axis and y-axis, respectively; and Wx and Wy are the section modulus for bending about the x-axis and y-axis, respectively. For the axial force and uniformly distributed weight acting at the midspan of the member, an equivalent force needs to be applied at the top end of the drilling mast.
2.3.4. Fatigue Strength
The fatigue strength verification formula [23,24] is shown in Equation (10). The left-hand side of the equation represents the stress range under a typical working cycle [25], while the right-hand side indicates the limit design stress range represented by the stress history parameters, considering the working grade.
In the equation, σmax and σmin are the partial safety factors, considering the dynamic load coefficient in the design stress limit. represents the characteristic fatigue strength, defined as the fatigue strength under a constant stress range, corresponding to 2 × 10⁶ cycles with a reliability probability of 97.7%. γmf is the fatigue strength resistance coefficient and sm is the stress history parameter.
3. Fuzzy Comprehensive Evaluation
The mast structure of a rotary drilling rig is a critical component and its performance directly affects the operational efficiency and safety of the entire machine. Due to the inherent randomness in the evaluation process, the assessment of the mast structure involves a high degree of uncertainty. As a result, fuzzy comprehensive evaluation [26,27] has emerged as an effective solution.
The safety evaluation model for the mast’s metal structure consists of three main components: the evaluation system, the membership degree matrix, and the weight vector. The overall process is shown in Figure 7. First, safety indicators are determined based on the factors influencing safety and the corresponding indicator layers and rating systems are established. Next, the membership degrees between the indicators and the evaluation categories are calculated using membership functions. Then, the Analytical Hierarchy Process (AHP) and the CRITIC method are applied to weight the indicators. Finally, the fuzzy comprehensive evaluation result is obtained by performing a dot product operation between the membership degree matrix and the weight vector.
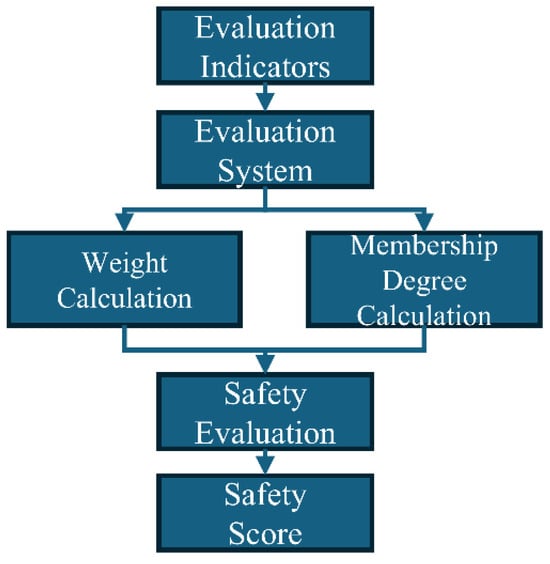
Figure 7.
Evaluation Process.
3.1. Evaluation System
For the safety assessment of the rotary drilling rig mast, an evaluation system is constructed, consisting of a goal layer and an indicator layer, as shown in Figure 8. The goal layer represents the “Metal Structure Safety Assessment of the Mast”, which is the core objective of the comprehensive evaluation. The indicator layer includes four key indicators: strength, stiffness, stability, and fatigue. These indicators are considered inverse indicators, meaning that the smaller the indicator value, the higher the safety performance.
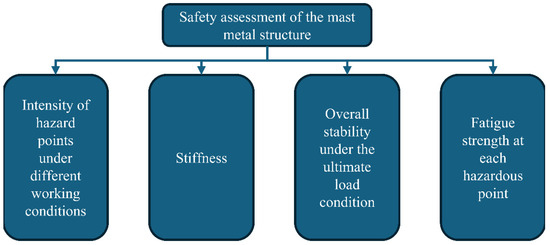
Figure 8.
Evaluation system.
3.2. Quantification Mechanism of Safety Indicators
The membership matrix reflects the fuzzy mapping relationship between each indicator and the corresponding evaluation comments. Commonly used methods for calculating membership include fuzzy statistical methods, membership functions, and subjective experience-based methods. The fuzzy statistical method requires a large amount of data samples, while the subjective experience-based method introduces a strong degree of subjectivity. Therefore, this study selects the trapezoidal membership function, which offers higher objectivity, to calculate the membership degree. The evaluation set consists of four levels, denoted as G = {G1, G2, G3, G4}, where G1 to G4 correspond to the four levels of “poor”, “fair”, “good”, and “excellent”, respectively. The range of the evaluation set is shown in Table 6.
Table 6.
Range boundaries of evaluation criteria for each indicator layer.
The indicators in this study are all inverse indicators, and the specific trapezoidal membership function calculation formulas are shown in Table 7.
Table 7.
The trapezoidal membership function calculation formulas.
3.3. Method of Weight Assignment
In the evaluation process, the values reflecting the relative importance of each indicator are referred to as weights. In a fuzzy comprehensive evaluation system, indicators at different levels have varying degrees of importance. Assigning appropriate weight values to each indicator based on its significance directly influences the accuracy of the evaluation results. There are three primary methods for weight assignment: subjective weighting, objective weighting, and combined weighting. Selecting the appropriate weight assignment method based on specific circumstances helps to enhance the authenticity and validity of the evaluation results. For the safety assessment of the rotary drilling rig mast, this study adopts a combined weighting approach that integrates both subjective and objective methods for weight assignment.
3.3.1. Analytic Hierarchy Process
The subjective weighting method includes techniques such as the Delphi method and Analytic Hierarchy Process (AHP). In this study, the Analytic Hierarchy Process is chosen. The AHP is a method that decomposes a complex decision system into hierarchical levels, such as goals, criteria, and alternatives, to establish a relevant model. Based on this structure, the AHP combines both qualitative and quantitative analyses for systematic decision evaluation. This method is characterized by its clear structure, strong flexibility, and ease of implementation.
When applying the AHP for weight assignment, the first step is to perform pairwise comparisons of the evaluation criteria based on their relative importance and construct the judgment matrix A (see Equation (11)), as shown in Table 8.
Table 8.
Judgment matrix scale.
Then, the consistency of the judgment matrix is checked using Equations (12) and (13) to ensure the rationality of the weight allocation.
In the equation, a12 represents the relative importance of the first indicator compared to the second indicator.
In the equation, λmax represents the maximum eigenvalue of the judgment matrix; n denotes the number of indicators; CI is the consistency index; RI is the average random consistency index, with values shown in Table 9; and CR is the consistency ratio.
Table 9.
The average consistency index.
When the consistency check is satisfied for CR < 0.1, the eigenvector corresponding to the largest eigenvalue of the judgment matrix is normalized to obtain the weights of the indicators.
3.3.2. CRITIC Method
Common objective weighting methods include the entropy method [28], CRITIC method [29], and others. In this study, the CRITIC method is adopted. The CRITIC method is a weighting decision technique based on objective data and scientific analysis. This method objectively evaluates and quantifies the importance of each evaluation indicator to determine the weight of each indicator in the final evaluation or decision. The calculation process is as follows:
- First, construct the evaluation matrix. Supposing there are several elements and multiple evaluation indicators, an evaluation matrix can be constructed based on this information, as shown in Equation (14).
- 2.
- Next, perform standardization on the input matrix as shown in Equation (15), denoted as the standard matrix. This operation normalizes the original matrix into a standardized form.
- 3.
- Finally, based on the standardized matrix, calculate the standard deviation sj of each indicator (see Equation (16)), the correlation coefficient rij between each pair of indicators (see Equation (17)), and the potential conflict indicator ej (see Equation (18)). The weight of each indicator can then be calculated as shown in Equation (19).
In the equation, represents the average value of the elements in the i-th row of the standardized matrix; denotes the covariance between the i-th and j-th rows of the matrix.
3.3.3. Weight Combination
In this study, the subjective and objective weights are combined using a linear aggregation method, as shown in Equation (20).
In the equation, w represents the composite weight, wahp denotes the subjective weight, wcritic represents the objective weight, and α is the weight of the subjective weight relative to the objective weight, which is set to 0.5 in this study.
3.4. Comprehensive Safety Evaluation
Once the membership matrix MM is obtained, the fuzzy comprehensive evaluation matrix FCEM can be derived by performing a dot product operation with the weight vector w, as expressed in Equation (21). To make the evaluation results more intuitive, this study assigns specific scores to each grade in the evaluation set G = {G1, G2, G3, G4}. The corresponding score vector is GS = [40, 60, 80, 100]. The safety evaluation score is then calculated using Equation (22).
4. Optimization Model and Algorithm
Optimization design involves constructing a mathematical model to describe the optimization problem. Based on the research presented in the previous two chapters, this study employs an improved Salp Swarm Algorithm [25] for structural optimization.
4.1. Optimization Model
To address the issue of low reliability in optimization results, this study incorporates a safety evaluation constraint in addition to the conventional load-bearing capacity constraint. This enhancement improves the safety of the optimization outcomes. The optimization model is defined as shown in Equation (23).
In the equation, f represents the objective function, which is the cross-sectional area. x1–x4 are the optimization design variables, where x1 denotes the width of the cross-section, x2 the height of the cross-section, x3 twice the thickness of the web, and x4 twice the thickness of the flange. A is the fixed area. Gi represents the constraints, as detailed in Table 10.
Table 10.
The constraint conditions.
4.2. Improved Salp Swarm Algorithm
For the structural optimization problem, this study utilizes the improved Salp Swarm Algorithm to perform optimization. This approach yields higher-quality solutions with advantages such as faster iteration speed and stronger robustness. The thickness of the web plate and flange plate are selected from a set of standard thickness values and combinations of the thicknesses form a dimension. This process generates multiple dimensions to enhance the solution quality. Furthermore, improved strategies are applied within each dimension to accelerate convergence. The flowchart of this process is shown in Figure 9.
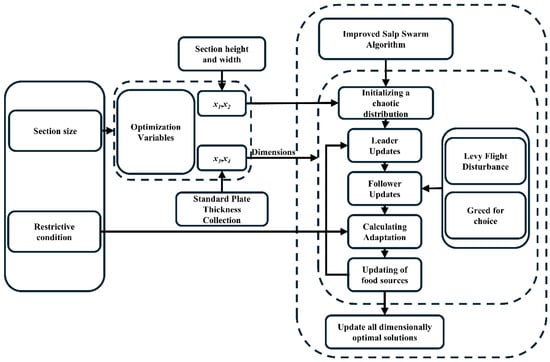
Figure 9.
Flowchart of the improved Salp Swarm Algorithm.
5. Engineering Application
This study uses a specific model of a rotary drilling rig as an example to validate the effectiveness of the proposed method. The parameters of the model are shown in Table 11 below.
Table 11.
Model parameters.
5.1. Load-Bearing Capacity Check and Safety Score
A judgment matrix is constructed based on the relative importance of each indicator. Since the drill mast is primarily a compression member, instability is the most critical failure mode and therefore it is assigned the highest level of importance. On the other hand, stiffness affects the quality of hole formation but has a lesser impact on personal safety, so its importance is relatively low. The corresponding judgment matrix is shown in Equation (24).
The combined weight, derived from both subjective and objective weights, is given by the following Equation (25).
The boundary values of the trapezoidal membership function are shown in Table 12. Currently, there is no unified standard for setting the evaluation ranges of each indicator. Typically, it is necessary to refer comprehensively to relevant design specifications [23] and consider expert opinions to reasonably determine the range of the boundary values [30]. For example, in the case of static strength, the yield stress of the material for this machine model is 550 MPa. Based on the limit stress formula, the ultimate stress is calculated as 495 MPa and the boundary values are divided with a fixed interval of 50 MPa.
Table 12.
The evaluation range boundaries.
The existing load-bearing capacity and safety assessment results of the drilling mast are shown in Table 13. From the evaluation results, it can be observed that the mast has a certain safety margin in terms of load-bearing capacity, providing a solid foundation for further optimization design.
Table 13.
Load-bearing capacity and safety assessment.
5.2. Optimization Results
The parameters for the optimization algorithm are set as follows: the maximum number of iterations is 100, the population size is 100, and the standard plate thickness dataset is T = [6, 8, 10, 12]. The range of variation for the optimization variables is presented in Table 14.
Table 14.
The range of variation for the optimization variables.
The results are presented in the Table 15 below.
Table 15.
Comparison of optimization results.
From the table above, it can be observed that both ordinary optimization design and safety optimization design successfully reduced the cross-sectional dimensions, achieving a certain degree of structural lightweighting. However, compared to ordinary optimization design, safety optimization design resulted in a slight increase in self-weight, approximately 7.3%, but its safety score significantly improved by nearly 14.74%. This difference reflects the significant advantage of safety optimization design in balancing both lightweighting and structural safety.
Although ordinary optimization design can reduce self-weight, it may lead to higher risks due to insufficient consideration of the structural safety performance. In extreme working conditions, this could potentially pose safety hazards. On the other hand, safety optimization design, by incorporating safety assessment constraints, effectively enhances the structural safety performance, significantly reducing the potential failure risk, and provides higher reliability and practicality for the design outcome.
From the perspective of feasibility and engineering practice, safety optimization design not only achieves the lightweighting goal but also significantly improves safety performance, demonstrating exceptional potential in meeting modern engineering demands. This design approach offers valuable reference for achieving the optimization goals of rotary drilling rig masts and sets a good example for the optimization design of other structural components.
6. Conclusions
This paper proposes an optimization model that takes into account safety evaluation constraints, effectively balancing the issues of lightweighting and safety. The following conclusions can be drawn:
- This study developed a safety evaluation system for rotary drilling rig masts which quantifies the safety score of a mast and provides a scientific basis for its design safety evaluation. The system comprehensively considers multiple factors such as strength, stiffness, stability, and fatigue, providing a holistic reflection of the mast’s safety performance.
- By incorporating safety evaluation as a constraint in the optimization design, compared to conventional optimization methods, although there is a slight increase in weight (7.3%), the safety performance is significantly improved, with the safety score increasing by 14.74%. This design approach not only meets the lightweight requirements but also ensures the structural safety of the mast, enhancing safety assurance and providing a more reliable optimization solution for the rotary drilling rig mast design. Through this optimization method, a good balance between safety and lightweight can be achieved while maintaining economic feasibility.
To further improve the reliability of the optimization results, future research could consider employing finite element methods combined with surrogate models and other related methods to address this issue.
Author Contributions
Conceptualization, H.Y. (Heng Yang) and Y.R.; methodology, G.X.; software, Y.R.; validation, H.Y. (Heng Yang), H.Y. (Haorong Yang) and G.X.; formal analysis, Y.R. and H.Y. (Haorong Yang); investigation, H.Y. (Haorong Yang).; resources, G.X.; data curation, Y.R.; writing—original draft preparation, Y.R.; writing—review and editing, H.Y. (Heng Yang) and G.X.; visualization, Y.R. and H.Y. (Heng Yang); supervision, H.Y. (Haorong Yang).; project administration, H.Y. (Haorong Yang); funding acquisition, G.X. and H.Y. (Heng Yang). All authors have read and agreed to the published version of the manuscript.
Funding
This research received no external funding.
Institutional Review Board Statement
Not applicable.
Informed Consent Statement
Not applicable.
Data Availability Statement
The data presented in this study are available in the article.
Conflicts of Interest
The authors declare no conflicts of interest.
References
- Wang, Y.; Ma, C.; Wang, C.; Zhang, H.; Fan, S. Characteristics analysis and optimization design of bridge crane based on improved particle swarm optimization algorithm. J. Low Freq. Noise Vib. Act. Control 2023, 42, 253–271. [Google Scholar] [CrossRef]
- Qi, Q.; Xu, H.; Xu, G.; Dong, Q.; Xin, Y. Comprehensive research on energy-saving green design scheme of crane structure based on computational intelligence. AIP Adv. 2021, 11, 075314. [Google Scholar] [CrossRef]
- Yu, Y.; Liu, Z.; Lu, Y.; Zhang, P.; Liu, H. Optimal design of main girder structure of bridge crane based on equal life concept driven by data. J. Mech. Sci. Technol. 2023, 37, 4767–4786. [Google Scholar] [CrossRef]
- Ren, Y.; Liu, X.; Wang, B. Mass Optimization of Crane Box Girder Considering Both Ribs and Diaphragms using APDL. Int. J. Steel Struct. 2024, 24, 672–692. [Google Scholar] [CrossRef]
- Qu, X.; Xu, G.; Fan, X.; Bi, X. Intelligent optimization methods for the design of an overhead travelling crane. Chin. J. Mech. Eng. 2015, 28, 187–196. [Google Scholar] [CrossRef]
- Dörterler, M.; Şahin, İ.; Gökçe, H. A grey wolf optimizer approach for optimal weight design problem of the spur gear. Eng. Optim. 2019, 51, 1013–1027. [Google Scholar] [CrossRef]
- Li, Y.; Xiang, D.; Li, Q.; Wang, J. Research and application on rapidly lightweight design system of cranes. J. Mech. Eng. 2018, 54, 205–213. [Google Scholar] [CrossRef]
- Kulka, J.; Mantič, M.; Grega, R.; Siman, M.; Kopas, M.; Maláková, S. Optimisation of Box Girder Design of Overhead Cranes. Appl. Sci. 2024, 14, 9926. [Google Scholar] [CrossRef]
- Okasha, N.M. System reliability based multi-objective design optimization of bridges. Struct. Eng. Int. 2016, 26, 324–332. [Google Scholar] [CrossRef]
- Wang, M.; Beeh, E.; Höfer, A.; Friedrich, H. Function integration for lightweight chassis based on axiomatic design and design structure matrix. Int. J. Automot. Technol. 2018, 19, 969–979. [Google Scholar] [CrossRef]
- Zhu, Z.; Luo, Y.; Xiao, H.; Xiong, C.; Chen, C. Research on the crane safety assessment method based on the cloud model and ICWGT. Appl. Sci. 2022, 12, 4399. [Google Scholar] [CrossRef]
- Sadeghi, S.; Soltanmohammadlou, N.; Rahnamayiezekavat, P. A systematic review of scholarly works addressing crane safety requirements. Saf. Sci. 2021, 133, 105002. [Google Scholar] [CrossRef]
- Li, A.; Zhao, Z. Crane safety assessment method based on entropy and cumulative prospect theory. Entropy 2017, 19, 44. [Google Scholar] [CrossRef]
- Li, A.; Zhao, Z. An improved model of variable fuzzy sets with normal membership function for crane safety evaluation. Math. Probl. Eng. 2017, 2017, 3190631. [Google Scholar] [CrossRef]
- Barozzi, G.; Cosentino, N.; Lanzoni, L.; Tarantino, A. Safety assessment of historic timber structural elements. Case Stud. Constr. Mater. 2018, 8, 530–541. [Google Scholar] [CrossRef]
- Ruud, S.; Mikkelsen, Å. Risk-based rules for crane safety systems. Reliab. Eng. Syst. Saf. 2008, 93, 1369–1376. [Google Scholar] [CrossRef]
- Zhang, M.; Huang, C.; Chen, K.; Liu, J.; Gan, Y.; Zhao, J. Research on Safety Evaluation of Quayside Container Crane Metal Structure Based on 04-FCE. J. Phys. Conf. Ser. 2019, 1345, 032034. [Google Scholar] [CrossRef]
- He, M. Fatigue Analysis for the Mast of Rotary Drilling Rig Based on ANSYS. Master’s Thesis, Xi’an University of Architecture and Technology, Xi’an, China, 2017. [Google Scholar]
- Kang, H.-M.; He, Q.-H.; Xie, S.-Y.; Zhu, J.-X. Mechanics analysis of rotary drilling rig under drilling-bucket-lifting conditions. Eng. Mech. 2010, 27, 214–218. [Google Scholar]
- Qian, W. Edge detection in x-ray images of drill mast welds based on an improved Scharr operator. Weld. Int. 2024, 38, 574–581. [Google Scholar] [CrossRef]
- Dong, Q.; Xu, G.; Ren, H.; Wang, A. Fatigue remaining life estimation for remanufacturing truck crane Jib structure based on random load spectrum. Fatigue Fract. Eng. Mater. Struct. 2017, 40, 706–731. [Google Scholar] [CrossRef]
- Zhan, H. FEA of the Leader of the Rotating Drilling Rigsand Probe into the Reliability. Master’s Thesis, Daqing Petroleum University, Daqing, China, 2005. [Google Scholar]
- GB/T 3811-2008; Design Rules for Cranes. National Standards of the People’s Republic of China: Beijing, China, 2008.
- Xu, G. Design of Metal Structure for Mechanical Equipment, 3rd ed.; China Machine Press: Beijing, China, 2018. [Google Scholar]
- Yang, H.; Ren, Y.; Xu, G. Optimization of Rotary Drilling Rig Mast Structure Based on Multi-Dimensional Improved Salp Swarm Algorithm. Appl. Sci. 2024, 14, 10040. [Google Scholar] [CrossRef]
- Akter, M.; Jahan, M.; Kabir, R.; Karim, D.S.; Haque, A.; Rahman, M.; Salehin, M. Risk assessment based on fuzzy synthetic evaluation method. Sci. Total Environ. 2019, 658, 818–829. [Google Scholar] [CrossRef] [PubMed]
- Jiskani, I.M.; Cai, Q.; Zhou, W.; Lu, X. Assessment of risks impeding sustainable mining in Pakistan using fuzzy synthetic evaluation. Resour. Policy 2020, 69, 101820. [Google Scholar] [CrossRef]
- Jingwen, L.; Jiangang, Q.; Yuanming, D.; Xu, F.; Xiaoli, L. Safety Evaluation Method of Antifloating Anchor System Based on Comprehensive Weighting Method and Gray-Fuzzy Theory. Math. Probl. Eng. 2020, 2020, 3216948. [Google Scholar] [CrossRef]
- Zhang, Q.; Liu, C.; Guo, S.; Wang, W.; Luo, H.; Jiang, Y. Evaluation of the rock burst intensity of a Cloud Model based on the CRITIC method and the Order Relation Analysis Method. Min. Metall. Explor. 2023, 40, 1849–1863. [Google Scholar] [CrossRef]
- He, B.; Zhao, Z.; Qiu, F. Overhead crane bridge structure design optimization based on safety assessment. Proc. Inst. Mech. Eng. Part E J. Process Mech. Eng. 2024. [Google Scholar] [CrossRef]
Disclaimer/Publisher’s Note: The statements, opinions and data contained in all publications are solely those of the individual author(s) and contributor(s) and not of MDPI and/or the editor(s). MDPI and/or the editor(s) disclaim responsibility for any injury to people or property resulting from any ideas, methods, instructions or products referred to in the content. |
© 2025 by the authors. Licensee MDPI, Basel, Switzerland. This article is an open access article distributed under the terms and conditions of the Creative Commons Attribution (CC BY) license (https://creativecommons.org/licenses/by/4.0/).