Article

Determination of Renewable Energy Growth Using Cluster Analysis and Multi-Criteria Decision-Making Methods

1
Institute of Social Sciences, Cukurova University, Adana 01790, Türkiye
2
Department of Industrial Engineering, Engineering Faculty, Cukurova University, Adana 01790, Türkiye
*
Author to whom correspondence should be addressed.
Appl. Sci. 2025, 15(3), 1575; https://doi.org/10.3390/app15031575
Submission received: 19 November 2024 / Revised: 20 January 2025 / Accepted: 30 January 2025 / Published: 4 February 2025

Abstract

:
Energy plays an important role in both the economic and social development of countries and is a critical factor in human life. The high consumption of fossil fuels in energy production leads to serious environmental problems such as increasing greenhouse gas (GHG) emissions that lead to global warming and climate change. Many countries around the world have actively turned to renewable energy or sustainable energy sources in order to cope with the environmental crises caused by climate change. In this study, the renewable energy use performance of OECD countries in terms of sustainable development is evaluated. In the study, 38 countries were divided into three clusters for each year with the 13 variable K-means algorithm for the years 2018–2022. The criteria of the countries in the determined clusters were weighted with the CRITIC (Criteria Importance Through Intercriteria Correlation) method for each year during the study period. Countries with weighted criteria were ranked separately for each year within their own clusters using the COPRAS method. With these rankings, it is understood that the biggest share in achieving Türkiye’s “Net Zero 2053” targets among OECD countries is the transition from fossil fuels to renewable energy.

1. Introduction

Energy is one of the strategic resources necessary for a productive and sustainable life within societies. Access to the necessary amount of energy at affordable prices greatly affects the living standards of societies and their development, in other words, the progress of civilization [1].
Energy is one of the main drivers of growth and development in the industrial, residential, and other sectors. A country’s ability to provide the energy needed for its citizens greatly impacts its GDP and development. Energy development leads to economic prosperity as well as social development in many countries. Therefore, it is clear that energy plays a major role in the development and infrastructural progress of a country [2].
Energy is a source of life that provides the ability to do a job. Energy can be obtained from primary energy sources such as coal, oil, natural gas, uranium, biomass, geothermal sources, hydro sources, solar sources, and wind. Energy sources such as oil, natural gas, coal, and nuclear energy are known as fossil energy sources. Wind, solar, biomass, hydraulic, geothermal, wave, and hydrogen energies are called renewable energies. Renewable energy causes less greenhouse gas emissions and is constantly renewing itself [1].
It is clear that energy is of vital importance for countries in a globalizing world and is an important indicator of economic development. Achieving sustainable development in a society is largely related to the abundance of energy resources. These energy resources need to be used in a cost-effective way that does not cause negative impacts for the needs of society.
The world population has increased 2.5 times since 1950. As a result of this increase, energy demand has also increased 7 times [1]. As the latest estimates from the US Energy Information Administration (EIA) show, global energy consumption and, therefore, energy demand will increase by approximately 50% by 2050 compared to 2018. Such a large increase is forcing countries to take action to meet the increasing demand. Producing this energy sustainably, that is, in a way that does the least harm to the environment, will be beneficial both politically and socially [1]. Energy consumption in Türkiye is also expected to increase by more than 100 percent in 2030 compared to today. For this reason, as in the rest of the world, the aim is to ensure a transition from conventional energy sources to renewable energy sources in Türkiye [3].
Energy, environment, and sustainability are interrelated concepts. While the world population aims to spread its comfort and prosperity globally and to achieve more development and comfort, it is caught in the dilemma created by the use of the world’s resources as if they were unlimited [4]. In many countries, the energy needed to meet these challenges comes from renewable energy sources [2].
Sustainable development requires collective efforts to ensure that society has a sustainable and resilient future. For this purpose, the dimensions of sustainability such as economic growth, social inclusiveness, and environmental protection need to be harmonized. These goals bring with them many challenges such as sustainable cities and industries, biodiversity, sustainable consumption and production, and climate change. Energy is linked to many of the sustainable development goals (SDGs) such as decent jobs, income, pollution, and ecosystems and is therefore at the center of many of these challenges and opportunities facing the world [5].
The importance of energy security in the modern world has been proven by the recent COVID-19 pandemic and the effects of armed conflicts. These events around the world are also bringing energy crises [1]. In this study, 38 OECD countries were evaluated regarding electricity from wind, electricity from hydro sources, electricity from solar sources, other renewables including bioenergy, employment-to-population ratio, population, labor force, GDP, purchasing power parities and exchange rates, consumer price index, CO2 emissions, carbon intensity of electricity, and per capita energy use data for the period 2018–2022. Countries were first clustered with a K-means algorithm according to their data. Then, 13 variables belonging to the countries were weighted with the CRITIC method. Using the weight values determined by the method, each country was ranked within its cluster group with the COPRAS method.
Renewable energy is self-renewing and does not deplete resources in nature, resulting in fewer greenhouse gas emissions. The contribution of renewable energy sources in combating environmental problems and SDGs is indisputable. For this reason, energy resources, environmental problems, and SDGs are among the most discussed topics in the academic field. Information on previous studies is summarized in Table 1.
This research aimed to evaluate the adaptation of renewable energy sources by OECD countries within the framework of the variables determined. The adaptation of renewable energy sources by countries within the framework of sustainability approaches was analyzed, and the researchers aimed to determine which areas the well-adapted countries focus more on than other countries. Thus, countries’ approaches to renewable resources were identified and ranked. In the study, countries with similar performances were also identified through a cluster analysis. In addition, these analyses were repeated in the 2018–2022 period to determine how the change occurred over the years.
Faraji Abdolmaleki et al. [6] adopted a multi-step approach to assess the sustainable status of renewable energy in the EU’s top economic countries. The study results provide insights and policy recommendations for utilizing renewable energy in fast-growing economies.
Almutairi et al. [2] used a combination of SWOT, multi-criteria decision-making approaches, and game theory to determine Iran’s energy development plans with renewable energy sources. The study suggested that Iran should invest more in renewable energy sources.
Aytekin [4] used ARAT, CRITIC, SOWIA, CRADIS, and CODAS-Sort methods in his study, where he evaluated countries on the basis of the trio of energy, environment, and sustainability. The result of the study revealed that developed countries are in a better position than developing and less developed countries in terms of sustainable energy and environmental concerns.
Aiming to assess the energy security level of 27 EU countries, Brodny and Tutak [1] utilized MCDM techniques for their analysis. The study evaluated energy resources from the perspective of sustainable development, which is called sustainable energy security as energy and economic factors and environmental and social factors and found a high level of energy security in Scandinavian countries.
Büyüközkan et al. [5] determined the most suitable renewable energy source with a numerical decision support method. The study presents a case study from Turkey and an integrated multi-criteria decision-making method with a comparative analysis.
Çolak and Kaya [3] proposed an integrated Fuzzy Set-Based Integrated CRM model for the prioritization of renewable energy alternatives in Türkiye. In order to demonstrate the applicability of the proposed model, a real situation application was presented through expert evaluations, and sensitivity analysis was performed to examine the effect of main criteria weights on the ranking.
Ishfaq et al. [7] conducted a study to decide the best renewable energy alternative for investment to meet Pakistan’s growing energy demands. As a result of the study, it was shown that hydel power generation is the most suitable source to meet the energy requirements, followed by wind, biomass, and solar power generation plants.
Kabak and Dağdeviren [8] determined Turkey’s energy situation and prioritized alternative renewable energy sources in their study, where they proposed a hybrid model based on BOCR and ANP. In total, 19 criteria were used to evaluate five alternative renewable energy sources.
Lee and Chang [9] conducted a comparative analysis of renewable energy sources for electricity generation in Taiwan using WSM, VIKOR, TOPSIS, and ELECTRE methods. The study results showed that hydropower is the best alternative in Taiwan, followed by solar, wind, biomass, and geothermal energy.
Li et al. [10] developed a new framework to evaluate renewable energy development in China from a sustainable development perspective. The results showed that energy sustainability indicators have the highest priority among all standards, and hydropower is the best choice among renewable energy sources in China.
Ecer et al. [11] analyzed OPEC countries according to 41 sustainability indicators in 10 dimensions by using the CoCoSo approach from multi-criteria decision-making methods.
Atmaca and Basar [12] utilized multi-criteria decision-making techniques to evaluate six different power plants in terms of main criteria such as technology and sustainability, economic viability, quality of life, and socio-economics.
Ishizaka et al. [13], who developed a study to help policy makers better understand energy planning issues with their proposed tool, utilized the AHP method for better planning and decisions in the energy sector.
Selecting sustainable electricity production technologies with MULTIMOORA and TOPSIS methods, Streimikiene et al. [14] proved in their work that future energy policy should be oriented towards hydro and solar energy technologies.
Ertay et al. [15] evaluated renewable energy alternatives as a key way to solve Türkiye’s energy challenges, as Türkiye’s energy consumption has increased dramatically in the last three decades as a result of economic and social development.
Kaya and Kahraman [16] aimed to identify the best renewable energy alternative for Istanbul using an integrated VIKOR-AHP methodology. In the study, alternative energy production sites in the city were also selected using the same approach.
Chomać-Pierzecka et al. [17] tried to identify the directions of geothermal energy development in Poland. The results of the study showed that there is an increasing awareness of the validity of energy extraction efforts in the world, but that this issue is still a major challenge.
Menegaki and Tiwari [18] examined the relationship between the traditional energy–growth nexus and the sustainable economic welfare–index growth nexus. In the study, a multivariate panel analysis was conducted for American countries for the time period from 1990 to 2013. The results show that governments and investors who embrace sustainable development are better off than those who are only concerned with GDP growth.
Pestana et al. [19] studied the environmental and economic benefits of solar energy systems in Portugal over the last decade. The study results showed that the avoided 2005 CO2 emissions and the resulting savings could be used for investment in renewable energies to achieve the 2020 targets.
Ślusarczyk et al. [20] examined the relationship between renewable energy sources and economic growth for two different EU countries. As a result of the study examining the Polish and Swedish economies, a positive correlation between the Swedish and Polish Gross Domestic Product and Gross National Income variables was noted. It is argued that this situation affects the use of renewable energy sources in both countries.
Amri [21] used a panel data approach to analyze economic growth, renewable energy type, and trade in 72 countries from 1990 to 2012. Dividing all countries into three groups according to the level of development, the study concluded that there is a relationship between income and renewable energy consumption, trade and renewable energy consumption, and trade and income.
Andre et al. [22] utilized a panel data analysis to prove that energy plays an important role in ensuring the sustainable development of contemporary economies. The study also introduced an indicator to express energy consumption per capita.
Jebli and Youssef [23] analyzed the long- and short-term relationships between CO2 emissions per capita, GDP, and renewable and non-renewable energy consumption for Tunisia for the period 1980–2009.

2. Materials and Methods

In order to evaluate the adaptation of 38 OCED countries to renewable energy sources, the methodology for the research procedure was proposed to include the following stages (Figure 1). Following a comprehensive literature review, the variables of the study were determined within the framework of sustainability based on previous sources. The K-means algorithm was used for cluster analysis in the study, which was analyzed with 13 different variables for 38 countries. The CRITIC method was used to weight the 13 variables, while the COPRAS method was used to rank the countries. The values of the 13 variables for the period 2018–2022 were obtained from the official websites of Our World in Data, World Bank, OECD, and IEA. Since there were not enough data for Iceland and Israel in 2022, these countries were excluded from the analysis, and the analysis was performed for 36 countries.

2.1. Cluster Analysis

Cluster analysis, which identifies groupings in a dataset, is a widely used data mining process. It has evolved alongside machine learning. Cluster analysis is an unsupervised machine learning method that identifies patterns among data without user input [24].
Clustering is the grouping of data with similar profiles. Data assigned to different clusters are as different as possible. In clustering, the number of load profiles of output clusters is less than or equal to the number of input load profiles [25]. One of the most widely used clustering algorithms is the K-means algorithm.
The K-means algorithm starts by creating k clusters. Each data point is then assigned to the cluster with the closest mean value. Once all data are assigned to a collection of clusters, new mean values are calculated within each cluster. The data points are then reassigned to the new cluster with the next closest mean value. This process continues until the values of the previous iteration of the clusters are the same as the mean values of the current iteration [24].

2.2. MCDM Methods

2.2.1. CRITIC Method

The CRITIC method aims to determine objective weights of relative importance in multi-criteria decision-making problems [26]. The most important feature that distinguishes this method from other methods is that the standard deviations and correlations of the criteria are taken into consideration when weighting, not the results obtained from expert opinions [27]. For this reason, the CRITIC method, which provides consistent results in determining criteria weights, was used in this study.
The CRITIC method is a type of correlation method. It is used to determine the standard deviations of the criterion values and the criterion contrasts of the paired columns [28]. The CRITIC method consists of five steps, and the steps of the method are as follows [26].
  • Step 1: Creating the Decision Matrix
The decision matrix contains the criterion values corresponding to different alternatives. It is created as in Equation (1).
X = x i j m × n = x 11 x 1 n x m 1 x m n
x i j , is the jth criterion value of alternative i.
  • Step 2: Normalization of Decision Matrix
In the normalization process, (2) is used for maximization-oriented criteria and (3) for minimization-oriented criteria.
r i j = x i j x j m i n x j m a x x j m i n
r i j = x j m a x x i j x j m a x x j m i n
  • Step 3: Creating the Relationship Coefficient Matrix
The relationship coefficients ( ρ j k ) used to measure the degree of relationships between the evaluation criteria are calculated as in (4).
ρ j k = i = 1 m r i j r j ¯ . r i k r k ¯ i = 1 m ( r i j r j ¯ ) 2 . i = 1 m ( r i k r k ¯ ) 2   j , k = 1,2 . . n
  • Step 4: Calculating C j Values
C j , which combines both features and expresses the total information contained in criterion j, is calculated using the standard deviation of the column values of the normalized decision matrix. Then, (5) and (6) can be used for these operations.
C j = σ j k = 1 n ( 1 ρ j k ) j = 1,2 n
σ j = i = 1 m ( r i j r j ¯ ) 2 m 1
  • Step 5: Calculation of Criteria Weights
The objective weights of the criteria can be calculated using (7).
W j = c j k = 1 n c k j , k = 1,2 . n
Objective weight values are ranked from largest to smallest. It is concluded that the criterion with the highest weight is more important.

2.2.2. COPRAS Method

The COPRAS (Complex Proportional Assessment) method was first proposed by Zavadskas and Kaklauskas as a multi-criteria decision-making method. The COPRAS method uses a procedure of progressive ranking and evaluation of alternatives in terms of importance and utility [29]. COPRAS is a ranking approach that works with the idea of weighted arithmetic operations, taking into account the nature of the criteria. Due to its simplicity, the method is preferred by many researchers for solving decision problems [30].
The COPRAS method consists of 7 stages. The stages of the method are as follows [29]:
  • Step 1: Creating the Decision Matrix
As in all multi-criteria decision-making problems, the decision matrix is first created. The decision matrix is as follows:
D = A 1 A m x 11 x 1 n x m 1 x m n
  • Step 2: Normalization of the Decision-Making Matrix
A normalization procedure is used to convert the performances of the considered alternatives into comparable dimensionless values. In the COPRAS method, the formula in Equation (9) is used for normalization:
x ~ i j = x i j i = 1 m x i j
where x i j is the performance of the i-th alternative with respect to the j-th criterion, x ~ i j is its normalized value, and m is the number of alternatives.
  • Step 3: Determination of the Weighted Normalized Decision-Making Matrix
After creating the normalized decision-making matrix, the next step is to create the weighted normalized decision-making matrix using the formula in Equation (10):
D = d i j = x i j . w j
  • Step 4. Calculation of Maximization and Minimization Index for Each Alternative
At this stage, each alternative is categorized into maximizing and minimizing indices by Equations (4) and (5):
S i + = j = 1 k d i j   j = 1,2 , . . , k   m a x i m i z i n g   i n d e x
S i = j = k + 1 n d i j   j = k + 1 , k + 2 , n   m i n i m i z i n g   i n d e x
  • Step 5. Calculating the relative weight of each alternative
The relative weight Q i of the ith alternative is calculated by Equation (13):
Q i = S + i + min i S i i = 1 m S i S i i = 1 m min i S i S i
  • Step 6. Prioritizing the alternatives
The priority order of the compared alternatives is determined by their relative weights using Equation (14). The alternative with higher relative weight has higher priority (ranking) and the alternative with the highest weight is the most acceptable alternative.
A = A i   max i Q i
  • Step 7. Calculating the Performance Index ( P i ) Value for Each Alternative
In the last section, the P i values are calculated using Equation (15):
P i = Q i Q m a x 100 %
The 100 ranked alternatives are the best. These alternatives are ranked from largest to smallest.

3. Results

In this study examining the renewable energy utilization performance of 38 countries with 13 variables for the years 2018–2022, the countries were first clustered according to their similar attributes with the K-means algorithm. In total, 13 different variables belonging to the countries were weighted with the CRITIC method from the MCDM methods, and then the countries within each cluster group were ranked with the COPRAS method. Since there were not enough data for Iceland and Israel in 2022, these countries were excluded from the analysis, and the analysis was performed for 36 countries.
Refs. [1,6,11] conducted their studies for EU countries and OPEC countries. In this study, the analysis was carried out for OECD countries. Refs. [4,13,14] utilized MCDM methods for analysis in their studies. In this study, both cluster analysis and MCDM methods were used to analyze the performance of the selected country group. There are not many studies in the literature that apply cluster analysis and MCDM methods together for the OECD country aggregate. Due to these aspects, the study is considered to be unique in this sense.

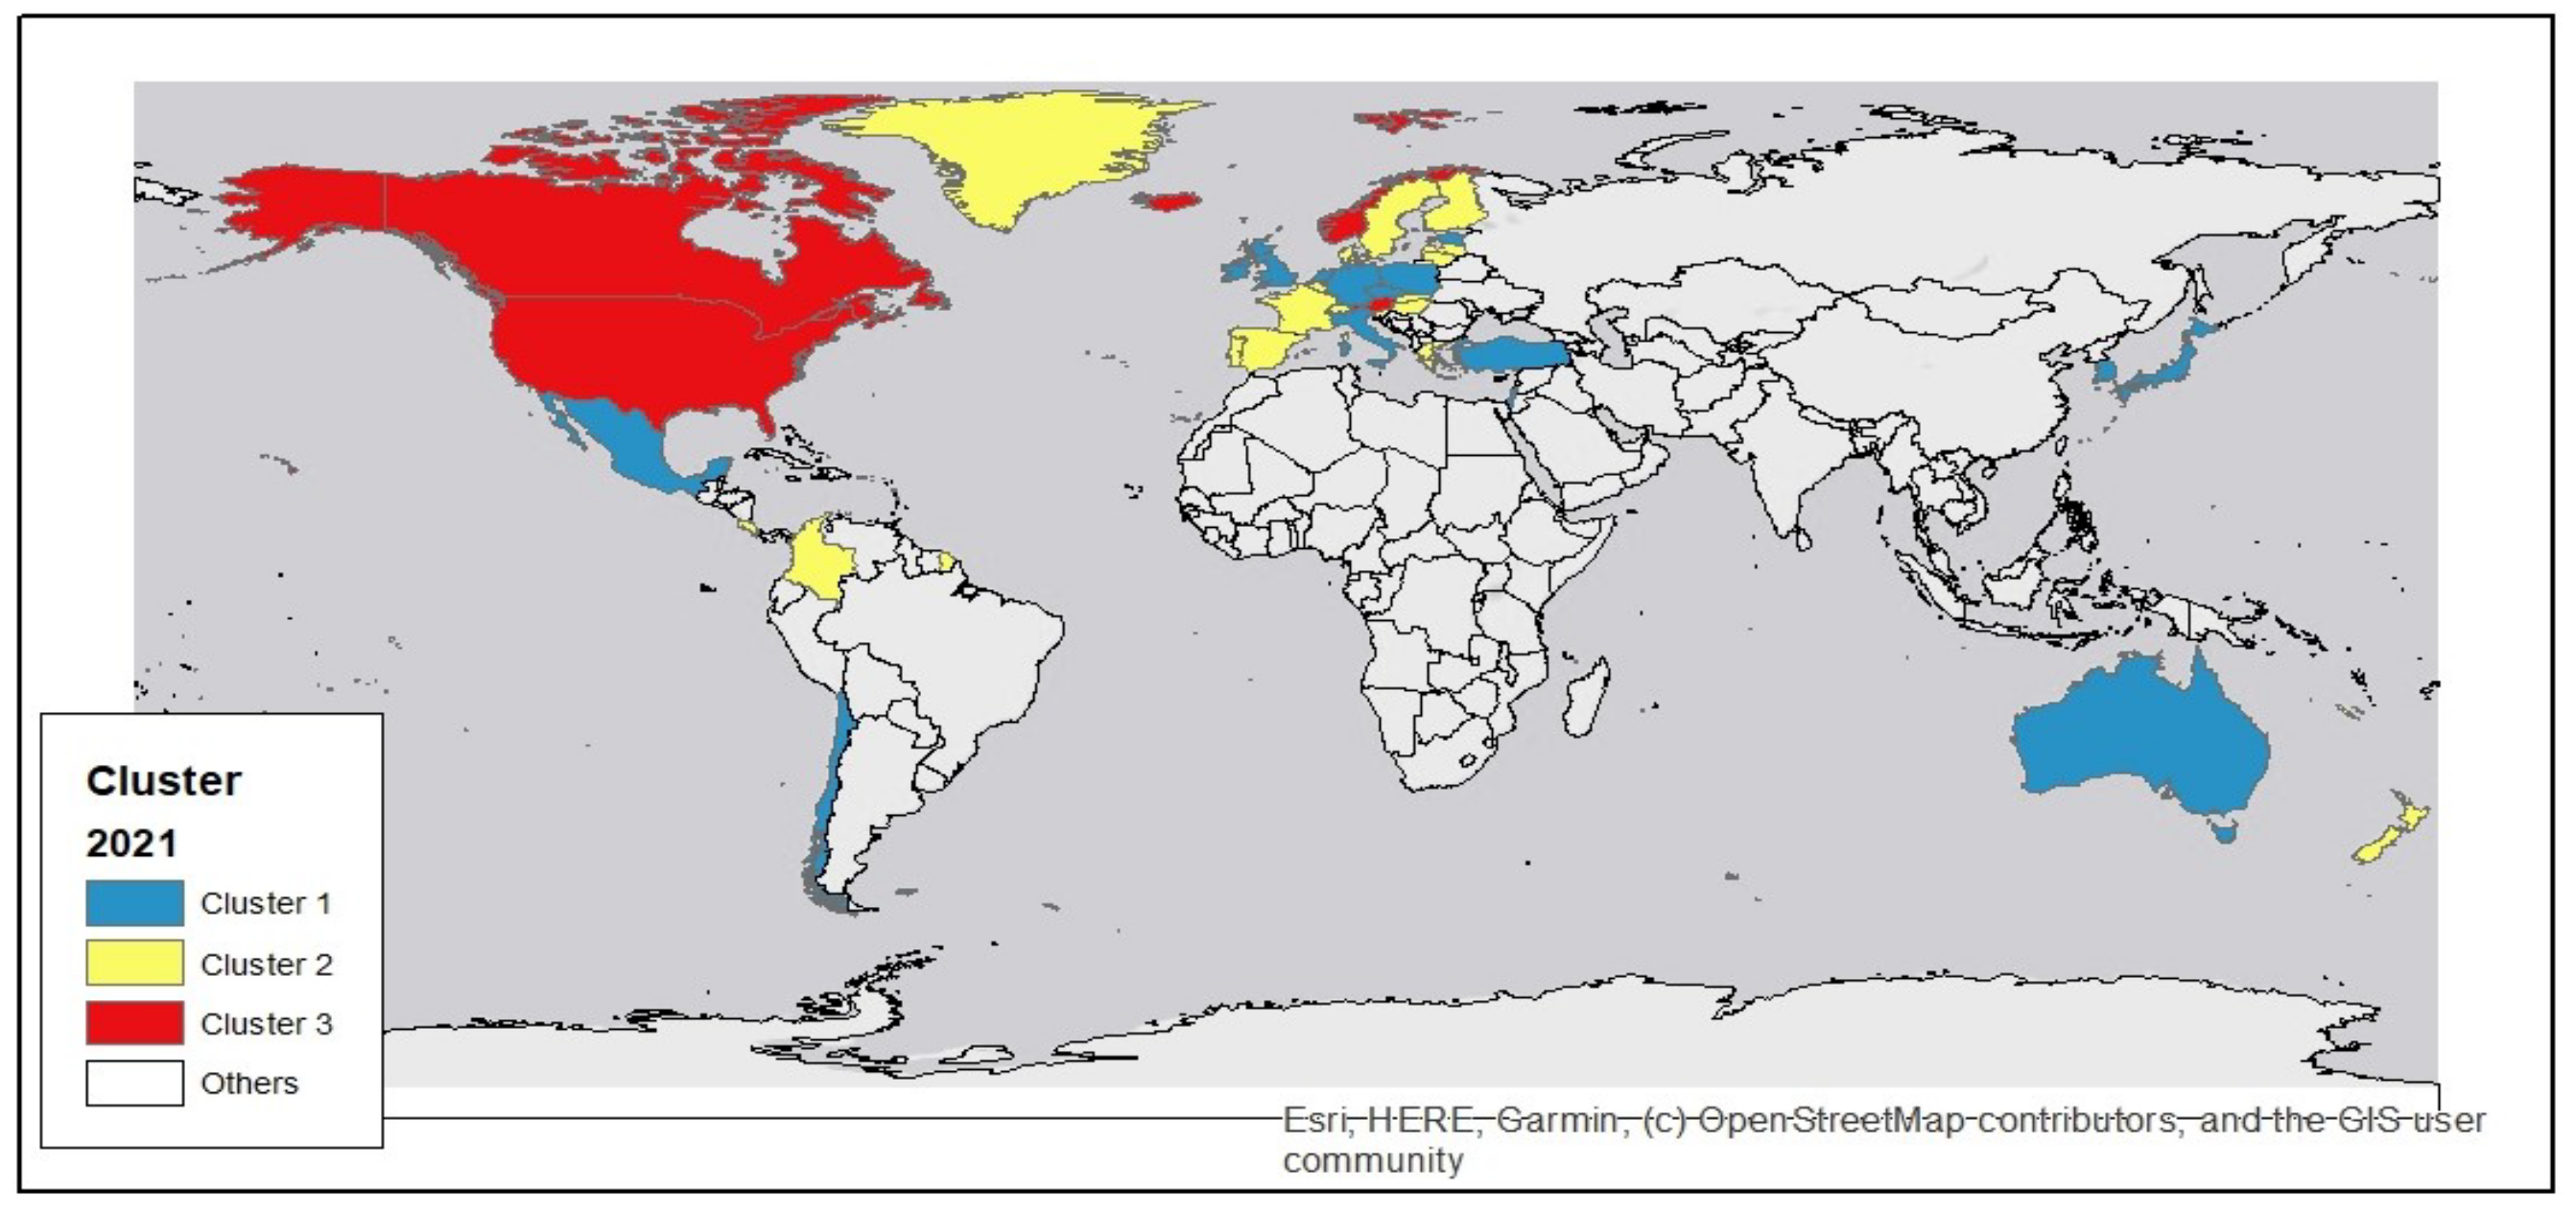
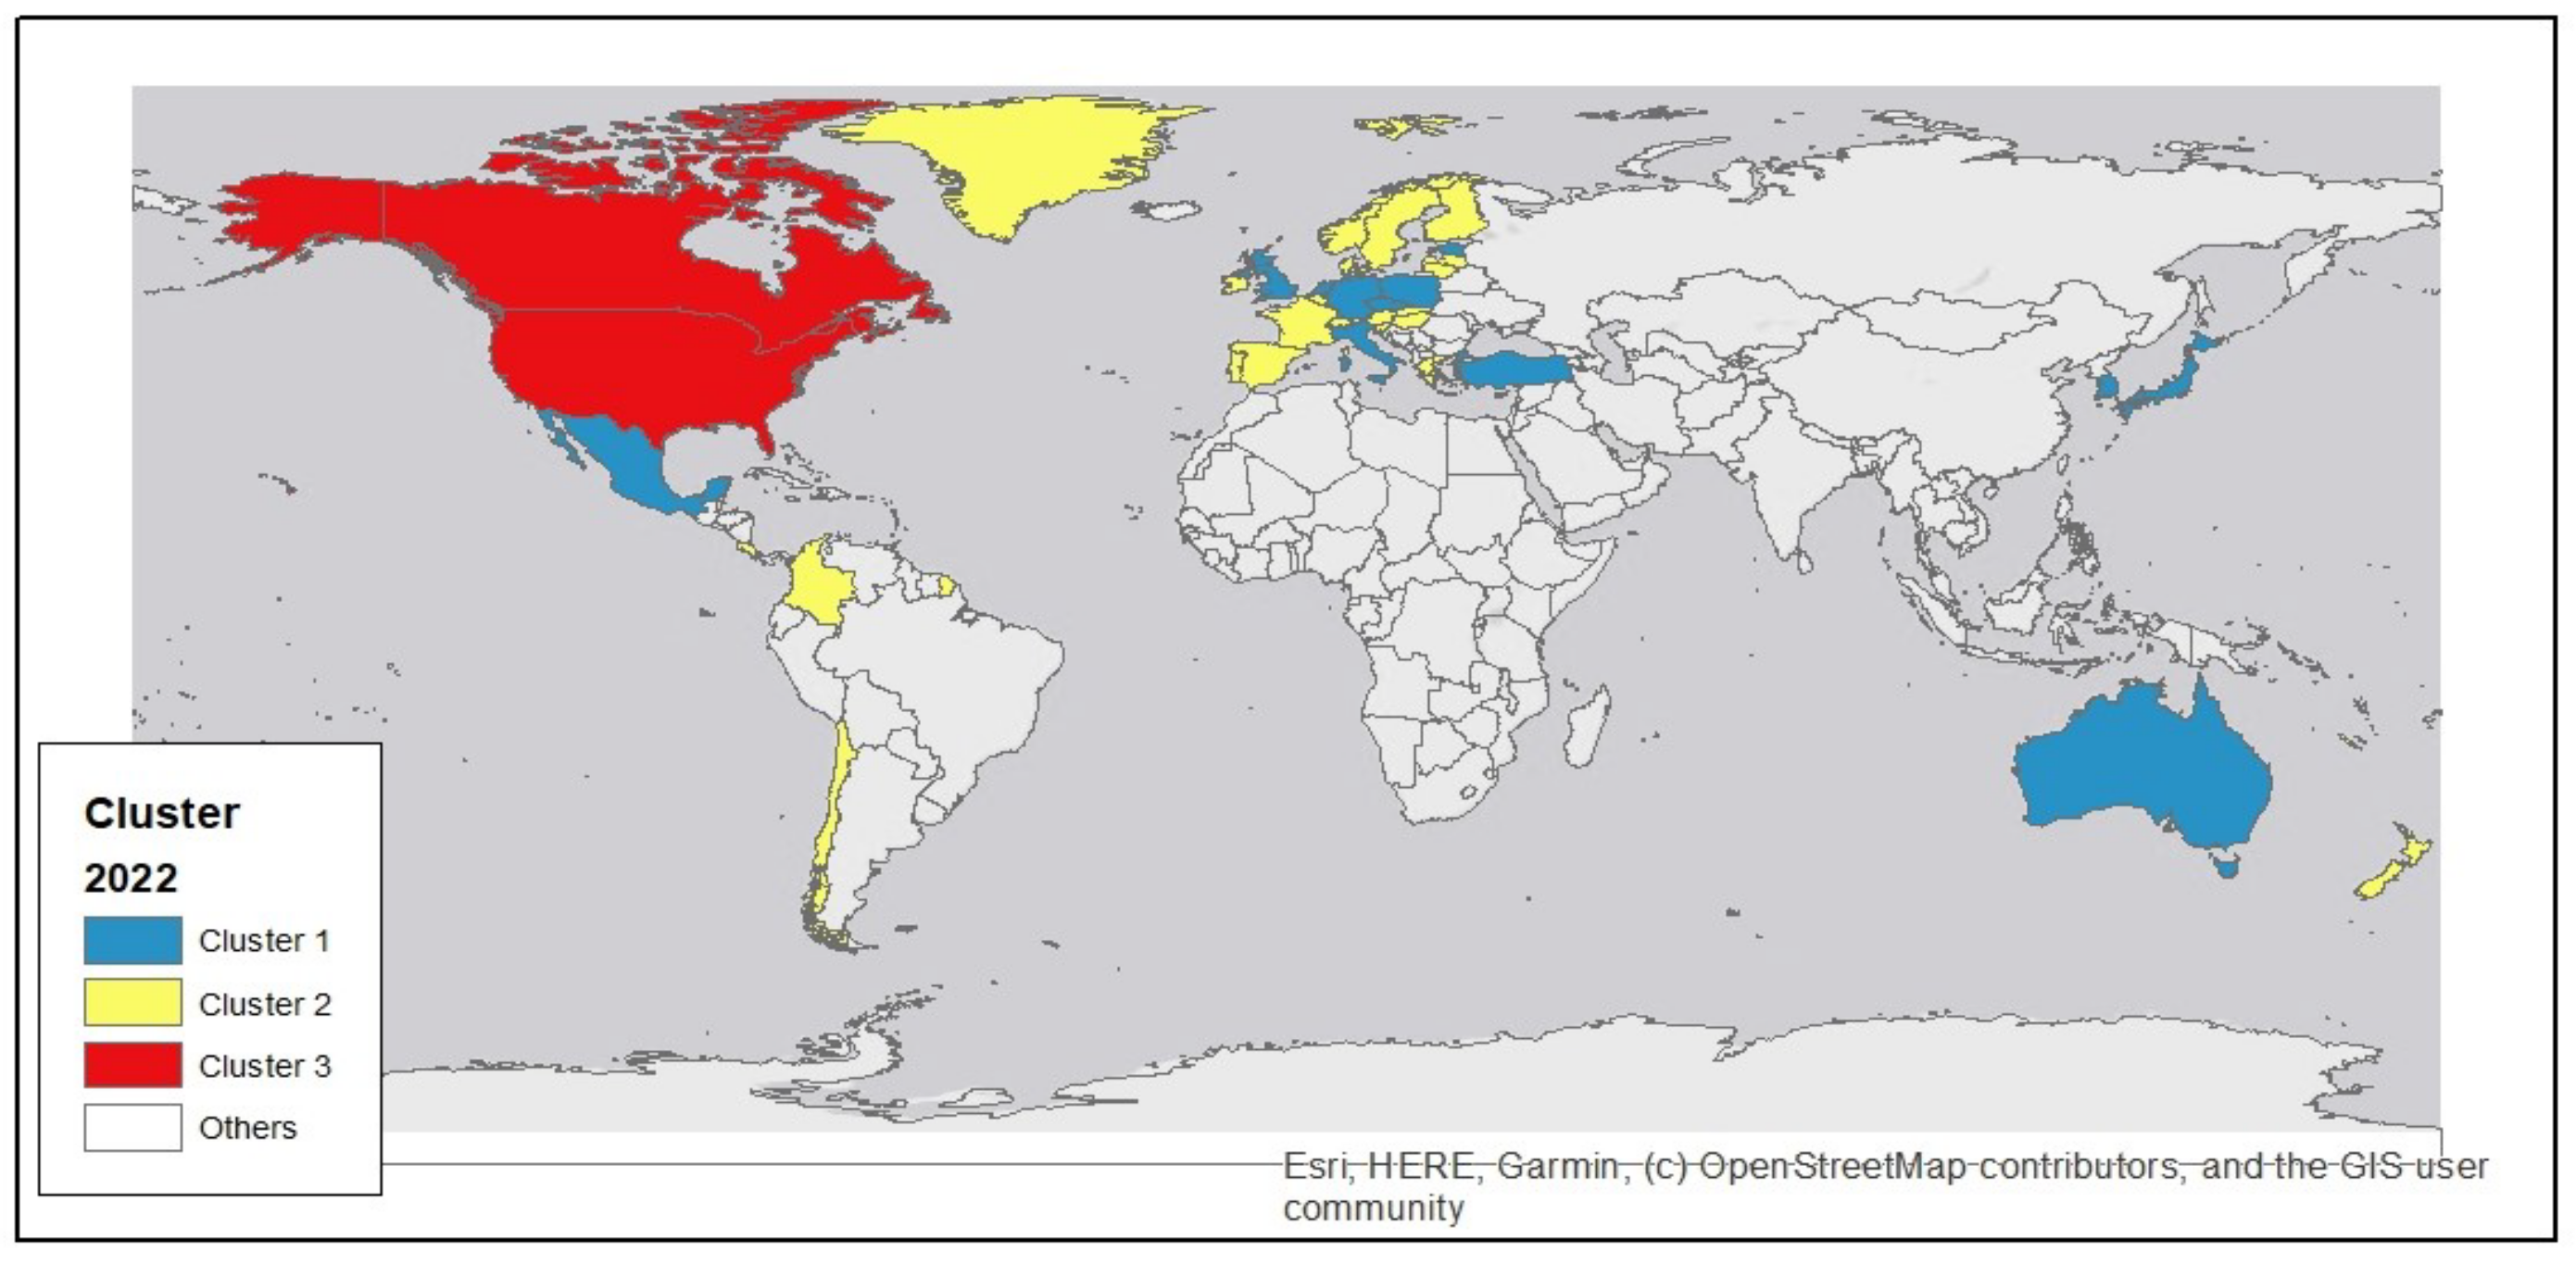
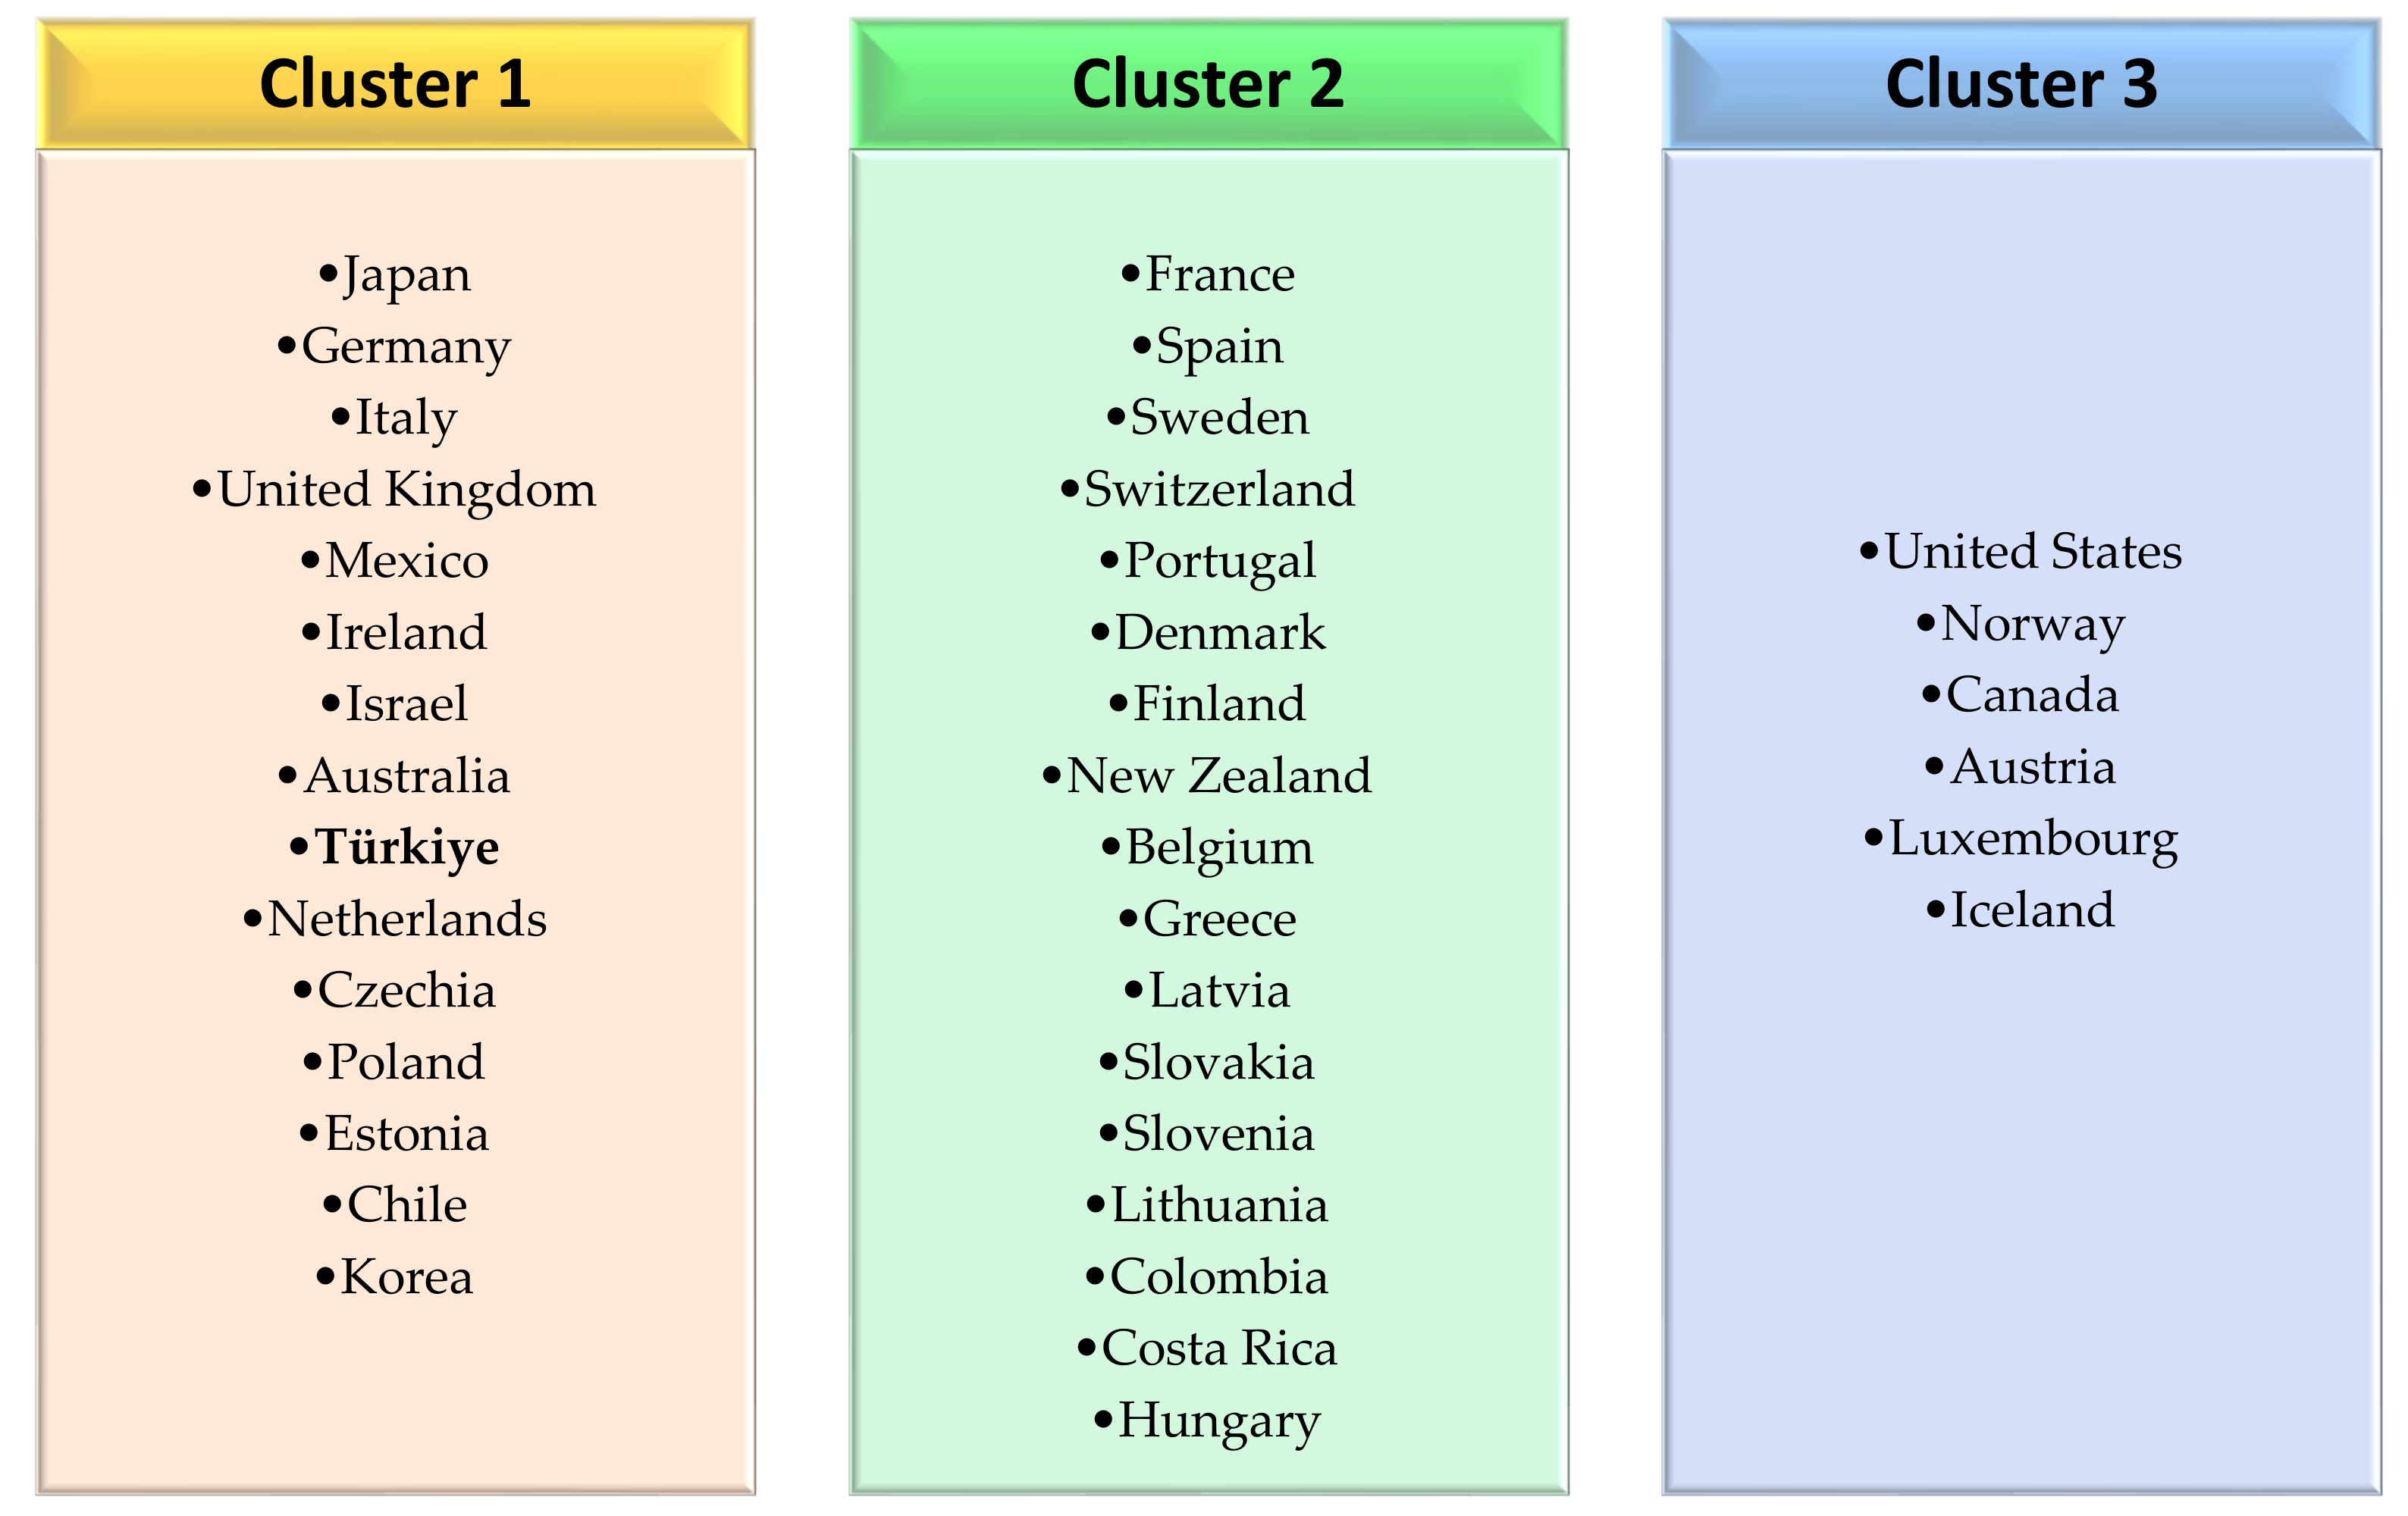
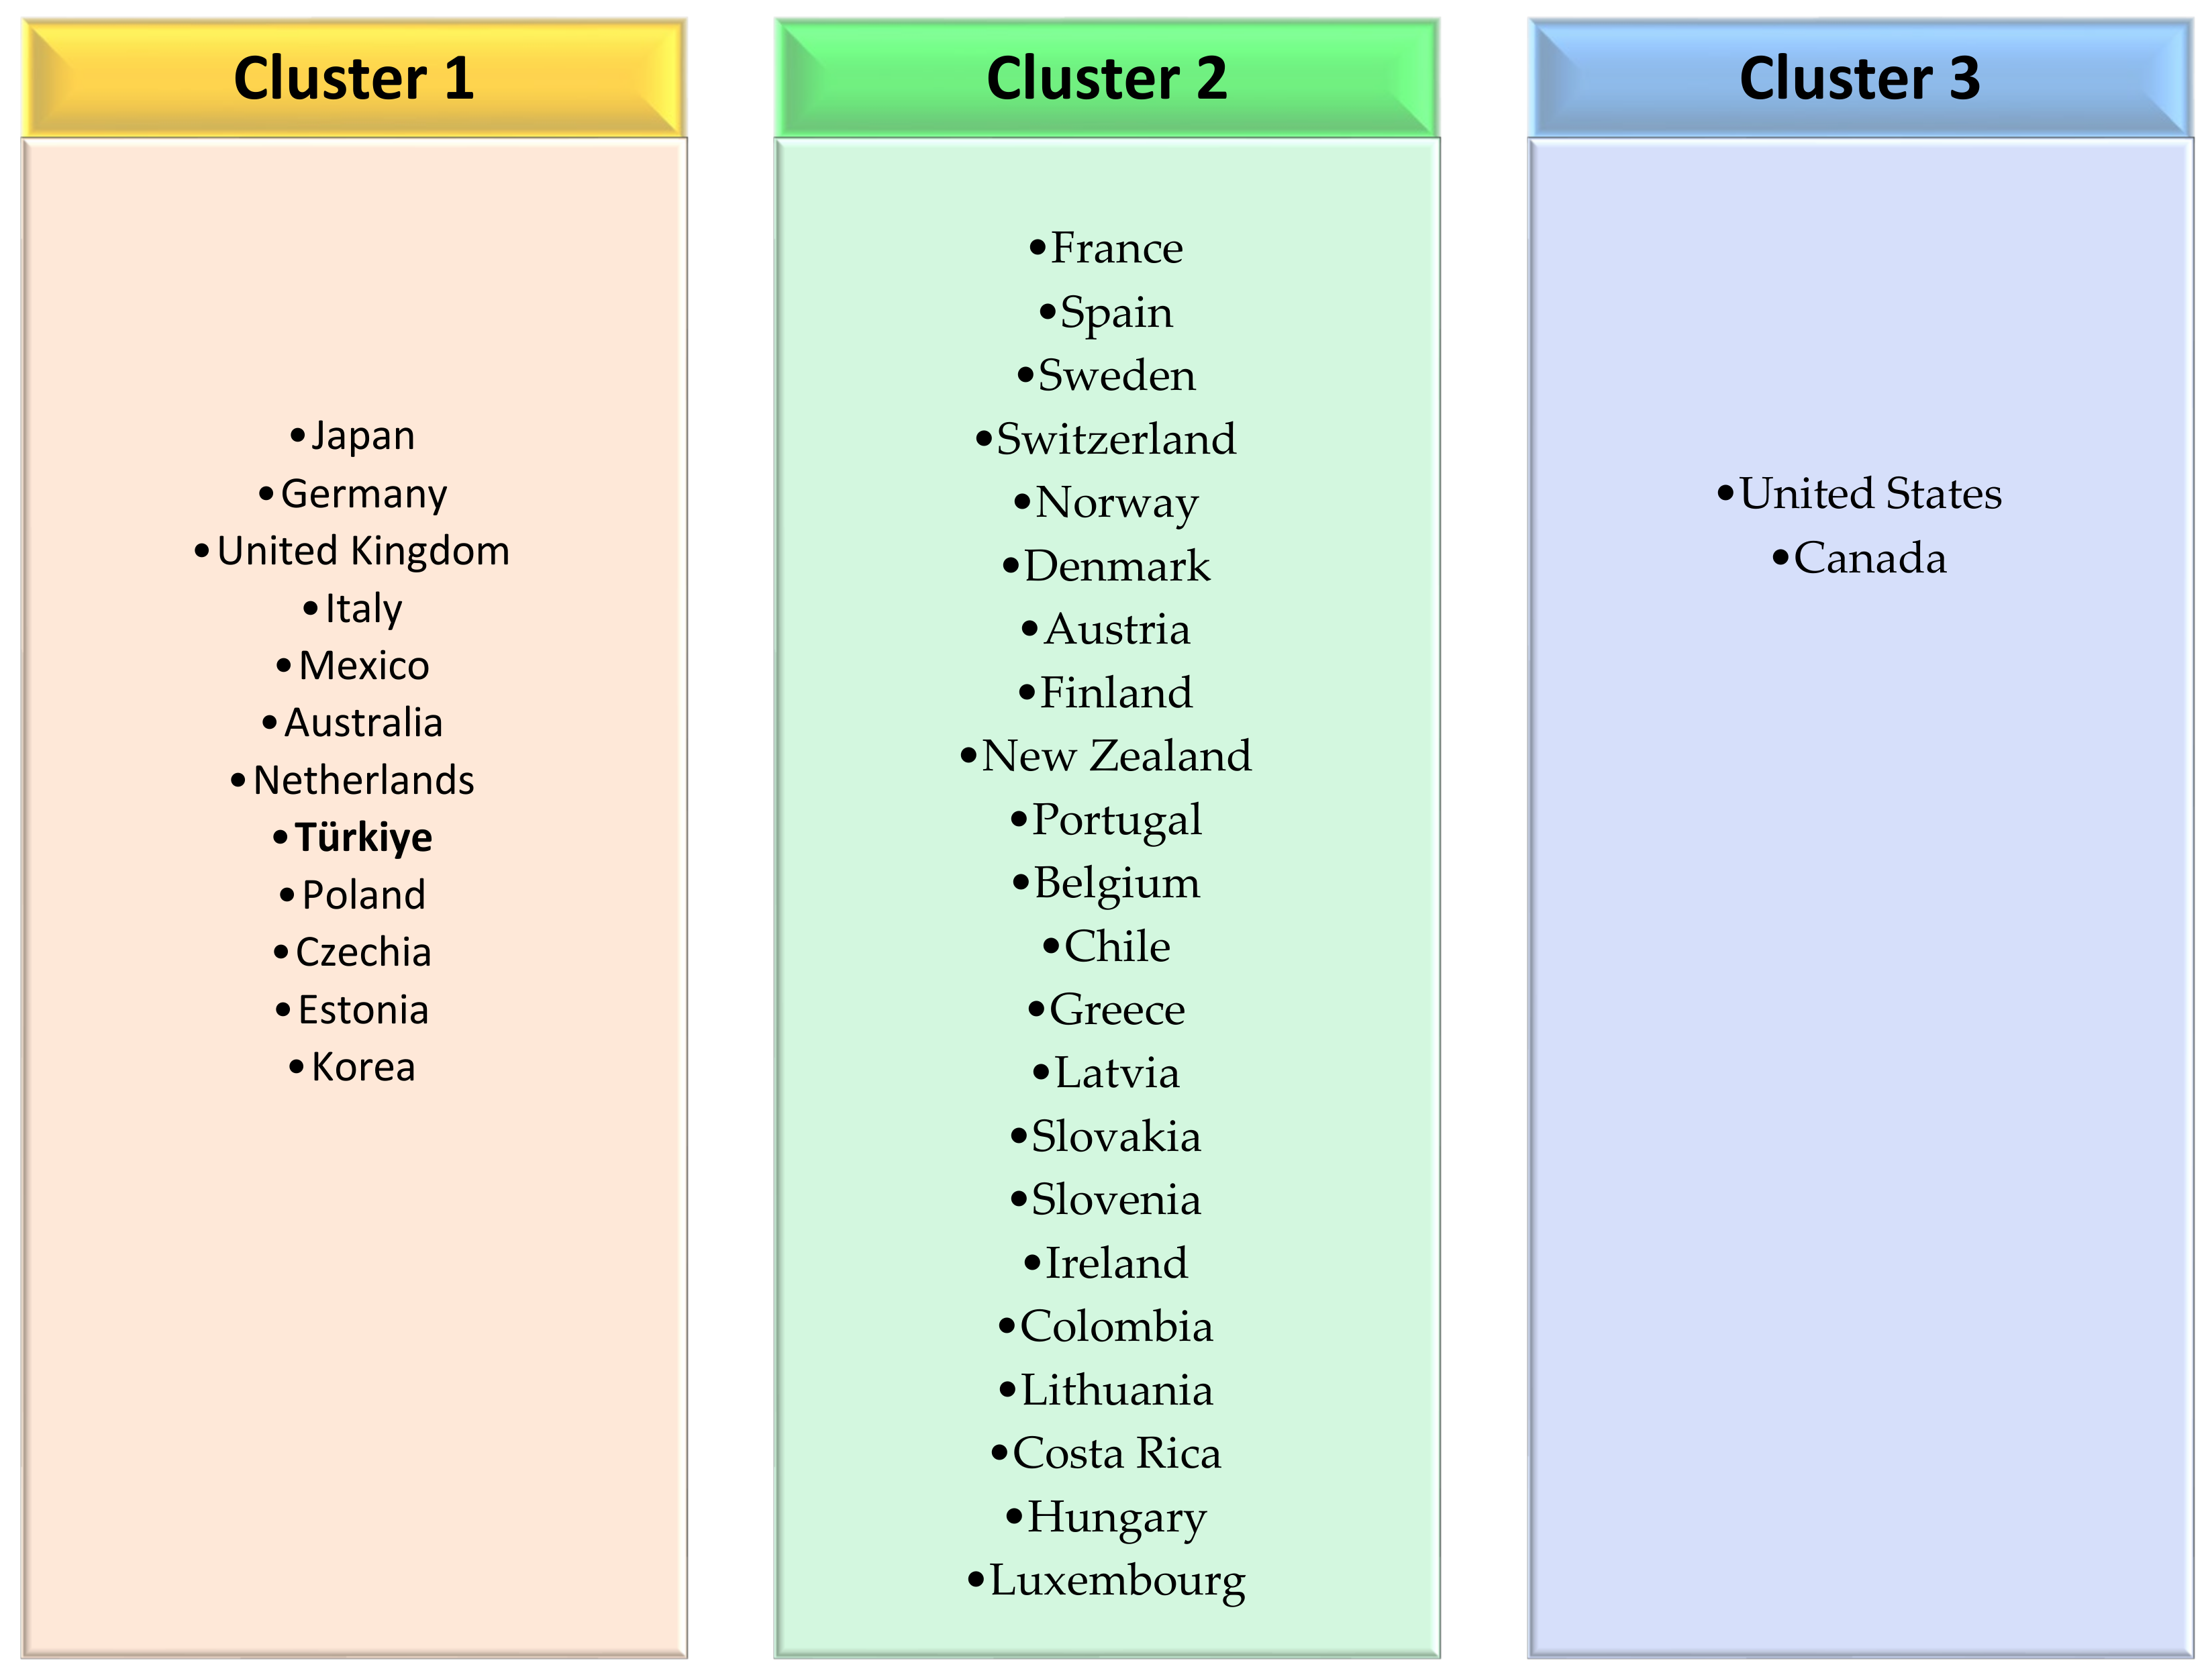
3.1. Cluster Analysis with K-Means Algorithm

From the 2018 data, the clustering of countries with the K-means algorithm was realized as shown in Figure 2. The first cluster consists of four countries including the United States, Germany, Australia, and Japan. The second cluster consists of 13 countries including France, Sweeden, Switzerland, and Norway. The last cluster consists of 21 countries, including Canada, the United Kingdom, Italy, and Spain. Türkiye is in the third cluster, which includes Canada, the United Kingdom, Italy, and Spain.
The clustering of countries with the K-means algorithm from the data of 2019 was realized as in Figure 3. The first cluster consists of 14 countries including countries such as Italy, Greece, and Mexico. The second cluster consists of 19 countries including countries such as the United Kingdom, France, Spain, and Sweden. The last cluster includes five countries consisting of the United States, Germany, Austria, Canada, and Japan. Türkiye is included in the first cluster including countries such as Italy, Greece, and Mexico.
The clustering of countries with the 2020 data performed with the K-means algorithm is as shown in Figure 4. The first cluster consists of 13 countries including Italy, Greece, and Mexico. The second cluster consists of 19 countries including France, Spain, and Sweden. The last cluster includes six countries including the United States, Germany, the United Kingdom, Canada, Austria, and Japan. Türkiye is included in the first cluster including Italy, Greece, and Mexico.
From the 2021 data, the clustering of countries with the K-means algorithm was realized as shown in Figure 5. The first cluster consists of 15 countries including Japan, Germany, and Italy. The second cluster consists of 17 countries including France, Spain, Sweden, and Switzerland. The last cluster consists of six countries including the United States, Norway, Canada, and Austria. Türkiye is in the first cluster, which includes countries such as Japan, Germany, and Italy.
From the 2022 data, the clustering of countries with the K-means algorithm was realized as shown in Figure 6. The first cluster consists of 12 countries including Japan, Germany, and the United Kingdom. The second cluster consists of 22 countries including France, Spain, and Sweden. The last cluster consists of the United States and Canada. Türkiye is in the first cluster, which includes countries such as Japan, Germany, and the United Kingdom.

3.2. Weighting with the CRITIC Method

The 2018 performance criteria weights calculated using 13 different variables and the CRITIC method, an MCDM technique, are shown in Table 2. As seen in Table 2, the weighting coefficients of electricity from wind, electricity from hydro sources, consumer price index, and per capita energy use are higher for the first cluster, while the weighting coefficients of employment-to-population ratio, purchasing power parities and exchange rates, CO2 emissions, and carbon intensity of electricity are higher for the second cluster. The weighting coefficients of electricity from solar sources, other renewables including bioenergy, population, labor force, and GDP indicators are higher for the third cluster compared to other clusters. There are significant differences between the criteria weights of all three clusters.
The 2019 performance criteria weights are shown in Table 3. The weighting coefficients of population, labor force, GDP, and consumer price index are higher for the first cluster, while the weighting coefficients of electricity from wind, other renewables including bioenergy, employment-to-population ratio, purchasing power parities and exchange rates, and per capita energy use are higher for the second cluster. The weighting coefficients of electricity from hydro sources, electricity from solar sources, CO2 emissions, and carbon intensity of electricity indicators are higher for the third cluster compared to other clusters. There are significant differences between the criteria weights of all three clusters.
Table 4 shows the performance criteria weights for 2020. The weighting coefficients of electricity from wind, labor force, GDP, purchasing power parities and exchange rates, and consumer price index are higher for the first cluster, while the weighting coefficients of employment-to-population ratio, population, and per capita energy use are higher for the second cluster. The weighting coefficients of electricity from hydro sources, electricity from solar sources, other renewables including bioenergy, CO2 emissions, and carbon intensity of electricity indicators are higher for the third cluster compared to other clusters. There are significant differences between the criteria weights of all three clusters.
The performance criterion weights for 2021 are shown in Table 5. While the weighting coefficients of electricity from hydro sources, electricity from solar sources, employment, population, and consumer price index indicators are higher for the first cluster, the weighting coefficients of the labor force, purchasing power parities and exchange rates, and per capita energy use indicators are higher for the second cluster. The weighting coefficients of electricity from wind, other renewables including bioenergy, GDP, CO2 emissions, and carbon intensity of electricity indicators are higher for the third cluster compared to the other clusters. It can be seen that there are significant differences between the criteria weights of all three clusters.
The weights of the performance criteria for 2022 are shown in Table 6. While the weighting coefficients of electricity from solar sources, employment, population, and GDP indicators are higher for the first cluster, the weighting coefficients of the labor force, purchasing power parities and exchange rates, and per capita energy use indicators are higher for the second cluster. The weighting coefficients of electricity from wind, electricity from hydro sources, other renewables including bioenergy, consumer price index, CO2 emissions, and carbon intensity of electricity indicators are higher for the third cluster compared to the other clusters. It can be seen that there are significant differences between the criteria weights of all three clusters.

3.3. Ranking with COPRAS Method

Given the complex nature of planning and strategy development problems and the fact that they often contain contradictory criteria, MCDM methods have been widely used in this field [2]. In this study, 38 OECD countries, whose criteria were weighted within their cluster group with the CRITIC method, were ranked with the COPRAS method.
According to the weights of the criteria of the study period determined by the CRITIC method, the ranking of the country performance for 2018 calculated by the COPRAS method was carried out as shown in Figure 7. In the first cluster, which includes countries such as Germany, Australia, and Japan, the USA ranked first in terms of renewable energy use performance, while in the second cluster, which includes countries such as Sweden, Switzerland, Norway, Chile, and France, ranked first in terms of performance. In the third cluster, Canada ranked first among countries such as the United Kingdom, Italy, and Spain. In the same cluster, Türkiye ranked sixth in terms of renewable energy resource utilization performance.
The ranking of country performance for 2019 is as shown in Figure 8. In the first cluster, including countries such as Türkiye, Greece, and Mexico, Italy ranked first in terms of renewable energy use performance. In the same cluster, Türkiye ranked second in terms of renewable energy resource use performance. In the second cluster, including countries such as France, Spain, Sweden, and Switzerland, the United Kingdom ranked first in terms of performance. In the third cluster, it ranked first among countries such as the USA, Germany, and Austria.
The ranking of country performance for 2020 is as shown in Figure 9. In the first cluster, which includes countries such as Greece, Türkiye, and Mexico, Italy ranked first in terms of renewable energy use performance. In the same cluster, Türkiye ranked third in terms of renewable energy resource use performance. In the second cluster, which includes countries such as France, Spain, Sweden, and Switzerland, France ranked first in terms of performance. In the third cluster, it ranked first among countries such as the USA, Germany, and the United Kingdom.
For 2021, the ranking of country performance was realized as shown in Figure 10. In the first cluster, which includes countries such as Germany, Italy, and the United Kingdom, Japan ranked first in terms of renewable energy utilization performance. In the same cluster, Türkiye ranked ninth in terms of renewable energy resource utilization performance. In the second cluster, which includes countries such as Spain, Sweeden, and Switzerland, France ranked first in terms of performance, while in the third cluster, it ranked first among countries such as the USA, Norway, and Canada.
The ranking of 2022 country performance was realized as shown in Figure 11. In the first cluster, which includes countries such as Germany, Italy, and the United Kingdom, Japan ranked first in terms of renewable energy utilization performance. In the same cluster, Türkiye ranked ninth in terms of renewable energy resource utilization performance. In the second cluster, which includes countries such as Spain, Sweeden, and Switzerland, France ranked first in terms of performance, while in the third cluster, it ranked first among countries such as the USA, Norway, and Canada.
The variables selected by the CRITIC and COPRAS methods were evaluated by cluster analysis in OECD countries. Each variable was weighted using the CRITIC method, and countries were ranked using the COPRAS method. Thus, it was determined which country assigned how much weight to which variable, and a cluster analysis was conducted for all countries by year. Due to the fact that some countries assign more importance to the selected variables compared to other countries, variable weights were higher in some country groups as a result of the CRITIC method. Since the importance assigned by the countries to the variables also varies according to the year, the country rankings contain differences.

4. Conclusions

Energy, environment, and sustainability are intertwined concepts. Humankind’s use of the world’s resources as if they were unlimited while ensuring its own prosperity causes permanent environmental damage to the world. The limitation of resources and the permanent damage caused to the environment by their unconscientious use has been a topic of discussion for years.
Problems such as increasing energy resource requirements, climate change issues, and the use of natural resources and their transfer to future generations have led academics, companies, and countries to seek new solutions. In this sense, the use of renewable energy sources is one of these solutions.
Energy is one of the important indicators for a sustainable country. In order to ensure sustainable development in a country, it is necessary to have abundant energy resources that are cost-effective and do not cause negative consequences. As in all countries of the world, Turkey’s energy needs are increasing with its growing population and industrialization. Energy consumption in Turkey is expected to increase by more than 100% in 2030 compared to today. Therefore, Turkey’s adaptation to renewable energy sources is of great importance within the framework of sustainable development.
According to the data of the Ministry of Energy and Natural Resources, Turkey’s electrical energy consumption increased by 1.2% compared to the previous year and reached 335.2 TWh in 2023, while electricity production increased by 0.8% compared to the previous year and reached 331.1 TWh. In 2023, 36.2% of Turkey’s electricity production was obtained from coal, 21% from natural gas, 19.3% from hydraulic energy, 10.3% from wind, 6.7% from solar energy, 3.4% from geothermal energy, and 3.2% from other sources. As of the end of September 2024, Turkey’s installed capacity reached 114,215 MW. The distribution of installed capacity by resources as of the end of September 2024 is as follows: 28.2% is hydraulic energy, 21.6% is natural gas, 19.2% is coal, 10.8% is wind, 16.4% is solar, 1.5% is geothermal, and 2.4% comes from other resources.
On 14 July 2021, following the ‘Fit for 55’ package, published by the European Commission, green transformation and net-zero issues started to be discussed intensively in Turkey. According to the SHURA Energy Transition Center’s report, “2053 Net Zero: A Roadmap for Turkey’s Electricity Sector” report by the SHURA Energy Transition Center, the share of renewable energy in total installed capacity increased to 55% by the end of 2023. According to this indicator, Turkey ranks 5th in Europe and 12th in the world. Both the figures published in the report and the findings of this study suggest that the Turkish electricity system is already in the process of a successful transition to low-carbon technologies. The analysis of the economic, social, and environmental criteria considered in the study period 2018–2022 shows that Turkey’s performance in terms of renewable energy policies is similar to many developed countries of the world.
The “2053 Net Zero: A Roadmap for Turkey’s Electricity Sector” report focuses on the role of the electricity sector in Turkey’s transition to a fully decarbonized energy system. While emphasizing the need to decarbonize electricity generation in Turkey, a roadmap was created. According to the “Net Zero 2053” scenario in the report, Turkey’s energy demand is expected to rise until 2030 due to increased economic activity, and then begin to decline in the following period, despite economic growth and increased social welfare, due to the impact of electrification and energy efficiency. By 2053, according to this report, it will be close to 2020 levels (approximately 1200 TWh). In 2025, Turkey’s total carbon emissions are projected to peak at 417 million tons. In 2035, it is estimated that the electricity generation of coal-fired power plants will not remain in the system, reducing total carbon emissions by 37.2% compared to 2025 emission levels. As in previous studies [1,3,10], this study shows that the largest share of this reduction will be in the electricity sector, which is transitioning from fossil fuels to renewable energy.
In this study, cluster analysis and MCDM methods were used to evaluate the orientation of OECD countries towards renewable energy sources. The variables used in the analysis part of the study were determined within the scope of sustainability. Renewable energy resource utilization and sustainability are intertwined concepts for countries. The results of this study evaluated the adaptation process of 38 countries to renewable resources and, thus, their performance in sustainable development. The resulting rankings and variable weights are intended to guide countries in terms of performance evaluation in this adaptation process. While refs. [1,6,11,20] conducted their studies for EU countries and OPEC countries, refs. [2,3,5,7,8,9,10,15,17,18,19,23] conducted their analyses in Iran, Turkey, Pakistan, Taiwan, China, China, Poland, the USA, Portugal, and Tunisia. Refs. [4,13,14] utilized MCDM methods for analysis in their studies. In future studies, analyses can be extended to countries other than OECD countries or be repeated with different methods. In this context, we hope that this study will guide future studies in the same or different fields.

Author Contributions

Conceptualization, A.Z.F. and E.S.; methodology, A.Z.F. and E.S.; investigation, A.Z.F. and E.S.; data curation, E.S.—original draft preparation, A.Z.F. and E.S. writing—review and editing, A.Z.F. and E.S.; supervision, A.Z.F.; project administration, A.Z.F. and E.S. All authors have read and agreed to the published version of the manuscript.

Funding

This research received no external funding.

Institutional Review Board Statement

Not applicable.

Informed Consent Statement

Not applicable.

Data Availability Statement

The raw data supporting the conclusions of this article will be made available by the authors on request.

Conflicts of Interest

The authors declare no conflicts of interest.

References

  1. Brodny, J.; Tutak, M. Assessing the energy security of European Union countries from two perspectives—A new integrated approach based on MCDM methods. Appl. Energy 2023, 347, 121443. [Google Scholar] [CrossRef]
  2. Almutairi, K.; Hosseini Dehshiri, S.J.; Hosseini Dehshiri, S.S.; Mostafaeipour, A.; Hoa, A.X.; Techato, K. Determination of optimal renewable energy growth strategies using SWOT analysis, hybrid MCDM methods, and game theory: A case study. Int. J. Energy Res. 2022, 46, 6766–6789. [Google Scholar] [CrossRef]
  3. Çolak, M.; Kaya, İ. Prioritization of renewable energy alternatives by using an integrated fuzzy MCDM model: A real case application for Turkey. Renew. Sustain. Energy Rev. 2017, 80, 840–853. [Google Scholar] [CrossRef]
  4. Aytekin, A. Energy, environment, and sustainability: A multi-criteria evaluation of countries. Strateg. Plan. Energy Environ. 2022, 41, 281–316. [Google Scholar] [CrossRef]
  5. Büyüközkan, G.; Karabulut, Y.; Mukul, E. A novel renewable energy selection model for United Nations’ sustainable development goals. Energy 2018, 165, 290–302. [Google Scholar] [CrossRef]
  6. Faraji Abdolmaleki, S.; Esfandiary Abdolmaleki, D.; Bello Bugallo, P.M. Finding sustainable countries in renewable energy sector: A case study for an EU energy system. Sustainability 2023, 15, 10084. [Google Scholar] [CrossRef]
  7. Ishfaq, S.; Ali, S.; Ali, Y. Selection of optimum renewable energy source for energy sector in Pakistan by using MCDM approach. Process Integr. Optim. Sustain. 2018, 2, 61–71. [Google Scholar] [CrossRef]
  8. Kabak, M.; Daǧdeviren, M. Prioritization of renewable energy sources for Turkey by using a hybrid MCDM methodology. Energy Convers. Manag. 2014, 79, 25–33. [Google Scholar] [CrossRef]
  9. Lee, H.C.; Chang, C.T. Comparative analysis of MCDM methods for ranking renewable energy sources in Taiwan. Renew. Sustain. Energy Rev. 2018, 92, 883–896. [Google Scholar] [CrossRef]
  10. Li, T.; Li, A.; Guo, X. The sustainable development-oriented development and utilization of renewable energy industry—A comprehensive analysis of MCDM methods. Energy 2020, 212, 118694. [Google Scholar] [CrossRef]
  11. Ecer, F.; Pamucar, D.; Hashemkhani Zolfani, S.; Keshavarz Eshkalag, M. Sustainability assessment of OPEC countries: Application of a multiple attribute decision making tool. J. Clean. Prod. 2019, 241, 118324. [Google Scholar] [CrossRef]
  12. Atmaca, E.; Basar, H.B. Evaluation of power plants in Turkey using analytic network process (ANP). Energy 2012, 44, 555–563. [Google Scholar] [CrossRef]
  13. Ishizaka, A.; Siraj, S.; Nemery, P. Which energy mix for the UK (United Kingdom)? An evolutive descriptive mapping with the integrated GAIA (graphical analysis for interactive aid)-AHP (analytic hierarchy process) visualization tool. Energy 2016, 95, 602–611. [Google Scholar] [CrossRef]
  14. Streimikiene, D.; Balezentis, T.; Krisciukaitien, I.; Balezentis, A. Prioritizing sustainable electricity production technologies: MCDM approach. Renew. Sustain. Energy Rev. 2012, 16, 3302–3311. [Google Scholar] [CrossRef]
  15. Ertay, T.; Kahraman, C.; Kaya, I. Evaluation of renewable energy alternatives using MACBETH and fuzzy AHP multicriteria methods: The case of Turkey. Technol. Econ. Dev. Econ. 2013, 19, 38–62. [Google Scholar] [CrossRef]
  16. Kaya, T.; Kahraman, C. Multicriteria renewable energy planning using an integrated fuzzy VIKOR & AHP methodology: The case of Istanbul. Energy 2010, 35, 2517–2527. [Google Scholar] [CrossRef]
  17. Chomać-Pierzecka, E.; Sobczak, A.; Sobo’n, D. The Potential and Development of the Geothermal Energy Market in Poland and the Baltic States—Selected Aspects. Energies 2022, 15, 4142. [Google Scholar] [CrossRef]
  18. Menegaki, A.N.; Tiwari, A.K. The index of sustainable economic welfare in the energy-growthnexus for American countries. Ecol. Indic. 2017, 72, 494–509. [Google Scholar]
  19. Pestana, D.G.; Rodrigues, S.; Morgado-Dias, F. Environmental and economic analysis of solar systems in Madeira, Portugal. Util. Policy 2018, 55, 31–40. [Google Scholar]
  20. Ślusarczyk, B.; Żegleń, P.; Kluczek, A.; Nizioł, A.; Górka, M. The Impact of Renewable Energy Sources on the Economic Growth of Poland and Sweden Considering COVID-19 Times. Energies 2022, 15, 332. [Google Scholar] [CrossRef]
  21. Amri, F. Intercourse across economic growth, trade and renewable energy consumption in developing and developed countries. Renew. Sustain. Energy Rev. 2017, 69, 527–534. [Google Scholar]
  22. Andrei, J.V.; Mieila, M.; Panait, M. The impact and determinants of the energy paradigm on economic growth in European Union. PLoS ONE 2017, 12, e0173282. [Google Scholar] [CrossRef]
  23. Jebli, M.B.; Youssef, S.B. The environmental Kuznets curve, economic growth, renewable and non-renewable energy, and trade in Tunisia. Renew. Sustain. Energy Rev. 2015, 47, 173–185. [Google Scholar]
  24. Lund, B.; Ma, J. A review of cluster analysis techniques and their uses in library and information science research: K-means and k-medoids clustering. Perform. Meas. Metr. 2021, 22, 161–173. [Google Scholar] [CrossRef]
  25. Al-Wakeel, A.; Wu, J. K-means based cluster analysis of residential smart meter measurements. Energy Procedia 2016, 88, 754–760. [Google Scholar] [CrossRef]
  26. Diakoulaki, D.; Mavrotas, G.; Papayannakis, L. Determining objective weights in multiple criteria problems: The critic method. Comput. Ops. Res. 1995, 22, 763–770. [Google Scholar]
  27. Ayçin, E. Personel seçim sürecinde CRITIC ve MAIRCA yöntemlerinin kullanılması. Bus. J. 2020, 1, 1–12. [Google Scholar]
  28. Pamucar, D.; Žižović, M.; Đuričić, D. Modification of the critic method using fuzzy rough numbers. Decis. Mak. Appl. Manag. Eng. 2022, 5, 362–371. [Google Scholar] [CrossRef]
  29. Organ, A.; Engin Yalçın, A.; Ass, R. Performance evaluation of research assistants by Copras method. Eur. Sci. J. 2016, 12, 102–109. [Google Scholar]
  30. Venkata Ramana, K.N.S.; Krishankumar, R.; Trzin, M.S.; Amritha, P.P.; Pamucar, D. An integrated variance-COPRAS approach with nonlinear fuzzy data for ranking barriers affecting sustainable operations. Sustainability 2022, 14, 1093. [Google Scholar] [CrossRef]
Figure 1. The research methodology.
Applsci 15 01575 g001
Figure 2. Cluster analysis of countries in 2018.
Applsci 15 01575 g002
Figure 3. Cluster analysis of countries in 2019.
Applsci 15 01575 g003
Figure 4. Cluster analysis of countries in 2020.
Applsci 15 01575 g004
Figure 5. Cluster analysis of countries in 2021.
Applsci 15 01575 g005
Figure 6. Cluster analysis of countries in 2022.
Applsci 15 01575 g006
Figure 7. Ranking of countries using the COPRAS method—2018.
Applsci 15 01575 g007
Figure 8. Ranking of countries using the COPRAS method—2019.
Applsci 15 01575 g008
Figure 9. Ranking of countries using the COPRAS method—2020.
Applsci 15 01575 g009
Figure 10. Ranking of countries using the COPRAS method—2021.
Applsci 15 01575 g010
Figure 11. Ranking of countries using the COPRAS method—2022.
Applsci 15 01575 g011
Table 1. Evaluation of the relevant literature studies.
Author and YearCase StudyMethod
[6]EU CountriesFAHP
[2]IranSWOT, hybrid MCDM methods, and game theory
[4]138 CountriesARAT, CRITIC, SOWIA, CRADIS, and CODAS-Sort
[1]EU-27 CountriesCRITIC, SD, GRA, and TOPSIS
[5]TürkiyeAHP and COPRAS
[3]TürkiyeAHP and TOPSIS
[7]PakistanAHP, TOPSIS, and VIKOR
[8]TürkiyeBOCR and ANP
[9]TaiwanWSM, VIKOR, TOPSIS, and ELECTRE
[10]ChinaANP, WSM, TOPSIS, PROMETHEE, ELECTRE, and VIKOR
[11]OPEC CountriesCOCOSO, WASPAS, MABAC, CODAS, and VIKOR
[12]TürkiyeANP
[13]EnglandAHP
[14]ABMULTIMOORA and TOPSIS
[15]TürkiyeMACBETH and FUZZY AHP
[16]TürkiyeFuzzy VIKOR and AHP
Table 2. “CRITIC” weight coefficients of the criteria for 2018.
Cluster
Variables123
Electricity from wind—TWh0.07390.05820.0601
Electricity from hydro sources—TWh0.07870.06660.0774
Electricity from solar sources—TWh0.05840.06790.0723
Other renewables including bioenergy—TWh0.05670.06240.0690
Employment-to-population ratio, 15+, total (%)0.03620.07210.0605
Population0.14480.14550.1463
Labor force, total0.07040.08810.0930
GDP0.07680.06410.0796
Purchasing power parities and exchange rates0.07560.07850.0616
Consumer price index0.10890.04950.0752
CO2 emissions0.07020.08430.0605
Carbon intensity of electricity—gCO2/kWh0.04360.07610.0623
Per capita energy use0.10590.08670.0824
Table 3. “CRITIC” weight coefficients of the criteria for 2019.
Cluster
Variables123
Electricity from wind—TWh0.06680.07080.0694
Electricity from hydro sources—TWh0.07450.06630.0866
Electricity from solar sources—TWh0.06750.07180.0723
Other renewables including bioenergy—TWh0.06430.07160.0681
Employment-to-population ratio, 15+, total (%)0.05240.06510.0524
Population0.14680.14660.1105
Labor force, total0.08430.08190.0744
GDP0.07750.07010.0732
Purchasing power parities and exchange rates0.06610.07100.0632
Consumer price index0.10680.04990.0772
CO2 emissions0.06800.07260.0879
Carbon intensity of electricity—gCO2/kWh0.05490.08700.0914
Per capita energy use0.07010.07520.0734
Table 4. “CRITIC” weight coefficients of the criteria for 2020.
Cluster
Variables123
Electricity from wind—TWh0.06930.06670.0656
Electricity from hydro sources—TWh0.07060.06850.0743
Electricity from solar sources—TWh0.07300.07520.0758
Other renewables including bioenergy—TWh0.05740.06170.0646
Employment-to-population ratio, 15+, total (%) 0.05480.07380.0638
Population 0.12740.16430.1191
Labor force, total 0.07810.07420.0754
GDP 0.07720.07090.0737
Purchasing power parities and exchange rates0.06840.06730.0568
Consumer price index 0.09670.05160.0665
CO2 emissions0.08180.05950.0949
Carbon intensity of electricity—gCO2/kWh0.06460.08540.0890
Per capita energy use0.08070.08080.0805
Table 5. “CRITIC” weight coefficients of the criteria for 2021.
Cluster
Variables123
Electricity from wind—TWh0.05980.06390.0787
Electricity from hydro sources—TWh0.07410.07100.0504
Electricity from solar sources—TWh0.08500.06950.0788
Other renewables including bioenergy—TWh0.06260.07200.0802
Employment-to-population ratio, 15+, total (%) 0.07590.06650.0470
Population 0.14970.14040.1289
Labor force, total 0.08090.08130.0787
GDP 0.07610.06780.0787
Purchasing power parities and exchange rates0.05530.08740.0433
Consumer price index 0.08620.04500.0813
CO2 emissions0.07050.07480.0858
Carbon intensity of electricity—gCO2/kWh0.05040.06330.1225
Per capita energy use0.07360.09720.0456
Table 6. “CRITIC” weight coefficients of the criteria for 2022.
Cluster
Variables123
Electricity from wind—TWh0.05390.06250.0625
Electricity from hydro sources—TWh0.07960.07410.1000
Electricity from solar sources—TWh0.08410.07100.0625
Other renewables including bioenergy—TWh0.06030.05330.0625
Employment-to-population ratio, 15+, total (%) 0.07690.07380.0625
Population 0.14760.13830.1000
Labor force, total 0.07770.08110.0625
GDP 0.06970.06630.0625
Purchasing power parities and exchange rates0.06020.08150.0625
Consumer price index 0.09080.06360.1000
CO2 emissions0.06960.07140.1000
Carbon intensity of electricity—gCO2/kWh0.05560.06660.1000
Per capita energy use0.07400.09640.0625
Disclaimer/Publisher’s Note: The statements, opinions and data contained in all publications are solely those of the individual author(s) and contributor(s) and not of MDPI and/or the editor(s). MDPI and/or the editor(s) disclaim responsibility for any injury to people or property resulting from any ideas, methods, instructions or products referred to in the content.

