Abstract
The evolving landscape of the liquid fuels market, together with changing legal regulations, has prompted consideration of using artificial intelligence methods for the physicochemical analysis of fuel and biofuel blends. The objective of the study was to determine the dynamic viscosity of diesel fuel and its blends with vegetable oils derived from rapeseed, camelina, flax, and mustard. These oils were selected due to their previous applications in the petrochemical industry. The oils used in the study were obtained by cold pressing with a screw press. The measurements were performed over a temperature range of 5 to 85 °C at mass ratios containing 20%, 40%, 60%, and 80% vegetable oil in diesel fuel. A Brookfield-type rotational viscometer was employed for the measurements. Based on the resulting laboratory data, mathematical models of dynamic viscosity were developed. Furthermore, the experimental results were used to train a neural network to analyse relationships among dynamic viscosity, temperature, and vegetable oil content in the blend. Both the empirical (mathematical) models and the models describing changes in dynamic viscosity as a function of temperature and component content in the vegetable oil–diesel blends achieved coefficients of determination (R2) exceeding 0.99.
1. Introduction
Vegetable-oil viscosity is largely governed by fatty-acid structure [1]. Saturated chains pack closely and increase viscosity, while monounsaturated chains introduce limited conformational bending that moderately reduces molecular cohesion [2]. Polyunsaturated chains contain multiple double-bond-induced kinks, which markedly lower cohesive energy and thus viscosity [3]. Consequently, differences in chain saturation and length among rapeseed, flaxseed and mustard oils translate directly into the viscosity of their blends [4].
Growing environmental awareness and the search for alternative energy sources have drawn growing attention to blends of diesel fuel with vegetable oils, which may offer a more sustainable and environmentally friendly alternative to conventional fuels [5,6,7].
For many years, researchers have explored the use of vegetable oils as additives or substitutes for hydrocarbon fuels [8,9,10]. Several factors have contributed to this trend. Historically, economic factors were highly significant, as vegetable oils are far more accessible and less expensive to obtain than crude oil; today, however, environmental protection and energy security have become considerably more important aspects [11,12,13]. This approach is further supported by legal regulations [14,15,16].
Vegetable oils and biodiesel release substantially lower amounts of greenhouse gases during combustion. Moreover, unlike crude oil, vegetable oils can be produced in many regions of the world where oilseed crops can be cultivated [17,18,19].
Another important factor motivating the use of vegetable oils as substitutes or additives for conventional diesel fuel is the similarity of their combustion-related properties [20,21,22]. To illustrate, the cetane number of standard diesel fuel, which reflects the auto-ignition quality of oils, typically ranges from about 40 to 55, whereas for vegetable oils this value falls between 30 and 40, depending on composition and the type of seeds used for extraction [23,24]. Although the cetane number of vegetable oils is lower, resulting in less optimal combustion conditions in the engine, it remains close to the lower limit of diesel fuel.
Another key parameter shared by diesel fuel and vegetable oils is the amount of energy released during combustion. For diesel fuel, this value is approximately 42–46 MJ per kilogram of burnt fuel, while for vegetable oils it is about 36–39 MJ per kilogram of burnt fuel, again showing similarity despite the slightly lower performance of vegetable oils [25,26,27].
For this reason, blends of diesel fuel with vegetable oils are often used instead of pure vegetable oil. Such blends help reduce greenhouse gas emissions while maintaining more favourable energy content and cetane number [28,29].
This approach also addresses another issue, namely the high viscosity of vegetable oils, which is several times greater than that of diesel fuel. Consequently, if pure vegetable oil or blends containing a substantial proportion of vegetable oil are to be used as fuel, engines must be modified to include preheating systems that lower the fuel’s viscosity [30,31,32].
Vegetable oils, however, can be utilised in an additional way. Instead of using them in their raw form, they may undergo transesterification to produce biodiesel. This process involves reacting the oil with an alcohol in the presence of a catalyst. The biodiesel obtained through this reaction exhibits significantly improved cetane numbers, ranging from about 45 up to even 65, as well as energy content of 37–40 MJ per kilogram of burnt fuel.
Biodiesel also retains the crucial advantage of substantially lower greenhouse gas emissions during combustion; however, its viscosity still remains markedly higher than that of conventional diesel fuel [33,34].
Viscosity is a fundamental property of liquids, gases, and fluid-like solids. It represents the internal friction between hypothetical fluid layers that move relative to one another [35,36,37].
Kinematic viscosity is defined as the ratio of a fluid’s dynamic viscosity to its density [38,39].
Dynamic viscosity represents the resistance a fluid offers to shear stress. In other words, it is the ratio of shear stress to shear rate [40,41].
The dynamic viscosity of diesel fuel plays a crucial role in the operation of the engine and the fuel system. It affects functions such as diesel fuel flow rate, fuel injection process, the lubricity of fuel system components, and the size of fuel droplets [42].
If diesel fuel viscosity is too high, the fuel will travel more slowly from the tank to the engine, resulting in reduced engine power. Beyond certain critical values, the fuel flow may cease entirely, preventing further engine operation. This may occur, for instance, at low ambient temperatures, as fluid viscosity decreases with rising temperature.
Excessive viscosity also negatively influences the atomisation of diesel fuel within the combustion chamber. An increase in dynamic viscosity leads to the formation of larger droplets with greater spray penetration. This results in poorer mixing of fuel with air and causes fuel to deposit on the walls of the combustion chamber and on the piston crown, where it forms carbon deposits during combustion [43,44].
Fuel with excessively high viscosity increases flow resistance inside the injector, adversely affecting injection timing and spray formation. These effects may lead to unstable engine operation, reduced power output, and greater fuel consumption. Fuels with higher viscosity also place a greater load on injectors and pumps. This increased load can accelerate wear and potentially lead to premature failure of these components [45,46].
Excessively low dynamic viscosity of diesel fuel likewise causes numerous problems in engine and fuel system operation. It diminishes lubricity of fuel system components and may result in leakage through injector seals as well as uneven fuel delivery to the combustion chambers. Insufficient diesel fuel viscosity may also reduce spray penetration, causing most of the fuel to burn near the injector nozzle with limited air participation, which adversely impacts engine power [47,48].
Instruments used to measure the dynamic or kinematic viscosity of gases, liquids, and fluid-like solids are known as viscometers.
Capillary viscometers are devices specifically designed for the measurement of liquid kinematic viscosity. These devices, irrespective of type, operate on the basis of the Hagen-Poiseuille law to determine the viscosity of the tested liquid. This law gives the pressure drop between the inlet and outlet of a tube under steady laminar flow of a Newtonian, incompressible, viscous fluid through a cylindrical tube of constant circular cross-section and considerable length. A wide range of capillary viscometers from various manufacturers is available on the market; however, the three most widely used types are the Ostwald viscometer, the Ubbelohde viscometer, and the Cannon-Fenske viscometer. A limitation of these viscometers is their measurement range, since they perform optimally with fluids of low to moderate viscosity. Additionally, capillary viscometers cannot be used for non-Newtonian liquids [49,50].
The Höppler viscometer is an instrument designed for measuring the dynamic viscosity of a fluid based on the principles of Stokes’ law. It is commonly employed in laboratories due to its relatively high measurement precision, ease of repeatability, and the ability to control temperature through the use of a water jacket. This type of viscometer can also be used to measure the viscosity of non-Newtonian fluids, and an additional advantage is that it provides significantly higher accuracy for high-viscosity fluids compared with many other viscometer types [51,52].
An oscillating piston viscometer is a device in which the test fluid is placed inside a temperature-controlled chamber containing a piston. The piston is then driven into oscillatory motion by means of an electromagnetic field to measure the dynamic viscosity. One of the major advantages of oscillating piston viscometers is their ability to perform continuous measurements at varying temperatures while requiring only a small sample volume. Such viscometers are also suitable for examining non-Newtonian fluids, although they may exhibit reduced accuracy for this class of fluids [53].
The fundamental principle behind the operation of a vibrational viscometer is resonance [54].
Numerous mathematical models describing both kinematic and dynamic viscosity have been developed. These include general or theoretical models as well as empirical ones, formulated for both Newtonian and non-Newtonian liquids.
The simplest and one of the earliest models is that derived by Isaac Newton, where shear stress equals dynamic viscosity multiplied by shear rate. This model constitutes the foundation for dynamic viscosity calculations and underlies the operation of rotational viscometers [55].
A number of relatively simple mathematical models can also be applied to calculate the viscosity of non-Newtonian fluids. These include the Power-Law and Bingham models [56].
The Vogel–Fulcher–Tammann (VFT) model is another general model employed for dynamic viscosity. This model accounts for the temperature dependence of dynamic viscosity. It was derived from the Arrhenius equation, which may likewise be used to describe viscosity variations in certain fluids; however, in most cases the VFT equation provides greater accuracy [57].
Another very simple model describing the temperature dependence of dynamic viscosity for Newtonian fluids is the Arrhenius–Guzmán equation.
One of the commonly employed models for representing the temperature-dependent dynamic viscosity of biodiesel is the Walther equation [58].
Another widely used model is the Grunberg–Nissan model, which is applied to determine temperature-dependent dynamic viscosity in binary blends. For this reason, it is particularly suitable for calculating the viscosity of blends of diesel fuel with vegetable oils or biodiesel [59].
The aim of the present work is to investigate the dynamic viscosity of diesel fuel and its blends with vegetable oils (rapeseed, flaxseed, mustard, camelina) and subsequently to use the obtained data to develop mathematical models of viscosity as a function of temperature and of the percentage content of vegetable oil in diesel fuel blends.
Vegetable oils exhibit significant variability in viscosity due to differences in their fatty acid composition and molecular structure. The chain length and the degree of unsaturation strongly determine intermolecular interactions, van der Waals forces and molecular packing. Saturated fatty acids form highly ordered structures and therefore contribute to increased viscosity, particularly at low temperatures. Conversely, polyunsaturated fatty acids (PUFA) contain multiple double bonds which introduce structural kinks that reduce molecular packing density, leading to lower viscosity and a steeper viscosity–temperature slope. Monounsaturated fatty acids (MUFA) exhibit intermediate packing characteristics and therefore yield intermediate viscosity values. These mechanistic differences explain why PUFA-rich oils (e.g., flaxseed) display lower viscosity and enhanced temperature sensitivity, while MUFA-dominant oils (e.g., rapeseed, mustard) maintain higher viscosity across the tested temperature range.
These differences in oleic, linoleic, linolenic and erucic acid fractions explain the viscosity ordering of the studied oils, with higher saturation leading to increased viscosity.
2. Materials and Methods
The aim of the study was to determine the dynamic viscosity of diesel fuel and its blends with vegetable oils over the temperature range of 5–85 °C, with measurements taken every 5 °C. The blends were prepared on a mass ratio basis using 20%, 40%, 60%, and 80% vegetable oil relative to diesel fuel.
The vegetable oils employed in the study included rapeseed oil, camelina oil, flaxseed oil, and mustard oil. These particular oils were selected because each has previously been used in the petrochemical industry either as a diesel fuel additive or as a feedstock for biodiesel production. All oils were obtained by cold pressing using a screw press.
Dynamic viscosity was measured using a Brookfield-type rotational rheometer, and reported in [mPa∙s]. A circulator connected to an adapter was used for temperature control. Each measurement was conducted in triplicate to obtain averaged results. During testing, the rotational speed of the rheometer was varied to achieve the highest possible accuracy of dynamic viscosity readings, based on the assumption that higher rotational speeds improve accuracy at the expense of a narrower measurable range. The lowest rotational speed applied was 3 rpm, and the highest was 100 rpm.
2.1. Description of the Experimental Setup
The study was carried out using an AMETEK Brookfield DVNext LV rheometer (Figure 1a) together with an adapter (Figure 1b) intended for temperature control of the tested fluid [60].
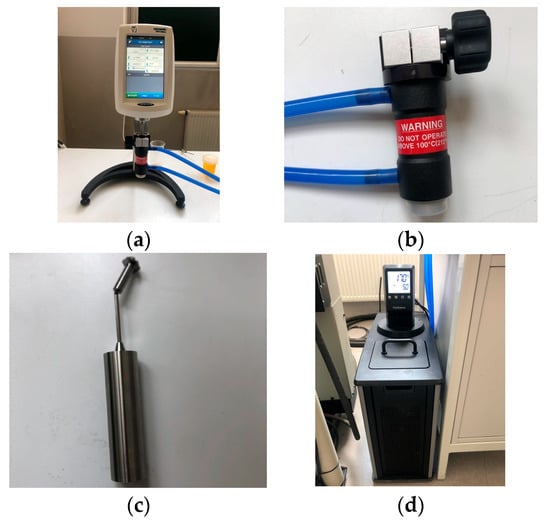
Figure 1.
Experimental setup: (a) the AMETEK Brookfield DVNext LV rheometer; (b) the temperature control adapter; (c) a magnetically attached coaxial cylinder; (d) an MX Immersion circulator from PolyScience with a thermostatic bath.
The rheometer parameters are listed in Table 1.

Table 1.
Key parameters of the AMETEK Brookfield DVNext viscometer [60].
It should be noted that the use of the adapter modifies some of these parameters. Specifically, the measurement range is reduced to a maximum of 2000 cP, and the temperature range of the tested fluids becomes limited. The maximum temperature is limited only to 100 °C, while the minimum is −1 °C. The adapter also limits the sample volume to a maximum of 16 mL. When the adapter is used, only one type of coaxial cylinder, which is the rotating element, should be employed (Figure 1c).
Temperature was regulated using the PolyScience MX Immersion circulator equipped with a thermostatic bath (Figure 1d). The device operates within a temperature range of 5–135 °C. According to the manufacturer, the temperature stability is ±0.07 °C.
2.2. Development of Empirical Models
Tools available in the Scilab 2024 numerical package were used to develop the mathematical models, which enable fitting the empirical parameters of the nonlinear mathematical model. In this package, the “datafit” function allows the prepared nonlinear model to be fitted to the measurement data, and it is invoked in scripts or in the console in the following form:
where
[p, dmin, status] = datafit(G, Data [,Wd] [,Wg][,’b’, p_inf, p_sup], p0 [,algo][,stop])
- p0—matrix of initial parameter estimates;
- “b”—header keyword of the sequence;
- P—matrix of best-fit model parameters;
- Data—matrix of experimental data points;
- Wd—data weights (optional);
- G—computed error between the fitted model and the data;
- Wg—optional weight matrix for the error definition;
- algo—selection of the algorithm used for the fitting procedure;
- stop—sequence of optional arguments controlling the convergence of the fitting algorithm;
- status—completion status.
Scripts written in the Scilab 2024 environment were prepared to construct nonlinear dynamic viscosity models for the individual oils and their blends with diesel fuel. Figure 2 presents a block diagram of the algorithm used to develop models based on neural networks for predicting dynamic viscosity changes as a function of temperature for the selected oils.
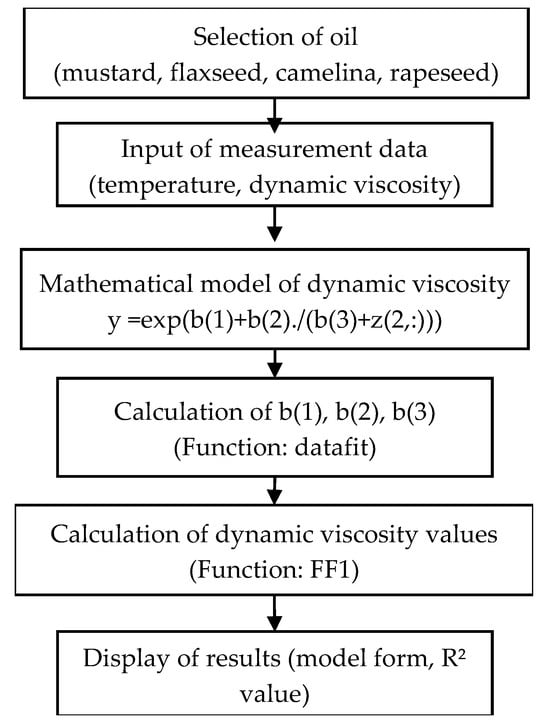
Figure 2.
A block diagram of the algorithm for developing regression models.
In this script, unnecessary variables and windows are removed in the initial step. The measurement data matrix “Data” is then defined. Subsequently, two functions are defined: “FF1”, which computes the value of the empirical model for the supplied data, and “Gap1”, which calculates the error between the measurement data and the model values for the supplied data during the process of fitting the empirical model parameters. The definition of the parameter “b0” provides the initial values required for fitting the empirical model parameters.
Once the required parameters have been declared, the “datafit” function is invoked to fit the empirical model to the measurement data. The resulting set of parameters “b” is then used in subsequent parts of the script to compute model values for the given measurement data and to determine the coefficient of determination R2 relative to the data. Models are generated both for the pure vegetable oil being examined and for pure diesel fuel.
The next step involves calculations for the model describing the temperature-dependent dynamic viscosity of a binary blend (details of this model are provided in the section presenting the results of the mathematical model development), followed by computation of the corresponding R2 value. In the final part of the script, a 3D plot is generated using the “scatter3d” function to display the measurement data points, and the “surf” function is used to draw the surface representing the obtained mathematical model.
2.3. Development of Neural Network-Based Models
To develop models representing the dynamic viscosity variations in diesel–vegetable oil blends as a function of temperature and component content, numerical tools from the Neural Network Module library version 3.0 in Scilab 2024 were employed.
For model generation based on the measurement data, a supervised neural network learning algorithm was applied, using backpropagation with the Levenberg–Marquardt training method.
In the prepared scripts, the following functions from the package were employed for constructing the models:
where:
W = ann_FFBP_lm(P,T,N,af,mu,mumax,theta,itermax,mse_min,gd_min)
- P—input training data;
- T—training target;
- N—number of neurons in each layer, including the input and output layers;
- af—activation function from the first hidden layer to the output layer;
- mumax—maximum allowable value of mu;
- theta—mu multiplier;
- itermax—maximum number of iterations;
- mse_min—minimum error (target performance);
- gd_min—minimum gradient;
- W—output weight and bias.
[y] = ann_FFBP_run(W,P,af)
- P—test input;
- W—output weight and bias;
- af—activation function;
- y—simulation result.
Figure 3 presents a block diagram of the algorithm used to develop models based on neural networks for predicting dynamic viscosity changes as a function of temperature for the selected oils.
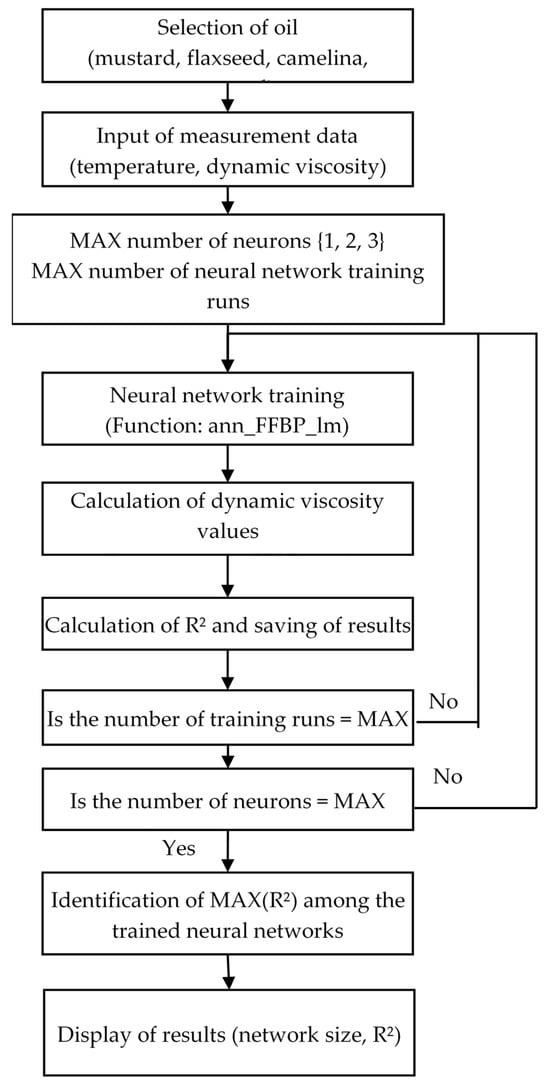
Figure 3.
A block diagram of the algorithm for developing models using neural networks to describe temperature-dependent variations in dynamic viscosity for the selected oils.
In this script, unnecessary variables and windows are removed in the initial step. The measurement data matrix “Data” and the “DataTitle” matrix, which stores the text required for labelling the plot axes, are then defined. Next, in the prepared loop that allows the number of neurons in the hidden layer to be varied and enables repeated training of each generated neural network structure, the actual training process is executed using the “ann_FFBP_lm” function.
Once a given network structure has been trained, the “ann_FFBP_lm” function is used to compute the model output for the measurement data, followed by calculation of the model’s goodness of fit to the data in the form of the R2 value. All data obtained during the training process are saved to disk in files.
Following the training stage, a loop is applied to read the neural network structures from disk, compute the coefficient of determination R2 for each evaluated network model relative to the measurement data, and create the structures required to plot both the actual experimental data and the selected model in three-dimensional space.
Using this part of the script, after analysing model fit and verifying that the models did not exhibit overfitting, the optimal structures were selected (results of this analysis are presented in subsequent sections).
In total, 100 independent neural network structures were generated in the script, each with a fixed number of neurons in the hidden layer, and trained with a specified iteration limit of 10,000.
2.4. Fatty Acid Composition of the Oils
The fatty acid composition was determined using gas chromatography (a Bruker 436GC chromatograph (Bruker Corporation, Billerica, Massachusetts, USA) with an FID detector) following the relevant standards [61,62] (Table 2).
Table 2.
Fatty acid composition of the oils (% of FA sum).
In the case of rapeseed oil, oleic acid was the main fatty acid (≈62%). Additionally, the rapeseed oil contained substantial linoleic acid (≈20%) and a lower proportion of α-linolenic acid (≈10%). These findings are broadly consistent with literature reports [63,64,65].
For camelina oil, the observed share of monounsaturated fatty acids (MUFA) and polyunsaturated fatty acids (PUFA) corresponds reasonably well with published data for cold-pressed camelina oils [66,67]. The major fatty acids in our sample were α-linolenic acid (≈30%) and linoleic acid (≈22%).
For flaxseed oil, the high PUFA content (≈73.5%)—with α-linolenic acid (≈58%) as the dominant component and oleic acid (≈17%) as the main MUFA—is consistent with recent analytical studies of flaxseed (linen) oil from various cultivars [68].
For mustard seed oil, our results indicate a high content of very-long-chain monounsaturated fatty acids (in particular erucic acid), resulting in a high MUFA proportion. This finding is consistent with several published analyses of mustard seed oil [69,70]. Given the documented variability across cultivars and processing methods, the exact profile—especially minor and long-chain fatty acids—may vary and should be interpreted with caution.
The observed differences in fatty acid composition among the analysed oils have a direct influence on their dynamic viscosity behaviour. Oils with a higher proportion of polyunsaturated fatty acids (PUFA), such as flaxseed oil (≈73.5% PUFA), exhibit lower viscosity due to the presence of multiple double bonds, which reduce intermolecular interactions and increase molecular mobility. In contrast, rapeseed and mustard oils contain substantially higher fractions of monounsaturated fatty acids (MUFA), reaching ≈62% and ≈58%, respectively, which results in higher viscosity values, particularly at low temperatures. Camelina oil, with a balanced MUFA–PUFA profile, demonstrates intermediate viscosity levels. These compositional distinctions explain the systematic differences in viscosity–temperature behaviour observed in the experimental results and directly support the modelling approach applied in subsequent sections.
Table 2 has been extended to include complete fatty acid profiles (SFA, MUFA, PUFA), enabling direct correlation between chemical composition and viscosity behaviour. Oils with higher PUFA proportions showed lower viscosity due to reduced intermolecular cohesion, while MUFA-rich oils exhibited stronger molecular interactions, resulting in higher viscosity values, especially at low temperatures. These compositional factors play a key role in explaining the viscosity differences observed experimentally.
3. Results
The results of the dynamic viscosity measurements of the selected vegetable oil–diesel blends as functions of temperature and component content are presented first. This is followed by the results of the model development process, including both empirical models and neural network-based models describing dynamic viscosity behaviour of the examined blends.
3.1. Investigation of the Dynamic Viscosity of the Diesel–Vegetable Oil Blends Under Temperature Variation
3.1.1. Diesel–Mustard Oil Blend
The measurement data for the dynamic viscosity of the diesel–mustard oil blend are summarised in Table 3.
Table 3.
Summary of dynamic viscosity measurement results [mPa·s] for the diesel–mustard oil blend.
Figure 4 presents the collected measurement data of dynamic viscosity changes with varying temperature and fixed proportions of diesel fuel and mustard oil in the blend.
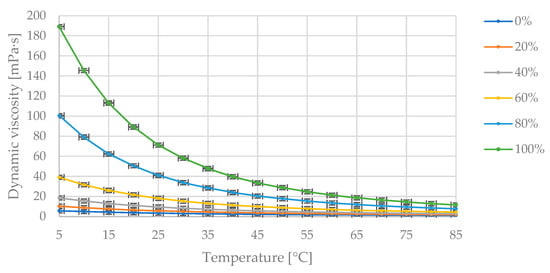
Figure 4.
The obtained measurement points of dynamic viscosity variations [mPa·s] with changing temperature [°C] for specified mass fractions of mustard oil [% (m/m)] in the diesel blend.
In Figure 4, the maximum dynamic viscosity value of 189 mPa·s corresponds to the pure oil at 5 °C. As the temperature increases, the dynamic viscosity value decreases asymptotically toward zero. The dynamic viscosity decreases as the proportion of diesel fuel in the blend increases.
Figure 5 presents the measurement data showing dynamic viscosity variations with changing diesel and mustard oil content in the blend at fixed blend temperatures.
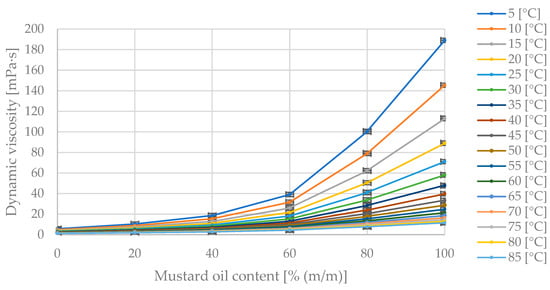
Figure 5.
The obtained dynamic viscosity measurement points [mPa·s] for changing mass fractions of mustard oil [% (m/m)] in the diesel blend at specified temperatures [°C].
In Figure 5, the maximum dynamic viscosity value of 189 mPa·s corresponds to the pure oil at 5 °C. As the diesel fraction in the blend increases, the dynamic viscosity value decreases. The dynamic viscosity decreases with increasing blend temperature.
3.1.2. Diesel–Flaxseed Oil Blend
The measurement data for the dynamic viscosity of the diesel–flaxseed oil blend are presented in Table 4.
Table 4.
Summary of dynamic viscosity results [mPa·s] for the diesel–flaxseed oil blend.
Figure 6 presents the collected measurement data showing changes in dynamic viscosity with temperature variation at fixed proportions of diesel fuel and flaxseed oil in the blend. In Figure 6, the maximum dynamic viscosity value of 92.3 mPa·s corresponds to the pure oil at 5 °C. As the temperature increases, the dynamic viscosity value decreases asymptotically toward zero. The dynamic viscosity decreases as the proportion of diesel fuel in the blend increases.
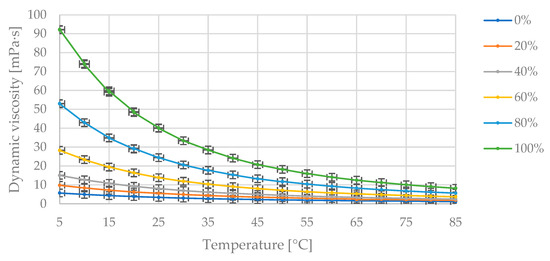
Figure 6.
The obtained measurement points of dynamic viscosity variation [mPa·s] with changing temperature [°C] for the specified mass fractions of flaxseed oil [% (m/m)] in the diesel blend.
Figure 7 compiles the measurement data illustrating dynamic viscosity changes with varying diesel and flaxseed oil content in the blend at fixed blend temperatures. In Figure 7, the maximum dynamic viscosity value of 92.3 mPa·s corresponds to the pure oil at 5 °C. As the diesel fraction in the blend increases, the dynamic viscosity decreases. The dynamic viscosity decreases with increasing blend temperature.
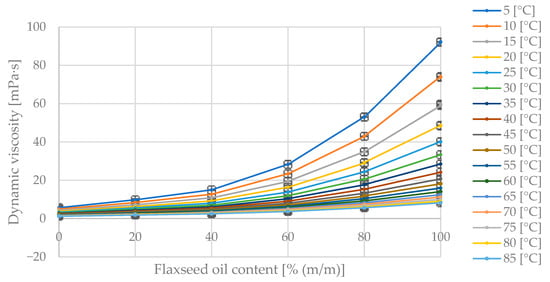
Figure 7.
The obtained dynamic viscosity measurement points [mPa·s] for varying mass fractions of flaxseed oil [% (m/m)] in the diesel blend at given temperatures [°C].
3.1.3. Diesel–Camelina Oil Blend
The measurement data for the dynamic viscosity of the diesel–camelina oil blend are summarised in Table 5.
Table 5.
Summary of dynamic viscosity measurement results [mPa·s] for the diesel–camelina oil blend.
Figure 8 presents the collected measurement data showing changes in dynamic viscosity with temperature variation at fixed proportions of diesel fuel and flaxseed oil in the blend.
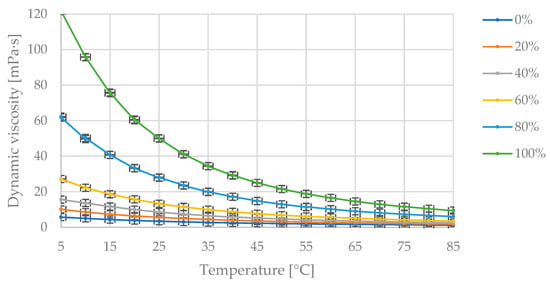
Figure 8.
The obtained measurement points of dynamic viscosity variation [mPa·s] with changing temperature [°C] for the specified mass fractions of camelina oil [% (m/m)] in the diesel blend.
In Figure 8, the maximum dynamic viscosity value of 122 mPa·s corresponds to the pure oil at 5 °C. As the temperature increases, the dynamic viscosity value decreases asymptotically toward zero. The dynamic viscosity value decreases as the proportion of diesel fuel in the blend increases.
Figure 9 compiles the measurement data illustrating dynamic viscosity changes with varying diesel and flaxseed oil content in the blend at fixed blend temperatures. In Figure 9, the maximum dynamic viscosity value of 122 mPa·s corresponds to the pure oil at 5 °C. As the diesel fraction in the blend increases, the dynamic viscosity value decreases. The dynamic viscosity decreases with increasing blend temperature.
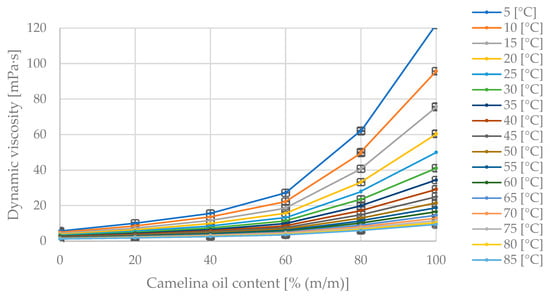
Figure 9.
The obtained dynamic viscosity measurement points [mPa·s] for varying mass fractions of camelina oil [% (m/m)] in the diesel blend at the given temperatures [°C].
3.1.4. Diesel–Rapeseed Oil Blend
The measurement data for the dynamic viscosity of the diesel–rapeseed oil blend are compiled in Table 6.
Table 6.
Summary of dynamic viscosity measurement results [mPa·s] for the diesel–rapeseed oil blend.
Figure 10 presents the collected measurement data showing changes in dynamic viscosity with temperature variation at fixed proportions of diesel fuel and rapeseed oil in the blend.
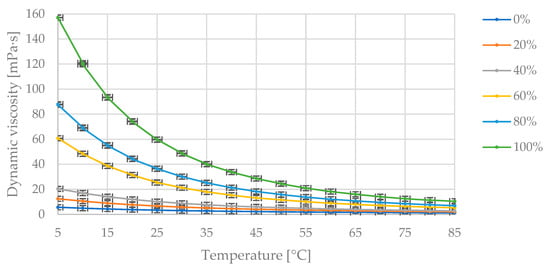
Figure 10.
The obtained measurement points of dynamic viscosity variation [mPa·s] with changing temperature [°C] for specified mass fractions of rapeseed oil [% (m/m)] in the diesel blend.
In Figure 10, the maximum dynamic viscosity value of 157 mPa·s corresponds to the pure oil at 5 °C. As the temperature increases, the dynamic viscosity value decreases asymptotically toward zero. The dynamic viscosity decreases as the proportion of diesel fuel in the blend increases.
Figure 11 presents the measurement data showing dynamic viscosity variations with changing diesel and mustard oil content in the blend at fixed blend temperatures. In Figure 11, the maximum dynamic viscosity value of 157 mPa·s corresponds to the pure oil at 5 °C. As the diesel fraction in the blend increases, the dynamic viscosity value decreases. The dynamic viscosity decreases with increasing blend temperature.
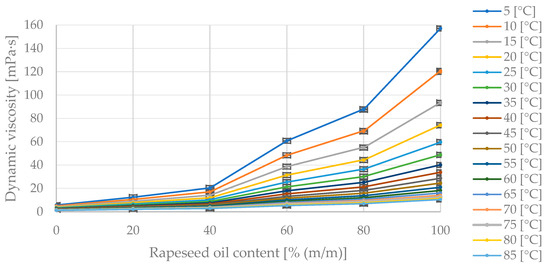
Figure 11.
The obtained dynamic viscosity measurement points [mPa·s] for varying mass fractions of rapeseed oil [% (m/m)] in the diesel blend at the given temperatures [°C].
3.2. Mathematical Models of Changes in Dynamic Viscosity
As part of the evaluation, the Grunberg–Nissan equation was benchmarked against Arrhenius–Guzmán, Walther and Andrade models to determine predictive robustness across temperature intervals.
To develop mathematical models describing the temperature-dependent dynamic viscosity of the selected vegetable oils and pure diesel fuel (100% m/m), the empirical Vogel–Fulcher–Tammann (VFT) model was applied in the following form:
where:
μ(T) = exp(A + B/(C + T))[Pa∙s]
- A, B, C—empirical coefficients;
- T—blend temperature [°C].
The fitting results and empirical parameters of this form of the mathematical model to the measurement data for each vegetable oil and diesel fuel, obtained through minimisation of the squared error between the model values and the measurement data, are presented in Table 7.
Table 7.
Fitting results of the temperature-dependent mathematical models of dynamic viscosity for the examined oils without blends.
The mathematical models developed and fitted to the measurement data for the pure oils were then used to construct a mathematical model enabling prediction of the dynamic viscosity of the blend as a function of temperature and component content. For this purpose, the Grunberg–Nissan model was applied in the following mathematical form:
where:
- µON(T)—dynamic viscosity of diesel fuel as a function of temperature [mPa·s];
- µOR(T)—dynamic viscosity of the vegetable oil as a function of temperature [mPa·s];
- fON—mass fraction of diesel fuel [% (m/m)];
- fOR—mass fraction of the vegetable oil [% (m/m)].
In this case, no fitting of the mathematical model to measurement data was performed because the mathematical relation uses empirical models describing the temperature-dependent dynamic viscosity of the pure oils, and the model contains only parameters representing the component mass fractions in the binary blend. The resulting coefficients of determination for these models are presented in Table 8.
Table 8.
The fitting results of the models describing dynamic viscosity variations as functions of temperature and component content in the blends are presented below.
Figure 12 illustrates the behaviour of the model describing dynamic viscosity variations as a function of liquid temperature and component content in the diesel–mustard oil blend, which achieved a coefficient of determination of R2 = 0.9975. The plot below also includes the points representing the measurement data.
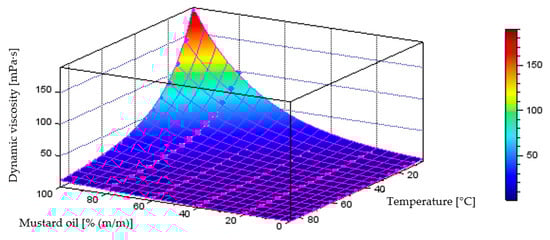
Figure 12.
Quantitative model of dynamic viscosity variation [mPa·s] as a function of temperature [°C] and mass fraction of mustard oil [% (m/m)] in the diesel blend.
Figure 13 illustrates the behaviour of the model describing dynamic viscosity variations as a function of liquid temperature and component content in the diesel–flaxseed oil blend, which achieved a coefficient of determination of R2 = 0.9995. The plot below also includes the points representing the measurement data.
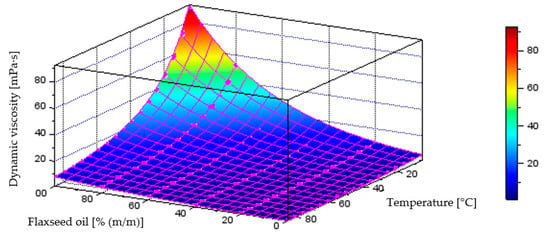
Figure 13.
Quantitative model of dynamic viscosity variation [mPa·s] as a function of temperature [°C] and mass fraction of flaxseed oil [% (m/m)] in the diesel blend.
Figure 14 illustrates the behaviour of the model describing dynamic viscosity variations as a function of liquid temperature and component content in the diesel–camelina oil blend, which achieved a coefficient of determination of R2 = 0.9986. The plot below also includes the points representing the measurement data.

Figure 14.
Quantitative model of dynamic viscosity variation [mPa·s] as a function of temperature [°C] and mass fraction of camelina oil [% (m/m)] in the diesel blend.
Figure 15 illustrates the behaviour of the model describing dynamic viscosity variations as a function of liquid temperature and component content in the diesel–rapeseed oil blend, which achieved a coefficient of determination of R2 = 0.9922. The plot below also includes the points representing the measurement data.
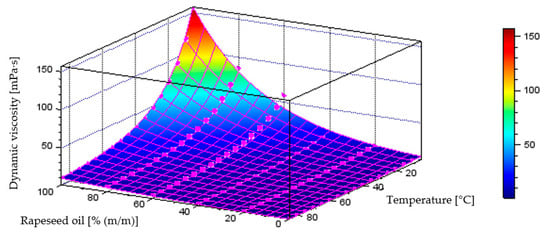
Figure 15.
Quantitative model of dynamic viscosity variation [mPa·s] as a function of temperature [°C] and mass fraction of rapeseed oil [% (m/m)] in the diesel blend.
To evaluate the applicability of the Grunberg–Nissan equation across the full investigated temperature range, the model performance was analysed separately for low temperatures (5–20 °C), medium temperatures (25–60 °C) and high temperatures (65–85 °C). The deviations between experimental and predicted values remained within ±3% for medium and high temperatures and within ±5% for low temperatures. Slightly higher discrepancies at 5–20 °C are consistent with the increased viscosity sensitivity in this temperature region and with known limitations of logarithmic mixture rules for systems involving highly viscous components. Nevertheless, the overall coefficient of determination remained above R2 > 0.99 for all blends, confirming that the model adequately captures the observed behaviour across all temperature intervals.
To provide a broader perspective on the predictive capabilities of the applied correlation and to justify the selection of the Grunberg–Nissan model, a comparative analysis with other commonly used viscosity–temperature relationships was performed. Table 9 summarises the statistical performance indicators obtained for all evaluated models, including the Arrhenius–Guzmán, Walther and Andrade correlations. The comparison covers two key accuracy metrics: the coefficient of determination R2 and the mean absolute error (MAE), expressed in mPa·s.
Table 9.
Comparison of viscosity prediction models based on statistical performance indicators.
As shown in Table 9, the Grunberg–Nissan model provides the highest accuracy among all tested correlations. For additional verification, the Grunberg–Nissan equation was compared with the Arrhenius–Guzmán and Walther models using the full experimental dataset. The Arrhenius–Guzmán equation, although known to perform well for individual oils, produced markedly higher errors for binary blends, particularly at vegetable oil contents above 40% (R2 ranging from 0.94 to 0.97). The Walther model reproduced the general exponential decrease in viscosity with temperature but underestimated viscosity at low temperatures and yielded lower overall accuracy (R2 = 0.96–0.985). Among the evaluated approaches, the Grunberg–Nissan model consistently provided the best fit, with coefficients of determination between 0.9922 and 0.9995 for all tested blends. These results confirm that the Grunberg–Nissan relation is the most suitable for modelling viscosity of diesel–vegetable oil mixtures within the tested composition and temperature ranges.
3.3. Neural Network-Based Models
A perturbation-based sensitivity study identified which inputs exert the strongest influence on viscosity prediction. Training-curve evolution, validation-loss tracking and overfitting diagnostics were incorporated to ensure reliable ANN generalisation.
The neural network-based models were developed using the scripts introduced in the earlier sections of this work. The aim of this procedure was to obtain trained neural network structures capable of computing the dynamic viscosity changes in the blend as functions of temperature and component content, while achieving a high goodness of fit to the measurement data.
A detailed set of ANN training diagnostics has been added, including training and validation loss curves, early stopping behaviour, and overfitting assessment. The training curves (Figure 16) show smooth convergence for both training and validation datasets, with no divergence indicating overfitting [71]. To further ensure model generalisation, validation loss was monitored using early-stopping criteria based on plateau detection. The added plots demonstrate that the selected network architecture is stable and provides reliable predictions across the full dataset.
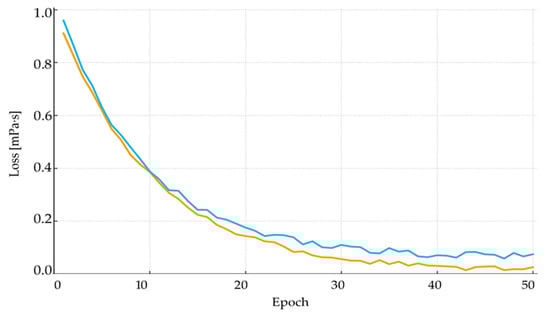
Figure 16.
ANN training and validation loss: blue line—training dataset error (training loss); orange line—validation dataset error (validation loss).
The general mathematical representation of this relationship is provided below:
where:
- FunNet—computational structure of the neural network;
- T—blend temperature [°C];
- um—mass fraction of vegetable oil in the diesel blend [% (m/m)].
Based on multiple training runs performed for numerous network configurations with different numbers of neurons in the hidden layer, and after analysing the goodness of fit to the measurement data and the networks’ susceptibility to overfitting (transition from data approximation to data interpolation), the structures characterised by the parameters listed in Table 10 were selected.
Table 10.
Results of fitting the dynamic viscosity models obtained through neural network training.
Figure 17 illustrates the behaviour of the model generated through neural network training process, describing dynamic viscosity variations as a function of liquid temperature and component content in the diesel–mustard oil blend, which achieved a coefficient of determination of R2 = 0.9975. The plot below also includes the points representing the measurement data.

Figure 17.
Quantitative model of dynamic viscosity variation [mPa·s] as a function of temperature [°C] and mass fraction of mustard oil [% (m/m)] in the diesel blend-model obtained through the neural network training process.
Figure 18 illustrates the behaviour of the model generated through neural network training process, describing dynamic viscosity variations as a function of liquid temperature and component content in the diesel–flaxseed oil blend, which achieved a coefficient of determination of R2 = 0.9995. The plot below also includes the points representing the measurement data.
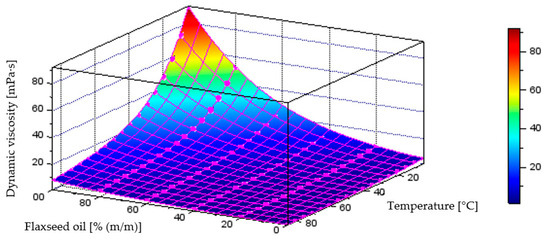
Figure 18.
Quantitative model of dynamic viscosity variation [mPa·s] as a function of temperature [°C] and mass fraction of flaxseed oil [% (m/m)] in the diesel blend-model obtained through the neural network training process.
Figure 19 illustrates the behaviour of the model generated through neural network training process, describing dynamic viscosity variations as a function of liquid temperature and component content in the diesel–camelina oil blend, which achieved a coefficient of determination of R2 = 0.9986. The plot below also includes the points representing the measurement data.
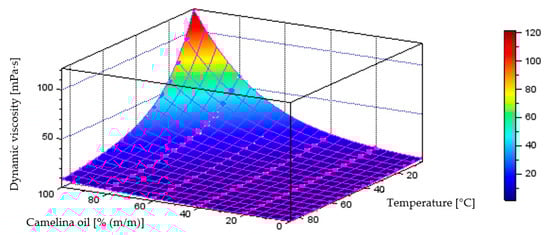
Figure 19.
Quantitative model of dynamic viscosity variation [mPa·s] as a function of temperature [°C] and mass fraction of camelina oil [% (m/m)] in the diesel blend - model obtained through the neural network training process.
Figure 20 illustrates the behaviour of the model generated through neural network training process, describing dynamic viscosity variations as a function of liquid temperature and component content in the diesel–rapeseed oil blend, which achieved a coefficient of determination of R2 = 0.9922. The plot below also includes the points representing the measurement data.
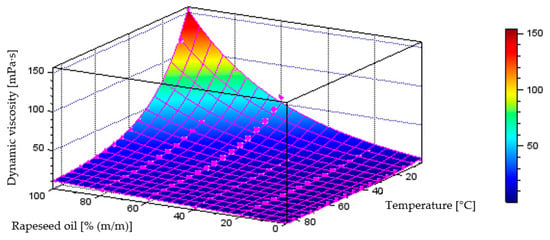
Figure 20.
Quantitative model of dynamic viscosity variation [mPa·s] as a function of temperature [°C] and mass fraction of rapeseed oil [% (m/m)] in the diesel blend - model obtained through the neural network training process.
3.4. Sensitivity Analysis (Empirical & ANN)
A perturbation-based sensitivity analysis was conducted for both the empirical model and the ANN. For the empirical model, viscosity sensitivity was evaluated with respect to parameters b1, b2 and b3 showing that parameter b2 (temperature coefficient) had the strongest influence on predicted viscosity. In the ANN-based approach, sensitivity to input temperature and vegetable-oil fraction was calculated using gradient propagation. The ANN sensitivity plot (Figure 21) shows that viscosity is most influenced by low-temperature regions and high oil content, indicating nonlinear relationships that are well captured by the neural network. This analysis highlights the robustness of both modelling approaches.
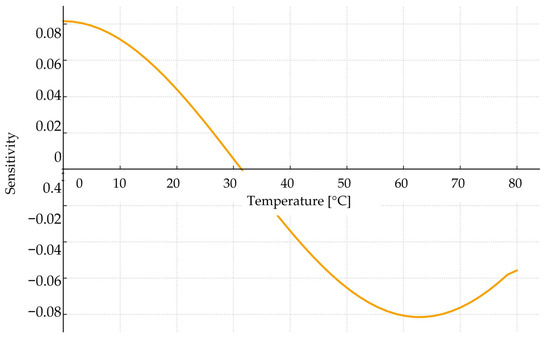
Figure 21.
Sensitivity analysis of viscosity model.
4. Discussion
The viscosity trends observed reflect the relationship between fatty-acid saturation and temperature-dependent flow behaviour, explaining differences among rapeseed, flaxseed and mustard oils.
The viscosity differences observed among the tested vegetable oils can be directly attributed to the interplay between fatty acid saturation, chain length and the degree of molecular packing. Oils dominated by polyunsaturated fatty acids, such as flaxseed oil, display markedly lower viscosity across the entire temperature range. The presence of multiple double bonds introduces kinks in the hydrocarbon chains, reducing the ability of neighbouring molecules to align and form cohesive intermolecular interactions. As a result, these oils maintain relatively high molecular mobility even at low temperatures. In contrast, oils rich in monounsaturated fatty acids, particularly those containing long-chain MUFA such as erucic acid in mustard oil, exhibit substantially higher viscosity. Longer chains and lower unsaturation promote stronger van der Waals forces, which hinder molecular slippage and increase resistance to flow. Rapeseed oil, dominated by oleic acid but containing moderate amounts of PUFA, demonstrates intermediate behaviour, illustrating how subtle shifts in the MUFA–PUFA ratio translate into measurable changes in flow properties. The temperature-dependent viscosity curves further highlight these compositional effects: unsaturated-rich oils show a sharper decline in viscosity with increasing temperature due to greater thermal activation of molecular movement, whereas MUFA-rich oils retain higher viscosity at low and mid-range temperatures. These mechanistic distinctions explain the systematic ordering of viscosity levels observed experimentally and form the foundation for the predictive performance of both the empirical and ANN models.
Although the general trend of shifting away from compression-ignition engines has been observed for more than a decade, many drivers still opt for diesel-powered vehicles. This is largely due to their overall driving characteristics, the power they provide, their lower fuel consumption during long-distance travel, their higher flexibility resulting from high torque output, and several other factors [72,73,74,75].
One of the fundamental criteria determining the suitability of biofuels for compression-ignition engines is their compliance with required physicochemical properties. Using vegetable oil in its natural form as a fuel for conventional compression-ignition engines introduces technical difficulties stemming from physicochemical properties that differ from those of diesel fuel, such as its substantially different chemical composition and distillation curve profile. The high end-point distillation temperature of rapeseed oil adversely affects fuel atomisation within the combustion chamber and the formation of a combustible mixture. The formation of the air-fuel mixture becomes more difficult, and a considerable portion of the fuel decomposes before reaching its boiling temperature. As a result, carbon deposits accumulate on injectors, in the combustion chamber, and on valves and pistons, which deteriorates overall engine performance [76,77,78,79].
Another issue associated with the use of vegetable oil as a fuel is its cetane number [80,81,82].
Viscosity is a measure of the resistance a fluid exhibits during flow. Dynamic viscosity, also referred to as absolute viscosity, characterises the force required to move one layer of oil relative to another. This parameter becomes particularly important at low temperatures. Kinematic viscosity, in turn, is defined as the ratio of dynamic viscosity to the density of the liquid. This parameter describes how easily the oil flows under gravitational forces while accounting for its density. Kinematic viscosity is measured using capillary viscometers, whereas dynamic viscosity at low temperatures is determined using a cold-cranking simulator [83,84,85].
One of the many parameters that determine the optimal performance of an engine is the uniform atomisation of the fuel blend, which is related to the kinematic viscosity of diesel fuel [86,87,88]. The viscosity of diesel fuel affects the droplet size of the atomised fuel blend in a diesel engine, as well as the ability of the mixture to move within the powertrain and maintain an adequate lubricating film on moving engine components [89,90,91].
It is important to note that the viscosity and density values of the analysed fuels are higher than those of conventional fuels, which complicates yet does not preclude the use of biofuels in piston engines [92,93,94,95].
Temperature influences several fuel properties that are critical for the processes occurring in the fuel injection system during fuel delivery, atomisation, vaporisation, and combustion within the cylinder. Differences in the chemical structure of the fuels used also lead to distinct behaviours and effects under varying temperature conditions [96,97,98,99]. The most significant differences concern changes in viscosity, density, and fuel behaviour at low temperatures.
The modelling results can also be interpreted in the context of the molecular structure of the tested oils. Blends containing oils with high PUFA content (e.g., flaxseed oil) follow a more rapid decrease in viscosity with increasing temperature, reflecting lower molecular packing density and weaker van der Waals interactions. In contrast, oils rich in MUFA and long-chain fatty acids (e.g., mustard and rapeseed oils) maintain higher viscosity across the entire temperature range. This structural differentiation additionally explains why the Grunberg–Nissan model, which explicitly incorporates contributions from both components, provided superior accuracy compared to the Arrhenius–Guzmán and Walther equations.
The viscosity trends observed across oils can be directly linked to their molecular structure. Flaxseed oil, rich in polyunsaturated linolenic acid, displays the lowest viscosity and strongest temperature dependence due to reduced molecular packing. Rapeseed and mustard oils, both rich in oleic acid (MUFA), maintain higher viscosity, especially at low temperatures, due to stronger cohesive forces. Camelina oil, with a mixed fatty acid profile, shows intermediate viscosity values. These mechanistic insights support the observed differences in blending behaviour and confirm the importance of chemical composition in predicting viscosity.
Viscosity plays a critical role in engine fuel injection, influencing injection timing, spray penetration, droplet size distribution, and atomization quality. Higher viscosity delays needle lift dynamics, increases pumping effort, and leads to larger droplet sizes, reducing spray homogeneity. Conversely, lower viscosity improves atomization but may reduce lubricity. The vegetable-oil blends that display high viscosity at low temperature may adversely affect spray formation, particularly under cold start conditions. These implications underline the importance of accurate viscosity prediction for developing fuel blends suitable for modern diesel injection systems.
5. Conclusions
Based on the conducted study, the following conclusions were formulated:
- The experiments produced measurement data characterised by high repeatability of dynamic viscosity values, indicating that the experimental setup was properly prepared and that the selected dynamic viscosity measurement ranges were appropriate. The experimental setup also demonstrates high precision in the obtained measurement results.
- The measurement results shown in the plots, along with their analysis, reveal that vegetable oils exhibit significantly higher dynamic viscosity values at identical temperatures compared with diesel fuel. This is an undesirable effect when raw vegetable oils are used as fuels in compression-ignition engines, as it may lead to malfunction or even damage of the fuel system (with modern Common Rail systems being particularly sensitive to changes in dynamic viscosity).
- The decrease in dynamic viscosity observed with increasing temperature in the examined blends follows an exponential pattern, confirming the validity of the empirical model forms adopted based on the literature.
- Empirical (mathematical) models were developed for each vegetable oil–diesel blend as functions of temperature and component content, all of which exhibited high coefficients of determination, with R2 values exceeding 0.99. This confirms that the mathematical relationship form selected on the basis of the literature was appropriate.
- The applied models describing dynamic viscosity changes as functions of temperature and component content in vegetable oil–diesel blends also achieved high goodness of fit to the measurement data, with R2 values above 0.99. This confirms that the neural network training process and the choice of optimal network structures were appropriate.
- The resulting empirical models and neural network models may serve as a foundation for developing simulations and control systems in hydraulic (fuel) systems involving the flow of vegetable oil–diesel blends.
- Implications for fuel systems: High viscosity at low temperatures affects injector dynamics, spray atomisation and pump load, particularly in blends with high vegetable oil content.
Author Contributions
Conceptualisation, K.T., R.M., Ł.G., T.N. and K.K.; methodology, K.T., R.M., Ł.G., T.N. and K.K.; software, K.T., R.M., Ł.G., T.N. and K.K.; validation, K.T. and R.M.; formal analysis, K.T., R.M., Ł.G., T.N. and K.K.; investigation, K.T., R.M., Ł.G. and T.N.; data curation, K.T., R.M., Ł.G., T.N., and K.K.; writing—original draft preparation, K.T., R.M., Ł.G., T.N. and K.K.; writing—review and editing, K.T., R.M., Ł.G., T.N. and K.K.; visualisation, K.T., R.M., Ł.G., T.N. and K.K.; supervision, K.T., R.M., Ł.G., T.N. and K.K. All authors have read and agreed to the published version of the manuscript.
Funding
This research received no external funding.
Institutional Review Board Statement
Not applicable.
Informed Consent Statement
Not applicable.
Data Availability Statement
The data presented in this study are available on request from the corresponding author.
Conflicts of Interest
The authors declare no conflicts of interest.
References
- Yalcin, H.; Toker, O.S.; Dogan, M. Effect of Oil Type and Fatty Acid Composition on Dynamic and Steady Shear Rheology of Vegetable Oils. J. Oleo Sci. 2012, 61, 181–187. [Google Scholar] [CrossRef]
- Kim, J.; Kim, D.N.; Lee, S.H.; Yoo, S.H.; Lee, S. Correlation of Fatty Acid Composition of Vegetable Oils with Rheological Behaviour and Oil Uptake. Food Chem. 2010, 118, 398–402. [Google Scholar] [CrossRef]
- Stanciu, I. A New Mathematical Model for the Viscosity of Vegetable Oils Based on Freely Sliding Molecules. Grasas Aceites 2019, 70, e318. [Google Scholar] [CrossRef]
- Stanciu, I. Rheological behavior of biodegradable lubricant based on soybean oil. J. Sci. Arts 2019, 19, 703–708. [Google Scholar]
- Barisa, A.; Rosa, M. A system dynamics model for CO2 emission mitigation policy design in road transport sector. Energy Procedia 2018, 147, 419–427. [Google Scholar] [CrossRef]
- Shepel, O.; Matijošius, J.; Rimkus, A.; Orynycz, O.; Tucki, K.; Świć, A. Combustion, Ecological, and Energetic Indicators for Mixtures of Hydrotreated Vegetable Oil (HVO) with Duck Fat Applied as Fuel in a Compression Ignition Engine. Energies 2022, 15, 7892. [Google Scholar] [CrossRef]
- Tucki, K.; Mruk, R.; Orynycz, O.; Gola, A. The Effects of Pressure and Temperature on the Process of Auto-Ignition and Combustion of Rape Oil and Its Mixtures. Sustainability 2019, 11, 3451. [Google Scholar] [CrossRef]
- Krzywonos, M.; Tucki, K.; Wojdalski, J.; Kupczyk, A.; Sikora, M. Analysis of Properties of Synthetic Hydrocarbons Produced Using the ETG Method and Selected Conventional Biofuels Made in Poland in the Context of Environmental Effects Achieved. Rocz. Ochr. Sr. 2017, 19, 394–410. [Google Scholar]
- Xiao, H.; Guo, F.; Li, S.; Wang, R.; Yang, X. Combustion performance and emission characteristics of a diesel engine burning biodiesel blended with n-butanol. Fuel 2019, 258, 115887. [Google Scholar] [CrossRef]
- Tucki, K. A Computer Tool for Modelling CO2 Emissions in Driving Cycles for Spark Ignition Engines Powered by Biofuels. Energies 2021, 14, 1400. [Google Scholar] [CrossRef]
- Herran, D.S.; Tachiiri, K.; Matsumoto, K. Global energy system transformations in mitigation scenarios considering climate uncertainties. Appl. Energy 2019, 243, 119–131. [Google Scholar] [CrossRef]
- Engström, E.; Algers, S.; Hugosson, M.B. The choice of new private and benefit cars vs. climate and transportation policy in Sweden. Transp. Res. Part D Transp. Environ. 2019, 69, 276–292. [Google Scholar] [CrossRef]
- Brodny, J.; Tutak, M. The analysis of similarities between the European Union countries in terms of the level and structure of the emissions of selected gases and air pollutants into the atmosphere. J. Clean. Manuf. 2021, 279, 123641. [Google Scholar] [CrossRef]
- Borucka, A.; Wiśniowski, P.; Mazurkiewicz, D.; Świderski, A. Laboratory measurements of vehicle exhaust emissions in conditions reproducing real traffic. Measurement 2021, 174, 108998. [Google Scholar] [CrossRef]
- Giampieri, A.; Ling-Chin, J.; Ma, Z.; Smallbone, A.; Roskilly, A.P. A review of the current automotive manufacturing practice from an energy perspective. Appl. Energy 2020, 261, 114074. [Google Scholar] [CrossRef]
- Tucki, K. A Computer Tool for Modelling CO2 Emissions in Driving Tests for Vehicles with Diesel Engines. Energies 2021, 14, 266. [Google Scholar] [CrossRef]
- Mikulski, M.; Ambrosewicz-Walacik, M.; Duda, K.; Hunicz, J. Performance and emission characterization of a common-rail compression-ignition engine fuelled with ternary mixtures of rapeseed oil, pyrolytic oil and diesel. Renew. Energy 2020, 148, 739–755. [Google Scholar] [CrossRef]
- Gwardiak, H.; Rozycki, K.; Ruszkarska, M.; Tylus, J.; Walisiewicz-Niedbalska, W. Evaluation of fatty acid methyl esters (FAME) obtained from various feedstock. Rośliny Oleiste Oilseed Crops 2011, 32, 137–147. [Google Scholar]
- Söyler, H.; Balki, M.K. Chemical fingerprinting and cluster-based evaluation of vegetable oils for biodiesel applications. Case Stud. Therm. Eng. 2025, 73, 106703. [Google Scholar] [CrossRef]
- Kumar, A.; Mohan, I.; Lata, D.B. Modelling to predict performance and emission parameters of hydrogen, additive and nano-particles blended fuel in a dual-fuel diesel engine through artificial neural network. Int. J. Hydrogen Energy 2024, 80, 599–611. [Google Scholar]
- Thiagarajan, S.; Damodaran, A.; Seetharaman, S.; Varuvel, E.G. Influence of hydrogen-assisted combustion in compression ignition engines fueled with fuel blends of pine oil and waste cooking oil biodiesel using toroidal combustion chamber. Int. J. Hydrogen Energy 2024, 74, 246–258. [Google Scholar] [CrossRef]
- Ghiasi, M.M.; Mohammadzadeh, O.; Zendehboudi, S. Reliable connectionist tools to determine biodiesel cetane number based on fatty acids methyl esters content. Energy Convers. Manag. 2022, 264, 115601. [Google Scholar] [CrossRef]
- Noushabadi, A.S.; Dashti, A.; Raji, M.; Zarei, A.; Mohammadi, A.H. Estimation of cetane numbers of biodiesel and diesel oils using regression and PSO-ANFIS models. Renew. Energy 2020, 158, 465–473. [Google Scholar] [CrossRef]
- Yahya, S.I.; Aghel, B. Estimation of kinematic viscosity of biodiesel-diesel blends: Comparison among accuracy of intelligent and empirical paradigms. Renew. Energy 2021, 177, 318–326. [Google Scholar] [CrossRef]
- DeOliveira, E.; Quirino, R.L.; Suarez, P.A.Z.; Prado, A.G.S. Heats of combustion of biofuels obtained by pyrolysis and by transesterification and of biofuel/diesel blends. Thermochim. Acta 2006, 450, 87–90. [Google Scholar] [CrossRef]
- Alabi, O.O.; Gbadeyan, O.J.; Bala, A.; Ogunsiji, G.O.; Deenadayalu, N. Study of combustion characteristics of diesel-vegetable oil blends utilizing an industrial fuel burner. Fuel Commun. 2024, 18, 100104. [Google Scholar] [CrossRef]
- Karthickeyan, V. Effect of combustion chamber bowl geometry modification on engine performance, combustion and emission characteristics of biodiesel fuelled diesel engine with its energy and exergy analysis. Energy 2019, 176, 830–852. [Google Scholar] [CrossRef]
- Atmanli, A.; Ileri, E.; Yilmaz, N. Optimization of diesel–butanol–vegetable oil blend ratios based on engine operating parameters. Energy 2016, 96, 569–580. [Google Scholar] [CrossRef]
- Naik, B.D.; Meivelu, U.; Thangarasu, V.; Annamalai, S.; Sivasankaralingam, V. Experimental and empirical analysis of a diesel engine fuelled with ternary blends of diesel, waste cooking sunflower oil biodiesel and diethyl ether. Fuel 2022, 320, 123961. [Google Scholar] [CrossRef]
- Franco, Z.; Nguyen, Q.D. Flow properties of vegetable oil–diesel fuel blends. Fuel 2011, 90, 838–843. [Google Scholar] [CrossRef]
- Esteban, B.; Riba, J.R.; Baquero, G.; Rius, A.; Puig, R. Temperature dependence of density and viscosity of vegetable oils. Biomass Bioenergy 2012, 42, 164–171. [Google Scholar] [CrossRef]
- Dabi, M.; Saha, U.K. Application potential of vegetable oils as alternative to diesel fuels in compression ignition engines: A review. J. Energy Inst. 2019, 92, 1710–1726. [Google Scholar] [CrossRef]
- Vera-Rozo, J.R.; Sáez-Bastante, J.; Carmona-Cabello, M.; Riesco-Ávila, J.M.; Avellaneda, F.; Pinzi, S.; Dorado, M.P. Cetane Index Prediction Based on Biodiesel Distillation Curve. Fuel 2022, 321, 124063. [Google Scholar] [CrossRef]
- Mehra, K.S.; Goel, V. Unveiling Next-Generation Biodiesel Technologies: Techno-Economic and Energy Breakthroughs for Sustainable Production. Biomass Bioenergy 2025, 199, 107910. [Google Scholar] [CrossRef]
- Mohammadpour, J.; Salehi, F. A review of alternative liquid fuels in marine engines. Appl. Energy Combust. Sci. 2025, 24, 100394. [Google Scholar] [CrossRef]
- Satapathy, C.; Nayak, S.K.; Mishra, P.C.; Kaliappan, N.; Priya, K.K. Assessment of engine characteristics in dual-fuel mode using post-mixed biodiesel and coconut shell producer gas. Results Eng. 2025, 27, 106976. [Google Scholar] [CrossRef]
- Yang, F.; Wang, X.; Tan, H.; Liu, Z. Improvement the viscosity of imidazolium-based ionic liquid using organic solvents for biofuels. J. Mol. Liq. 2017, 248, 626–633. [Google Scholar] [CrossRef]
- Yang, X.; Liu, Q.; Ma, Y.; Xie, J.; Cao, B. Molecular dynamics study on the kinematic viscosity, density and structure of fuel blends containing n-decane and biofuel compound of ethyl decanoate or ethyl dodecanoate. J. Mol. Liq. 2023, 379, 121680. [Google Scholar] [CrossRef]
- Cengiz, E.; Babagiray, M.; Aysal, F.E.; Aksoy, F. Kinematic viscosity estimation of fuel oil with comparison of machine learning methods. Fuel 2022, 316, 123422. [Google Scholar] [CrossRef]
- Shu, Q.; Yu, C.; Cai, D.; Xiong, D. Application of mixture topological index method to predict the dynamic viscosity of the hypothetical acidic oils-based biodiesel fuels. Renew. Energy 2012, 41, 152–158. [Google Scholar] [CrossRef]
- Wcisło, G. Determining rheological properties of diesel fuel and biofuels obtained from false flax (Camelina sativa). Inżynieria Rol. 2009, 5, 295–301. [Google Scholar]
- Wcisło, G. Determination of temperature impact on dynamic viscosity of plant biofuels. Inżynieria Rol. 2008, 10, 277–282. [Google Scholar]
- Abdellatief, T.M.M.; Handawy, M.K.M.; Kamel, A.; Abdelmotalib, H.M.; Mustafa, A.; Jamil, F.; Duan, X.; Salameh, T.; Hamid, A.-K.; Hussein, M. Fueling the future: Emission characteristics and sustainability of high-octane gasoline biofuels derived from lignocellulosic biomass. Results Eng. 2025, 26, 105347. [Google Scholar] [CrossRef]
- Küüt, A.; Ilves, R.; Küüt, K.; Raide, V.; Ritslaid, K.; Olt, J. Influence of European Union Directives on the Use of Liquid Biofuel in the Transport Sector. Procedia Eng. 2017, 187, 30–39. [Google Scholar] [CrossRef]
- Tucki, K.; Bączyk, A.; Klimkiewicz, M.; Mączyńska, J.; Sikora, M. Crude rapeseed oil as a fuel for vehicle propulsion. IOP Conf. Ser. Earth Environ. Sci. 2019, 214, 012103. [Google Scholar] [CrossRef]
- Tucki, K.; Bączyk, A.; Klimkiewicz, M.; Mączyńska, J.; Sikora, M. Comparison of energy performance and toxicity of diesel engine fuelled with diesel oil, rapeseed oil and oil mixture. IOP Conf. Ser. Earth Environ. Sci. 2019, 214, 012102. [Google Scholar] [CrossRef]
- Guo, T.; Li, G.; Li, H.; Huo, H.; Zhang, X.; Wang, Z.; Bai, H. Experimental study on the effects of fuel properties on spray macroscopic characteristics, particle size distribution, and velocity field in a constant volume chamber. Exp. Therm. Fluid Sci. 2026, 171, 111602. [Google Scholar] [CrossRef]
- Hafis, M.; Balaji, K.; Tamilarasan, N.; Senthilkumar, D.; Sakthivel, R. A review on alternative fuels: Spray characteristics, engine performance and emissions effect. Sustain. Futures 2025, 9, 100456. [Google Scholar] [CrossRef]
- Meffan, C.; Menges, J.; Mak, D.; Dolamore, F.; Fee, C.; Nock, V.; Dobson, R.C.J. A versatile capillaric circuits microfluidic viscometer. Sens. Actuators A Phys. 2023, 359, 114497. [Google Scholar] [CrossRef]
- Lee, E.; Kim, B.; Choi, S. Hand-held, automatic capillary viscometer for analysis of Newtonian and non-Newtonian fluids. Sens. Actuators A Phys. 2020, 313, 112176. [Google Scholar] [CrossRef]
- Hapanowicz, J. Influence of the adopted rheological model of plant suspension on the predicted resistance of its flow in the pipe. Powder Technol. 2022, 410, 117912. [Google Scholar] [CrossRef]
- Wichterle, K.; Večeř, M. Simple problems in fluid flows. In Transport and Surface Phenomena; Wichterle, K., Večeř, M., Eds.; Elsevier: Amsterdam, The Netherlands, 2020; pp. 79–88. [Google Scholar] [CrossRef]
- Singh, P.; Sharma, K.; Puchades, I.; Agarwal, P.B. A comprehensive review on MEMS-based viscometers. Sens. Actuators A Phys. 2022, 338, 113456. [Google Scholar] [CrossRef]
- Wang, J.; Zhao, Y.; Dong, X.; Wang, F.; Li, H.; Zhong, Q.; Yao, X.; Gong, M. Corrigendum to “A vibrating-wire viscometer and measured viscosity data of compressed liquid carbon dioxide at temperatures from 218.150 to 273.150 K and pressures up to 13 MPa” [J. Mol. Liq. 310 (2020) 113208]. J. Mol. Liq. 2021, 329, 115575. [Google Scholar] [CrossRef]
- Málek, J.; Rajagopal, K.R. Mathematical issues concerning the Navier–Stokes equations and some of its generalizations. In Handbook of Differential Equations: Evolutionary Equations; Dafermos, C.M., Feireisl, E., Eds.; North-Holland: Amsterdam, The Netherlands, 2005; Volume 2, pp. 371–459. [Google Scholar] [CrossRef]
- Tokpavi, D.L.; Magnin, A.; Jay, P. Very slow flow of Bingham viscoplastic fluid around a circular cylinder. J. Non-Newton. Fluid Mech. 2008, 154, 65–76. [Google Scholar] [CrossRef]
- Takeuchi, A.; Kato, H.; Inoue, A. Vogel–Fulcher–Tammann plot for viscosity scaled with temperature interval between actual and ideal glass transitions for metallic glasses in liquid and supercooled liquid states. Intermetallics 2010, 18, 406–411. [Google Scholar] [CrossRef]
- Haj-Kacem, R.B.; Ouerfelli, N.; Herráez, J.V.; Guettari, M.; Hamda, H.; Dallel, M. Contribution to modeling the viscosity Arrhenius-type equation for some solvents by statistical correlations analysis. Fluid Phase Equilibria 2014, 383, 11–20. [Google Scholar] [CrossRef]
- Bajić, D.M.; Šerbanović, S.P.; Živković, E.M.; Jovanović, J.; Kijevčanin, M.L. Prediction and correlation of viscosity of binary mixtures of ionic liquids with organic solvents. J. Mol. Liq. 2014, 197, 1–6. [Google Scholar] [CrossRef]
- DVNext Rheometer. Available online: https://www.perlan.com.pl/uploaded/AppBundleEntityBlockFilesWithImageElement/filePath/107/wiskozymetr-reometr-ametek-brookfield-dvnext.pdf (accessed on 20 November 2025).
- PN-EN ISO 5508:1996; Oleje i Tłuszcze Roślinne oraz Zwierzęce—Analiza Estrów Metylowych Kwasów Tłuszczowych Metodą Chromatografii Gazowej. Polski Komitet Normalizacyjny: Warsaw, Poland, 1996.
- PN-EN ISO 5509:2001; Oleje i Tłuszcze Roślinne oraz Zwierzęce—Przygotowanie Estrów Metylowych Kwasów tłuszczowych. Polski Komitet Normalizacyjny: Warsaw, Poland, 2001.
- Sagan, A.; Blicharz-Kania, A.; Szmigielski, M.; Andrejko, D.; Sobczak, P.; Zawiślak, K.; Starek, A. Assessment of the Properties of Rapeseed Oil Enriched with Oils Characterized by High Content of α-linolenic Acid. Sustainability 2019, 11, 5638. [Google Scholar] [CrossRef]
- Zaborowska, Z. Effect of rape seeds dehulling process on quality and nutritive value of cold-pressed rapeseed oils. Postępy Nauk. I Technol. Przemysłu Rolno-Spożywczego 2016, 71, 46–57. [Google Scholar]
- Lewinska, A.; Zebrowski, J.; Duda, M.; Gorka, A.; Wnuk, M. Fatty Acid Profile and Biological Activities of Linseed and Rapeseed Oils. Molecules 2015, 20, 22872–22880. [Google Scholar] [CrossRef]
- Ratusz, K.; Symoniuk, E.; Wroniak, M.; Rudzińska, M. Bioactive Compounds, Nutritional Quality and Oxidative Stability of Cold Pressed Camelina (Camelina sativa L.) Oils. Appl. Sci. 2018, 8, 2606. [Google Scholar] [CrossRef]
- Rakita, S.; Spasevski, N.; Savić, I.; Savić Gajić, I.; Lazarević, J.; Dragojlović, D.; Đuragić, O. Comparative Evaluation of Camelina Seed Oils Obtained by Cold Pressing and Solvent Extraction. Foods 2024, 13, 3605. [Google Scholar] [CrossRef]
- Gandova, V.; Teneva, O.; Petkova, Z.; Iliev, I.; Stoyanova, A. Lipid Composition and Physicochemical Parameters of Flaxseed Oil (Linum usitatissimum L.) from Bulgaria. Appl. Sci. 2023, 13, 10141. [Google Scholar] [CrossRef]
- López Argüello, E.; Barrera Vázquez, C.; Bosch Bosch, N. Analytical study of the composition of fatty acid of mustard and mustard sauces. Grasas Y Aceites 1999, 50, 444–447. [Google Scholar] [CrossRef]
- Özcan, M.M.; Uslu, N.; Yalım, N.; Kandil, M.; Namalan, Z.; Atasoy, Z.B. White mustard (Sinapis alba L.) seeds: The role of oven and microwave roasting on their bioactive components, antioxidant potential, fatty acids and mineral contents. Eur. Food Res. Technol. 2024, 250, 1563–1572. [Google Scholar] [CrossRef]
- Loss Functions and Their Use In Neural Networks. Available online: https://towardsdatascience.com/loss-functions-and-their-use-in-neural-networks-a470e703f1e9/ (accessed on 10 December 2025).
- Bonilla, D.; Bishop, J.D.K.; Axon, C.J.; Banister, D. Innovation, the diesel engine and vehicle markets: Evidence from OECD engine patents. Transp. Res. Part D Transp. Environ. 2014, 27, 51–58. [Google Scholar] [CrossRef]
- Abadie, L.M.; Goicoechea, N. Powering newly constructed vessels to comply with ECA regulations under fuel market prices uncertainty: Diesel or dual fuel engine? Transp. Res. Part D Transp. Environ. 2019, 67, 433–448. [Google Scholar] [CrossRef]
- Tabarnoust, E.; Mghari, M.; Zaz, Y. Moroccan used cars dataset: Insights into the used car market. Data Brief 2025, 63, 112087. [Google Scholar] [CrossRef] [PubMed]
- Skribans, V.; Kotlars, A. European cargo vehicle market dataset for 2023. Data Brief 2024, 55, 110648. [Google Scholar] [CrossRef]
- Ülgen, A.I.; Çelebi, Y.; Aydın, H. High proportion of biofuel replacement for conventional diesel using safflower biodiesel and diethyl ether blends in a CNG-powered RCCI operation of a diesel engine. Renew. Energy 2025, 246, 122919. [Google Scholar] [CrossRef]
- Tucki, K.; Mruk, R. Experimental research on the influence of the composition of the fuel mixture on the operating parameters of a single-cylinder Common Rail diesel engine. Adv. Sci. Technol. Res. J. 2022, 16, 100–109. [Google Scholar] [CrossRef] [PubMed]
- Çakmak, A. Comparative research on acetone-butanol-ethanol (ABE) and butanol (Bu) as next-generation biofuels in compression ignition engine. Therm. Sci. Eng. Prog. 2024, 55, 102956. [Google Scholar] [CrossRef]
- Zikri, J.M.; Sani, M.S.M.; Adam, A. Exploring the world of diesel engines: Analyzing noise and vibration characteristics with biodiesel application. Renew. Sustain. Energy Rev. 2026, 226, 116168. [Google Scholar] [CrossRef]
- Lotko, W. Vegatable fuels and the toxic component emission in exhaust gas. Arch. Motoryz. 2000, 3, 153–163. [Google Scholar]
- Szczypiński-Sala, W. Influence of rape oil addition to mineral diesel fuel on electromagnetic fuel injectors characteristic. Logistyka 2014, 5, 1521–1526. [Google Scholar]
- Wielligh, A.V.; Burger, N.D.L.; Wilcocks, T.L. Diesel engine failures due to combustion disturbances, caused by fuel with insufficient lubricity. Ind. Lubr. Tribol. 2003, 55, 65–75. [Google Scholar] [CrossRef]
- Skrzyńska, E.; Matyja, M. Comparison of the physicochemical properties of select natural fats and their methyl esters. Chemik 2011, 65, 923–935. [Google Scholar]
- Ramadhas, A.S.; Muraleedharan, C.; Jayaraj, S. Performance and emission evaluation of a diesel engine fueled with methyl esters of rubber seed oil. Renew. Energy 2005, 30, 1789–1800. [Google Scholar] [CrossRef]
- Lotko, W. Estimation of exhaust gas emission of diesel engine fuelled with blends of diesel oil with rapeseed oil methyl esters. Arch. Motoryz. 2006, 4, 403–410. [Google Scholar]
- Plotnikov, L.; Grigoriev, N. Modernization of the Mechanical Fuel System of a Diesel Locomotive Engine through Physical and Numerical Modeling. Energies 2021, 14, 8554. [Google Scholar] [CrossRef]
- El Marnissi, Y.; Hwang, J. Microscopic Imaging on Diesel Spray and Atomization Process. Processes 2024, 12, 359. [Google Scholar] [CrossRef]
- Liu, R.; Huang, K.; Qiao, Y.; Ji, H.; Zhong, L.; Wu, H. Effects of Low Pressure Injection on Fuel Atomization and Mixture Formation for Heavy Fuel Engines. Processes 2022, 10, 2276. [Google Scholar] [CrossRef]
- Zhai, C.; Li, K.; Dong, P.; Jin, Y.; Luo, H.; Zhou, B.; Liu, Y. Experimental Study on the Spray Characteristics of Diesel and Hydrotreated Vegetable Oil (HVO) Fuels under Different Injection Pressures. Processes 2024, 12, 1697. [Google Scholar] [CrossRef]
- Naruemon, I.; Liu, L.; Liu, D.; Ma, X.; Nishida, K. An Analysis on the Effects of the Fuel Injection Rate Shape of the Diesel Spray Mixing Process Using a Numerical Simulation. Appl. Sci. 2020, 10, 4983. [Google Scholar] [CrossRef]
- Nguyen, T.Q.; Dunin, A.Y. Investigation into the Impact of Piston Bowl Size on Diesel Engine Characteristics with Changes in Fuel Injection Pressure and Boost Pressure. Appl. Sci. 2024, 14, 4334. [Google Scholar] [CrossRef]
- Tesfa, B.; Mishra, R.; Gu, F.; Powles, N. Prediction Models for Density and Viscosity of Biodiesel and Their Effects on Fuel Supply System in CI Engines. Renew. Energy 2010, 35, 2752–2760. [Google Scholar] [CrossRef]
- Gao, Y.; Deng, J.; Li, C.; Dang, F.; Liao, Z.; Wu, Z.; Li, L. Experimental Study of the Spray Characteristics of Biodiesel Based on Inedible Oil. Biotechnol. Adv. 2009, 27, 616–624. [Google Scholar] [CrossRef]
- Krisnangkura, K.; Yimsuwan, T.; Pairintra, R. An Empirical Approach in Predicting Biodiesel Viscosity at Various Temperatures. Fuel 2006, 85, 107–113. [Google Scholar] [CrossRef]
- Rajak, U.; Verma, T.N.; Allamraju, K.V.; Kumar, R.; Le, Q.H.; Pugazhendhi, A. Effects of Different Biofuels and Their Mixtures with Diesel Fuel on Diesel Engine Performance and Exhausts. Sci. Total Environ. 2023, 903, 166501. [Google Scholar] [CrossRef]
- Khan, E.; Ozaltin, K.; Spagnuolo, D.; Bernal-Ballen, A.; Piskunov, M.V.; Di Martino, A. Biodiesel from Rapeseed and Sunflower Oil: Effect of the Transesterification Conditions and Oxidation Stability. Energies 2023, 16, 657. [Google Scholar] [CrossRef]
- Markov, V.; Kamaltdinov, V.; Devyanin, S.; Sa, B.; Zherdev, A.; Furman, V. Investigation of the Influence of Different Vegetable Oils as a Component of Blended Biofuel on Performance and Emission Characteristics of a Diesel Engine for Agricultural Machinery and Commercial Vehicles. Resources 2021, 10, 74. [Google Scholar] [CrossRef]
- Eremeeva, A.M.; Ilyushin, Y.V. Temperature Control During Storage of Raw Materials in the Process of Biodiesel Fuel Production. Inventions 2025, 10, 7. [Google Scholar] [CrossRef]
- Jankowski, K.J.; Sokólski, M.; Załuski, D. Winter Oilseed Rape: Agronomic Management in Different Tillage Systems and Energy Balance. Energy 2023, 277, 127590. [Google Scholar] [CrossRef]
Disclaimer/Publisher’s Note: The statements, opinions and data contained in all publications are solely those of the individual author(s) and contributor(s) and not of MDPI and/or the editor(s). MDPI and/or the editor(s) disclaim responsibility for any injury to people or property resulting from any ideas, methods, instructions or products referred to in the content. |
© 2025 by the authors. Licensee MDPI, Basel, Switzerland. This article is an open access article distributed under the terms and conditions of the Creative Commons Attribution (CC BY) license (https://creativecommons.org/licenses/by/4.0/).