Abstract
The stability and safety of the vertical shaft during construction is an important problem for deep mining engineering because of the high in situ stresses. This paper conducts experimental studies on the difficulty of shaft support during the construction of No. 6 deep shaft at the Huize Mine, Yunnan Province, China. Based on the rule of similarity test, a similar material formula was developed, and standard model samples of the vertical shaft were prepared. Three different support methods were set up, including steel fiber-reinforced concrete support, drilling pressure relief support, and slot filling support. The experiments were conducted by using a true triaxial test system, and the testing process was monitored by a static stress–strain gauge and an acoustic emission system. The experimental results show that the integrity of the borehole pressure relief support shaft is optimal under the in situ stress. As the maximum principal stress increases to the instability and failure of the shaft, the peak load, cumulative number, and energy of acoustic emission events were the highest using the steel fiber concrete support method, and the peak load was the lowest using the borehole pressure relief. The borehole pressure relief transfers the stress around the shaft to the deep part. Although it ensures the integrity of the shaft, it causes internal damage to the shaft, reduces the energy storage of the shaft, and results in the lowest cumulative number and energy of acoustic emission events. After the instability and failure of the shaft, the average block size of the shaft debris is the highest under the borehole pressure relief support along the direction of the maximum principal stress. On the other hand, the mechanical properties of samples with different support methods under dynamic load conditions are studied by applying external low-frequency disturbances, and the test conclusions have been verified through numerical simulation. Field tests have verified that the steel fiber-reinforced concrete lining support can maintain the integrity of the deep shaft wall and ensure safety during mining production.
1. Introduction
With the increasing mining depth of metal mines, vertical shafts have become the primary choice for the development of deep metal mines due to their strong adaptability, fast lifting speed, and strong capabilities. The depth of vertical shaft construction in countries such as the United States, Russia, and Canada exceeds 1500 m [1]. There are also nearly a hundred thousand deep vertical shafts in China. The construction of deep vertical shafts faces geological challenges such as three “high” and one “disturbance” [2], (High In Situ Stress; High Geothermal Temperature; High Karst Water Pressure; Mining-Induced Disturbance), as well as technical difficulties such as poor self-stabilization ability of the surrounding rock mass, difficulty in shaft support, and easy expansion and softening when encountering water. Under the high-ground stress, the surrounding rock around the shaft deforms, and the concrete lining support layer of the vertical shaft fails to undergo synergistic deformation, thereby generating shear stress; under this condition, the shotcrete lining of the shaft is prone to cracking and damage of the support layer, as well as exposed steel bars after a period, as shown in Figure 1. The construction of deep vertical shaft engineering is an important vertical channel for personnel and equipment in deep resource exploitation, which directly affects the safe and efficient exploitation of deep resources. Improper support of vertical shafts may lead to sudden disasters, which will pose significant safety hazards to mining safety production [3,4].
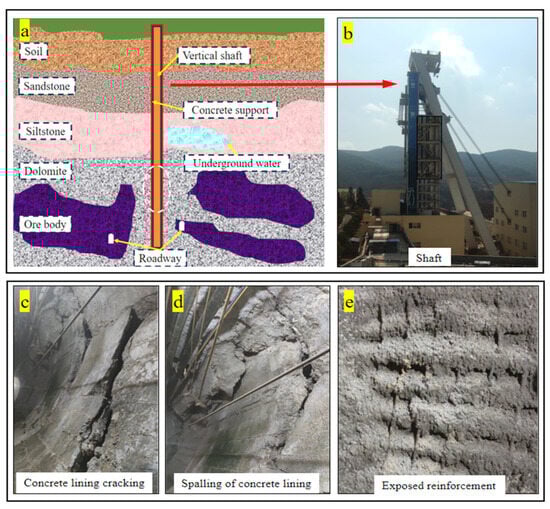
Figure 1.
Spalling of the lining support layer on the shaft wall in a deep vertical shaft. (a) Schematic diagram of the geological environmental setting of a deep vertical shaft; (b) ground view of the deep vertical shaft; (c) cracking of the concrete lining in the deep vertical shaft; (d) spalling of the concrete lining; (e) exposed reinforcement of the shot concrete in the deep vertical shaft.
Some scholars have conducted extensive research on stress laws, fracture mechanisms, and support methods of vertical shafts. Yang et al. [5] found that the failure of vertical shafts was caused by the settlement of overlying soil, which generated negative frictional forces that increase with depth, defined as vertical additional stress. On this basis, Wang et al. [6] developed different types of shaft structures and proposed a calculation formula for determining shaft thickness based on the maximum geo-stress. He et al. [7] combined elastic mechanics with the Coulomb–Navier strength criterion to comprehensively study the design of vertical shaft structure. Liu et al. [8] analyzed the problems existing in the current theory and design from the aspects of stress analysis of surrounding rock of ultra-deep shaft, shaft section structure design, as well as shaft support structure, and put forward the core theoretical technologies that need to be addressed in the construction of ultra-deep shafts. Akopyan [9] conducted research on the process of mine shaft failure and instability. Guz [10] analyzed the stability of surrounding rock during the construction of mine shafts, while Konstantinova and Chernopazov [11] analyzed stress changes under deep shaft support conditions by numerical simulations.
The above research tends to focus on theoretical and numerical simulations of shafts, without conducting experimental research. However, the complex and variable working conditions in mining sites require corresponding experimental research. Su et al. [12] conducted rockburst tests on deep rock masses under true triaxial stress conditions coupled with low-frequency disturbance, exploring the failure laws of rock masses under different disturbances in deep areas; Chen [13] conducted model experiments using physically similar materials and conducted in-depth research on the process and mechanism of roadway instability and failure. Feng et al. [14] carried out true triaxial tests. The sample exhibited different degrees of block ejection and splashing during the dynamic disturbance stage, which was reflected in the typical strain-type rockburst characteristics. The statistics of experimental research on the stability of vertical shaft support by scholars are shown in Table 1. However, scholars have not fully considered the research on the mechanism of mine shaft failure and support schemes, and the observation methods are limited. It is necessary to use multiple monitoring methods to monitor the entire process of shaft failure under various support methods and reveal the mechanical performance laws and failure mechanisms of shaft under different support methods.
For the construction of deep vertical shafts, a single concrete lining support cannot effectively control rock deformation. This problem has not been fundamentally solved by thickening the shaft or increasing the concrete strength, and a more ideal shaft structure should be sought. Based on this, according to the actual working condition background of the deep shaft fragmentation and difficult support in Huize Mine, Yunnan Province, six different vertical shaft support methods were designed to conduct similar simulation tests. Using the true three-axis electro-hydraulic servo disturbance test platform, the mechanical characteristics, failure modes. Surrounding rock integrity control of vertical shafts under different support methods were studied, and the influence of on-site construction disturbance was considered. At the same time, acoustic emission devices, built-in micro cameras, and static strain gauges were introduced as auxiliary monitoring methods. This study can guide the construction of vertical shafts in mines on site and are of great significance for rock mass support in deep mining under disturbance conditions [15].

Table 1.
Summary of experimental studies on shaft stability at home and abroad [16,17,18].
Table 1.
Summary of experimental studies on shaft stability at home and abroad [16,17,18].
| No. | Nationality | Research Content and Conclusion |
|---|---|---|
| 1 | China | Vertical force is the main factor causing the peeling and instability of the lining of the mine shaft; using optical fiber to monitor the deformation of the shaft. |
| 2 | USA | Exploring the causes of severe deformation in the vertical shaft of Haikela coal mine, optimizing the excavation shape of the shaft, and reducing the later deformation of the shaft. Simultaneously analyzed the causes of collapse and preventive measures. |
| 3 | Australia | Constructing Telfer, the largest vertical shaft in Australia, and exploring the effect of concrete lining support on the shaft. Research and analysis on the stability of vertical shafts and surrounding rock masses. |
| 4 | Canada | In response to the problem of concrete lining support peeling and degradation in X41 mine shaft, this study investigates the shaft damage factors and designs a long-term stability maintenance plan for the shaft. |
| 5 | Republic of Korea | A study was conducted on the deformation of the vertical shaft and the stress distribution around the shaft. The theory of soil pressure distribution was proposed to guide the construction of shafts in mines. |
| 6 | Japan | Taken Yatani mine as the research object, the influence of faults and seepage on the stability of vertical shaft was studied. At the same time, as grouting treatment for shaft damage, there will be repeated force on the shaft, affecting its stability. |
| 7 | South Africa | Stability analysis and improvement of steel structure support for vertical shafts in Driefontein and Kloof gold mines. The Bambanani mine was the research object. Based on lining support and steel structure support, the mining layout and the addition of filling materials between regional pillars had a positive impact on delaying the expected deformation of the shaft cylinder. |
| 8 | Poland | Conduct statistical analysis and design prevention plans for water inrush incidents in the shaft and predict the stability of the shaft after lining support. |
2. Materials and Methods
2.1. Preparation of Specimens
(1) Similarity ratio determination. The diameter of the 6# vertical shaft on the mining site is 5500 mm. According to the standard specifications for concrete testing, a 150 × 150 × 150 mm cubic sample was used for similar tests. To assess potential boundary effects, comparative tests were performed on cube models with side lengths of 150 mm, 200 mm, and 250 mm (all containing the 50 mm diameter model shaft). The maximum difference in peak load and strain among these models was less than 2%, confirming that boundary effects are negligible for the present test design. To reduce the impact of size effects, a similar shaft diameter of 50 mm was set. The geometric similarity ratio was determined as 0.0091. According to the similarity law [19], the strength similarity ratio was calculated as 0.00585 and the volumetric weight similarity ratio as 0.643.
(2) Mixing of similar materials. Similar materials should be determined according to the calculated similarity ratio, and gypsum, rosin, cement, quartz, sand, and water were used for similar material deployment [20]. The deployment process is shown in Figure 2. Among them, plant fibers were used instead of steel fibers as the added fibers, and the detailed deployment parameters of similar materials are shown in Table 2.
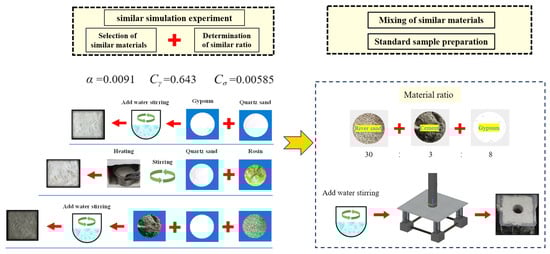
Figure 2.
Schematic diagram of similar material ratio and standard sample production.
Table 2.
Comparison of parameters between actual engineering conditions and similar simulation situations.
(3) Preparation of standard samples. Mix similar formulations (cement, gypsum, and sand) with water, vibrate evenly on a self-developed sample processing device, mark the demolding of the sample, and then cure for 72 h in a standard curing environment [21]. A control group and three experimental groups were designed. The shafts of the control group samples were supported with ordinary concrete, while the experimental group was supported with borehole pressure relief, slotted filling, and fiber-reinforced concrete based on ordinary concrete support, as shown in Figure 3.
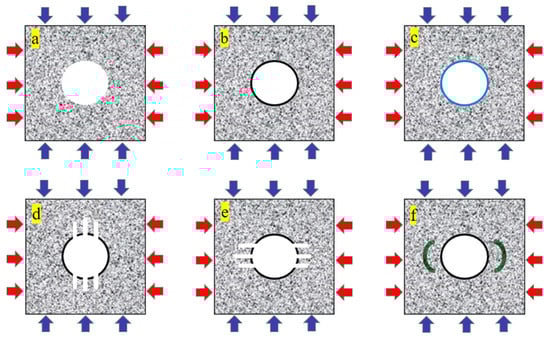
Figure 3.
Schematic diagrams of different support modes of shaft. (a) non-support scheme; (b) non-fiber concrete scheme; (c) steel fiber concrete support scheme; (d) borehole pressure relief support along the direction of maximum principal stress; (e) borehole pressure relief support perpendicular the direction of maximum principal stress; (f) cutting groove destressing support scheme. The red arrows denote the maximum principal stress applied to the specimen, and the blue arrows signify the minimum principal stress.
2.2. Experimental Procedure
2.2.1. Experimental Equipment
The experiment comprises a testing device, a testing system, and a sample preparation system. The testing device system includes a true triaxial testing system, an acoustic emission system, a load-strain tester, and drilling and slotting equipment. The sample preparation and processing system consisted of a mixer, curing box, vibration table, and a mold pouring device.
Test studies were conducted on standardized samples using a true triaxial dynamic mutagenesis test system, with acoustic emission system, built-in camera, and static stress–strain gauge equipment to monitor the test process. Among them, the True Triaxial (TRW-3000) testing machine (Changchun Chaoyang Test Instruments Co., Ldt., Changchun City, China) comprises a computer, a hydraulic control system, and actuator components. There were independent load systems in the X, Y, and Z directions, with a maximum load of 2000 kN. At the same time, there were independent disturbance systems in the three directions, as shown in Figure 4a.
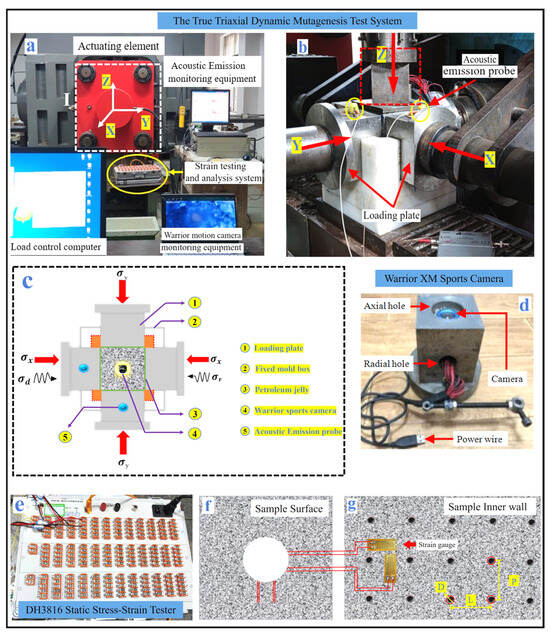
Figure 4.
Schematic diagram and photograph of experimental equipment setup. (a) Photograph of the true triaxial testing system; (b) photograph of the true triaxial samples under loading; (c) schematic of the true triaxial samples loading; (d) built-in camera mounting device; (e) static stress–strain gauge; (f) surface strain monitoring of the standard samples; (g) internal strain monitoring of the standard samples.
The acoustic emission system adopts a high-performance, low-noise PCI-2 device developed by the American Physical Acoustics Company (Princeton Junction, NJ, USA). The system was equipped with an acquisition card with a sampling rate of up to 40 MHz and an accuracy of 18 bits [22]. The initial noise removal threshold was set to 45, and the amplifier multiplier was set to 40 dB [23]. It had waveform stream data storage function and can continuously store sound emission wave forms in the hard disk at a rate of 10 M sampling points per second. The acoustic emission probes were arranged sequentially at the fixed ends of the maximum and minimum principal stress directions to facilitate the monitoring of the acoustic signals generated throughout the entire process of shaft deformation [24].
The internal camera uses the Warrior XM sports camera (Hangzhou Xiongmai Technology Co., Ltd., Hangzhou, China), and the camera lens was modified with a circular light strip. During shooting, an external power supply device was connected to provide illumination, and the shooting time interval was 0.2 s. The schematic diagram of the probe layout is shown in Figure 4b. The internal observation camera was placed in a self-developed loading mold and was used in conjunction with a self-made loading mold with axial and lateral openings to monitor the shaft, as shown in Figure 4c. At the same time, strain gauges were attached to the inner shaft wall of the sample and connected to a strain gauge tester to monitor the deformation of the sample’s inner shaft wall, as shown in Figure 4e–g.
2.2.2. Loading Paths
The specific experimental steps were as follows:
(1) Before the experiment, the control group, borehole pressure relief, and slot filling experimental group samples were uniformly coated with 4.1 mm thick ordinary concrete inside the shaft using self-developed testing equipment for lining support. The experimental group of fiber-reinforced concrete support applied 4.1 mm fiber-reinforced concrete for support. The surface of the sample was polished smooth with sandpaper of different roughness, and Vaseline was evenly applied to ensure uniform stress and signal transmission. Strain gauges, built-in cameras, and acoustic emission systems were installed and debugged.
(2) After commissioning, the three-axis hydraulic oil pump and servo system were started, and a load of 100 N/s was applied in the X, Y, and Z directions until the minimum principal stress level was reached, and the state was maintained for 120 s.
(3) After the stress distribution was balanced, loads were applied in the Y and Z directions to the vertical stress level. Keep the stress state for 120 s until the stress distribution is balanced, maintain constant X and Z stresses, and apply loads in the Y-axis direction to the maximum principal stress level, maintaining the stress state for 120 s. Then, apply a load in the Y-axis direction at a rate of 100 N/s until shaft failure.
(4) After reaching the peak load in the vertical shaft model test, turn off the instrument. Meanwhile, the broken pieces of the damaged samples were collected, numbered, measured, and analyzed separately. The experimental loading process is shown schematically in Figure 5 [25].
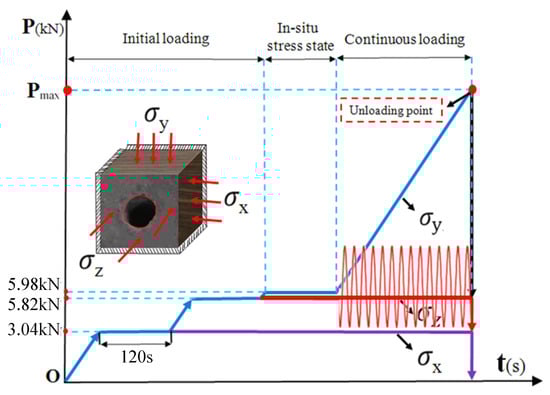
Figure 5.
Schematic of the true triaxial loading procedure.
3. Results
3.1. Mechanical Properties
3.1.1. Stress–Strain Behavior
Upon reaching the target stress state on all three axes (X, Y, Z) of the true triaxial testing system, the loads in the minimum principal stress (X-axis) and vertical stress (Z-axis) directions were maintained constant. Meanwhile, the maximum principal stress (Y-axis) was continuously loaded at a rate of 100 N/s. The test results for shaft strain, peak load, and strain under the in situ stress condition are summarized in Table 3. The sample designations were as follows: N for the unsupported control samples; S for the control sample with ordinary concrete support; G for the sample with steel fiber-reinforced concrete support; Z2 for borehole pressure relief support, with drilling oriented along the maximum principal stress direction; Z1 for borehole pressure relief support, with drilling perpendicular to the maximum principal stress direction; and K for the sample with cutting groove destressing support.
Table 3.
Statistics of shaft mechanical test results under different support conditions.
Using the data from Table 3 (the conclusion is based on a small amount of test data), the mean stress–strain values for each support type were plotted to obtain a graph of the peak stress and corresponding strain for shaft samples under different supporting conditions. According to Figure 6, the peak load of the shafts was increased by the addition of concrete compared with the unsupported shaft sample N, and the shaft strain was effectively controlled. The steel fiber-reinforced concrete support mode improved performance by 6%. Nevertheless, the peak load of destressing support samples was lower than that of the ordinary concrete support samples, which was reduced by 6.53%, 13.34%, and 4.64%, respectively. The different destressing structures caused damage to the shaft, which compromised its internal integrity and resulted in a reduction in the peak stress to varying extents.
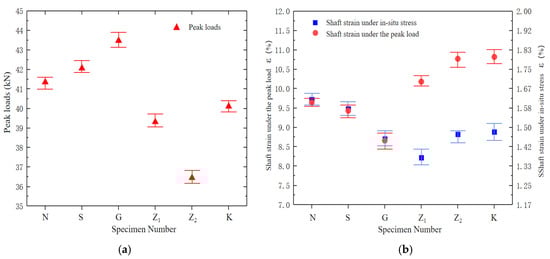
Figure 6.
Mechanical test results under different support conditions. (a) Peak load curve under different support samples; (b) strain curve under different support samples.
Under the in situ stress state, the destressing boreholes support scheme Z1, Z2, and the cutting groove destressing support scheme K under the shaft strain were lower than those of the ordinary concrete support shaft samples, which were reduced by 13.29%, 6.96%, and 6.33%, respectively, and the pressure relief support effectively maintains the integrity of the shaft. Under the destressing boreholes support scheme and the cutting groove destressing support scheme, the shaft strain under peak load was higher than that of the ordinary concrete support shaft samples. The shaft exhibited more intense failure and larger wall deformation at peak load due to the internal damage caused by the destressing structures.
On the basis of the aforementioned description, concrete support provides circumferential support for the deep shaft wall, enhances the peak load of the shaft wall, and controls the deformation of the shaft wall under high-stress conditions in deep mining. In contrast, the destressing boreholes support scheme and the cutting groove destressing support schemes at the expense of specimen integrity, control the deformation of the shaft wall under high-stress conditions while reducing the peak load of the shaft wall, thereby threatening the safety of the mine shaft from another perspective.
3.1.2. AE Characteristics
The AE probe was arranged at the loading fixed end of the sample, and the AE signal data was recorded. The process of micro-cracks, propagation, and penetration failure of the sample under the load of the true triaxial system can be reflected by the AE signal. The different stages of the instability evolution of the shaft model are divided. Considering the spatiotemporal and energy factors of the shaft rupture under the true triaxial condition, the introduction of the acoustic emission activity S-value reflects the concentration [26]. It is composed of the frequency and amplitude of AE events, and the S-value of AE activity was calculated by using the following formula [27]:
msi is the magnitude of the amplitude of the AE event, ms is the magnitude of the maximum AE event amplitude in the statistical window, and N is the statistical cumulative frequency of acoustic emission at the magnitude interval. ms is the magnitude of the maximum acoustic emission event amplitude within the statistical window. After calculating the acoustic emission activity S-value, 30 characteristic points are extracted according to the time series to plot the acoustic emission activity versus time figure.
Upon calculating the acoustic emission activity S-value, 30 temporally distributed feature points were extracted. An acoustic emission activity–time (S-t) curve was plotted and integrated with the energy–time (E-t) diagram and the load–displacement (P-S) curve. These three sets of data were collectively visualized in a combined plot. Based on the characteristic trends of the curves, the sample failure process was divided into four distinct stages: the compacting stage, the elastic stage, the deformation stage, and the failure stage. Each stage was visually distinguished using differently colored backgrounds.
The first stage was the compacting stage, when the internal fine pore defects of the sample were compacted tightly under the action of external load, the load value was small, the slope of the load displacement curve was low, and the fluctuation was some improvement, as shown in Figure 7a. At this stage, the slope of the samples under the pressure relief support method was lower than the slope of the normal sample.
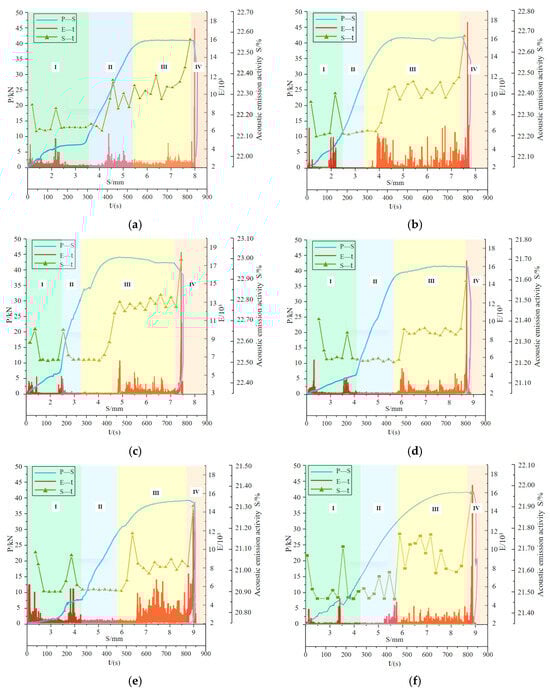
Figure 7.
Acoustic emission energy characteristics of different support schemes for shaft samples. (a) No support; (b) non-fiber concrete support; (c) steel fiber concrete support; (d) non-fiber concrete + destressing boreholes; (e) non-fiber concrete + destressing boreholes; (f) non-fiber concrete + cutting groove destressing.
In the second stage of the elastic stage, the external load continues to be applied, and the interaction between particles, crystals, and particles in the elastic stage was a recoverable elastic deformation. The load displacement curve presented an approximate linear relationship. The acoustic emission activity S-value of the samples increased sharply by the end of the first stage. After compaction in the first stage, the threshold value for entering the second stage rose, and during this second stage, the acoustic emission activity value remained stable, as shown in Figure 7b,c.
In the third stage, the load stabilized after a slight increase, while deformation continued to grow. During this phase, internal crack defects in the shaft began to initiate, propagate, and gradually coalesce, as shown in Figure 7d. Secondary cracks developed successively, accompanied by a gradual rise in the acoustic emission S-value and energy release. As internal damage accumulated further, the shaft approached a critical state near failure.
The fourth stage marked the failure of the shaft, characterized by a sharp decline in load and a surge in both acoustic emission activity and energy release, ultimately leading to shaft failure, as shown in Figure 7e,f.
Analysis based on the load–displacement (P-S) curves under various support conditions revealed that, compared to unsupported shaft model samples, those reinforced with steel fiber concrete exhibited the highest acoustic emission activity at peak load. Concrete support enhanced the peak load-bearing capacity of the shaft. In contrast, the slotted pressure relief support samples showed lower acoustic emission activity under peak load compared to the control group.
3.2. Failure Characteristics
3.2.1. Vertical Shaft Failure Characteristics
During the test, the whole process of the inner side of the shaft was monitored and photographed by the camera, and the whole process of the shaft failure under six different support modes was divided into five stages [28]: σ = 0; σ = σ0 (in situ stress state); σ = 60%σmax; σ = 80%σmax; σ = 100%σmax. The black arrows in the table indicate the maximum principal stress level, the yellow arrow indicates the minimum principal stress level, and the red arrow represents the load continuously applied in the direction of the maximum principal stress. The black pigment indicates concrete support, and the blue pigment indicates the steel fiber-reinforced concrete support scheme, as shown in Table 4.
Table 4.
Record of instability and failure process of shaft samples under different support schemes (no support, concrete support, steel fiber concrete support).
According to Table 4, the second stage represents the initial in situ stress level. At this stage, the shaft was in the initial in situ stress state. In the samples without support and those with ordinary concrete support, a small amount of debris spalling was observed, while no obvious changes were found on the inner surface of the shaft under other support schemes [29]. With the continuous increase in the load in the direction of the maximum principal stress, the load in the direction of the minimum principal stress and the direction of the vertical stress remain unchanged. When σ = 60%σmax, the ejection phenomenon of the shaft to different degrees under various support modes was accompanied by many debris falling. The small macroscopic crack was derived from the lower right of the borehole under the condition of pressure relief support in the direction of the vertical maximum principal stress. In the fourth stage, when σ = 80%σmax, the trapezoidal spalling area appeared on both sides of the shaft of the non-supporting sample, and the trapezoidal area on the left side was accompanied by the cracking phenomenon of the shaft. At this time, slender cracks were derived from the samples inner side of concrete support and steel fiber-reinforced concrete support. The shaft inner side in the direction of the maximum principal stress was characterized by regional spalling failure, and the amount of shaft wall spalling continues to increase. The destressing boreholes were aligned with the vertical direction of the maximum principal stress, the cutter handle block spalling appeared on the right side of the borehole, and the irregular rectangular block spalling appeared on both sides of the borehole. The V-groove fault zone appears on the right side of the shaft under the cutting groove destressing support scheme [30], and the pentagonal fracture zone appears on the left side.
In the fifth stage, when σ = 100%σmax, the shaft reaches the peak load, and the shaft was unstable and fails. There are some improvements in the V-groove fault zones on both sides of the shaft of the unsupported samples, and the shaft was seriously deformed with a large amount of spalling and debris falling. There were two obvious cracks in the shaft under the concrete support and steel fiber-reinforced concrete support, and the borehole integrity was better under the condition of steel fiber-reinforced concrete support [31]. Under the vertical maximum principal stress direction of drilling for pressure relief, drilling along the direction of maximum principal stress, and cutting groove destressing support, large trapezoidal crushing areas appear on both sides of the shaft wall, accompanied by many debris falling, as shown in Table 5. The inner part of the shaft wall sustains damage; at the time of failure, the vertical shaft undergoes large deformation, and the integrity was low under the destressing boreholes and cutting groove destressing support mode.
Table 5.
Record of instability and failure process of shaft samples under different support schemes (destressing boreholes A, stressing boreholes B, destressing by cutting groove).
3.2.2. Fractal Dimension Statistics
When the in situ stress state was reached, the load was continuously applied in the direction of the maximum principal stress until instability failure occurred. The cracking and debris generated during the failure process constituted the post-failure debris particles. Shaft failure debris was screened into four particle fractions using screens of different mesh sizes, which could be categorized into coarse-grained, medium-grained, fine-grained, and micro-grained debris based on particle size. The corresponding particle size ranges were d ≥ 10 mm, 2 mm ≤ d ≤ 10 mm, 0.5 mm ≤ d ≤ 2 mm, and d ≤ 0.5 mm, respectively [32], as shown in Table 6. Statistical graphs and debris descriptions of shaft failure under different support modes are summarized in Table 7.
Table 6.
Statistics of the fragmentation of the shaft samples under different support schemes.
Table 7.
Statistical table of shaft sample failure debris.
To better measure the extent of the debris in the shaft and to characterize the size as well as the mass of the debris, the mass of each particle size was calculated as a percentage of the total mass for each of the four particle sizes. The equivalent particle size was then calculated from the average of the maximum width of the debris for each particle size. Finally, the average fragmentation degree of the debris was derived by the formula for further quantitative analysis [33].
where di and mi are the equivalent particle size and mass percentage, respectively; the value can be obtained to measure the degree of shaft fragmentation, and the lower the value, the lower the quantity of powdery particles after the shaft wall failure. When the sample was failure, the displacement of the steel fiber-reinforced concrete support sample was smallest, while the displacement of the cutting groove destressing sample was largest. The greater the energy during failure, the smaller the average crushing block and the energy during failure. The largest average crushing blockage in the test group was the vertical maximum principal stress direction of the borehole pressure relief sample, followed by the drilling along the maximum principal stress direction to relieve pressure. The steel fiber-reinforced concrete support sample with the average crushing block in the test group was the smallest.
The ranking of the crushing degree of the shaft under different support was obtained. The lowest level of damage was found in the steel fiber-reinforced concrete support method, and the highest level of damage was found in the borehole pressure relief support along the direction of maximum principal stress. The integrity degree of the vertical shaft wall is ranked as follows: steel fiber-reinforced concrete support > non-fiber concrete support > no support > borehole pressure relief support vertical the direction of maximum principal stress > destressing by cutting groove support > borehole pressure relief support along the direction of maximum principal stress.
Under different pressure relief support methods, damage occurs inside the vertical shaft wall, resulting in a decrease in integrity degree. During compressive failure, the integrity degree of the shaft wall was lower than that of the control group. Fiber-reinforced concrete support enhances the tensile performance of the shaft wall and improves the synergistic deformation capacity of the vertical shaft wall; thus, the integrity degree of the shaft wall was the highest when failure occurs. In on-site engineering practice, the steel fiber-reinforced concrete lining support method can be selected for the vertical shaft wall.
4. Discussion
4.1. Numerical Simulation Verification of Shaft Support Methods
According to the geological conditions and on-site conditions of the deep shaft in Huize Mine, Yunnan, a working-condition simulation study was carried out using the multiphysics simulation finite element software of COMSOL Version 5.4. The shaft dimensions are consistent with those on-site. To reduce the size effect, a cube (300 × 300 × 300 mm) with a stratum range of six times the shaft diameter (50 mm) was selected for plane two-dimensional numerical analysis. Constraint loads were applied to the six faces, respectively, to simulate the shaft wall integrity under the mining in situ stress level.
The detailed steps for model construction are as follows: (1) Determination of parameters, including material parameters and dimension parameters. Regarding the material parameters, since the research mainly focuses on analyzing the shaft wall stability and stress changes after shaft excavation, and needs to observe the stress distribution and displacement changes around the shaft wall, dolomite with the same lithology as the stratum was selected as the surrounding rock material to make the established model more consistent with engineering practice. Its unconfined compressive strength is 36.5 MPa, elastic modulus is 2.6 GPa, cohesion is 4.5 MPa, internal friction angle is 38.5°, and density is 2500 kg/m3. The constitutive model of the material adopts the Hoek–Brown criterion, as shown in Table 8.
Table 8.
Numerical simulation material parameters.
(2) Mesh division and load setting. A free tetrahedral mesh was used to discretize the shaft model; for the convenience of calculation, the mesh size was set to be relatively refined. The free face in the middle of the shaft was set as a free surface. A uniform load was applied to the front side in the X direction to reach the minimum principal stress level; a boundary load was applied to the right side in the Y direction to reach the maximum principal stress level; a boundary load was applied to the upper side in the Z direction to reach the vertical stress level. The boundary constraints on the rear side in the X direction, left side in the Y direction, and lower side in the Z direction were set as roller supports.
The numerical model was meshed using free tetrahedral elements to adapt to the geometric complexity of shaft structures and surrounding rock. To ensure calculation accuracy in stress concentration zones, the mesh was locally refined with a minimum element size of 2 mm in critical regions, while the global element size was set to 5 mm for the surrounding rock (dolomite) to balance computational efficiency and precision. All elements met the quality criterion of skewness < 0.8, ensuring numerical stability and convergence. Total element count: The 300 × 300 × 300 mm cubic model (stratum range of six shaft diameter) contained approximately 120,000 free tetrahedral elements, which was verified through a mesh sensitivity analysis.
(3) Model calculation. The model calculation was carried out in two steps: first, the stress balance calculation was performed on the shaft excavation model; then, pressure relief support methods such as borehole pressure relief, slotting pressure relief, and elliptical filling were added, and the stress balance calculation was performed again. Finally, the stress nephograms and plastic zone nephograms under different support schemes are shown in Figure 8.
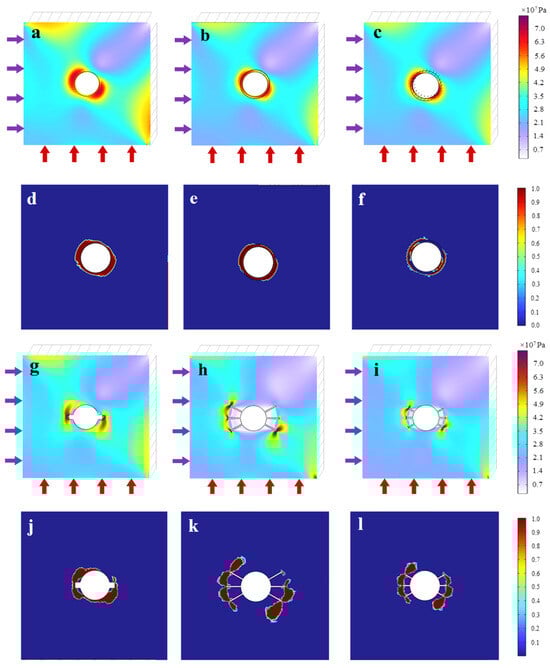
Figure 8.
The stress nephograms and plastic zone nephograms under different support schemes. (a) Stress contour around shaft without support, (b) stress contour around shaft with plain concrete support, (c) stress contour around shaft with steel fiber-reinforced concrete support, (d) plastic zone around shaft without support, (e) plastic zone around shaft with plain concrete support, (f) plastic zone around shaft with steel fiber-reinforced concrete support, (g) stress contour around shaft with slot relief, (h) stress contour around shaft with borehole relief, (i) stress contour around shaft with borehole relief, (j) plastic zone around shaft with slot relief, (k) plastic zone around shaft with borehole relief, and (l) plastic zone around shaft with borehole relief.
The maximum stress on the inner side of the shaft wall and the range of the plastic zone under different support methods were taken as the research objects.
The stress nephogram of the shaft model in the control group showed a symmetric distribution. With shaft excavation, under the action of the maximum principal stress, stress concentration occurs on the upper left and lower right sides of the shaft wall, with a maximum stress of 73.2 MPa. Plastic deformation occurred around the entire shaft wall, and the concentration position of the plastic zone was similar to that of the strain concentration, as shown in Figure 8a,d.
For the shaft model with plain concrete support, the range of the stress concentration zone was smaller than that of the unsupported sample, with a maximum value of 69.4 MPa. The concentration position of the plastic zone around the shaft wall was similar to that of the strain concentration; moreover, the plastic zone mostly appears in the support layer and rarely on the inner side of the shaft wall, as shown in Figure 8b,e.
For the shaft model with steel fiber-reinforced concrete support, stress concentration occurred on the upper left and lower right sides of the shaft wall, and the range of the stress concentration zone was small. Partial plastic deformation occurred around the shaft wall, with the plastic zone mostly appearing on the inner side of the shaft wall; the range of plastic deformation in the shaft wall was 45%, but it rarely appears in the steel fiber-reinforced concrete support layer, as shown in Figure 8c,f.
For the shaft model with slotting pressure relief support, a rectangular slot with a length of 1/2 of the shaft diameter was selected for numerical simulation. Stress concentration occurs at the end of the rectangular slot, with a calculated maximum stress of 37.4 MPa. A small amount of plastic deformation occurs around the shaft wall (Figure 8g,j); the range of plastic deformation in the shaft wall under the in situ stress state is 17%. For the shaft model with borehole pressure relief support, stress concentration occurred at the end of the rectangular hole, with a calculated maximum stress of 25.7 MPa. Plastic deformation occurred at the end of the borehole, and no plastic deformation occurred around the shaft wall (Figure 8h,k). Numerical simulation results verified the authenticity of laboratory tests.
4.2. Effect of Shaft Support Methods Under Engineering Disturbance
During the construction and support of the deep shaft, it was affected by the original in situ stress from the surroundings, but the blasting disturbance and geological activities, as well as the external dynamic disturbance will induce rockburst, aggravating the original defect propagation and secondary crack formation in the shaft at the same time, which will continuously cause damage to the wall of the deep shaft and affect the strength of the shaft. The process of simulating the actual disturbance situation of the deep shaft of the mine was divided into static loading and disturbance loading. The static loading was applied to the in situ stress state of the shaft, and the low-frequency dynamic disturbance was applied. According to the field conditions combined with the law of similarity, the dynamic disturbance was simplified to a constant cosine wave disturbance, with an amplitude of 20 kN and a frequency of 0.05 Hz. The low-frequency periodic disturbance began to reach the original stress state until the disturbance stopped after the shaft was damaged, and the different directions disturbance statistics of the shaft mechanical characteristics are listed in Table 9.
Table 9.
Statistical Summary Table of Peak Stress of Shaft Specimens Under Different Support Methods Subjected to Microseismic Action.
Table 9 demonstrates the distinct influences of disturbances in different directions on the peak load of shaft samples. When a low-frequency dynamic load was applied in the direction of the minimum principal stress, an overall gain effect on shaft strength was observed with the continuous increase in load in the maximum principal stress direction. The low-frequency dynamic load acting in the minimum principal stress direction approximated a fixed constraint, which, at this amplitude, inhibited shaft deformation and internal crack propagation, thereby enhancing strength. The steel fiber-reinforced concrete support mode exhibited the gain effect, with a 4.32% increase in peak load compared to the non-disturbed sample. Conversely, the cutting groove destressing sample showed the lowest gain effect.
When the low-frequency dynamic load was applied in the maximum principal stress direction, the dynamic load promoted crack initiation and propagation, inducing internal shaft damage, reducing peak load, and accelerating instability failure. The negative effect ranged from 1.49% to 4.71%, with the cutting groove destressing support sample demonstrating the most negative response.
Based on these findings, further experiments incorporating varying frequencies and amplitudes are recommended to explore the impact of low-frequency disturbances on shaft stability.
5. Conclusions
In this study, six shaft support methods were designed, and similar model tests were conducted to investigate the mechanical properties, damage modes, and control of surrounding rock integrity of shafts under different support methods. The main conclusions are summarized as follows:
(1) The addition of concrete improves the peak load of the shaft and effectively controls shaft strain, with the steel fiber-reinforced concrete support mode achieving the improvement in shaft strength (6%). Pressure relief support effectively maintains shaft integrity; however, its peak load is lower than that of ordinary concrete-supported shaft samples, with reductions of 6.53%, 13.34%, and 4.64%, respectively.
(2) The sample failure process is divided into four stages: in the first stage, fluctuations were obvious; in the second stage, energy and acoustic emission activity (S-value) first increased, then decreased, and finally remained relatively stable; in the third stage, deformation continued to increase, and internal crack defects in the shaft began to initiate, expand, and gradually propagate through; in the fourth stage, the load dropped sharply, acoustic emission activity and energy increased, and the shaft failed.
(3) Shaft failure modes were divided into five stages: in the second stage, a small amount of debris spalling occurred in unsupported samples and those with ordinary concrete support; in the fourth stage, shafts in the maximum principal stress direction exhibited regional spalling failure, with destressing boreholes drilled along the vertical maximum principal stress direction; in the fifth stage, the shaft failed, and obvious V-groove fracture zones were observed on both sides of unsupported shafts.
(4) Debris from shaft damage was screened into four categories by particle size: coarse-grained, medium-grained, fine-grained, and micro-grained debris. When samples failed, the steel fiber-reinforced concrete-supported samples showed the smallest displacement. The steel fiber-reinforced concrete support method exhibited the lowest damage level, while the highest damage level was observed in borehole pressure relief support along the maximum principal stress direction.
(5) Numerical simulation verification was conducted on deep shaft support methods by using COMSOL, and the conclusions drawn are consistent with the results of laboratory tests. When low-frequency dynamic loads were applied in the minimum principal stress direction, an overall gain effect on the shaft strength was observed. The steel fiber-reinforced concrete support mode showed the gain effect, with a 4.32% increase in peak load. When low-frequency dynamic loads were applied in the maximum principal stress direction, the negative gain effect ranged from 1.49% to 4.71%, with the most significant negative effect observed in the cutting groove destressing support.
Author Contributions
Methodology, D.L. and J.J.; formal analysis, investigation, Y.Y.; resources, writing—review and editing, J.M.; data curation, writing—original draft preparation, D.L. and J.J. All authors have read and agreed to the published version of the manuscript.
Funding
This research is supported by the National Natural Science Foundation of China (Grant No. 52374153) and the Fundamental Research Funds for the Central Universities of Central South University (No. 1053320232284).
Institutional Review Board Statement
Not applicable.
Informed Consent Statement
Not applicable.
Data Availability Statement
The original contributions presented in this study are included in the article. Further inquiries can be directed to the corresponding author.
Acknowledgments
The authors wish to express their appreciation to the on-site staff of the Huize Mine in Yunnan for their support and assistance with the blasting experiments. In addition, the authors wish to express their appreciation to the reviewers for their helpful suggestions, which greatly improved the presentation of this paper.
Conflicts of Interest
The authors declare no conflicts of interest.
References
- Zhao, X. Basic Theory and Development Trends of Ultra-deep Shaft Construction. Chin. J. Met. Mine 2018, 4, 1–10. [Google Scholar] [CrossRef]
- He, M.; Xie, H.; Peng, S.; Jiang, Y.D. Study on Rock Mechanics in Deep Mining Engineering. Chin. J. Rock Mech. Eng. 2005, 24, 2803–2813. [Google Scholar]
- Li, X.; Zhou, J.; Wang, S.; Liu, B. Review and practice of deep mining for solid mineral resources. Chin. J. Nonferrous Met. 2017, 27, 1236–1262. [Google Scholar]
- Wu, A.; Wang, Y.; Zhang, M.; Yang, G.F. New Development and Prospect of Key Technology in Underground Mining of Metal Mines. Chin. J. Met. Mine 2021, 535, 1–13. [Google Scholar]
- Yang, W.; Cui, G.; Zhou, G. Research on the Mechanism and Prevention Technology of Well Wall Fracture under Special Formation Conditions. J. China Univ. Min. Technol. 1996, 1–5. [Google Scholar]
- Wang, W. Discussion on the Stress Analysis and Design Problems of the Wall of a Kilometer Vertical Well. J. China Coal Soc. 1993, 63–72. [Google Scholar]
- He, Y.; Jing, L.W. Stability Analysis of the Surrounding Rock in Deep Shaft. China Min. Mag. 2006, 15, 61–64. [Google Scholar]
- Liu, Z.; Song, C.; Ji, H.; Liu, S.; Tan, J.; Cheng, S.; Ning, F. Basic Construction mode and key technology of mining shaft engineering for deep mineral resources. J. China Coal Soc. 2021, 46, 826–845. [Google Scholar]
- Akopyan, Z.S. Nonaxisymmetric loss of stability in a vertical shaft mine. Int. Appl. Mech. 1976, 12, 517. [Google Scholar] [CrossRef]
- Guz, A.N. Establishing the Fundamentals of the Theory of Stability of Mine Workings. Int. Appl. Mech. 2003, 39, 20–48. [Google Scholar] [CrossRef]
- Konstantinova, S.A.; Chernopazov, S.A. Mathematical modeling of pressure on the strengthening vertical shaft support in Mirmine located in the Charsk saliferous rock series. J. Min. Sci. 2006, 42, 113–121. [Google Scholar] [CrossRef]
- Su, G.; Hu, L.; Feng, X.T.; Wang, J.H.; Zhang, X.H. True triaxial experimental study of rockburst process under low frequency cyclicdisturbance load combined with static load. Chin. J. Rock Mech. Eng. 2016, 35, 1309–1322. [Google Scholar]
- Chen, L. A Study of Physical Model-Test Technology and Application in Geotechnical Engineering. Ph.D. Thesis, Institute of Rock and Soil Mechanics, Chinese Academy of Sciences, Beijing, China, 2006. [Google Scholar]
- Feng, F.; Chen, S.J.; Wang, Q. Experimental Study on Failure Characteristics of Natural and Saturated Sandstone under True Triaxial Unloading and Dynamic Disturbance Condition. Chin. J. Rock Mech. Eng. 2022, 41, 2240–2253. [Google Scholar]
- Cui, G. Mechanism and Prevention Technology of Shaft Lining Failure Under Special Stratum Conditions. Mine Constr. Technol. 1998, 28–32. [Google Scholar]
- Xu, Y. Theory and Application of Shaft Lining Design for Ultra Kilometer Deep and High Water Pressure in Jiaodong Gold Mine. Ph.D. Thesis, University of Science and Technology Beijing, Beijing, China, 2021. [Google Scholar]
- Han, T. Study on the Loads and Design Theory of the Monolayer Freezing Shaft Lining in Water-rich Bedrock. Ph.D. Thesis, China University of Mining and Technology, Beijing, China, 2011. [Google Scholar]
- Bruneau, G.; Tyler, D.B.; Hadjigeorgiou, J.; Potvin, Y. Influence of faulting on a mine shaft—A case study: Part I—Background and instrumentation. Int. J. Rock Mech. Min. Sci. 2003, 40, 95–111. [Google Scholar] [CrossRef]
- Kun, M.; Onargan, T. Influence of the fault zone in shallow tunneling: A case study of Izmir Metro Tunnel. Tunn. Undergr. Space Technol. 2013, 33, 34–45. [Google Scholar] [CrossRef]
- Dong, J.; Yang, J.; Yang, G.X.; Wu, F.Q.; Liu, H.S. Research on Similar Material Proportioning Test of Model Test Based on Orthogonal Design. J. China Coal Soc. 2012, 37, 44–49. [Google Scholar]
- Xiao, J. Selection of Similar Materials for Model Test & Research on Similar Material Proportioning Test. Ph.D. Thesis, Beijing Transportation University, Beijing, China, 2013. [Google Scholar]
- Du, K.; Li, X.; Li, D.; Weng, L. Failure Properties of Rocks in True Triaxial Unloading Compressive Test. Trans. Nonferrous Met. Soc. China 2015, 25, 571–581. [Google Scholar] [CrossRef]
- Lu, J.; Yin, G.; Gao, H.; Li, M.; Deng, B. Experimental Study on Compound Dynamic Disaster and Drilling Pressure Relief of Gas-Bearing Coal under True Triaxial Loading. J. China Coal Soc. 2020, 45, 1812–1823. [Google Scholar]
- Du, K.; Li, X.; Ma, C. Development of Rock True Triaxial Dynamic Disturbance Test System and its Application. Exp. Technol. Manag. 2014, 31, 35–40. [Google Scholar]
- Du, K.; Li, X.; Dong, L.J.; Tao, M.; Zhou, J. Fracture Mechanism of Rock Induced by True-Triaxial unloading and Heterology Dynamic Disturbance. Chin. J. Rock Mech. Eng. 2015, 34, 4047–4053. [Google Scholar]
- Dong, L.; Sun, Y.; Sun, D.; Chen, Y.C.; Tang, Z. Stage Characteristics of Acoustic Emission and Identification of Unstable Crack State for Granite Fractures. Chin. J. Rock Mech. Eng. 2022, 41, 120–131. [Google Scholar]
- Wu, C.; Gong, F.; Luo, Y. A new quantitative method to identify the crack damage stress of rock using AE detection parameters. Bull. Eng. Geol. Environ. 2021, 80, 519–531. [Google Scholar] [CrossRef]
- Li, D.; Charlie, C.; Li, X. Influence of sample height-to-width ratios on failure mode for rectangular prism samples of hard rock loaded in uniaxial compression. Rock Mech. Rock Eng. 2011, 44, 253–267. [Google Scholar] [CrossRef]
- He, M.; Xia, H.; Jia, X.; Gong, W.; Zhao, F.; Liang, K. Studies on classification, criteria and control of rockbursts. J. Rock Mech. Geotech. Eng. 2012, 4, 97–114. [Google Scholar] [CrossRef]
- Wang, M.; Wang, X.; Xiao, T. Borehole Destressing Mechanism and Determination Method of its Key Parameters in Deep Roadway. J. China Coal Soc. 2017, 42, 1138–1145. [Google Scholar]
- Lin, B.; Zou, Q.; Shen, C.; Xu, Y.P.; Dai, H.M.; Yang, W. Investigation on Highly Effective Depressurization Property of Dual-Power Drilling and its Application. J. China Coal Soc. 2013, 38, 911–917. [Google Scholar]
- Xu, J.; Liu, S. Research on Fractal Characteristics of Marble Fragments Subjected to Impact Loading. Rock Soil Mech. 2012, 33, 3225–3229. [Google Scholar]
- Ji, J.; Li, H.; Wu, F.; Yao, Q. Fractal Characteristics of Rock Fragmentation under Impact Load. J. Vib. Shock 2020, 39, 176–183. [Google Scholar]


Disclaimer/Publisher’s Note: The statements, opinions and data contained in all publications are solely those of the individual author(s) and contributor(s) and not of MDPI and/or the editor(s). MDPI and/or the editor(s) disclaim responsibility for any injury to people or property resulting from any ideas, methods, instructions or products referred to in the content. |
© 2025 by the authors. Licensee MDPI, Basel, Switzerland. This article is an open access article distributed under the terms and conditions of the Creative Commons Attribution (CC BY) license (https://creativecommons.org/licenses/by/4.0/).