Abstract
Late sowing has been common since the popularization of mechanical transplantation, and it has led to reduced grain yield due to low grain weight. However, the uneven contribution of the amount and weight of grains in different positions to grain yield remains unclear. A 2 yr field experiment was conducted with two super rice varieties (Ningjing 7th: N7 and Nanjing 9108th: N9108) and three sowing dates (S1: 30 April; S2: 30 May; and S3: 30 June) in Hefei City. In this study, delaying sowing shortened the growth duration, reduced temperature, and further reduced the grain yield mainly by suppressing the total grain weight. Compared with S1, the grain weight of grains in secondary branches (SGs) in S2 and S3 was reduced by 11.1% ± 2.9% and 18.5% ± 1.4%, respectively, due to a lower reproductive-stage temperature. However, no significant difference was found in the grains in primary branches (PGs). Moreover, a shorter growth duration enhanced the ratio of tillers in a lower position (LT) per unit area, which contained more SGs per panicle, and finally led to a higher ratio of SG amount per unit area (SG%). The SG% increased by 13.4% ± 1.4% and 21.1% ± 1.9% in S2 and S3 compared with S1, respectively. In conclusion, delaying the sowing date mainly reduced the grain weight of SGs and enhanced the SG%, leading to a lower apparent grain weight and further decreasing grain yield.
1. Introduction
Rice is a staple crop in China and has greatly contributed to the development of China’s national economy [1]. In the middle and lower reaches of the Yangtze River, delayed sowing has become common since the popularization of mechanical transplantation. This shift from manual to mechanical transplanting prolongs seedling preparation, forcing farmers to plant later within the rice–wheat rotation window [2,3,4]. Additionally, global climate change has caused variations in temperature and solar radiation, further influencing the timing of sowing to avoid adverse weather conditions and ensure a safe grain yield [5,6,7]. To cope with these variations, sowing dates are commonly adopted as an effective method to avoid adverse weather to achieve a safe grain yield [8].
Delayed sowing consistently shortens the growth period; moreover, it raises temperature and sunshine hours early in the season, while lowering both after heading, because of seasonal drift [8,9,10]. This post-anthesis deterioration in light and temperature resources is widely regarded as the main cause of poor grain filling, especially in inferior (secondary-branch) grains (SGs). Conversely, superior (primary-branch) grains (PGs) are much less affected. Most reports attribute yield losses under late sowing to this reduction in SG filling [11,12]. However, field-level yield is not governed solely by grain filling (i.e., 1000-grain weight and seed-set); it also depends on the total number of spikelets per unit area. Spikelets located on different parts of a panicle differ in stress tolerance, filling capacity, and end-use quality [12]. Our earlier work showed that the balance between superior (primary-branch, PG) and inferior (secondary-branch, SG) grains determines population-level quality [13]. This raises a further question: could changes in the relative abundance of PG versus SG be an independent driver of yield variation? Therefore, we tested whether the population-level PG/SG ratio acts as an independent yield determinant and how sowing date shifts this ratio.
The critical window for setting this ratio is the panicle-initiation stage, during which light and temperature strongly influence branch and spikelet primordia formation in the crop [14,15,16]. Significant differences in panicle-branch differentiation among tillers of different orders have long been documented; consequently, elucidating how branch primordia development within each tiller cohort responds to sowing-date manipulation is of particular agronomic importance [17]. Panicle formation follows the chronological order of tiller emergence. In the field, shoots are classed as main stems (MSs), primary tillers (PTs), secondary tillers (STs), or tertiary tillers (TTs) [18]. Tillers that appear early—positioned low on the main stem or bearing one to three leaves—are defined as “early” tillers, while all later-emerging culms are “late” tillers. Early tillers have a longer growth duration, a higher relative growth rate, and produce more spikelets per panicle and a greater percentage of fertile culms [18,19]. Many works further reported that early tillers carry a higher proportion of secondary-branch spikelets (SGs) [20,21,22]. Consequently, any change in the early–late tiller ratio could be expected to alter the SG–PG balance at the population level.
Under late-sowing conditions, a shortened photothermal time suppresses late tiller emergence while favoring early tillers [23,24]. In this study, we monitored tiller dynamics by position and linked the tiller composition to the final spikelet distribution to clarify how this shift affects the SG/PG ratio per unit area. This approach allowed us to dissect the mechanistic basis for position-dependent grain responses to sowing date delay. Therefore, we hypothesized that grain weight and yield are regulated by uneven grain weight across positions as well as the number and ratio of grains in each position (PG and SG). This study’s objectives were (1) to evaluate the regulative mechanism of sowing dates on rice yield components; (2) to identify the uneven significance of the number and weight of SGs and PGs on the apparent grain weight and yield formation; and (3) to investigate how the ratio of grains in different positions was regulated by late sowing.
2. Materials and Methods
2.1. Experimental Sites and Soil
Field experiments were conducted during the 2023 and 2024 rice-growing seasons at the experimental farm of Anhui Science and Technology Achievement Transformation Promotion Center, Hefei City, Anhui Province, China (31°52′ N, 117°17′ E; 30 m a.s.l.). The site is located in the Chaohu Plain of the middle-lower Yangtze River Basin and is characterized by a humid-subtropical monsoon climate with an average annual rainfall of 1037 mm (1981–2025) (China Meteorological Administration (CMA) national meteorological network (http://data.cma.cn (accessed on 1 September 2025)). The pre-crop was wheat; after harvest, the stubble was removed, and the field was rotary-tilled once to 20 cm. A basal flood–drain cycle was then applied to obtain the puddled condition required for mechanical transplanting.
The soil is a typical hydromorphic paddy soil (FAO). Before transplanting in both years, five soil cores (0–20 cm) were collected diagonally across each block, bulked, air-dried, and analyzed. Mean values (±SD) across the two seasons were: pH 6.4 ± 0.1 (1:2.5 soil/water); electrical conductivity 0.21 ± 0.02 dS m−1; organic C 14.3 ± 0.4 g kg−1; total N 1.43 ± 0.05 g kg−1; Olsen-P 16.3 ± 0.8 mg kg−1; exchangeable K 138 ± 4 mg kg−1; bulk density 1.32 ± 0.02 g cm−3; field capacity 0.38 cm3 cm−3; and permanent wilting point 0.19 cm3 cm−3. Particle-size distribution was 16% clay, 68% silt, and 16% sand. Analytical methods followed [25,26].
2.2. Experimental Design and Treatments
The experiment was arranged as a two-year factorial randomized complete-block design (RCBD) with three replications. Two conventional japonica rice cultivars, Ningjing 7 (N7) and Nanjing 9108 (N9108), were evaluated at three sowing dates: S1 (30 April of each year), S2 (30 May of each year), and S3 (30 June of each year). The six treatment combinations (2 cultivars × 3 sowing dates) were randomly assigned to individual plots within each block using the random-number generator of IBM SPSS Statistics; a new randomization was performed for each year.
Each plot was 13 m (width) × 25 m (length) = 325 m2, separated by 1 m discard borders on all sides to avoid border effects. Blocks were oriented perpendicular to the drainage direction to ensure uniform water distribution. All measurements and sampling were restricted to the central 10 m × 20 m area of each plot.
2.3. Crop Management
2.3.1. Seed Preparation
Seed was sown on wet seedbeds on 30 Apr, 30 May, and 30 Jun (corresponding to S1, S2, S3). 20-day-old seedlings were mechanically transplanted with a Yanmar VP6D transplanter (YANMAR Agricultural Machinery (China) Co., Ltd., Wuxi City, Jiangsu Province, China) at 30 cm × 12 cm spacing, giving a stand density of 28.6 hills m−2 (≈2.86 × 10⁶ plants ha−1). Transplanting dates were 20 May, 20 Jun, and 20 Jul for S1, S2, and S3, respectively.
2.3.2. Fertilizer Management
Total nutrients applied were 240 kg N, 60 kg P2O5, and 120 kg K2O ha−1. A compound fertilizer (18-8-16) was used. Nitrogen was split 50% basal (1 d before transplanting), 30% at early tillering (14 DAT (Days after Transplantation)), and 20% at panicle initiation (PI ≈ 35 DAT). Phosphorus was applied 100% basal, potassium was split 50% basal and 50% at PI. Fertilizer was broadcast by hand and immediately incorporated where applicable.
2.3.3. Water Management
Water management was applied following an alternate wetting and drying regime. Fields were maintained at 3–5 cm depth for the first 14 d after transplanting to ensure seedling establishment, then irrigated to 2–3 cm whenever the soil matric potential at 15 cm depth reached −10 kPa (tensiometers TRS-II). Mid-season drainage was imposed for 7 d at the maximum tillering stage to suppress ineffective tillers. From panicle initiation to grain filling, the wet–dry cycle was repeated; irrigation was terminated 10 d before physiological maturity.
2.4. Meteorological Measurements
A micro-meteorological station (WatchDog 2000 Series, Spectrum Technologies, Plainfield, IL, USA) was installed 30 m upwind of the experimental plots. Global solar radiation was measured with a LI-200R silicon pyranometer (LI-COR, Lincoln, NE, USA); air temperature and relative humidity were recorded by an HMP45C probe (Vaisala, Helsinki, Finland). Sensors were calibrated before installation against standards traceable to the China Meteorological Administration.
2.5. Phenological Observations
Key growth stages were recorded three times per week by the same two trained observers according to the BBCH-scale for rice [27]. Panicle initiation (PI) was defined as the day when ≥80% of main stems showed a white feathery cone inside the sheath (BBCH 30–31); flowering (FL) as the day when ≥80% of panicles had exserted at least one-third of their length (BBCH 59); and physiological maturity (MT) as the day when ≥95% of spikelets had turned yellow and grains could no longer be dented by thumbnail pressure (BBCH 89). Dates were expressed as days after sowing.
2.6. Sampling and Measurements
2.6.1. Tillering Dynamics and Spikelet Number in Different Positions
Ten neighboring plants in the central rows were chosen to detect the tillering dynamics. Every tiller was tagged when tillering emerged. The tiller was differentiated as the main stem, primary tiller, secondary tiller, and tertiary tiller, as described in the previous work [28]. The main stem, primary tiller, secondary tiller, and tertiary tiller were tagged with red, white, blue, and black plastic signs, respectively. The tillering emergence date was collected to determine the tillering dynamics. The panicles from all the plants were harvested separately to calculate the spikelet number and spikelets in different seed positions.
2.6.2. Yield and Yield Components
At PI, FL, and MT, all plants within a 0.5 m2 quadrat per plot were destructively sampled (a total of 1.5 m2 per plot) from the same central five rows, leaving at least a 1 m buffer from the plot edges to avoid border effects. After recording the plant height and the number of stems (main stems plus tillers) and panicles (when present), the plant samples were separated into leaves, stems, and panicles. At maturity, the panicles were hand-threshed, and the filled spikelets were then separated from the unfilled spikelets by submerging them in tap water. The empty spikelets were separated from the half-filled spikelets by winnowing. Three sub-samples of the filled, half-filled, and empty spikelets were taken to count the spikelet number. The dry weights of the rachis and the filled, half-filled, and empty spikelets were measured after oven drying at 70 °C to a constant weight. The total dry weight at maturity was the sum of the dry weights of the straw (leaves plus stems), rachis, and filled, half-filled, and empty spikelets. The spikelets per panicle (spikelets m−2/panicles m−2), and grain-filling percentage (100 × filled spikelets m−2/spikelets m−2) were calculated. The GY was determined from a 5 m2 area in the center of each plot and was adjusted to a 14% moisture content.
2.7. Statistical Analyses
Analysis of variance was performed using SPSS version 20.0. (SPSS Statistics, SPSS Inc., Chicago, IL, USA), and the results were expressed as means (±SD) of three biological replicates. The treatment means were compared based on the least-significant difference (LSD) at a 0.05 level of probability.
2.7.1. ANOVA
The data were subjected to one-way analysis of variance (ANOVA) using SPSS 20.0. The sowing date was treated as a fixed factor, and replicates were considered random. When the ANOVA was significant (p < 0.05), the means were separated with Fisher’s least-significant difference (LSD) test at a 5% probability level.
2.7.2. Principal Component Analysis (PCA)
PCA was performed on the correlation matrix of six standardized yield traits using the FactoMineR package in R4.2.2. Components with eigenvalues of >1 were retained. The resulting bi-plot was used to visualize the treatment separation and trait associations.
2.7.3. Linear Regression
The relationship between the actual grain yield and the calculated yield was fitted using simple linear regression (lm function, R4.2.2). The model performance was evaluated with the coefficient of determination (R2), and the significance of the slope was tested at p < 0.05.
2.7.4. Equations
Equation notation:
GY(Actual): grain harvested from the central 5 m2 of each plot, threshed, dried, adjusted to 14% moisture, and expressed in t ha−1; this is the true economic yield.
GY(Actual) = grain yield harvested from 5 m2, adjusted to 14% moisture (t ha−1).
GY(Theoretical): obtained by destructively sampling 0.5 m2 per plot, counting panicles, spikelets, and filled grains, weighing 1000-grain weight, and multiplying the four components (panicle m−2 × spikelet panicle−1 × seed-set% % × GW) with no distinction between primary and secondary grains.
GY(Theoretical) = GW × SSR × NoS × NoP, where GW is 1000-grain weight (g), SSR is apparent seed set (%), NoS is spikelets panicle−1, and NoP is panicles m−2.
GY(Calculated): the same component data but partitioned into primary (PG) and secondary (SG) grains using the equation proposed below; it explicitly weights PG and SG by their respective grain numbers, seed-set rates, and 1000-grain weights.
GY(Calculated) = [GW(SG) × SSR(SG) × Ratio-SG] + [GW(PG) × SSR(PG) × Ratio-PG] × NoS × NoP.
Parameters used in the equation:
SG and PG: grains located in secondary and primary branches, respectively; GY(Calculated): the grain yield calculated by the equation list in this article; GY(Actual): the grain yield actually harvested in the field; GY(Theoretical): the theoretical grain yield; GW(Calculated): the grain weight calculated by the equation list in this article; GW(Apparent): the grain weight actually measured by the grains harvested in the field; GW(SG): the grain weight of grains located in secondary branches; GW(PG): the grain weight of grains located in primary branches; SSR(Apparent): the seed-setting rate measured by the grains harvested in the field; SSR(SG): the seed-setting rate of grains located in secondary branches; SSR(PG): the seed-setting rate of grains located in primary branches; Ratio-SG: the ratio of grains located in secondary branches (SG%); Ratio-PG: the ratio of grains located in secondary branches (PG%); number of spikelets (NoS): the spikelet number per panicle; and panicle number (NoP): the panicle number per unit area.
3. Results
3.1. Growth Duration and Meteorological Parameters
As shown in Table 1, the growth duration of both varieties was shortened by postponing the sowing date, with lower temperature and solar radiation, which was manifested by the shortening of the duration from transplanting to panicle initiation (TP–PI) and from panicle initiation to flowering (PI–FL). No significant difference was found between N7 and N9108. Compared with S1, the number of days from TP to PI in S2 and S3 was shortened by 14 and 27 days, respectively. Similarly, compared with S1, the number of days from PI to FL in S2 and S3 was shortened by 3 and 7 days, respectively. Unlike growth duration, the thermal resources follow a divergent pattern (Supplementary Table S1). Temperature, sunshine duration, and solar radiation before panicle initiation rose with later sowing, but declined markedly after PI. Consequently, late-sown crops experienced warmer, brighter conditions during early growth but faced cooler, dimmer environments during grain filling, explaining the inferior filling and lighter kernel weight observed in later sowings.

Table 1.
Growth durations and developmental stages on different sowing dates in 2023 and 2024.
3.2. Grain Yield and Yield Components
The grain yields of N7 and N9018 decreased with a delay in sowing dates (Table 2). A 10% ± 2.4% higher GY was found in S1 compared with S2, while a 17% ± 2.4% lower GY was found in S3 compared with S2. The major source of the GY reduction was the reduction in the 1000-seed weight. The CVs of the 1000-seed weight and total spikelet number were 7.6% and 1.7%, respectively. Both varieties responded in a similar pattern, but to a different degree, especially in the 1000-seed weight and seed-setting rate. The CVs of N9108 and N7 for the 1000-seed weight in response to variations in the sowing dates were 4.7% and 13.3%, respectively. The CV of the GY of N9108 was lower than that of N7. The lower covariance of N9108 could be responsible for its higher stability. The seed-setting rate showed a similar changing pattern.
Table 2.
Grain yields and yield components of different varieties in response to different sowing dates in 2023 and 2024.
3.3. Panicle and Spikelet Formation in Response to Sowing Dates
Although the total spikelet number shows no significant difference in response to the sowing dates, the panicle and spikelet formation are largely changed (Table 3 and Figure 1 and Figure 2). As shown in Figure 1, the tillering dynamics changed with the BFD (before-flowering duration). The lower BFD induced by LS reduced the peak tiller number and effective tiller number. Tillers in all positions increased at an early stage, reached the peak tiller number, and then reduced until the final tiller number (which was the effective tiller number and equaled the panicle number). As shown in Figure 1, the peak tiller numbers of S2 and S3 decreased by 18.4% ± 2.1% and 33.2% ± 3.8%, compared with S1 in N7, respectively; meanwhile, the effective tiller numbers of S2 and S3 decreased by 8.9% ± 1.0% and 19.2% ± 2.1%, respectively. Similarly, the peak tiller numbers of S2 and S3 decreased by 15.3% ± 2.1% and 26.1% ± 3.8%, compared with S1 in N9108, respectively; meanwhile, the effective tiller numbers of S2 and S3 decreased by 7.1% ± 1.0% and 13.2% ± 2.1%, respectively. The tillers in different tiller positions showed different response mechanisms, where late tillers (LTs) showed a greater reduction in the effective tiller ratio and peak tiller number compared with those of early tillers (ETs). The peak tiller number and effective tiller number of primary tillers (PTs) reduced by 7.1% ± 1.0% and 11.2% ± 2.1% in S2, and 13.3% ± 1.0% and 21.2% ± 4.1% in S3, compared with those in S1, respectively. The peak tiller number and effective tiller number of secondary tillers (STs) reduced by 10.1% ± 1.0% and 7.2% ± 2.1% in S2, and 22.3% ± 1.0% and 31.2% ± 4.1% in S3, compared with those in S1, respectively. The peak tiller number and effective tiller number of tertiary tillers (TTs) reduced by 10.1% ± 1.0% and 7.2% ± 2.1% in S2 compared with those in S1, respectively, while no TT was found in S3.
Table 3.
Ratios between grain number in secondary branches and grain number in primary branches (SG/PG) of panicles grown in different tiller positions.
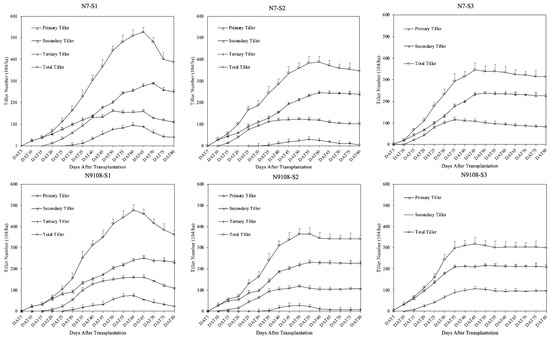
Figure 1.
Tiller dynamics of tiller numbers in different positions (primary, secondary, and tertiary tillers) and total tiller number. Note: S1 represents the first sowing date treatment on 30 April; S2 represents the second sowing date treatment on 30 May; S3 represents the third sowing date treatment on 30 June. N7 and N9108 represent Nanjing 7 and Nanjing 9108, respectively. Error bars indicate ±SD of three biological replicates.
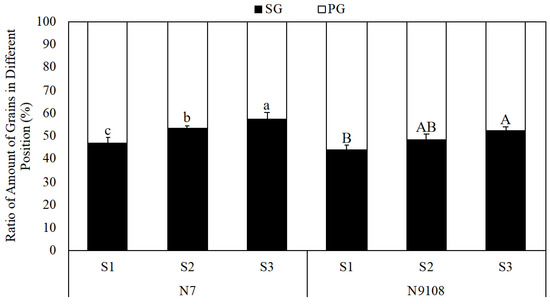
Figure 2.
Variation in the apparent ratio between grain numbers in primary branches and secondary branches per unit area in response to different sowing dates. Note: SG represents grains located on secondary branches; PG represents grains located on primary branches. The data represent the mean of 3 biological replicates. S1 represents the first sowing date treatment on 30 April; S2 represents the second sowing date treatment on 30 May; S3 represents the third sowing date treatment on 30 June. N7 and N9108 represent Nanjing 7 and Nanjing 9108, respectively. Letters after values indicate statistical significance at the p = 0.05 level. Error bars indicate ±SD of three biological replicates.
As a result, the variance in the tiller number in different positions leads to a change in the panicle size distribution in the mature stage (Table 3). The panicles formed by tillers in different positions could be divided into four major parts: the main stem (MT), primary tiller (PT), secondary tiller (ST), and tertiary tiller (TT). The MT/PT/ST/TT ratio of S1 was 17%/53%/21%/9%, which changed to 19%/60%/18%/3% and 21%/63%/16%/0 in S2 and S3, respectively (Figure 1 and Figure 2). The ratio of panicles from ETs was higher in the early-sowing treatment compared with that in the late-sowing treatment. The panicle formation differed between panicles in different tiller positions. The panicle size of ETs did not change significantly, while that of LTs did. The spikelet number of ETs was higher than that of LTs in all treatments (Table 3), which explained the increment in the spikelet number in the LS treatments.
3.4. Grain Weight Variation and Ratio of Grains in Different Spikelet Positions
In this study, the GW of SGs was significantly lower than that of PGs due to their lower grain filling. In N7, the GW of PGs was 12.3% ± 3.1% higher than that of SGs. Similarly, in N9108, the GW of PGs was 10.3% ± 2.1% higher than that of SGs (Figure 3). The seed-setting rate also showed a similar changing pattern. The SG GW reduced from 19.3 ± 1.7 g to 17.5 ± 0.9 g and 15.5 ± 1.1 g from S1 to S2 and S3 in response to LS, respectively, while no significant difference was found in the PG GW. The seed-setting rate showed a similar changing pattern. These results indicate that the grain-filling level of SGs was lower than that of PGs and could be further down-regulated via late sowing. As shown in Figure 3, the higher ratio and spikelet number in ETs induced by LS were always accompanied by a higher ratio of the SG amount per unit area. The ratio of SGs is reduced compared with MTs, following the order of PT, ST, and TT, at 8.3% ± 1.0%, 14.2% ± 2.1%, and 21.3% ± 4.1%, respectively (Table 3). As a result, the ratio of SGs per unit area was influenced by 1. the ratio of panicles in different positions and 2. the ratio of SGs per panicle. As shown in Figure 2, the SG% per unit area was increased by 8.9% ± 2.1% and 14.1% ± 3.3% in S2 and S3 compared with S1, respectively. The synergistic variation in the SG GW and SG ratio per unit area reduced the apparent GW and further reduced the GY.
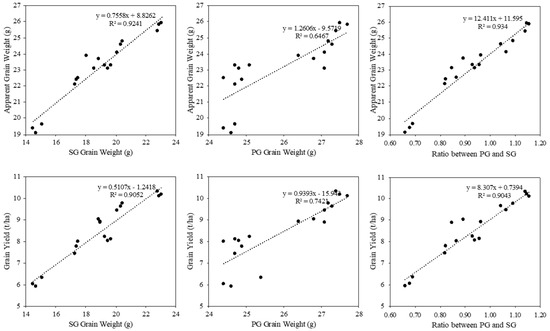
Figure 3.
Linear regression analysis of grain weight and seed-setting rate in primary (PG) and secondary (SG) branches plotted against sowing date treatments. Equations and R2 values are shown in each panel.
A principal component analysis (PCA) of traits, including grain yield, apparent grain weight, grain weight of SGs, grain weight of PGs, ratio of SG/PG, amount of SGs per unit area, and amount of PGs per unit area, was performed in both varieties to confirm the correlations of all traits with the grain yield and grain weight on different sowing dates (Figure 4). The analysis revealed two discrepant groups in the PC1 axes: the SG/PG ratio and the SG amount formed a cluster, which negatively correlated with another group, consisting of grain yield and apparent grain weight. In contrast, the grain weight and seed-setting rate of SGs positively correlated with the grain weight and yield, while the grain weight of PGs showed no significant difference. The PCA results indicate that the ratio and amount of SGs per unit area reduced the grain weight and yield, while the grain weight of SGs was a key positive regulator of these traits.
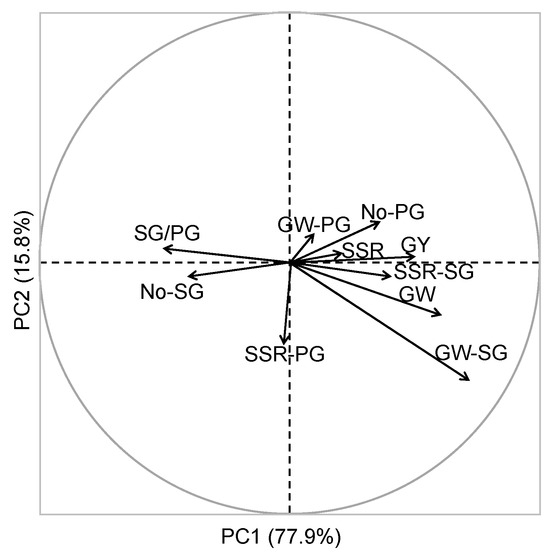
Figure 4.
Principal component analysis (PCA) based on the grain yield and yield-related traits. Note: SG and PG denote inferior (secondary) and superior (primary) grains, respectively; GY(Calculated): grain yield calculated using the equation listed in this article; GY(Actual): grain yield actually harvested in the field; GY(Theoretical): theoretical grain yield; GW(Calculated): grain weight calculated using the equation listed in this article; GW(Apparent): grain weight actually measured by the grains harvested in the field; GW(SG): grain weight of grains located in secondary branches; GW(PG): grain weight of grains located in primary branches; SSR(Apparent): seed-setting rate measured by the grains harvested in the field; SSR(SG): seed-setting rate of grains located in secondary branches; SSR(PG): seed-setting rate of grains located in primary branches; Ratio-SG: ratio of grains located in secondary branches on main stem (SG%) (MT); Ratio-PG: ratio of grains located in secondary branches on main stem PG%(MT); number of spikelets (NoS): spikelet number per panicle; panicle number (NoP): panicle number per unit area.
3.5. Equations Describing GY and GW
Traditional cultivation adopts yield components, including the panicle number, spikelet number per panicle, seed-setting rate, and 1000-grain weight, to calculate the theoretical yield to describe the GY(Theoretical) performance in the field. However, this equation dismisses the difference between panicles and grains in different positions. In this study, we propose a new equation containing the key characteristics of panicle and grain positions: GY(Calculated). The R2 of our new equation with GY(Calculated) was 0.946, which was significantly higher than that of GY(Theoretical), at 0.871. This shows the effectiveness of the new equation for actual yield estimation in the field (Figure 5). In addition, the apparent GW could also be estimated in this study by considering the GW and filling variance among grains in different positions, which comprises the GW of SGs and PGs, and the ratio of SGs and PGs per unit area. The R2 of our new equation with GW(Calculated), obtained by correlating GW(Calculated) with GW(Apparent), was 0.923, which shows the high effectiveness of this new equation (Figure 5). The details of the equation were described in the Materials and Methods Section.
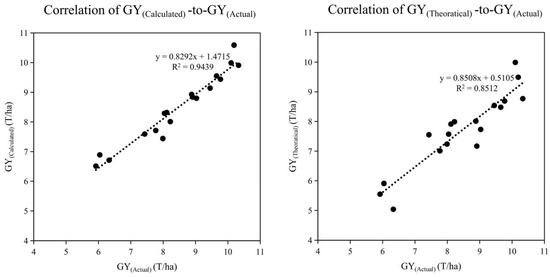
Figure 5.
Correlation between actual grain weight (GWActual)/calculated grain weight (GWCaculated), actual grain yield (GYActual)/calculated grain yield (GYCalculated), and actual grain yield (GYActual)/theoretical grain yield (GYTheoretical). Equations: GY(Theoretical) = GW ∗ SSR ∗ No(Spikelets), GY(Calculated) = GW(SG) ∗ SSR(SG) ∗ No(SG) + GW(PG) ∗ SSR(PG) ∗ No(PG). Note: SG and PG denote inferior (secondary) and superior (primary) grains, respectively; GY(Calculated): grain yield calculated using the equation listed in this article; GY(Actual): grain yield actually harvested in the field; GY(Theoretical): theoretical grain yield; GW(Calculated): grain weight calculated using the equation listed in this article; GW(Apparent): grain weight actually measured by the grains harvested in the field; GW(SG): grain weight of grains located in secondary branches; GW(PG): grain weight of grains located in primary branches; SSR(Apparent): seed-setting rate measured by the grains harvested in the field; SSR(SG): seed-setting rate of grains located in secondary branches; SSR(PG): seed-setting rate of grains located in primary branches; Ratio-SG: ratio of grains located in secondary branches SG%; Ratio-PG: ratio of grains located in secondary branches (PG%); number of spikelets (NoS): spikelet number per panicle; panicle number (NoP): panicle number per unit area.
4. Discussion
4.1. Late Sowing Reduced Grain Yield
In this study, the grain yield is reduced by late sowing due to the lower population number and reduced grain-filling level, reflected as total spikelets number, 1000 seed weight, and seed setting rate (Table 2), aligning with previous studies [5,9,10]. The decline in rice population was driven primarily by fewer panicles per unit area, which in turn reflected a lower tiller number as the shortened growth duration under delayed sowing suppressed both tiller emergence and survival (Figure 1). Previous work showed that a shortened growth duration leads to a lower panicle number per unit area and further reduces the grain yield [5,29]. In addition to the total grain number per unit area, the grain weight and seed-setting rate are two other key regulators of grain yield establishment, which mainly reflect the grain-filling level [10,30,31]. Consistent with previous publications, in this study, the grain-filling of both varieties was significantly changed by sowing date variation (Table 2), with decreases in the post-anthesis thermal resources, which further decreased in grain weight and seed-setting rate in grains (Figure 3). It has been proposed that temperature has a major role in relation to starch accumulation and could be significantly changed by sowing date treatments [5,10,32,33]. Numerous previous publications showed the uneven responses of grain filling to sowing date treatments, where the grain weight and filling characteristics could be significantly reduced by late sowing in SGs but not PGs, also leading to quality variation, as per this study (Figure 3) [34,35,36]. Significant reductions in the grain weight and seed-setting rate of SGs are found in late-sowing treatments, while less significant reductions are found in those of PGs (Figure 3) (mainly consisting of superior seeds). The grain filling of SGs (mainly consisting of inferior seeds) was more sensitive to environmental factors, which supports our result that LS treatments inhibit the grain weight by suppressing the grain-filling level of SGs [37,38,39]. The above results suggest that late sowing curtailed yield through two mechanisms: 1) a shorter vegetative phase limited tiller emergence and thus panicle density, and 2) post-anthesis thermal resources impaired starch biosynthesis—especially in secondary grains—reducing both seed-set rate and grain weight, while primary grains remained largely unaffected.
4.2. Spikelet Structure per Unit Area Regulates Grain Yield
Previous work noticed that the quality discrepancy between grains among different panicle positions and tiller types [40,41,42,43]. However, most of the previous studies focused on the total spikelets number instead of the amount of grains among different positions [32,34]. Our previous study found that the rice quality could be regulated by both (1) differential grain filling of grains among different positions and (2) the amount of grains among different positions [13]. It is worth worthy to further discover the correlation among grain yield and amount of grains among different positions. The correlation between the ratio of the SG/PG grain number per unit area and the grain yield also exhibits a regulative relationship and could be changed by the sowing dates (Figure 2). The results indicated that the proportion of SGs per unit area was enhanced under late-sowing treatments, and the enhancement of SGs per unit area decreased in grain yield and apparent grain weight, alongside the reduced grain weight of SGs (Table 2).
In this study, the ratio of the SG/PG per unit area was largely increased under late-sowing treatments (Figure 2). Some previous studies have described the responsive mechanism of SG and PG formation; however, they have produced controversial results [44,45,46]. A limited study was performed on the regulative effect of differential tiller formation on SG/PG ratio variation. Consistent with our speculation, we found a higher ratio of SGs in panicles evolved in early tillers on all sowing dates (Figure 2, Table 3). We found that a higher ratio of panicles evolved in early tillers compared with that in late tillers in response to LS treatments by further dissecting the dynamics of the tiller number in different positions. The changed ratio of the panicles in different positions was closely related to the growth duration, especially before the flowering duration [5,30]. We found that although the amount of early tillers was not significantly changed with late sowing, the amount of late tillers was greatly reduced because the shortened duration reduced or even cut down the panicle formation of late tillers, as found in previous studies in different crops (Figure 1) [47,48,49]. The above results raised a “photoperiod/growth-duration → tiller types → panicle architecture” pathway, superimposed on the classic grain-weight/number responses: shifts in day-length and associated temperature first shorten the vegetative window, altering the relative abundance of tiller orders; this rearrangement then propagates into population-level changes in the ratio of primary to secondary branches, ultimately determining the proportion of grains in different positions at harvest.
4.3. Significance of SG Ratio on Rice Production
The conventional yield component equation (GY = panicle number × spikelets per panicle × seed-setting rate × 1000-grain weight) has long been used to estimate rice yield [4,50]. However, it assumes a uniform grain weight across all spikelet positions and, therefore, cannot account for the frequently observed differences between superior (primary-branch) and inferior (secondary-branch) grains. The wide adoption of large-panicle super-rice has exposed the long-hidden problem of uneven grain filling between superior (primary-branch) and inferior (secondary-branch) grains, a discrepancy that global climate and cropping systems change further amplify this discrepancy [12,18,31]. Consequently, the conventional approach to assessing rice population quality, which is based on uniform filling rate, grain weight, and quality across all spikelets, is no longer accurate. We propose a new equation (GY(calculated)) to overcome this limitation. This equation explicitly partitions yield into the two grain classes and, consequently, improves the estimation accuracy (R2 = 0.94 vs. 0.85 for the conventional equation (Figure 5)). We found a high correlation between GY(calculated) and GY(actual), with R2 = 0.965 (Figure 5), which indicated that the grain yield calculation could be optimized with more parameters for separated PG and SG characteristics.
The high coefficient of the new equation indicated the SG ratio could be a key trait in the field, while the related information was limited in previous studies. The theoretical yield calculation could be made more accurate by applying the SG%-related parameters to the yield calculation, as shown in this study. Moreover, guidance for future field crop production was proposed in this study. Our results suggest that more PGs, with a higher grain weight and stability, could be produced in early-sowing conditions (Figure 3). In the field, proper early sowing could be an effective method to enhance the grain yield and its stability, since early sowing improves the ratio of PGs per unit area, as previous studies [50,51]. In this study, N9108, which has a significantly higher PG ratio than N7, shows a higher grain weight and yield stability in response to sowing dates (Table 1 and Figure 3). The grain yield difference was caused by the higher grain filling between N7 and N9108, as well as the higher ratio of PGs in N9108. Consistent evidence from earlier studies [52,53] and the present data converge on one point: cultivars that maintain a larger share of superior (primary-branch) grains cope better with delayed sowing, preserving both grain weight and yield. Therefore, breeding and selection programs should prioritize genotypes with inherently high PG proportions; these cultivars are more likely to sustain high yields under late-sowing or other climate-related stresses.
5. Conclusions
Late sowing reduced japonica rice yield by two consecutive, position-specific steps. Pre-anthesis-step, the shortened pre-heading phase suppressed late tiller emergence and increased the proportion of early tillers, which inherently produce more secondary-branch (SG) spikelets; this raised the SG/PG ratio at the population level. Post-anthesis step, cooler post-anthesis conditions restricted grain filling almost exclusively in SGs, decreasing their grain weight and seed-set, whereas primary-branch (PG) grains remained largely unaffected. Integrating the SG/PG balance into the yield equation improved estimation accuracy (R2 0.94 vs. 0.85 for the conventional model) and provided a quantitative basis for selecting cultivars with a higher PG fraction. Advancing sowing date or breeding varieties that maintain more PGs can therefore enhance both grain yield and yield stability under climate-driven late-sowing scenarios.
Supplementary Materials
The following supporting information can be downloaded at: https://www.mdpi.com/article/10.3390/app152412987/s1, Table S1: The mean daily temperature (Tmean), minimum temperature (Tmin), maximum temperature (Tmax), sunshine duration, and solar radiation in response to sowing date treatments in 2023 and 2024; Table S2: List of abbreviations and their definitions used in this study.
Author Contributions
Conceptualization, B.L. and C.X.; methodology, B.L. and C.X.; investigation, B.L., N.L., Z.C., R.C. and Y.Z.; field management, Z.C.; data curation, B.L. and N.L.; data collection, N.L., R.C. and Y.Z.; sample processing, R.C.; formal analysis, B.L. and N.L.; validation, N.L.; visualization, B.L.; resources, Y.Z.; writing—original draft preparation, B.L., N.L. and C.X.; writing—review and editing, B.L., N.L., Z.C., R.C. and C.X.; project administration, C.X.; funding acquisition, C.X.; correspondence, C.X. B.L. and N.L. have contributed equally to this article. All authors have read and agreed to the published version of the manuscript.
Funding
This work was supported by a grant funded by Hefei Lvbao Seedling Company (Contract No. lg24448), Scientific Fund of Nanjing Botanical Garden Mem. Sun Yat-Sen (JSPKLB202510) and the National Key Research and Development Program Project (2023YFE0110100).
Informed Consent Statement
Not applicable.
Data Availability Statement
The data presented in this study are available on request from the corresponding author. The data are not publicly available due to their ongoing use in related research and privacy restrictions related to field experiment locations.
Acknowledgments
The authors would like to acknowledge the support provided by the Anhui Science and Technology Achievement Transformation Promotion Center, Hefei, Anhui, China, for the provision of experimental facilities.
Conflicts of Interest
The authors declare no conflicts of interest.
References
- Khush, G.S.; Gupta, P. Strategies for increasing the yield potential of cereals: Case of rice as an example. Plant Breed. 2013, 132, 433–436. [Google Scholar] [CrossRef]
- Mcdonald, A.J.; Riha, S.J.; Duxbury, J.M.; Lauren, J.G. Wheat responses to novel rice cultural practices and soil moisture conditions in the rice–wheat rotation of Nepal. Field Crops Res. 2006, 98, 116–126. [Google Scholar] [CrossRef]
- Bhushan, L.; Ladha, J.K.; Gupta, R.K.; Singh, S.; Tirol-Padre, A.; Saharawat, Y.; Gathala, M.; Pathak, H. Saving of water and labor in a rice–wheat system with no-tillage and direct seeding technologies. Agron. J. 2007, 99, 1288–1296. [Google Scholar] [CrossRef]
- He, H.; Dang, H.; Liu, C.; Wang, Y.; Wu, Z.; Hu, Z.; Li, Q. Optimizing delayed sowing date decreases methane emissions from paddies and ensures the comprehensive benefits of rice production. Eur. J. Agron. 2023, 151, 127001. [Google Scholar] [CrossRef]
- Zhou, Z.; Jin, J.; Liu, J.; Si, Y. Optimizing the sowing window for direct-seeded rice (Oryza sativa L.) considering high yield and methane emissions in Central China. Agric. Syst. 2023, 205, 103594. [Google Scholar] [CrossRef]
- Van Groenigen, K.J.; Van Kessel, C.; Hungate, B.A. Increased greenhouse-gas intensity of rice production under future atmospheric conditions. Nat. Clim. Chang. 2013, 3, 288–291. [Google Scholar] [CrossRef]
- Lipper, L.; Thornton, P.; Campbell, B.M.; Torquebiau, E. Climate smart agriculture for food security. Nat. Clim. Chang. 2014, 4, 1068–1072. [Google Scholar] [CrossRef]
- Toosey, R.D.; Usher, J.W. Influence of the level of nitrogenous fertilizer on the yield and dry matter content of marrow stem kale at various sowing dates. Nature 1966, 211, 216–217. [Google Scholar] [CrossRef]
- Deng, F.; Zhang, C.; He, L.; Liao, S.; Li, Q.; Li, B.; Zhu, S.; Gao, Y.; Tao, Y.; Zhou, W.; et al. Delayed sowing date improves the quality of mechanically transplanted rice by optimizing temperature conditions during growth season. Field Crops Res. 2022, 281, 108493. [Google Scholar] [CrossRef]
- Wenting, W.; Wenpei, C.; Ke, X.; Hui, G.; Haiyan, W.; Hongcheng, Z. Effects of early- and late-sowing on starch accumulation and associated enzyme activities during grain filling stage in rice. Rice Sci. 2021, 28, 191–199. [Google Scholar] [CrossRef]
- Peng, S.; Cassman, K.G.; Virmani, S.S.; Sheehy, J.; Khush, G.S. Yield potential trends of tropical rice since the release of ir8 and the challenge of increasing rice yield potential. Crop Sci. 1999, 39, 1552–1559. [Google Scholar] [CrossRef]
- Yang, J.; Zhang, J. Grain-filling problem in ‘super’ rice. J. Exp. Bot. 2010, 61, 1–5. [Google Scholar] [CrossRef]
- Xu, C.; Lu, B.; Liang, L.; Yang, F.; Ding, C.; Yan, F.; Zhou, Y.; Jiang, Z.; Liu, Z.; Ding, Y. Delayed Sowing Date Improves Rice Cooking and Taste Quality by Regulating the Quantity and Quality of Grains Located on Secondary Branches. Agronomy 2022, 12, 1316. [Google Scholar] [CrossRef]
- Chen, X.; Zhong, L.; He, X.; Fu, J.; Xiong, K.; He, H. Effects of genotype and seeding-date on formation of branches and spikelets in rice panicle. Chin. J. Rice Sci. 2006, 4, 424–428. [Google Scholar]
- He, C.X.; Bai, S.N. Photoperiodic effects on rice after the secondary-branch primordium stage of young panicle development. Sci. Agric. Sin. 1997, 30, 7. (In Chinese) [Google Scholar]
- Zhang, N.; Liu, Y.; Gui, S.; Wang, Y. Regulation of tillering and panicle branching in rice and wheat. J. Genet. Genom. 2024, 52, 869–886. [Google Scholar] [CrossRef]
- Counce, P.A.; Siebenmorgen, T.J.; Poag, M.A.; Holloway, G.E.; Kocher, M.F.; Lu, R. Panicle emergence of tiller types and grain yield of tiller order for direct-seeded rice cultivars. Field Crops Res. 1996, 47, 235–242. [Google Scholar] [CrossRef]
- Yoshida, S. Fundamentals of rice crop science, Climate and rice. Master’s Thesis, Texas A&M University, College Station, TX, USA, 1981. [Google Scholar]
- Wang, L.Q.; Bai, G.J.; An, D.W. A preliminary study on the high-yielding techniques of Choi Zhu-Song: II. Changes in tillering dynamics of high-yielding rice fields. Acta Agron. Sin. 1965, 4, 11–18. (In Chinese) [Google Scholar]
- Duan, H.L. Comparative Study on the Productivity of Different Tillering Nodes in Rice. Ph.D. Thesis, Southwest University, Chongqing, China, 2008. (In Chinese). [Google Scholar]
- Kong, F.Y. Study on the Relationship Between Growth Characteristics and Yield Components of Direct-Seeded Rice. Ph.D. Thesis, Guangxi University, Nanning, China, 2019. [Google Scholar]
- Yan, G.B. Preliminary analysis of tiller productivity in early-maturing rice varieties: Report V. Under ultra-sparse transplanting conditions, different. J. Jilin Agric. Sci. 1994, 2, 14–17. (In Chinese) [Google Scholar]
- Cai, Y.G.; Li, Y.Z. Studies on tillering regulation in hybrid rice: I. Tracking of tiller emergence and ear-bearing for several hybrid rice combinations with different sowing dates. Fujian Rice Wheat Sci. Technol. 1999, 3, 11–13. (In Chinese) [Google Scholar]
- Yan, M.L. Effects of different basic seedling densities on tiller ear-bearing and panicle-grain structure of late hybrid rice. Crop Res. 1998, 12, 4. (In Chinese) [Google Scholar]
- Lu, R. Methods for Soil Agricultural Chemical Analysis; China Agricultural Science and Technology Press: Beijing, China, 2000. (In Chinese) [Google Scholar]
- Bao, S. Soil Agricultural Chemical Analysis, 3rd ed.; China Agriculture Press: Beijing, China, 2000. (In Chinese) [Google Scholar]
- Lancashire, P.D.; Bleiholder, H.; Van Den Boom, T.; Langelüddeke, P.; Stauss, R.; Weber, E.; Witzenberger, A. A uniform decimal code for growth stages of crops and weeds. Ann. Appl. Biol. 2010, 119, 561–601. [Google Scholar] [CrossRef]
- Hanada, K. Tillers. In Science of the Rice Plant Volume 1: Morphology; Matsuo, K., Hoshikawa, K., Eds.; Food and Agriculture Policy Research Center: Tokyo, Japan, 1993; pp. 222–258. [Google Scholar]
- Kaur, D.; Singh, A.; Sindhu, V.K. Growth and productivity of direct-seeded basmati rice (Oryza sativa L.) as influenced by sowing dates and irrigation schedules in north-western India. Agric. Water Manag. 2024, 302, 108994. [Google Scholar] [CrossRef]
- Zhou, Y.; Xiaoxiao, L.; Jing, C.; Yong, L.; Jianliang, H.; Shaobing, P. High nitrogen input reduces yield loss from low temperature during the seedling stage in early-season rice. Field Crops Res. 2018, 228, 68–75. [Google Scholar] [CrossRef]
- Ding, Y.F.; Huang, P.S.; Ling, Q.H. Relationship between emergence of tiller and nitrogen concentration of leaf blade or leaf sheath on specific node of rice. J. Nanjing Agric. Univ. 1995, 18, 14–15. [Google Scholar]
- Wang, G.-Q.; Li, H.-X.; Feng, L.; Chen, M.-X.; Meng, S.; Ye, N.-H.; Zhang, J. Transcriptomic analysis of grain filling in rice inferior grains under moderate soil drying. J. Exp. Bot. 2019, 70, 1597–1611. [Google Scholar] [CrossRef] [PubMed]
- Yang, J.; Zhang, J.; Wang, Z.; Zhu, Q.; Liu, L. Activities of enzymes involved in sucrose-to-starch metabolism in rice grains subjected to water stress during filling. Field Crops Res. 2003, 81, 69–81. [Google Scholar] [CrossRef]
- Thakur, A.K.; Rath, S.; Roychowdhury, S.; Uphoff, N. Comparative performance of rice with system of rice intensification (sri) and conventional management using different plant spacings. J. Agron. Crop Sci. 2010, 196, 146–159. [Google Scholar] [CrossRef]
- Zhang, X.; Xiong, H.; Wang, R.; Li, J.; Dong, Z.; Jia, Z.; Han, Q. Adaptive sowing window strategy for improving grain filling and water loss characteristics of film-mulched maize in northwest China. Field Crops Res. 2025, 326, 109855. [Google Scholar] [CrossRef]
- Zhou, L.; Han, X.; Yang, Q.; Feng, H.; Siddique, K.H.M. Optimizing sowing date to mitigate loss of growing degree days and enhance crop water productivity of groundwater-irrigated spring maize. Agric. Water Manag. 2024, 305, 109097. [Google Scholar] [CrossRef]
- Yu, J.; Rezaei, E.E.; Reckling, M.; Nendel, C. Winter wheat–soybean relay intercropping in conjunction with a shift in sowing dates as a climate change adaptation and mitigation strategy for crop production in Germany. Field Crops Res. 2025, 322, 109695. [Google Scholar] [CrossRef]
- Zhang, C.; Zhou, L.; Zhu, Z.; Lu, H.; Zhou, X.; Qian, Y.; Li, Q.; Lu, Y.; Gu, M.; Liu, Q. Characterization of grain quality and starch fine structure of two japonica rice (Oryza sativa) cultivars with good sensory properties at different temperatures during the filling stage. J. Agric. Food Chem. 2016, 64, 4048–4057. [Google Scholar] [CrossRef]
- Nakamura, Y.; Yuki, K. Changes in enzyme activities associated with carbohydrate metabolism during the development of rice endosperm. Plant Sci. 1992, 82, 15–20. [Google Scholar] [CrossRef]
- Fukushima, A.; Akita, S. Differential developmental pattern of tiller bud in rice (Oryza sativa). Jpn. J. Crop Sci. 1997, 66, 202–207. [Google Scholar] [CrossRef][Green Version]
- Ling, Q.; Su, Z.; Zhang, H. Relationship between Earbearing Tiller Percentage and Population Quality and Its Influential Factors in Rice. Acta Agron. Sin. 1995, 21, 463–469. [Google Scholar][Green Version]
- Zhu, D.; Fang, C.; Qian, Z.; Guo, B.; Huo, Z. Differences in starch structure, physicochemical properties and texture characteristics in superior and inferior grains of rice varieties with different amylose contents. Food Hydrocoll. 2020, 110, 106170. [Google Scholar] [CrossRef]
- Guo, Y.; Hong, D. Novel pleiotropic loci controlling panicle architecture across environments in japonica rice (Oryza sativa L.). J. Genet. Genom. 2010, 37, 533–544. [Google Scholar] [CrossRef]
- Jun, Y.U.; Guang-Can, T.; Xing-Qiang, G.; Shi-Cai, Y.; Guang-Hui, X. Tillering pattern and its effects on yield of rice directly sown after winter wheat in the huang-huai plain. Sci. Agric. Sin. 2008, 3, 678–686. [Google Scholar]
- Hu, X.; Liu, Y.; Zhong, X.; Hu, R.; Li, M.; Peng, B.; Pan, J.; Liang, K.; Fu, Y.; Huang, N. Optimized nitrogen management improves grain yield of rice by regulating panicle architecture in south China. Heliyon 2024, 10, e34607. [Google Scholar] [CrossRef] [PubMed]
- Allende-Montalban, R.; Gabriel, J.L.; de Andrés, E.F.; Porcel, M.Á.; Santín-Montanya, M.I.; Gandía, M.L.; Martín-Lammerding, D.; Nieto, M.T.; Delgado, M.d.M.; San-Juan-Heras, R.; et al. Nitrogen fertilization and sowing date as wheat climate change adaptation tools under mediterranean conditions. Eur. J. Agron. 2024, 161, 127346. [Google Scholar] [CrossRef]
- Casal, J.J.; Deregibus, V.A.; Sánchez, R.A. Variations in tiller dynamics and morphology in lolium multiflorum lam.vegetative and reproductive plants as affected by differences in red/far-red irradiation. Ann. Bot. 1985, 56, 553–559. [Google Scholar] [CrossRef]
- Kariali, E.; Mohapatra, P.K. Hormonal regulation of tiller dynamics in differentially-tillering rice cultivars. Plant Growth Regul. 2007, 53, 215–223. [Google Scholar] [CrossRef]
- Song, S.; Yue, R.; Chen, L.; Li, S.; Tao, Y.; Zhou, Z.; Nie, L. Optimizing sowing date to enhance grain yield and quality formation of colored rice in tropical regions of China. Field Crops Res. 2025, 322, 109760. [Google Scholar] [CrossRef]
- Li, G.; Xue, L.; Gu, W.; Yang, C.; Wang, S.; Ling, Q.; Qin, X.; Ding, Y. Comparison of yield components and plant type characteristics of high-yield rice between Taoyuan, a ‘special eco-site’ and Nanjing, China. Field Crop Res. 2009, 12, 214–221. [Google Scholar] [CrossRef]
- Wu, Z. Effect of sowing date on the morphological development and physiological activities of the root system of intersubspecific hybrid rice. Acta Agron. Sin. 1996, 2, 178–184. [Google Scholar]
- Hu, J.X. Study on the Relationship Between Rice Panicle Traits and Yield and Quality. Ph.D. Thesis, Southwest University, Chongqing, China, 2008. [Google Scholar]
- Xie, W.X.; Li, J.G.; Han, Y.; Liu, B.; Fu, L.; Liang, C.B. Effects of sowing date on the dynamic grain-filling of superior and inferior spikelets in rice. J. Anhui Agric. Sci. 2010, 38, 25–28. (In Chinese) [Google Scholar]
Disclaimer/Publisher’s Note: The statements, opinions and data contained in all publications are solely those of the individual author(s) and contributor(s) and not of MDPI and/or the editor(s). MDPI and/or the editor(s) disclaim responsibility for any injury to people or property resulting from any ideas, methods, instructions or products referred to in the content. |
© 2025 by the authors. Licensee MDPI, Basel, Switzerland. This article is an open access article distributed under the terms and conditions of the Creative Commons Attribution (CC BY) license (https://creativecommons.org/licenses/by/4.0/).