Abstract
The article discusses the issue of improving the management efficiency of spare parts at railway stations to reduce operational costs and enhance the effectiveness of rolling stock maintenance. A comparative analysis was conducted between traditional inventory storage strategies and models involving the redistribution of surplus spare parts between stations. For the quantitative assessment of the proposed approach, a mathematical model based on a multi-criteria decision analysis (MCDA) methodology was developed that includes the calculation of storage, transportation, and redistribution costs. The results show that redistributing spare parts reduces storage costs by 25%, while implementing the proposed strategy shortens the average downtime of railway wagons by 12.5%, confirming its economic feasibility. Moderate savings were achieved at the Zharyk and Zhanaaul stations, where excessive stockpiling of spare parts was reduced, and the main logistics hub—Karaganda Sortirovochnaya—helped minimize the risk of downtime. At the same time, the analysis revealed certain limitations, such as increased transportation costs and reduced network stability when redistribution volumes are high. The practical implications of the study lie in the potential implementation of the developed inventory management improvement model, not only for railway transport but also for other industries such as aviation and automotive logistics. Spare parts redistribution reduces the financial losses associated with frozen capital, increases the capital turnover, and decreases the risk of depreciation of stored components. The proposed approach ensures a more balanced distribution of resources between stations, facilitating an increase in the profitability of railway enterprises.
1. Introduction
The issue of efficient spare parts management in railway transport is a global challenge. A high degree of rolling stock wear, pressure to reduce maintenance costs, and the need to ensure transport reliability affect both developed and emerging economies. Reports by the UIC [1] and OECD [2] indicate that even countries with modern railway infrastructure face difficulties in maintaining a balance between parts availability and the costs of storage and transportation. Studies conducted in China [3], USA [4], and Europe [5] demonstrate that the integration of warehousing and logistics processes—including the coordination of inventory and transport—is a fundamental condition for improving the operational efficiency and safety of railway systems.
Under the conditions of the Republic of Kazakhstan, this problem becomes particularly severe. Between 2020 and 2024, the average wear level of freight wagons exceeded 60%, reaching a peak value of 68% in 2020 [6,7]. Despite the acquisition of 254 new units between 2020 and 2023, by the end of 2024, the utilization rate still remained at 61% [7]. Such a high proportion of rolling stock over 30 years old increases the demand for spare parts and places significant pressure on storage and logistics systems.
To better capture the scale of the problem, the situation in Kazakhstan should be compared with the experiences of other countries with varying levels of railway infrastructure development [8]. A comparative analysis (Table 1) shows that in rapidly developing countries, such as China, India, and Brazil, the high depreciation levels of wagons and locomotives primarily result from the large volume of transport operations and the rapid growth in demand. In contrast, in highly developed countries—such as Germany, France, Japan, and Switzerland—the degree of rolling stock wear is significantly lower, which is the result of systematic modernization investments [9] and the implementation of predictive maintenance solutions [3,5]. A different situation can be observed in the United States and Russia, where, despite large rolling stock resources, intensive use leads to high maintenance costs and the need to develop complex logistics systems for spare parts [4,10].
The comparison clearly shows that Kazakhstan belongs to the group of countries most at risk of losing transport reliability due to the aging of rolling stock, as confirmed by international analyses concerning railway transport safety and efficiency [11,12]. Significant differences in railway network length, the number of locomotives in operation, and modernization policies make such comparisons not only a starting point for theoretical considerations but also a practical tool supporting the development of modern strategies for spare parts inventory management [13,14].
Despite the broad international experience, a key challenge remains unresolved: how to design an inventory management model that simultaneously reduces storage costs, lowers immobilized capital, and maintains operational reliability under conditions of high rolling-stock wear. In Kazakhstan, this challenge is intensified by uneven station-level demand, a high share of aging wagons, and the absence of centralized coordination between warehousing and logistics.
This study addresses several interconnected research questions, namely, how the traditional and redistribution models differ in their economic and operational performance; whether a centralized redistribution scheme can reduce costs without compromising availability and network stability; and which alternative provides the most balanced and sustainable inventory management solution under real operating conditions.
The contribution of this research lies in developing and evaluating a centralized spare parts redistribution model tailored to the conditions of Kazakhstan’s railway system, and in demonstrating its practical feasibility and advantages for improving maintenance efficiency and resource utilization.
As studies in the field of maintenance management indicate, shortages in the availability of spare parts lead to extended downtimes of wagons and locomotives, which directly cause disruptions in transport schedules and measurable financial losses for operators [15]. Similar conclusions have been presented in analyses of railway transport reliability systems, where it has been emphasized that a shortage of critical components can generate a domino effect throughout the entire logistics chain [16]. On the other hand, as noted by researchers dealing with warehouse management improvement, excessive inventories lead to increased costs associated with storage and logistics operations [17]. This phenomenon is further exacerbated by the gradual depreciation of materials, which has been thoroughly discussed in studies on the life-cycle costs of technical components [18]. Additional financial burdens include the necessity of insuring stored inventory and—equally important—the “frozen capital” effect, which limits the financial liquidity of railway enterprises [19]. The inventory strategies used so far in practice, based on uniform allocation of standard part sets across stations, have been assessed as inefficient since they result in surpluses at some locations and shortages at others, further destabilizing maintenance processes [20].

Table 1.
The levels of railway rolling stock wear in selected countries on a five-point scale. Scale: 1—very low (<20%), 2—low (20–40%), 3—moderate (40–60%), 4—high (60–80%), and 5—very high (>80%).
Table 1.
The levels of railway rolling stock wear in selected countries on a five-point scale. Scale: 1—very low (<20%), 2—low (20–40%), 3—moderate (40–60%), 4—high (60–80%), and 5—very high (>80%).
| Country | Degree of Wear (1–5) | Main Sources |
|---|---|---|
| Ukraine | 4—high | [6,10,11] |
| USA | 4—high | [1,19] |
| Brazil | 4—high | [18] |
| Canada | 4—high | [19] |
| Australia | 3—moderate | [20] |
| Italy | 3—moderate | [21] |
| Uzbekistan | 3—moderate | [11,12] |
| Poland | 3—moderate | [12] |
| Germany | 3—moderate | [14] |
| Frane | 3—moderate | [15] |
| China | 2—low | [2] |
| Japan | 2—low | [16] |
| Switzerland | 1—very low | [17] |
Studies indicate the effectiveness of various methods for improving spare parts management efficiency, including genetic algorithm (GA) [21], artificial intelligence (AI), and the Internet of Things (IoT) solutions [22]; risk-based decision models (RBDMs) [19]; predictive maintenance strategies (PdMs) [3]; integrated warehouse–transport models (IWTMs) [4]; hybrid Zero-One Algorithm–Least Squares Support Vector Machine (ZOA–LSSVM) approaches [23]; and inventory policies that consider maintenance priorities [24]. In Europe, solutions combining location analysis with inventory management are also being developed [5]. However, in systems such as the Kazakh railway network, there remains a gap related to the specific nature of dispersed stations and varying demand levels. Inappropriate strategies lead to financial losses and decreased operational efficiency [25], while the integration of maintenance and logistics requires more flexible models [26]. One effective solution is the redistribution of spare parts between stations, identified as an efficient mechanism for balancing shortages and surpluses [27]. When based on real-time demand, such redistribution can reduce costs, increase capital turnover, and improve transport reliability [26].
The aim of this study is to assess the efficiency of redistributing surplus spare parts between railway stations compared with their traditional long-term storage. The analysis presented in the article demonstrated that applying the redistribution strategy significantly reduces storage and transportation costs, increases capital turnover, and minimizes financial losses resulting from immobilized funds. In light of these findings, the research hypothesis assumes that spare parts redistribution—based on the current demand of individual stations—represents a more economically and organizationally efficient inventory management strategy than traditional storage while also contributing to improved reliability of railway operations.
2. Materials and Methods
The analysis was based on statistical and operational data describing the railway system of the Republic of Kazakhstan, supplemented with comparative information from other countries. The input data were obtained from reports from the Ministry of Transport and the National Bureau of Statistics [6,28], as well as publications by the Organisation for Economic Co-operation and Development (OECD) [29], the International Union of Railways (UIC) [30], and national transport authorities [10]. The parameters considered included the total railway network length, the number of locomotives, the average age of rolling stock, and the frequency of repairs. A comparative summary of these data is presented in Table 1.
The second source of data consisted of information on the logistics of spare parts used in the Karaganda region (Table 2). The inventory structure was divided into four groups: critical parts, scheduled replacement parts, rarely used components, and auxiliary materials. The data on the inventory structure were used to assess potential economic effects (storage costs, capital immobilization, inventory turnover) and organizational effects (delivery time, parts availability) (Table 2).
Table 2.
Minimum spare parts inventory at technical stations (author’s own elaboration based on [6]).
Table 2 presents the general regulatory ranges of minimum stock for each spare part group, where the model uses the specific minimum stock values assigned to each technical station. These fixed thresholds are defined in the station’s technological process and approved by the regional maintenance department.
The current demand for spare parts at each station was determined based on actual failure data and scheduled maintenance activities provided by the regional wagon depot. Demand was calculated as the average number of component replacements over a representative 12-month period using data from the technical service points of the Karaganda division (Republic of Kazakhstan). In addition, each technical service point operates with a predefined minimum stock level, which must be maintained regardless of the observed demand. Thus, the current demand reflects both corrective repairs and planned preventive maintenance while also accounting for the mandatory non-reducing stock levels. This approach captures real operational dynamics and is consistent with the methodology applied by the national railway operator of Kazakhstan.
The redistribution model is based on a centralized inventory management scheme. Sortirovochnaya functions as the main hub where all surplus spare parts from peripheral stations are consolidated. The peripheral stations keep only their minimum safety stock and submit a request to the central hub when additional parts are needed. The required components are then dispatched from the hub to the requesting stations as necessary. This centralized scheme ensures unified control over spare part flows across the network and eliminates the unnecessary duplication of inventory. The spatial arrangement of the stations and redistribution routes is shown in Figure 1.
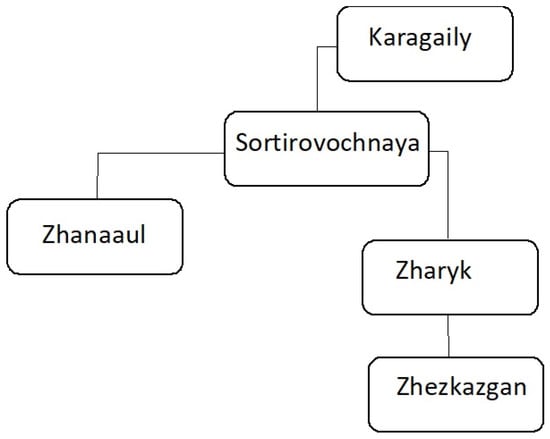
Figure 1.
Geographical layout of the technical stations in the Karaganda region.
The study was conducted using multi-criteria decision analysis (MCDA), a method widely applied in transport engineering and logistics [3,21,22]. This approach enables the simultaneous evaluation of multiple indicators that differ in units and nature (economic, organizational, and operational).
For the purpose of the analysis, two logistical models were developed, differing in their approach to spare parts inventory management: the traditional model and the redistribution model. In the traditional model, each technical station maintains a full set of spare parts, regardless of the actual traffic load or failure frequency at a given location. The minimum stock levels were determined based on operational data (Table 3), and the economic values were calculated using the formulas for storage costs (Cm) and immobilized capital (Kz). This model ensures high part availability (A ≈ 1) but involves significant capital immobilization and low inventory turnover.
Table 3.
Unit costs and prices used in the analysis (author’s own elaboration based on [6]).
In the redistribution model, full warehouses at all stations are eliminated. Each location maintains only a minimal stock of critical parts, while surpluses are transferred between stations depending on the current demand. Additional costs are generated by redistribution transport, calculated according to Formula (1), but in return, inventory turnover increases and the level of immobilized capital decreases [24]. The efficiency of the system depends on the performance of the logistics mechanism and the speed of deliveries [4], which are reflected in the availability (A) and stability (S) indicators. A comparison of the key features of both models is presented in Table 4.
Table 4.
Comparison of evaluation criteria for the traditional and redistributive inventory management models.
To ensure an objective assessment of both variants, it was necessary to determine a set of quantitative indicators describing the economic, organizational, and operational aspects of the system. Each indicator was defined by a mathematical formula and supplemented with a practical interpretation and the theoretical basis for its application.
The storage cost was calculated according to Formula (1):
where Cm—storage cost [USD/year], km—unit cost of storage area [USD/m2/year], and Pm—storage area [m2].
This criterion reflects the direct financial burden on operators resulting from maintaining inventory, which is of particular importance in railway systems due to large-sized components, such as wheelsets and traction motors.
The transportation cost of spare parts was determined using Formula (2):
where Ct—transportation cost [USD], kt—unit transportation cost [USD/km], and L—average transport distance of spare parts [km].
This criterion makes it possible to assess the additional financial expenditures generated by resource redistribution, which—if the system is poorly organized—may exceed the savings resulting from inventory reduction.
The value of immobilized capital in inventory was determined using Equation (3):
where Kz—total value of capital immobilized in spare parts [USD], pᵢ—unit price of a given part [USD/pc], and qᵢ—quantity of components of a given type [pcs].
This is one of the most commonly used criteria for assessing the rationality of inventory management, as a high Kz level limits financial liquidity and increases the risk of depreciation of stored components.
The efficiency of resource utilization was evaluated through inventory turnover, defined by Formula (4):
where R—inventory turnover ratio [–], Q—annual parts consumption [pcs], and Z—average inventory level [pcs].
A high turnover rate indicates a dynamic flow of materials and rational warehouse management, while a low rate points to the accumulation of excessive resources and inefficient use of capital.
The impact of spare parts shortages on operations was described by the average downtime, calculated according to Formula (5):
where Tp—average downtime [h], tj—duration of vehicle immobilization during event j [days], and m—number of failure events [–].
This criterion reflects the direct impact of the supply system on transport reliability and the losses resulting from rolling stock downtime. The parts availability was defined by Equation (6):
where A—availability index [–], Nd—number of requests fulfilled by parts delivery [–], and Nc—total number of requests [–].
A high value of this indicator means that the logistics system meets operational requirements, which directly translates into transport punctuality and reliability.
The final element was network stability, as determined according to Formula (7):
where S—network stability [–], σT—standard deviation of delivery time [days], and μT—average delivery time [days].
This indicator takes into account not only the average logistical efficiency but also the variability of processes, thus providing a better reflection of the system’s reliability over a longer time horizon.
Since the analyzed indicators had different measurement units (e.g., USD, days, pieces) and opposite improvement directions (some should be minimized, such as costs and downtimes, while others should be maximized, such as availability or turnover), it was necessary to standardize them within a common scale. For this purpose, vector normalization was applied according to Formula (8):
where vij—normalized value of criterion j for variant i and xij—non-normalized value calculated according to the formulas presented in the section.
Before applying vector normalization, all “min-type” criteria (storage cost Cm, transport cost Ct, immobilized capital Kz, and downtime Tp) were re-oriented to ensure a uniform “higher = better” interpretation. For this purpose, the following inversion was applied (9):
This transformation preserves the relative differences between alternatives while aligning the direction of improvement with the “max-type” criteria (inventory turnover R, availability A, and stability S). After the re-orientation, vector normalization (Formula (8)) was applied to all criteria.
To verify the robustness, an additional sensitivity test was performed using an alternative orientation based on the min–max transformation (10):
The final ranking of policy options remained unchanged, and differences in the synthetic index Vi did not exceed 3%, confirming that the evaluation is stable with respect to the choice of orientation method.
After performing normalization and assigning weights (Table 5) to individual criteria, it was necessary to calculate a synthetic index that enables the comparison of alternative variants. For this purpose, the weighted sum method of normalized values was applied, which is widely used in multi-criteria decision analysis (MCDA) methods such as TOPSIS (Technique for Order Preference by Similarity to Ideal Solution) and WSM (Weighted Sum Model).
Table 5.
Comparative characteristics of logistical models.
To ensure methodological transparency and reproducibility, the selection of MCDA criteria and the determination of their weights were supported by expert evaluation. The set of seven criteria was chosen based on established recommendations in the literature regarding railway logistics, inventory management, and maintenance optimization. The relative importance of the criteria was assessed by a five-member expert panel representing institutions directly involved in railway research and maintenance practice, namely, Łukasiewicz Research Network—Tabor Railway Vehicle Institute (Poznań, Poland), Poznan University of Technology (Poland), and Abylkas Saginov Karaganda Technical University (Kazakhstan).
The Analytic Hierarchy Process (AHP) was selected as the weighting method. This choice follows recommendations presented in the multi-criteria decision-making literature. The method is widely used in engineering applications and is appropriate in situations that require expert knowledge. Alternative approaches, such as entropy weighting or literature-based default values, were considered. AHP was preferred because it enables experts to provide structured judgements and because it offers a clear measure of consistency. The suitability of AHP is supported by the theoretical discussion in [31] and by recent engineering applications of hierarchical evaluation methods reported in [32].
The experts independently conducted pairwise assessments using a simplified AHP procedure. The aggregated comparison matrix achieved a satisfactory consistency ratio (CR < 0.1). A sensitivity analysis with ±20 percent variation of all criterion weights confirmed that the ranking of the variants remained unchanged. The MCDA framework is therefore stable under reasonable changes in decision-maker preferences. This study included an additional verification step. The aim of this step was to confirm the consistency between the MCDA structure and the numerical results. The adopted weights were compared with the actual magnitude and variability of the measured indicators. The indicators with the largest differences between the stations were the inventory turnover R, immobilized capital Kz, and parts availability A. These indicators also received the highest weights in Table 5. This confirms that the weighting structure reflects the real behavior of the system. No single criterion controlled the value of the synthetic index. The redistribution model achieved better results in several independent categories. The multidimensional construction of the MCDA method explains this result. The ranking of the analyzed variants was consistent with the trends visible in the empirical data. This increases the credibility of the obtained results.
The final efficiency index was determined based on the relationship expressed by Formula (11):
where Vi—synthetic result for variant i [–], wj—weight assigned to criterion j [–], and vij—normalized value of criterion j for variant i.
Before the vector normalization, all criteria of the type “min” were re-oriented so that higher values represent better performance. The transformation 1/x was applied to the storage cost, transportation cost, immobilized capital, and average downtime. The “max” criteria were used directly. After this step the vector normalization was applied to all transformed values.
For the “min” criteria that contained zero values, a very small positive constant (ε = 10−6 in the units of the variable) was added to avoid division by zero during the 1/x re-orientation. This adjustment did not affect the resulting rankings. The interpretation of the Vi index is intuitive—the higher its value, the better the evaluated variant meets the defined system requirements. The variant with the higher Vi was considered more efficient, and the difference between the values can be treated as a measure of the advantage of one approach over the other.
This approach ensures the simultaneous consideration of both economic aspects (costs, immobilized capital) and organizational aspects (turnover, availability, stability). Moreover, due to the application of weights (wj), the model remains flexible—it can be adapted to the specific conditions of different railway operators by adjusting decision-making priorities.
3. Results
The comparative analysis included two inventory management variants: the traditional and redistribution models. The study was conducted using the example of the Kazakh railway system, characterized by large distances between stations, a high degree of rolling stock wear, and limited availability of spare parts.
For the evaluation of the variants, a set of criteria were adopted, including storage costs (Cm), transportation costs (Ct), immobilized capital (Kz), inventory turnover (R), average downtime (Tp), parts availability (A), and network stability (S). These criteria were selected in accordance with commonly applied guidelines in the literature on multi-criteria evaluation of logistics and operational systems, and their weights were normalized so that the total equaled 1. To ensure the comparability of the results, vector normalization was applied, as defined previously in Formula (8).
For the “min”-type criteria (costs and downtime), an inverse transformation was applied so that lower values corresponded to higher efficiency. A comparison of the absolute values obtained for both variants at the Sortirovochnaya station made it possible to identify the specific economic and organizational effects of implementing the redistribution strategy. The most tangible result was the reduction in the storage costs (Cm), which decreased from USD 4824.49 to USD 3666.61, representing a 24% reduction. A similar trend was observed in the value of the immobilized capital in the inventory (Kz), where the reduction from USD 8105.14 to USD 6368.32 corresponded to a 21% improvement.
A very clear improvement was also noted in the inventory turnover (R), which increased from 1.20 to 1.60, representing a 33% improvement and directly indicating more efficient resource utilization. The improvement in the parts availability (A) from 0.82 to 0.91 (an 11% increase) translated into greater maintenance reliability and fewer occurrences of critical component shortages. In operational terms, a significant effect was also observed in the reduction of the average downtime (Tp) from 4.8 days to 4.2 days—a 12.5% improvement—which represents a noticeable benefit under high transport intensity conditions.
However, not all criteria indicated an advantage for the redistribution variant. The transportation costs (Ct) increased from USD 192.98 to USD 675.43, corresponding to a 250% increase, resulting from the need to relocate parts between stations. The network stability (S) slightly deteriorated, with a decrease from 0.88 to 0.85 (−3.4%), indicating that the introduction of additional transport operations could have slightly increased the variability of delivery times. A summary of the absolute values and their normalized equivalents, which formed the basis for further aggregation in the synthetic evaluation, is presented in Table 6.
Table 6.
Values of criteria and their normalized equivalents (author’s own elaboration) for the Sortirovochnaya station.
Based on the normalized values, the aggregated index was calculated according to Formula (2). The redistribution variant achieved Vi = 0.71, while the traditional variant reached Vi = 0.54 (Table 7). The redistribution result was higher by 31%. The largest contribution to this difference came from the inventory turnover (R), which increased by 33%. The immobilized capital (Kz) also played an important role, decreasing by 21%. The parts availability (A) improved by 11%. These three criteria had the highest weights in the evaluation and determined the advantage of the redistribution variant. The remaining criteria (Cm, Tp, S, Ct) differed less and had limited influence.
Table 7.
Aggregated index for the variants (author’s own elaboration)—Sortirovochnaya station.
Based on the normalized values, the aggregated index was calculated according to Formula (9). In all analyzed stations, the redistribution variant achieved higher results compared with the traditional one, confirming its advantage in both economic and organizational terms. For example, at the Sortirovochnaya station, the aggregated index reached Vi = 0.71 for the redistribution variant and Vi = 0.54 for the traditional variant, corresponding to a 31% difference (Table 7). The key contributing factors were primarily three criteria: the inventory turnover (R), which increased by 33%; the immobilized capital (Kz), which decreased by 21%; and the parts availability (A), which improved by 11%.
The aggregated index values for both inventory management variants at the Sortirovochnaya station are presented in Table 7. To enhance the clarity of the analysis, a comparison of individual criteria was also prepared and is shown in Figure 2 and Figure 3 where the indicators are expressed in their natural measurement units and calculated according to Formula (9).
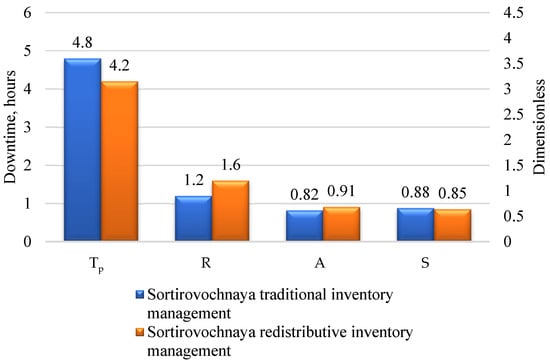
Figure 2.
Comparison of the operational criteria (Tp—downtime, R—inventory turnover, A—availability, S—network stability) for the traditional and redistributive variants—Sortirovochnaya station.
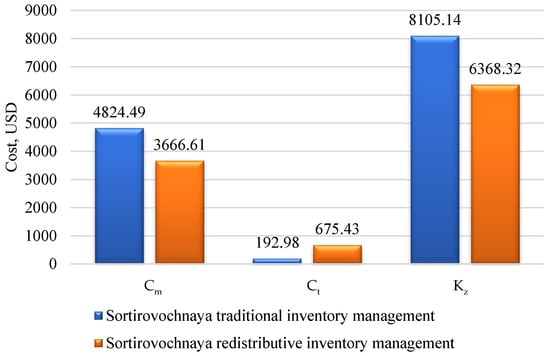
Figure 3.
Comparison of the cost criteria (Cm—storage costs, Ct—transportation costs, Kz—frozen capital) for the traditional and redistributive variants—Sortirovochnaya station.
It should be emphasized that similar analyses were also carried out for the remaining facilities—Zharyk, Zhanaaul, Zhezkazgan, and Karagaily stations. Detailed numerical data for each of them are presented in Appendix A (criterion values and their normalized equivalents, Table A1, Table A2, Table A3 and Table A4), Appendix B (aggregated indices, Table A5, Table A6, Table A7 and Table A8), and Appendix C (comparison of criterion values in the form of diagrams, Figure A1, Figure A2, Figure A3, Figure A4, Figure A5, Figure A6, Figure A7 and Figure A8). At the Zharyk station, the most noticeable result was the reduction in the storage costs (Cm) from USD 1331.56 to USD 1003.49, corresponding to a 25% decrease. The immobilized capital (Kz) changed by 21%, increasing from USD 1408.75 to USD 2064.88, thereby improving the financial stability. Positive changes also included the inventory turnover (R), which increased from 0.67 to 0.75, and the parts availability (A), which rose from 0.68 to 0.75. As a result, the reliability of the maintenance process improved. The average downtime (Tp) decreased from 7.98 to 7.18 h—a 10% reduction—which had a positive effect on the regularity of the transport operations. However, the transportation costs (Ct) increased from USD 0 to USD 27.02, while the network stability (S) decreased by 39%, from 1.00 to 0.61. The overall efficiency index (Vi) reached 0.726 compared with 0.636 for the traditional variant (Appendix B, Table A5).
For the Zhanaaul station, the redistribution resulted in a 25% reduction in the storage costs (Cm)—from USD 1312.26 to USD 984.19. The immobilized capital (Kz) changed by 21%, increasing from USD 1350.86 to USD 1871.90.
The inventory turnover (R) increased from 0.65 to 0.72 (+11%), and the parts availability (A) improved from 0.65 to 0.72 (+11%), confirming greater reliability of the supply system. The average downtime (Tp) decreased from 8.0 to 7.2 h—a 10% reduction—which had a positive impact on the operational performance. On the other hand, the transportation costs (Ct) increased from USD 0 to USD 28.95, while the network stability (S) decreased by nearly half—from 1.00 to 0.53 (−47%). The final efficiency index (Vi) reached 0.717 compared with 0.644 for the traditional variant (Appendix B, Table A6).
At the Zhezkazgan station, the storage costs (Cm) decreased from USD 2084.18 to USD 1621.03, representing a 22% reduction. The immobilized capital (Kz) increased by 20%, from USD 2643.82 to USD 2991.18, indicating more efficient financial resource management. The inventory turnover (R) increased from 0.68 to 0.75 (+10%), and the parts availability (A) rose from 0.59 to 0.65 (+10%). Particularly significant was the reduction in the average downtime (Tp) from 23.7 to 20.1 h—a 15% improvement—which is highly relevant under conditions of heavy transport load.
At the same time, the transportation costs (Ct) increased from USD 0 to USD 94.56, while the network stability (S) declined sharply—by 83%, from 1.00 to 0.16. Nevertheless, the final efficiency index (Vi) reached 0.677 compared with 0.666 for the traditional variant (Appendix B, Table A7).
At the Karagaily station, the storage costs (Cm) decreased from USD 1428.05 to USD 1157.88, representing a 19% reduction. The immobilized capital (Kz) increased by 21%, from USD 1659.62 to USD 2238.56, indicating improved financial efficiency. The inventory turnover (R) increased from 0.64 to 0.76 (+19%), and the parts availability (A) improved from 0.68 to 0.76 (+12%). The average downtime (Tp) decreased from 40.4 to 34.4 h—a 15% reduction—indicating a significant reduction in operational delays.
On the other hand, the transportation costs (Ct) increased from USD 0 to USD 87.4, while the network stability (S) decreased by 51%, from 1.00 to 0.49. The final efficiency index (Vi) reached 0.722 compared with 0.638 for the traditional variant (Appendix B, Table A8).
To provide a consistent and interpretable comparison between the traditional variant and the redistribution variant, an analysis based on effect sizes was conducted. This approach makes it possible to assess the magnitude and practical significance of differences between the variants across all criteria, regardless of their units or value ranges. For each criterion, the paired mean difference (Redistribution–Traditional), its corresponding 95% confidence interval, and the effect size expressed as Cohen’s d were calculated. Table 8 summarizes these results, clearly indicating which operational areas show significant improvement and where trade-offs arise as a consequence of the redistribution strategy. The largest positive effects of the redistribution variant were observed for the parts availability (d = 8.57) and inventory turnover (d = 3.57), both representing very large improvements across all stations. These results indicate a strong and practically meaningful advantage of the redistribution variant in the most influential performance areas of the inventory system. The storage costs showed a very large negative effect (d = −4.24), confirming a substantial reduction in stock-related expenses. The average downtime also decreased with a large effect (d = −1.11), reflecting an improvement in service continuity. These results are consistent with the operational logic of the redistribution strategy, which reduces the stock intensity and improves the flow of spare parts. The transportation costs increased with a large positive effect (d = 1.62), and the immobilized capital increased with a very large effect (d = 4.01), indicating that the benefits of flow consolidation and improved availability come at the expense of greater transfer volumes and temporarily higher capital exposure. The network stability showed a very large negative effect (d = −2.79). This should not be interpreted as reduced global reliability, but rather as a reflection of the sensitivity of this criterion to local fluctuations in low-predictability stations. The observed changes capture local volatility rather than systemic deterioration. Overall, the effect size analysis supports the conclusions of the MCDA assessment. The redistribution variant provides substantial and practically relevant improvements in key operational areas while introducing trade-offs that remain consistent with the functional assumptions of the redistribution strategy. The magnitude of these effects is sufficiently large to be meaningful, even in a small-sample setting.
Table 8.
Effect-size analysis comparing the traditional and redistribution variants across four stations, including mean differences (R − T), 95% confidence intervals, and Cohen’s d for each criterion.
After comparing the key characteristics of both models, an algorithm for efficient inventory redistribution was developed, enabling systematic decision-making regarding the transfer of parts between stations. This algorithm is presented in the form of a block diagram (Figure 4).
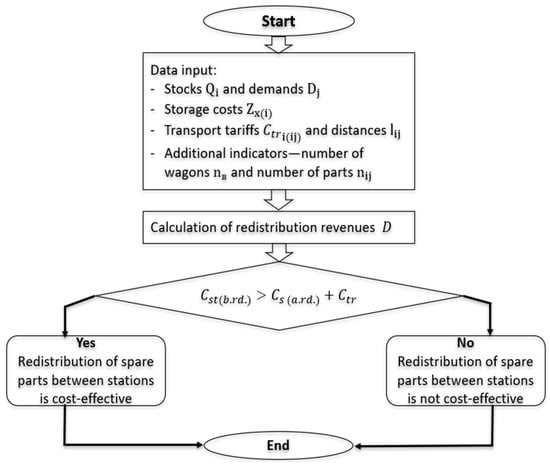
Figure 4.
Block diagram of the inventory redistribution algorithm between stations.
The algorithm includes the following stages:
- Input of source data;
- Calculation of storage and transport costs;
- Identification of surpluses and shortages;
- Comparison of costs before and after redistribution;
- Decision-making on the cost-effectiveness of transfers.
After defining the general logic of the system’s operation, it was necessary to determine a set of quantitative indicators describing the economic, organizational, and operational aspects of both variants. Each of these indicators was formally defined using a mathematical formula and supplemented with a practical interpretation and the theoretical basis for its application.
To illustrate the practical application of the developed algorithm for efficient inventory redistribution, calculations were carried out using the example of the Sortirovochnaya station.
In the first stage, the input data were entered: the storage costs before redistribution (Cst(b.rd.)) amounted to USD 4824.49, the transportation costs (Ctr) were USD 675.43, and the storage costs after redistribution (Cst(a.rd.)) amounted to USD 3666.61. According to Formula (12), the total operational cost was calculated as follows:
The redistribution efficiency, calculated according to Formula (13), was
Since D > 0, Condition (3) was satisfied, confirming the reduction in total costs. The economic effect amounted to approximately 25%. The organizational and operational indicators also improved: the average downtime decreased from 4.8 to 4.2 days (−12.5%), the inventory turnover increased from 1.20 to 1.60 (+33%), and the availability of critical parts improved from 0.82 to 0.91 (+11%). Thus, using the Sortirovochnaya station as an example, the correctness of the developed algorithm was confirmed: the block diagram (Figure 4) accurately reflects the proper sequence of stages, and the obtained results demonstrate the economic feasibility of redistribution.
4. Discussion
In the context of railway maintenance, spare parts “criticality” refers to the functional importance of an item and the operational consequences associated with its unavailability. In line with asset management and RAMS standards, critical parts are those whose shortage leads to disproportionate increases in downtime, safety risks, or service disruption. In our model, this dimension is operationalized indirectly through the performance indicators most sensitive to shortages of critical items, namely, availability (A), average downtime (Tp), and network stability (S). These indicators capture the operational impact of insufficient stock levels for high-criticality parts, and thus, provide a proxy measure of criticality without requiring an explicit classification of items.
The results of the study show that the inventory redistribution strategy offers significant advantages under the conditions of Kazakhstan’s railway network. A reduction in storage costs by 19–26% and a decrease in immobilized capital by 21–25% confirm the effectiveness of redistribution in improving warehouse resource efficiency [4]. The increase in inventory turnover by 10–33% and the improvement in spare parts availability by 10–12% indicate a more rational use of material flows and are consistent with the results of similar studies in the field of supply chain management [24,33].
The analysis also confirmed the correctness of the developed redistribution algorithm, presented in the form of a block diagram (Figure 3). Using the Sortirovochnaya station as an example, it was demonstrated that the condition of economic efficiency was met (D > 0), with total costs reduced by approximately 25%, and organizational–operational indicators improved (shorter downtimes, increased inventory turnover, and greater parts availability). This confirms that the diagram accurately reflects the sequence of key stages and can serve as a practical decision support tool.
However, the analysis also revealed several limitations. The most noticeable were the increase in transportation costs—up to 250%—and the decrease in network stability ranging from −39% to −83%. These results indicate that the model performs well under relatively balanced and predictable demand conditions, but its efficiency decreases in cases of transport disruptions, delivery delays, and high variability in restocking intervals [34]. This limitation is particularly significant for large-scale networks with aging infrastructure, where even minor logistical disturbances can increase systemic risk.
Another practical challenge is the risk of inaccurate demand forecasting. If forecasts do not reflect the actual demand for critical spare parts, redistribution may lead to excessive relocations and additional costs. Seasonal fluctuations in demand should also be considered, as they can increase the network instability and reduce the model’s overall efficiency [35].
A strong advantage of the proposed model is its ability to reduce the overall inventory level without compromising the availability of critical components. It is particularly effective in systems with balanced demand, high transport regularity, and stable logistical routes [36,37]. On the other hand, its main weakness lies in its high dependence on timely deliveries and susceptibility to external disruptions (e.g., train delays, supply interruptions) [38].
The practical implications of the study extend beyond the railway sector. The redistribution approach can be adapted to other capital-intensive industries where high equipment readiness and significant storage costs are key factors, such as aviation and the automotive industry [39,40]. In aviation, the model can be applied to optimize the allocation of expensive components (e.g., engines, avionics) between maintenance bases. In the automotive sector, redistribution can be used for key components within the service network, where spare parts availability directly affects customer satisfaction.
In summary, the proposed model demonstrates consistent benefits in reducing costs and increasing inventory turnover efficiency; however, it requires adaptation to the specific characteristics of the infrastructure and demand forecasting mechanisms. Its effective application is feasible when organizational risks related to logistical disruptions and seasonal variability are taken into account, as well as when it is integrated with modern predictive tools [36,37].
The obtained results are significant not only within the context of the analyzed network but also from a broader perspective of logistics systems. Improving inventory turnover and reducing immobilized capital are key factors for supply chain efficiency across many industries, particularly under conditions of increasing demand variability and cost pressure. Likewise, the improvement in the availability of critical parts translates into greater service reliability, which is especially important in sectors requiring continuous operation (e.g., transportation, energy). Therefore, the study suggests that solutions based on the redistribution model can be effectively adapted to other areas of logistics and inventory management, contributing to greater system flexibility and stability.
Future work should include full empirical validation in a more realistic and complex operational environment, involving larger networks, multi-modal flows, and stochastic demand. Probabilistic extensions of the redistribution model, such as Monte-Carlo-based risk propagation or demand uncertainty modeling, would further strengthen the robustness of the approach.
5. Conclusions
The conducted study confirmed that the inventory redistribution strategy reduces the storage costs by 19–26% and decreases the immobilized capital by 21–25%, while simultaneously increasing the inventory turnover by 10–33% and the parts availability by 10–12%. Although the transportation costs increase under the redistribution model, the relative growth (up to 250%) results from the very low baseline cost in the traditional scenario. At stations such as Sortirovochnaya, the transport activity in the traditional model is almost zero, which causes even small absolute increases to appear large in percentage terms.
Importantly, the absolute transportation cost remains low compared with the substantial reductions in storage cost and immobilized capital. Therefore, despite the relative increase, the redistribution strategy continues to provide a positive overall economic balance.
Despite the decline in network stability (up to −83%), the model demonstrates high efficiency under conditions of balanced demand and stable supply. The practical significance lies in the potential application of this approach not only in the railway sector but also in aviation and the automotive industry. Future research perspectives include the integration of demand forecasting methods and the development of hybrid models that account for logistical disruption risks and seasonal fluctuations.
Author Contributions
Conceptualization, A.K. and P.B.; methodology, P.B. and B.W.; software, P.B.; verification, P.B., A.K. (Adil Kadyrov), A.K. (Aliya Kukesheva), M.J., D.U. and B.W.; formal analysis, P.B. and A.K. (Adil Kadyrov); research, P.B. and A.K. (Aliya Kukesheva); resources, P.B.; data processing, P.B. and A.K. (Aliya Kukesheva); writing—preparation of the original project, P.B. and A.K. (Aliya Kukesheva); writing—reviewing and editing, A.K. (Adil Kadyrov), M.J., Ł.W. and B.W.; visualization, B.W.; author supervision, A.K. (Adil Kadyrov); project administration, A.K. (Adil Kadyrov); fundraising, M.J., Ł.W. and D.U. All authors have read and agreed to the published version of the manuscript.
Funding
The presented research results were funded by grants for education allocated by the Ministry of Science and Higher Education in Poland number 0414/SBAD/2025.
Institutional Review Board Statement
Not applicable.
Informed Consent Statement
Not applicable.
Data Availability Statement
The data presented in this study are available on request from the corresponding author.
Conflicts of Interest
The authors declare no conflicts of interest.
Appendix A
Table A1.
Values of criteria and their normalized equivalents (author’s own elaboration) for the Zharyk station.
Table A1.
Values of criteria and their normalized equivalents (author’s own elaboration) for the Zharyk station.
| Criterion | Traditional Variant | Redistribution Variant | Traditional (vij) | Redistribution (vij) |
|---|---|---|---|---|
| Storage costs (Cm) | 1331.56 | 1003.49 | 0.801 | 0.599 |
| Transportation cost (Ct) | 0.00 | 27.02 | 0.000 | 1.000 |
| Immobilized capital (Kz) | 1408.75 | 2064.88 | 0.566 | 0.824 |
| Inventory turnover (R) | 0.67 | 0.75 | 0.664 | 0.747 |
| Average downtime (Tp) | 7.98 | 7.18 | 0.744 | 0.669 |
| Parts availability (A) | 0.68 | 0.75 | 0.672 | 0.740 |
| Network stability (S) | 1.00 | 0.61 | 0.857 | 0.514 |
Table A2.
Values of criteria and their normalized equivalents (author’s own elaboration) for the Zhanaaul station.
Table A2.
Values of criteria and their normalized equivalents (author’s own elaboration) for the Zhanaaul station.
| Criterion | Traditional Variant | Redistribution Variant | Traditional (vij) | Redistribution (vij) |
|---|---|---|---|---|
| Storage costs (Cm) | 1312.26 | 984.14 | 0.806 | 0.594 |
| Transportation costs (Ct) | 0.00 | 28.95 | 0.000 | 1.000 |
| Immobilized capital (Kz) | 1350.86 | 1871.90 | 0.586 | 0.811 |
| Inventory turnover (R) | 0.65 | 0.72 | 0.672 | 0.741 |
| Average downtime (Tp) | 8.00 | 7.20 | 0.744 | 0.669 |
| Parts availability (A) | 0.65 | 0.72 | 0.672 | 0.741 |
| Network stability (S) | 1.00 | 0.53 | 0.886 | 0.463 |
Table A3.
Values of criteria and their normalized equivalents (author’s own elaboration) for the Zhezkazgan station.
Table A3.
Values of criteria and their normalized equivalents (author’s own elaboration) for the Zhezkazgan station.
| Criterion | Traditional Variant | Redistribution Variant | Traditional (vij) | Redistribution (vij) |
|---|---|---|---|---|
| Storage costs (Cm) | 2084.18 | 1621.03 | 0.790 | 0.613 |
| Transportation costs (Ct) | 0.00 | 94.56 | 0.000 | 1.000 |
| Immobilized capital (Kz) | 2643.82 | 2991.18 | 0.664 | 0.747 |
| Inventory turnover (R) | 0.68 | 0.75 | 0.670 | 0.742 |
| Average downtime (Tp) | 23.68 | 20.13 | 0.762 | 0.648 |
| Parts availability (A) | 0.59 | 0.65 | 0.674 | 0.739 |
| Network stability (S) | 1.00 | 0.16 | 0.987 | 0.164 |
Table A4.
Values of criteria and their normalized equivalents (author’s own elaboration) for the Karagaily station.
Table A4.
Values of criteria and their normalized equivalents (author’s own elaboration) for the Karagaily station.
| Criterion | Traditional Variant | Redistribution Variant | Traditional (vij) | Redistribution (vij) |
|---|---|---|---|---|
| Storage costs (Cm) | 1428.05 | 1157.88 | 0.777 | 0.629 |
| Transportation costs (Ct) | 0.00 | 88.77 | 0.000 | 1.000 |
| Immobilized capital (Kz) | 1659.62 | 2238.56 | 0.597 | 0.802 |
| Inventory turnover (R) | 0.64 | 0.76 | 0.643 | 0.766 |
| Average downtime (Tp) | 40.41 | 34.35 | 0.762 | 0.648 |
| Parts availability (A) | 0.68 | 0.76 | 0.663 | 0.749 |
| Network stability (S) | 1.00 | 0.49 | 0.897 | 0.444 |
Appendix B
Table A5.
Aggregated index for the variants (author’s own elaboration)—Zharyk station.
Table A5.
Aggregated index for the variants (author’s own elaboration)—Zharyk station.
| Variant | Aggregated Index (Vi) |
|---|---|
| Traditional | 0.636 |
| Redistribution | 0.726 |
Table A6.
Aggregated index for the variants (author’s own elaboration)—Zhanaaul station.
Table A6.
Aggregated index for the variants (author’s own elaboration)—Zhanaaul station.
| Variant | Aggregated Index (Vi) |
|---|---|
| Traditional | 0.644 |
| Redistribution | 0.717 |
Table A7.
Aggregated index for the variants (author’s own elaboration)—Zhezkazgan station.
Table A7.
Aggregated index for the variants (author’s own elaboration)—Zhezkazgan station.
| Variant | Aggregated Index (Vi) |
|---|---|
| Traditional | 0.666 |
| Redistribution | 0.677 |
Table A8.
Aggregated index for the variants (author’s own elaboration)—Karagaily station.
Table A8.
Aggregated index for the variants (author’s own elaboration)—Karagaily station.
| Variant | Aggregated Index (Vi) |
|---|---|
| Traditional | 0.638 |
| Redistribution | 0.722 |
Appendix C

Figure A1.
Comparison of the operational criteria (Tp—downtime, R—inventory turnover, A—availability, S—network stability) for the traditional and redistributive variants—Zharyk station.

Figure A2.
Comparison of the cost criteria (Cm—storage costs, Ct—transportation costs, Kz—frozen capital) for the traditional and redistributive variants—Zharyk station.

Figure A3.
Comparison of the operational criteria (Tp—downtime, R—inventory turnover, A—availability, S—network stability) for the traditional and redistributive variants—Zhanaaul station.

Figure A4.
Comparison of the cost criteria (Cm—storage costs, Ct—transportation costs, Kz—frozen capital) for the traditional and redistributive variants—Zhanaaul station.

Figure A5.
Comparison of the operational criteria (Tp—downtime, R—inventory turnover, A—availability, S—network stability) for the traditional and redistributive variants—Zhezkazgan station.

Figure A6.
Comparison of the cost criteria (Cm—storage costs, Ct—transportation costs, Kz—frozen capital) for the traditional and redistributive variants—Zhezkazgan station.

Figure A7.
Comparison of the operational criteria (Tp—downtime, R—inventory turnover, A—availability, S—network stability) for the traditional and redistributive variants—Karagaily station.

Figure A8.
Comparison of the cost criteria (Cm—storage costs, Ct—transportation costs, Kz—frozen capital) for the traditional and redistributive variants—Karagaily station.
References
- Federal Railroad Administration. Available online: https://railroads.dot.gov/ (accessed on 23 October 2025).
- Ministry of Transport of the People’s Republic of China. Available online: https://www.mot.gov.cn/ (accessed on 23 October 2025).
- Gao, Z.; He, M.; Zhang, X.; Chen, M.; Wang, W. Spare Parts Management Strategy of High-Speed Railway Running Department Based on Performance Prediction. Electronics 2024, 13, 4239. [Google Scholar] [CrossRef]
- Lin, B.; Wang, J.; Wang, H.; Wang, Z.; Li, J.; Lin, R.; Xiao, J.; Wu, J. Inventory-Transportation Integrated Optimization for Maintenance Spare Parts of High-Speed Trains. PLoS ONE 2017, 12, e0176961. [Google Scholar] [CrossRef] [PubMed]
- Zhang, D.; Yang, S.; Li, S.; Fan, J.; Ji, B. Integrated Optimization of the Location–Inventory Problem of Maintenance Component Distribution for High-Speed Railway Operations. Sustainability 2020, 12, 5447. [Google Scholar] [CrossRef]
- Agency for Strategic Planning and Reforms of the Republic of Kazakhstan Bureau of National Statistics—Main. Available online: https://stat.gov.kz/en/ (accessed on 23 October 2025).
- Oтpacли—Agency for Strategic Planning and Reforms of the Republic of Kazakhstan Bureau of National Statistics. Available online: https://stat.gov.kz/en/industries/business-statistics/stat-transport (accessed on 23 October 2025).
- Akhmedov, E. Problems of and Prospects for the Development of Railway Infrastructure in Kazakhstan. E3S Web Conf. 2024, 471, 02006. [Google Scholar] [CrossRef]
- Funk, T.; Hromádka, V. IMPACT of RAILWAY MODERNIZATION on the FREQUENCY of INCIDENTS. In Proceedings of the International Multidisciplinary Scientific GeoConference: SGEM, Sofia, Bulgaria, 16–25 August 2020; p. 310. [Google Scholar]
- Mishustin Approved the Rosstat Development Strategy with an Emphasis on Digitalization. Document. Available online: https://tadviser.com/index.php/Company:Federal_State_Statistics_Service_(Rosstat) (accessed on 23 October 2025).
- Murzakayeva, M.; Musayev, J.; Kvashnin, M.; Zhunisbekov, S.; Zhauyt, A.; Azilkiyasheva, M. Experimental Evaluation of Railway Crew Impact on Tension Rails. Int. J. Mech. Eng. Robot. Res. 2021, 10, 261–269. [Google Scholar] [CrossRef]
- Tsevegdorj, E.; Kim, C. Efficiency Assessment of the Mongolian Railway Industry Using Data Envelopment Analysis: A Comparative Analysis with CAREC Railways. Acta logist. 2025, 12, 187–198. [Google Scholar] [CrossRef]
- Shakibayifar, M.; Sheikholeslami, A.; Corman, F.; Shafahi, Y. Simulation Analysis of the Effect of Doubling and Electrification on the Reliability of the Rail Networks: A Case Study of Tehran-Mashhad Railroad. Sci. Iran. 2018, 25, 3066–3087. [Google Scholar] [CrossRef]
- Xu, J.; Liang, M.; Wang, Y. Estimate of Railway Line Capacity Under Adverse Operation Condition. In Proceedings of the 4th International Conference on Electrical and Information Technologies for Rail Transportation (EITRT), Qingdao, China, 25–27 October 2019; Qin, Y., Jia, L., Liu, B., Liu, Z., Diao, L., An, M., Eds.; Springer: Singapore, 2020; pp. 387–400. [Google Scholar]
- Keckeis, S.; Karner, C.; Riester, M. Assessing the Potential for Additive Manufacturable Spare Parts in the Railway Industry by a Data-Driven Framework. Procedia CIRP 2024, 122, 575–580. [Google Scholar] [CrossRef]
- Mattos, M.G.; Reis, D.A.F.; Magalhaes, D.J.A.V. Locomotive’s Spare Parts Optimization. In Proceedings of the 2008 International Conference on Railway Engineering—Challenges for Railway Transportation in Information Age, Hong Kong, 25–28 March 2008; pp. 1–5. [Google Scholar]
- Esrar, H.; Zolfaghariania, H.; Yu, H. Inventory Management Practices at a Big-Box Retailer: A Case Study. Benchmarking Int. J. 2022, 30, 2458–2485. [Google Scholar] [CrossRef]
- Cavero-Winchez, A.O.; Valencia-Quispe, E.R.; Ponce-Nuñez, V.H.; Alvarez-Merino, J.C. Supply Planning to Reduce Immobilized Inventory in a Mining Explosives Factory. In Proceedings of the 2020 Congreso Internacional de Innovación y Tendencias en Ingeniería (CONIITI), Bogota, Colombia, 30 September–2 October 2020; pp. 1–5. [Google Scholar]
- Xie, H.; Palani, D. Analysis of Overstock in Construction Supply Chain and Inventory Optimization. In Proceedings of the Construction Research Congress 2018, New Orleans, LA, USA, 2–4 April 2018; pp. 29–39. [Google Scholar] [CrossRef]
- Faccio, M. Service Spare Parts versus Production Parts: A Centralised or Decentralised Warehouse? Int. J. Logist. Syst. Manag. 2015, 20, 516. [Google Scholar] [CrossRef]
- Yu, V.F.; Salsabila, N.Y.; Siswanto, N.; Kuo, P.-H. A Two-Stage Genetic Algorithm for Joint Coordination of Spare Parts Inventory and Planned Maintenance under Uncertain Failures. Appl. Soft Comput. 2022, 130, 109705. [Google Scholar] [CrossRef]
- Alii, H.M.; Akhmadkhon Gulomjon Ugli, A.; Mannonov, A.; Lalnunthari, L. Artificial Intelligence and IoT in Logistics Management for the Intelligent Supply Chain Management For The Future Era. In Proceedings of the 2025 International Conference on Computational Innovations and Engineering Sustainability (ICCIES), Coimbatore, India, 24–26 April 2025; pp. 1–6. [Google Scholar]
- Wang, D.; Sun, Y.; Yu, L.; Shen, K.; Li, J.; Wu, X. Research on the Optimization Method of Inventory Management of Important Spare Parts of Intercity Railway. PLoS ONE 2025, 20, e0327852. [Google Scholar] [CrossRef] [PubMed]
- Chen, Y.; Gao, Q.; Su, X.; Fang, S.; Guo, C. Research on Optimization of Spare Parts Inventory Policy Considering Maintenance Priority. Int. J. Syst. Assur. Eng. Manag. 2018, 9, 1336–1345. [Google Scholar] [CrossRef]
- Arynova, Z.; Nakipova, G.; Nurmaganbetova, A.; Alina, G.; Orazbayeva, A.; Kemirkulova, D. The Role of Distribution Centres in the Logistics Infrastructure of Kazakhstan. Acta logist. 2024, 11, 451–460. [Google Scholar] [CrossRef]
- Tracht, K.; Mederer, M.; Schneider, D. Effects of Lateral Transshipments in Multi-Echelon Closed-Loop Supply Chains. In Glocalized Solutions for Sustainability in Manufacturing, Proceedings of the 18th CIRP International Conference on Life Cycle Engineering, Technische Universität Braunschweig, Braunschweig, Germany 2–4 May 2024; Hesselbach, J., Herrmann, C., Eds.; Springer: Berlin/Heidelberg, Germany, 2011; pp. 443–447. [Google Scholar]
- Shao, Z.; Xu, J.; Lei, C. Electric Multiple Unit Spare Parts Vendor-Managed Inventory Contract Mechanism Design. Systems 2025, 13, 585. [Google Scholar] [CrossRef]
- Kadyrov, A.; Baigozhina, P.; Kukesheva, A.; Marat, I.; Karsakova, A. Algorithm for Making the Optimal Decision for Further Operation of Freight Cars. Commun. Sci. Lett. Univ. Zilina 2025, 27, B261–B277. [Google Scholar] [CrossRef]
- David, P. Key Transport Statistics 2023 (2022 Data). Available online: https://www.itf-oecd.org/key-transport-statistics-2023-2022-data (accessed on 23 October 2025).
- Railway Statistics—UIC|UNECE. Available online: https://unece.org/transport/documents/2023/05/presentations/railway-statistics-uic (accessed on 23 October 2025).
- Munier, N.; Hontoria, E. Rationality of the AHP Method. In Uses and Limitations of the AHP Method: A Non-Mathematical and Rational Analysis; Munier, N., Hontoria, E., Eds.; Springer International Publishing: Cham, Switzerland, 2021; pp. 31–39. ISBN 978-3-030-60392-2. [Google Scholar]
- Talero-Sarmiento, L.; Gonzalez-Capdevila, M.; Granollers, A.; Lamos-Diaz, H.; Pistili-Rodrigues, K. Towards a Refined Heuristic Evaluation: Incorporating Hierarchical Analysis for Weighted Usability Assessment. Big Data Cogn. Comput. 2024, 8, 69. [Google Scholar] [CrossRef]
- Li, P.; Wen, M.; Zu, T.; Kang, R. A Joint Location–Allocation–Inventory Spare Part Optimization Model for Base-Level Support System with Uncertain Demands. Axioms 2023, 12, 46. [Google Scholar] [CrossRef]
- Basten, R.J.I.; van Houtum, G.J. System-Oriented Inventory Models for Spare Parts. Surv. Oper. Res. Manag. Sci. 2014, 19, 34–55. [Google Scholar] [CrossRef]
- Guimaraes, C.B.; Marques, J.M.; Tortato, U. Demand forecasting For high-turnover spare parts in agricultural and construction machines: A case study. South Afr. J. Ind. Eng. 2020, 31, 116–128. [Google Scholar] [CrossRef]
- Wilson, M.C. The Impact of Transportation Disruptions on Supply Chain Performance. Transp. Res. Part E Logist. Transp. Rev. 2007, 43, 295–320. [Google Scholar] [CrossRef]
- Cantini, A.; Peron, M.; De Carlo, F.; Sgarbossa, F. A Data-Driven Methodology for the Periodic Review of Spare Parts Supply Chain Configurations. Int. J. Prod. Res. 2024, 62, 1818–1845. [Google Scholar] [CrossRef]
- El-Thalji, I. Green Spare Parts Evaluation for Hybrid Warehousing and On-Demand Manufacturing. Appl. Syst. Innov. 2025, 8, 8. [Google Scholar] [CrossRef]
- Nathan, B.S.; Siva Reddy, B.V.; Sastry, C.C.; Krishnaiah, J.; Eswaramoorthy, K.V. Innovative Framework for Effective Service Parts Management in the Automotive Industry. Front. Mech. Eng. 2023, 10, 1361688. [Google Scholar] [CrossRef]
- Gallego-García, S.; Gejo-García, J.; García-García, M. Development of a Maintenance and Spare Parts Distribution Model for Increasing Aircraft Efficiency. Appl. Sci. 2021, 11, 1333. [Google Scholar] [CrossRef]
Disclaimer/Publisher’s Note: The statements, opinions and data contained in all publications are solely those of the individual author(s) and contributor(s) and not of MDPI and/or the editor(s). MDPI and/or the editor(s) disclaim responsibility for any injury to people or property resulting from any ideas, methods, instructions or products referred to in the content. |
© 2025 by the authors. Licensee MDPI, Basel, Switzerland. This article is an open access article distributed under the terms and conditions of the Creative Commons Attribution (CC BY) license (https://creativecommons.org/licenses/by/4.0/).