Article

3D Analysis of the Initial and End Positions of an Active and Passive Prone Hip Extension Test and Its Correlation with Lower Limb Isokinetic Neuromuscular Function of College Students: A Pilot Study

by
José Lumini
1,2,3,
Benjamin Hedirian
1,
Pedro Fonseca
4,
Andrea Ribeiro
1,5,
André Chenu Schneider
6,7,8,
António M. Monteiro
6,7,* and
João Paulo Vilas-Boas
4,9,10
1
Centro Interdisciplinar em Ciências da Saúde (CICS), ISAVE (Instituto Superior de Saúde), Rua Castelo de Al-mourol n° 13, 4720-155 Amares, Portugal
2
Research Center in Physical Activity, Health and Leisure (CIAFEL), Faculty of Sport of University of Porto (FADEUP), 4200-450 Porto, Portugal
3
Laboratory for Integrative and Translational Research in Population Health (ITR), 4720-155 Porto, Portugal
4
Laboratório de Biomecânica do Porto (LABIOMEP-UP), University of Porto, 4200-072 Porto, Portugal
5
Centro de Investigação em Reabilitação (CIR), Escola Superior de Saúde, Politécnico do Porto, Rua Doutor António Bernardino de Almei-da 400, 4200-072 Porto, Portugal
6
Department of Sports Sciences, Instituto Politécnico de Bragança, 5300-253 Bragança, Portugal
7
Research Centre for Active Living and Wellbeing (Livewell), Instituto Politécnico de Bragança, 5300-253 Bragança, Portugal
8
Faculty of Physical Activity and Sports Sciences, Institute of Biomedicine (IBIOMED), Universidad de León, 24007 León, Spain
9
Faculty of Sport and CIFI2D, University of Porto, 4200-450 Porto, Portugal
10
Faculdade de Ciências da Saúde, Universidade Fernando Pessoa, Praça 9 de Abril 349, 4249-004 Porto, Portugal
*
Author to whom correspondence should be addressed.
Appl. Sci. 2025, 15(23), 12735; https://doi.org/10.3390/app152312735
Submission received: 7 November 2025 / Revised: 25 November 2025 / Accepted: 27 November 2025 / Published: 1 December 2025
(This article belongs to the Special Issue Sports, Exercise and Healthcare)

Abstract

Introduction: Manual therapists routinely evaluate changes in pain, movement, and function through clinical tests that support clinical reasoning. The Prone Hip Extension Test (PHET) is commonly used as a self-perturbation task to assess lumbopelvic control and hip motion patterns related to gait. Performing the PHET actively and passively may reveal how voluntary activation and passive structures influence joint kinematics and contribute to force production. This study aimed to compare active and passive PHET execution and investigate how initial (IP) and final hip positions (FP) correlate with lower-limb neuromuscular function. Methods: Seven healthy volunteers (24.3 ± 3.4 years; 173.1 ± 7.5 cm; 72.1 ± 9.5 kg) without musculoskeletal conditions participated. Hip kinematics were recorded using a 12-camera Qualisys Oqus system (200 Hz) with 22 reflective markers, processed in Qualisys Track Manager 2.13 and exported to Visual3D. Participants performed three PHET trials in both IP and FP, with mean an-gles considered for analysis. Knee isokinetic performance was assessed on a Biodex System 4 at 180°/s and 300°/s for flexion and extension. Results: Significant differences between active and passive PHET emerged in the FP for rotational movements bilaterally (p = 0.02) and in IP adduction/abduction for both hips (right p = 0.03; left p = 0.02). No side-to-side differences were observed. Passive FP of the right hip showed multiple significant correlations with isokinetic flexion and extension parameters at 180°/s and 300°/s, particularly with torque/body weight, acceleration and deceleration times, and agonist/antagonist ratios (ρ ranging from −0.86 to 0.90). Conclusions: Meaningful differences exist between active and passive PHET performance, especially in frontal-plane IP and rotational FP measures. Additionally, passive FP strongly correlates with several neuromuscular variables, suggesting that PHET kinematics may reflect lower-limb isokinetic function.

1. Introduction

Clinical screening tests play a significant role in the rapid assessment of individuals in the day-to-day clinical practice of manual therapists. Although clinical tests are routinely taught and evaluated in physical therapy, the development and validation of standardized assessment methodologies is still far from complete. The prone hip (leg) extension test (PHET) has been widely used for decades as a self-perturbation task to evaluate the stability and function of the lumbopelvic region, as well as to simulate the muscle recruitment pattern of hip extension during gait [1,2,3]. It has been considered a test with good reliability for detecting deviations of the lumbar spine [4], showing substantial inter-rater agreement [5], and high specificity, albeit poor sensitivity [6].
Janda suggested that imbalances between phasic and tonic skeletal muscles may result in a “functional pathology of the motor system,” associated with changes in movement patterns and motor regulation [1]. These alterations can be observed through the performance of functional tests [2]. Such muscular imbalances can lead to dysfunctions of the musculoskeletal system and are also associated with changes in both the musculoskeletal and nervous systems, a perspective also supported by Sahrmann [3]. Although research has mainly focused on the sequence of muscle recruitment patterns—with no clear consensus to date [4,7,8,9,10]—rather than on kinematics, some authors have reported kinematic differences. For example, Arab et al. [11], observed differences in lumbar lordosis angle between patients with and without low back pain. Moreover, the clinical usefulness of the test has been proposed to extend beyond muscle recruitment patterns or kinematics alone: patients perceived “difficulty” in performing the task has been suggested as a clinical indicator of dysfunctional neuromuscular control in individuals with low back pain [6].
The PHET, as originally described by Janda et al. [2], has been modified over time with variations in initial and final joint positions. Initial positions have ranged from the classical neutral position [2,6,7,10,11,12,13], to 30° of hip flexion returning to neutral [4,14]. End positions have also varied from neutral [4], to fixed distances such as 15.4 cm [9,10], and 20 cm above the table [6], as well as to each individual’s maximum hip extension range of motion (ROM) [13], sometimes with added knee flexion to control lumbar lordosis [11].
The evolution of the PHET protocol reflects attempts by researchers and clinicians to obtain more detailed information from the test and to adapt it to different clinical settings. To compare the influence of active and passive elements on movement kinematics—which can affect not only joint flexibility but also force production—we administered the test both actively and passively through the full hip extension ROM of each participant, while minimizing trunk compensation. Therefore, the purpose of this study was to examine the differences between active and passive PHET and to investigate how the initial and final hip positions in active and passive conditions correlate with the neuromuscular function of the lower limb.

2. Materials and Methods

2.1. Ethics

All procedures were approved by the Ethics Committee of Fernando Pessoa University. All participants were volunteers and signed a written informed consent, which described the objectives, procedures, and potential risks of the study. They were guaranteed the right to withdraw at any time, anonymity throughout the process in accordance with the Declaration of Helsinki [15]. Upon completing the assessment, participants were informed of any relevant findings. All procedures were non-invasive and carried no foreseeable risks.

2.2. Sample

Seven healthy volunteers (two females and five males), aged 18–33 years (24.3 ± 3.4 years; 173.1 ± 7.5 cm; 72.1 ± 9.5 kg), all with right-leg dominance, were included. Participants were excluded if they had a history of central nervous system or neuromuscular disorders, as such conditions could affect lower-limb neuromuscular function [4]. Additional exclusion criteria included current lower-extremity injury, hip or back pain, or a history of hip or lumbar symptoms lasting more than one week in the previous five years, in accordance with Nygren et al. [16]. Pain during active straight-leg raise or during passive hip flexion combined with adduction and medial rotation also led to exclusion. Participants were not taking medication at the time of testing [16] and refrained from intense physical activity prior to assessment [17].
This pilot study intentionally employed a small sample size, consistent with the exploratory goals of preliminary biomechanical research. Previous pilot studies in 3D motion analysis have used similarly small samples to refine protocols, assess variability, and support power estimations for larger trials [18,19]. Thus, a sample of seven participants was deemed appropriate for the methodological aims of this investigation.

2.3. Procedures

Participants first completed a screening questionnaire collecting personal information, training history, and anthropometric characteristics. They were instructed to wear flexible clothing to prevent movement restriction during testing.
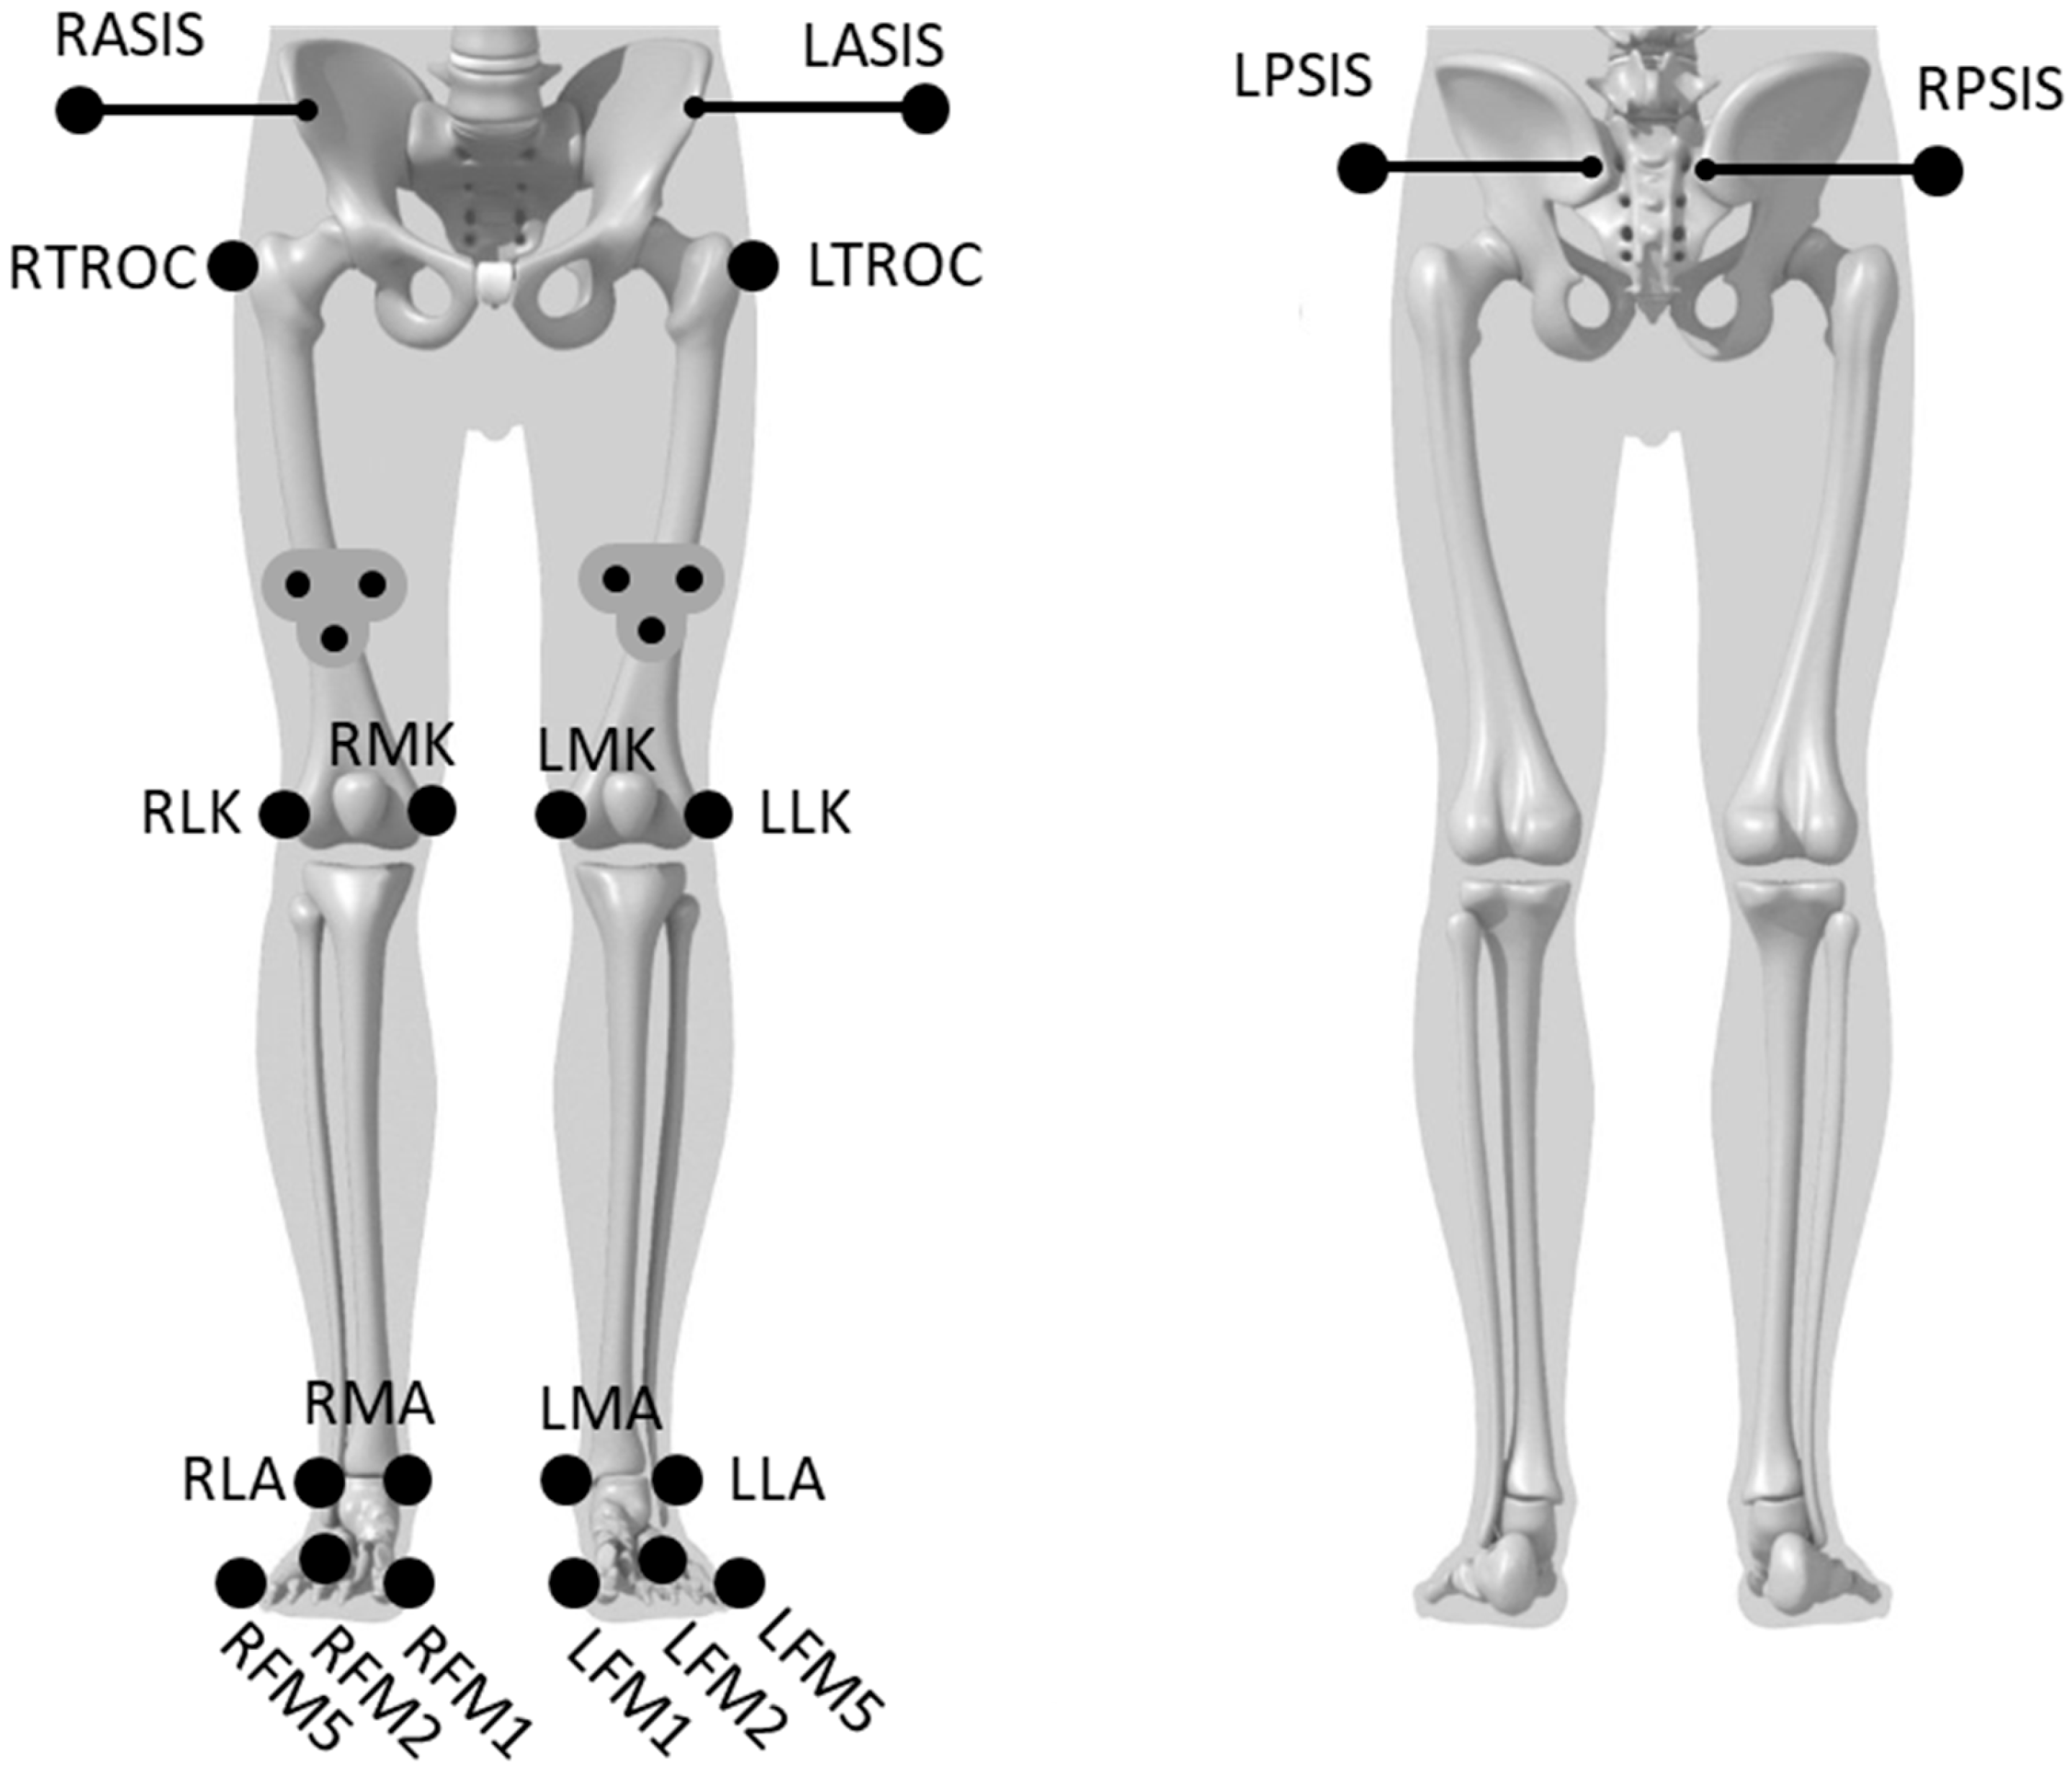
Lower-limb kinematics were recorded using 12 Qualisys Oqus motion-capture cameras (Qualisys AB, Gothenburg, Sweden) operating at 200 Hz. Twenty-two reflective markers were placed following the Porto Biomechanics Laboratory (LABIOMEP-UP) protocol [20], which ensures high accuracy and minimizes tracking errors. The test was performed on a rigid, stable surface equipped with four fixed reference markers to maintain calibration integrity. The 12-camera Qualisys Oqus system (Qualisys AB, Gothenburg, Sweden), was set up in a biomechanics laboratory following Qualisys guidelines for gait and lower-limb analysis, with cameras mounted on walls at heights of 2.6–3 m in a configuration providing ≥4-camera overlap in a calibrated volume of approximately 4 × 3 × 2.5 m.
Twenty retroreflective markers were affixed with double sided tape to relevant anatomical landmarks on both lower limbs to define the pelvis and lower extremities by an experienced physical therapist with more than 20 years of clinical practice. These landmarks included the anterior and posterior superior iliac spines, greater trochanter, lateral and medial femoral condyles, lateral and medial malleoli, medial aspect of the first metatarsal head, dorsal aspect of the third metatarsal head, and lateral aspect of the fifth metatarsal head. In addition, a three-marker cluster mounted on a carbon fibre plate was positioned on the anterior aspect of each thigh and secured with adhesive tape (e.g., Elastoplast) and supported by compression mesh. At the pelvis, markers were offset using rigid rods attached to an adjustable belt, as shown in Figure 1. This configuration ensured optimal optical detection by the cameras, thereby enabling accurate modelling of pelvic motion.
High-end stereophotogrammetric systems such as the 12-camera Qualisys Oqus (Qualisys AB, Gothenburg, Sweden) configuration used in this study typically achieve sub-millimetre to low-millimetre spatial accuracy, with excellent test–retest repeatability and reproducibility of kinematic measurements under standard laboratory conditions when appropriate calibration and marker protocols are followed [21,22,23,24,25].
All markers were placed by two experienced researchers trained in biomechanical assessment and certified in LABIOMEP-UP motion-capture procedures, each with over five years of experience in 3D kinematic data collection.

2.4. Data Processing

Qualisys Track Manager 2.13 (Qualisys AB, Gothenburg, Sweden) was used to capture and identify marker trajectories along the x, y, and z axes [26]. Subsequent data processing was conducted in Visual3D v6.00.16 (C Motion, Inc., Germantown, MD, USA), which enabled the construction of a kinematic model composed of rigid bodies with six degrees of freedom. The pelvis was modeled according to the CODA convention, which incorporates approximately 20° of anteversion in the anatomical position. The angle sign convention was defined as follows:
  • X: (+) flexion/(–) extension
  • Y: (+) adduction/(–) abduction
  • Z: (+) internal rotation/(–) external rotation
Data were then exported to Visual3D for kinematic modelling, using a standardized pelvic reference of 20° anterior tilt as the initial neutral alignment.
All participants completed both active and passive versions of the PHET in randomized order, following procedures adapted from Vogt [13].

2.5. PHET Protocol

Each participant performed both active and passive PHETs in a randomized order, following the protocol described by Vogt [13], with the exception that neutral hip rotation was not controlled. Each condition was repeated at least three times. Additional repetitions were performed if trials were invalidated due to technical issues or trunk compensation. The average values of the initial position (IP) and final position (FP) were used for analysis but without strict control for neutral hip rotation. Each test was repeated at least three times, with additional trials performed when technical issues arose or when compensatory trunk motion was observed. The PHET has demonstrated substantial inter-rater agreement (κ = 0.76, 95% CI = 0.57–0.95, p < 0.001) for identifying the presence or absence of specific abnormal lumbopelvic movement patterns [6]. Reported sensitivity ranges from 0.18 to 0.27, with specificity values also documented. Mean values for initial position (IP) and final position (FP) were used for analysis.

2.6. Isokinetic Assessment

Participants performed a 5-min warm-up at a self-selected jogging pace before testing. Isokinetic knee strength was assessed using a Biodex System 4 Pro dynamometer (Biodex Medical Systems, Shirley, NY, USA) at two angular velocities: 180°/s and 300°/s, following established procedures [27]. The system automatically calculated:
  • Peak torque normalized to body weight
  • Time to peak torque
  • Acceleration and deceleration times
  • Flexor/extensor agonist–antagonist ratios

2.7. Statistics

Statistical analyses were performed using IBM SPSS Statistics, version 22 (IBM Corp., Armonk, NY, USA). Normality and homogeneity tests indicated a non-normal distribution; therefore, non-parametric methods were applied.
The Wilcoxon signed-rank test was used to compare the initial and final hip positions in active and passive PHET, as well as to compare right and left sides. Subsequently, Spearman’s rank correlation coefficient was calculated to examine the relationships between kinematic variables and isokinetic parameters for flexion and extension at 180°/s and 300°/s. Correlation strengths were classified according to Chan [28].

3. Results

For this study, a sample composed of 7 healthy college students of both genders (2 females and 5 males) was selected. All subjects expressed right lower limb dominance. Anthropometric characteristics regarding age, height and weight are expressed in Table 1.
The comparison between right and left limbs, whether performed actively or passively, showed no statistically significant differences between dominant and non-dominant limbs actively, with increased abduction and internal rotation in the active test, in the initial positions for right and left legs for adduction/abduction and internal/external rotation for both the initial and final position on the right and for the final on the left leg as shown in Table 2.
When comparing the difference between the tests performed actively or passively, significant statistical differences were observed only in the FP for rotational movements in both left and right hips and for IP on the right. Significant differences were also observed for the IP in the adduction/abduction movements of the right and left hips. The initial position of the right and left hip in both active and passive tests was in abduction. The FP for the right hip in the active test was external rotation while the FP for the passive test was internal rotation.
Isokinetic variables were correlated with initial and final hip positions in order to understand if initial and final hip positions in the parasagittal plane could influence lower limb neuromuscular functional parameters at different isokinetic speeds (Table 3, Table 4, Table 5 and Table 6).
The analysis of leg flexion parameters at 180°/s towards flexion showed a significant correlation with the right hip final position in the passive PHET for all parameters except for time to peak torque (Table 3). Correlations were negative for all parameters except for deceleration, which was positive. All correlations were very strong except for peak torque/body weight which was moderate.
The final position extension ROM was greater in the passive test than in the active form of the PHET (Table 2).
When we look at the data for extension at 180°/s, all isokinetic parameters showed significant correlations with right hip final position in the passive PHET (Table 4). Peak torque/body weight, acceleration and agonist/antagonist ratio showed a moderate negative correlation of ρ = −0.75 while time to peak torque and deceleration time showed a positive very strong correlation of, respectively, ρ = 0.81 and 0.90.
Data for higher speeds, which have a higher representation in the real-world activities, at 300°/s towards flexion, only show significant correlations with passive FP of the right hip PHET with the acceleration and deceleration times. Negative for acceleration ρ = −0.82 and positive for deceleration ρ = 0.90 (Table 5). Initial position for time to peak torque also showed a moderate negative correlation of ρ = −0.75.
The results for 300°/s towards extension (Table 6) show significant correlations for all the parameters, except for peak torque/body weight extension, with the FP in extension of the right passive PHET. These correlations are positive and very strong for time to peak torque and deceleration time, with ρ values of 1 and 0.95, respectively. Negative significant moderate correlations are observed for acceleration (−0.75) and agonist/antagonist ratio (ρ = −0.79). Regarding IP, significant strong correlations are observed with IP for passive PHET on the left hip deceleration time (−0.84).
When hip position in the frontal plane (adduction/abduction) is analysed at 180°/s towards flexion, only the right hip FP passive is significantly positive correlated with deceleration time towards flexion with a ρ = 0.82 (Table 7).
Additional correlations were observed when hip position in the frontal plane (adduction/abduction) was analysed (Table 8). Correlations are found, similar to hip position in the para-sagittal plane, for the dominant right leg in the active test for the IP and FP for time to peak torque (ρ = 0.81, p = 0.03/ρ = 0.78, p =0.04), deceleration time for extension (ρ = 0.90, p = 0.01/ρ = 0.90; p = 0.01), as well for the passive test, FP peak torque (ρ = 0.81, p = 0.03) and IP as well as FP, for deceleration time for extension (ρ = 0.77, p = 0.04/ρ = 0.88; p = 0.01). The left hip active FP also showed a negative correlation for deceleration time for extension (ρ = −0.76, p = 0.05).
The same analyses of hip position in the frontal plane at 300°/s towards flexion (Table 9) showed a negative correlation in the active IP of the left hip (ρ = −0.81, p = 0.03) and in the passive IP of the right hip for deceleration time for flexion (ρ = 0.81, p = 0.03).
When hip position in the frontal plane at 300°/s towards extension is analysed (Table 10), only the passive test showed any correlation of isokinetic variables with hip position in the frontal plane in the IP and FP for time to peak torque for flexion (ρ = 0.86, p = 0.01/ρ = 0.79, p = 0.04), for the right hip and deceleration time flex for the left hip (ρ = −0.83, p = 0.02).

4. Discussion

The objective of this research was twofold: first, to examine the differences between active and passive PHET; and second, to determine how the initial and final hip positions in both active and passive tests correlate with lower limb neuromuscular function.
Functionally, these correlations suggest that passive hip alignment reflects underlying neuromechanical constraints such as passive tension, eccentric control capacity, and torque-production timing. Because passive PHET removes voluntary motor strategies, it may more accurately represent the structural and mechanical characteristics that influence isokinetic performance.
Manual therapists routinely evaluate their patients by assessing changes in movement. Correlating these observed changes with physical performance measures (PPMs)—often referred to in the literature as functional tests—enables clinicians to identify or predict specific functional characteristics following injury, estimate fall risk, and assess sports performance or injury potential [29].
Regarding the first objective, no differences were observed between the right and left hips in either the active or passive PHET. Consequently, laterality did not appear to influence the initial position (IP) or final position (FP) in the test. The literature has at times been inconsistent regarding laterality, as several studies have reported asymmetries in various skills, strength profiles, and sport-specific adaptations across different athletic populations [30,31,32,33]. A systematic review by McGrath et al. [34], reported pooled symmetry ranging from 94.6% to 99.6% across tests, well above the commonly accepted clinical benchmark of 90%, though the sample was biased toward one gender and consisted of asymptomatic individuals. Similar findings were reported by De Lang et al. [35], in soccer players. When significant imbalances are present, they tend to be associated with pathology in areas such as the groin [36], patella [37], and low back [38,39]. The results of the present study are therefore consistent with the literature, given that the sample comprised young, asymptomatic college students with minimal sports participation, unlikely to exhibit notable asymmetries or injuries as described by Velotta, Weyer, and Bahamonde [40].
When comparing active and passive tests across all rotational axes, significant differences were observed only in the frontal plane hip initial position for both right and left limbs, suggesting that lower limb positioning differs depending on whether the movement is performed actively by the participant or passively by the therapist. The same was noted for external rotation of the right limb. In some instances, values were higher (e.g., right passive abduction), while in others they were lower (e.g., left passive abduction and internal rotation on the left versus external rotation performed actively), indicating considerable variability that correlated with only a few neuromuscular parameters. Regarding the final position, only rotational position showed significant differences, particularly when the test was administered by the therapist, seemingly correcting the excessive external rotation observed during active performance. The PHET has demonstrated good reliability in detecting lumbar spine deviation from the midline [5], and produces lumbopelvic rotation during active limb movement [41].
These findings may explain the excess external rotation during active testing, in contrast to the internal rotation observed during passive testing, where motor control effects are mitigated by therapist correction.
Few studies in the literature have explored the PHET in terms of movement execution. Most have focused on motor control and low back pain, and to our knowledge, none have examined the relationship between initial and final hip positions and isokinetic neuromuscular variables.
To investigate the potential influence of the rectus femoris and hamstrings—both multiarticular muscles—on lower limb motion and function, knee isokinetic parameters were correlated with hip IP and FP in the sagittal and frontal planes at intermediate (180°/s) and higher (300°/s) isokinetic speeds. Impaired quadriceps function following aerobic exercise has been observed in individuals with recurrent low back pain and healthy knee joints, likely due to a central mechanism arising from poor strength and endurance in spinal musculature [42]. This may result in repetitive lumbopelvic rotation during active limb movements, a factor implicated in low back pain [41], and potentially contributing to the frontal plane differences observed here.
Data revealed that at 180°/s, for both extension and flexion, nearly all variables on the right (dominant) side FP showed positive correlations, with the exception of time to peak torque during flexion. Correlations were positive for all variables except acceleration time and agonist-to-antagonist ratio (for both flexion and extension) and peak torque normalized to body weight during extension. At 300°/s during flexion, only acceleration time (negative) and deceleration time (positive) showed significant correlations, whereas during extension, all variables in the passive right PHET were correlated except peak torque normalized to body weight.
Despite the emphasis typically placed on motor control [5,13,43]—where the hamstrings, particularly biceps femoris, have been documented to activate before gluteus maximus in 83% of subjects [8], consistent with findings from other authors [10,43]—our data primarily showed correlations between isokinetic variables and the passive PHET in the right dominant limb. This suggests an important role for passive insufficiency in determining the final position of the PHET, regardless of movement speed.
In the frontal plane, deceleration time was the parameter most consistently associated with significant correlations. At 180°/s during flexion in the passive test of the right limb, and during extension with both IP and FP of the hip (active and passive), significant correlations were observed, as well as with FP in the active test of the left limb. Active and passive hip position in the frontal plane also correlated significantly with time to peak torque, including the IP of the active test at 180°/s. This may partially explain the frontal plane findings, particularly the correlation between FP of the hip and the active right (dominant) limb when compared with isokinetic variables associated with neuromuscular control of agonist-antagonist muscle groups, such as time to peak torque during extension and deceleration time, where significant changes were evident in both IP and FP.
At 300°/s during flexion in the frontal plane, results were less consistent, with the only correlations observed being peak torque normalized to body weight with the IP of the active test on the left, and deceleration time with the passive test on the right. At the same speed during extension, the passive test showed significant correlations with both IP and FP on the right, as well as between FP in the passive test on the left and deceleration time. At higher speeds, the isokinetic component of movement is reduced, which may account for the decreased number of neuromuscular variables correlated with hip IP and FP during the PHET.

Limitations

The PHET is assumed to reflect the muscle recruitment pattern of the hip during functional tasks such as the mid-to-late stance phase of walking and running. The hypothesis that it may influence neuromuscular function of the knee is plausible but requires further investigation. The sample size in this study was limited, and future research should include larger, more diverse samples encompassing both sexes and varying limb dominance profiles. Pelvic rotation should be assessed during initial evaluation to determine whether it influences initial and final PHET positions and whether it correlates with isokinetic neuromuscular function.


5. Conclusions

Significant differences were found between active and passive PHET for frontal plane initial hip position and for final rotational position in both limbs. Although no significant differences were observed in the sagittal plane, the final hip position during the passive PHET showed significant correlations with isokinetic neuromuscular parameters for both flexion and extension at 180°/s, and with fewer variables at 300°/s. These findings suggest a greater contribution of passive elements and indicate that the passive PHET may be useful for assessing neuromuscular function.

Author Contributions

Conceptualization, J.L., A.M.M. and J.P.V.-B.; methodology, J.L., B.H. and P.F.; software, P.F. and A.R.; validation, J.L., A.R. and A.M.M.; formal analysis, J.L. and A.C.S.; investigation, J.L. and B.H.; resources, A.M.M. and J.P.V.-B.; data curation, J.L. and A.C.S.; writing—original draft preparation, J.L. and A.C.S.; writing—review and editing, A.M.M. and J.P.V.-B.; visualization, A.C.S. and P.F.; supervision, A.M.M. and J.P.V.-B.; project administration, J.L. and A.M.M.; funding acquisition, J.P.V.-B. All authors have read and agreed to the published version of the manuscript.

Funding

This research was funded by Fundação para a Ciência e a Tecnologia (FCT) through R&D Units funding (UID/00617/2025).

Institutional Review Board Statement

The study was conducted in accordance with the Declaration of Helsinki and approved by the Ethics Committee of Universidade Fernando Pessoa (UFP), Portugal (approval date: 10 May 2016).

Informed Consent Statement

Informed consent was obtained from all subjects involved in the study.

Data Availability Statement

The data presented in this study are available on reasonable request from the corresponding author. The data are not publicly available due to privacy and ethical restrictions.

Acknowledgments

The authors would like to thank the Laboratory of Biomechanics of Porto (LABIOMEP-UP) for the technical support and access to motion analysis equipment, and the volunteers who participated in the study for their valuable collaboration.

Conflicts of Interest

The authors declare no conflicts of interest.

References

  1. Janda, V. Muscles, central nervous motor regulation and back problems. In Neurobiologic Mechanisms in Manipulative Therapy; Plenum Press: New York, NY, USA, 1978. [Google Scholar]
  2. Janda, V.; Frank, C.; Liebenson, C. Evaluation of muscle imbalance. In Rehabilitation of the Spine: A Practitioner’s Manual; Liebenson, C., Ed.; Lippincott Williams & Wilkins: Philadelphia, PA, USA, 2007; pp. 203–225. [Google Scholar]
  3. Sahrmann, S.A.; Azevedo, D.C.; Van Dillen, L.R. Diagnosis and Treatment of Movement Impairment Syndromes; Mosby: St. Louis, MO, USA, 2002. [Google Scholar]
  4. Lewis, C.L.; Sahrmann, S.A. Muscle Activation and Movement Patterns During Prone Hip Extension Exercise in Women. J. Athl. Train. 2009, 44, 238–248. [Google Scholar] [CrossRef] [Scilit] [PubMed]
  5. Murphy, D.R.; Byfield, D.; McCarthy, P.; Humphreys, K.; Gregory, A.A.; Rochon, R. Interexaminer reliability of the hip extension test for suspected impaired motor control of the lumbar spine. J. Manip. Physiol. Ther. 2006, 29, 374–377. [Google Scholar] [CrossRef] [Scilit]
  6. Bruno, P.A.; Millar, D.P.; Goertzen, D.A. Inter-rater agreement, sensitivity, and specificity of the prone hip extension test and active straight leg raise test. Chiropr. Man. Ther. 2014, 22, 23. [Google Scholar] [CrossRef] [Scilit]
  7. Bullock-Saxton, J.E.; Janda, V.; Bullock, M.I. The influence of ankle sprain injury on muscle activation during hip extension. Int. J. Sports Med. 1994, 15, 330–334. [Google Scholar] [CrossRef] [Scilit]
  8. Chance-Larsen, K.; Littlewood, C.; Garth, A. Prone hip extension with lower abdominal hollowing improves the relative timing of gluteus maximus activation in relation to biceps femoris. Man Ther. 2010, 15, 61–65. [Google Scholar] [CrossRef] [Scilit]
  9. Lehman, G.J. Trunk and hip muscle recruitment patterns during the prone leg extension following a lateral ankle sprain: A prospective case study pre and post injury. Chiropr. Osteopat. 2006, 14, 4. [Google Scholar] [CrossRef] [Scilit]
  10. Lehman, G.J.; Lennon, D.; Tresidder, B.; Rayfield, B.; Poschar, M. Muscle recruitment patterns during the prone leg extension. BMC Musculoskelet Disord. 2004, 5, 3. [Google Scholar] [CrossRef] [Scilit]
  11. Arab, A.M.; Haghighat, A.; Amiri, Z.; Khosravi, F. Lumbar lordosis in prone position and prone hip extension test: Comparison between subjects with and without low back pain. Chiropr. Man. Ther. 2017, 25, 8. [Google Scholar] [CrossRef] [Scilit]
  12. Bruno, P.A.; Millar, D.P.; A Goertzen, D. Patient-reported perception of difficulty as a clinical indicator of dysfunctional neuromuscular control during the prone hip extension test and active straight leg raise test. Man. Ther. 2014, 19, 602–607. [Google Scholar] [CrossRef] [Scilit]
  13. Vogt, L.; Banzer, W. Dynamic testing of the motor stereotype in prone hip extension from neutral position. Clin. Biomech. Bristol Avon 1997, 12, 122–127. [Google Scholar] [CrossRef] [Scilit]
  14. Staheli, L.T. The prone hip extension test: A method of measuring hip flexion deformity. Clin. Orthop. 1977, 123, 12–15. [Google Scholar] [CrossRef] [Scilit]
  15. WMA. The World Medical Association-Declaration of Helsinki. Available online: https://www.wma.net/what-we-do/medical-ethics/declaration-of-helsinki/ (accessed on 22 February 2025).
  16. Nygren Pierce, M.; Lee, W.A. Muscle firing order during active prone hip extension. J. Orthop. Sports Phys. Ther. 1990, 12, 2–9. [Google Scholar] [CrossRef] [Scilit] [PubMed]
  17. Sim, Y.-J.; Byun, Y.-H.; Yoo, J. Comparison of isokinetic muscle strength and muscle power by types of warm-up. J. Phys. Ther. Sci. 2015, 27, 1491–1494. [Google Scholar] [CrossRef] [Scilit] [PubMed]
  18. Charbonnier, C.; Chagué, S.; Schmid, J.; Kolo, F.C.; Bernardoni, M.; Christofilopoulos, P. Analysis of Hip Range of Motion in Everyday Life: A Pilot Study. HIP Int. 2015, 25, 82–90. [Google Scholar] [CrossRef] [Scilit]
  19. Tran, S.T.; Thomas, S.; DiCesare, C.; Pfeiffer, M.; Sil, S.; Ting, T.V.; Williams, S.E.; Myer, G.D.; Kashikar-Zuck, S. A pilot study of biomechanical assessment before and after an integrative training program for adolescents with juvenile fibromyalgia. Pediatr. Rheumatol. Online J. 2016, 14, 43. [Google Scholar] [CrossRef] [Scilit]
  20. LABIOMEP. Porto Biomechanics Laboratory. Available online: https://labiomep.up.pt/ (accessed on 22 February 2025).
  21. Cappozzo, A.; Della Croce, U.; Leardini, A.; Chiari, L. Human movement analysis using stereophotogrammetry. Part 1: Theoretical background. Gait Posture 2005, 21, 186–196. [Google Scholar] [CrossRef] [Scilit]
  22. Ehara, Y.; Fujimoto, H.; Miyazaki, S.; Mochimaru, M.; Tanaka, S.; Yamamoto, S. Comparison of the performance of 3D camera systems II. Gait Posture 1997, 5, 251–255. [Google Scholar] [CrossRef] [Scilit]
  23. Feng, Y.; Max, L. Accuracy and precision of a custom camera-based system for 2-d and 3-d motion tracking during speech and nonspeech motor tasks. J. Speech Lang. Hear. Res. 2014, 57, 426–438. [Google Scholar] [CrossRef] [Scilit]
  24. Leardini, A.; Chiari, L.; Della Croce, U.; Cappozzo, A. Human movement analysis using stereophotogrammetry. Part 3. Soft tissue artifact assessment and compensation. Gait Posture 2005, 21, 212–225. [Google Scholar] [CrossRef] [Scilit]
  25. Richards, J.G. The measurement of human motion: A comparison of commercially available systems. Hum. Mov. Sci. 1999, 18, 589–602. [Google Scholar] [CrossRef] [Scilit]
  26. Wu, G.; Siegler, S.; Allard, P.; Kirtley, C.; Leardini, A.; Rosenbaum, D.; Whittle, M.; D’Lima, D.D.; Cristofolini, L.; Witte, H.; et al. ISB recommendation on definitions of joint coordinate system of various joints for the reporting of human joint motion—Part I: Ankle, hip, and spine. International Society of Biomechanics. J. Biomech. 2002, 35, 543–548. [Google Scholar] [CrossRef] [Scilit] [PubMed]
  27. Özçakar, L.; Kunduracyoolu, B.; Cetin, A.; Ülkar, B.; Guner, R.; Hascelik, Z. Comprehensive isokinetic knee measurements and quadriceps tendon evaluations in footballers for assessing functional performance. Br. J. Sports Med. 2003, 37, 507–510. [Google Scholar] [CrossRef] [Scilit] [PubMed]
  28. Chan, Y.H. Biostatistics 104: Correlational analysis. Singap. Med. J. 2003, 44, 614–619. [Google Scholar]
  29. Reiman, M.P.; Manske, R.C. The assessment of function: How is it measured? A clinical perspective. J. Man. Manip. Ther. 2011, 19, 91–99. [Google Scholar] [CrossRef] [Scilit]
  30. Fousekis, K.; Tsepis, E.; Vagenas, G. Multivariate isokinetic strength asymmetries of the knee and ankle in professional soccer players. J. Sports Med. Phys. Fitness. 2010, 50, 465–474. [Google Scholar]
  31. Kramer, J.F.; E Balsor, B. Lower extremity preference and knee extensor torques in intercollegiate soccer players. Can. J. Sport Sci. 1990, 15, 180–184. [Google Scholar]
  32. Poulis, I.; Chatzis, S.; Christopoulou, K.; Tsolakis, C. Isokinetic Strength during Knee Flexion and Extension in Elite Fencers. Percept. Mot. Skills 2009, 108, 949–961. [Google Scholar] [CrossRef] [Scilit]
  33. Wanke, E.M.; Gabrys, L.; Leslie-Spinks, J.; Ohlendorf, D.; Groneberg, D.A. Functional muscle asymmetries and laterality in Latin American formation dancers. J. Back Musculoskelet. Rehabil. 2018, 31, 931–938. [Google Scholar] [CrossRef] [Scilit]
  34. McGrath, T.M.; Waddington, G.; Scarvell, J.M.; Ball, N.B.; Creer, R.; Woods, K.; Smith, D. The effect of limb dominance on lower limb functional performance—a systematic review. J. Sports Sci. 2016, 34, 289–302. [Google Scholar] [CrossRef] [Scilit]
  35. DeLang, M.D.; Rouissi, M.; Bragazzi, N.L.; Chamari, K.; Salamh, P.A. Soccer Footedness and Between-Limbs Muscle Strength: Systematic Review and Meta-Analysis. Int. J. Sports Physiol. Perform. 2019, 14, 551–562. [Google Scholar] [CrossRef] [Scilit]
  36. Croisier, J.L.; Ganteaume, S.; Binet, J.; Genty, M.; Ferret, J.M. Strength imbalances and prevention of hamstring injury in professional soccer players: A prospective study. Am. J. Sports Med. 2008, 36, 1469–1475. [Google Scholar] [CrossRef] [Scilit]
  37. Magalhães, E.; Silva, A.P.M.C.C.; Sacramento, S.N.; Martin, R.L.; Fukuda, T.Y. Isometric strength ratios of the hip musculature in females with patellofemoral pain: A comparison to pain-free controls. J. Strength Cond. Res. 2013, 27, 2165–2170. [Google Scholar] [CrossRef] [Scilit] [PubMed]
  38. Nadler, S.F.; Malanga, G.A.; Feinberg, J.H.; Prybicien, M.; Stitik, T.P.; DePrince, M. Relationship between hip muscle imbalance and occurrence of low back pain in collegiate athletes: A prospective study. Am. J. Phys. Med. Rehabil. 2001, 80, 572–577. [Google Scholar] [CrossRef] [Scilit] [PubMed]
  39. Nadler, S.F.; Malanga, G.A.; Bartoli, L.A.; Feinberg, J.H.; Prybicien, M.; Deprince, M. Hip muscle imbalance and low back pain in athletes: Influence of core strengthening. Med. Sci. Sports Exerc. 2002, 34, 9–16. [Google Scholar] [CrossRef] [Scilit] [PubMed]
  40. Velotta, J.; Weyer, J.; Ramirez, A.; Winstead, J.; Bahamonde, R. Relationship between leg dominance tests and type of task. Port. J. Sport Sci. 2011, 11, 1035–1038. [Google Scholar]
  41. Behdarvandan, A.; Shaterzadeh-Yazdi, M.J.; Negahban, H.; Mehravar, M. Differences in timing and magnitude of lumbopelvic rotation during active and passive knee extension in sitting position in people with and without low back pain: A cross-sectional study. Hum. Mov. Sci. 2019, 64, 338–346. [Google Scholar] [CrossRef] [Scilit]
  42. Hart, J.M.; Weltman, A.; Ingersoll, C.D. Quadriceps activation following aerobic exercise in persons with low back pain and healthy controls. Clin. Biomech. Bristol Avon 2010, 25, 847–851. [Google Scholar] [CrossRef] [Scilit]
  43. Bruno, P.A.; Bagust, J. An investigation into motor pattern differences used during prone hip extension between subjects with and without low back pain. Clin. Chiropr. 2007, 10, 68–80. [Google Scholar] [CrossRef] [Scilit]
Figure 1. Representation of the lower-limb experimental marker setup used in this study.
Applsci 15 12735 g001
Table 1. Subjects’ anthropometric data.
Number of Subjects AgeHeight (m)Weight (kg)
MaleFemale Mean ± s.d.Mean ± s.d.Mean ± s.d.
5 224.3 ± 3.4173.1 ± 7.572.1 ± 9.5
Note: Values expressed as mean ± standard deviation (s.d.).
Table 2. Comparison of initial and final hip positions in active and passive PHET.
Ext/FlexAdd/AbdIR/ER
ActivePassivepActivePassivepActivePassivep
RightIP23.3 (31.3)13.1 (14.6)0.61−4.1 (3.8)6.2 (9.7)0.03 *23.9 (40.2)6.6 (28.3)0.02 *
FP31.8 (6.0)34.1 (6.6)0.87−3.6 (7.8)−8.6 (7.9)0.13−25.7 (29.9)1.9 (32.6)0.02 *
LeftIP12.0 (29.9)18.7 (10.7)0.61−7.5 (6.1)−4.3 (7.0)0.02 *−12.4 (26.7)10.8 (27.4)0.09
FP29.1 (10.2)32.3 (11.9)0.6110.6 (5.9)9.5 (5.8)0.3520.7 (18.9)−0.7 (23.8)0.02 *
Left vs. Right IPp0.610.40-0.090.61-0.310.74-
Left vs. Right FPp0.870.87-0.180.50-0.400.61-
Note: Values are expressed in degrees and in the form of median (interquartile range (IR)). It was considered: (+) flexion/(−) extension; (+) adduction/(−) abduction; (+) internal rotation/(−) external rotation. Extension (Ext); Flexion (Flex); Adduction (Add); Abduction (Abd); Internal Rotation (IR); External Rotation (ER); Final Position (FP); Initial Position (IP). * Values statistically significant for p ≤ 0.05.
Table 3. Correlation between the amplitudes of the initial and final positions of the right and left hips in an active and passive supine hip extension test in the para-sagittal plane and the isokinetic neuromuscular function towards flexion at 180°/s.
Peak Torque/BW Flex (%)Time to Peak Torque Flex (ms)Acceleration Time Flex (ms)Deceleration Time Flex (ms)Agonist/
Antagonist
Ratio (%)
ActiveRightMedian (IR)101.6 (30.6)530 (250)140.4 (89.5)60.0 (10.0)71.8 (41.4)
IPρ −0.04−0.43−0.07−0.04−0.07
p0.940.340.880.940.88
FPρ −0.250.21−0.540.36−0.54
p0.590.650.220.430.22
LeftMedian (IR)97.5 (20.6)290 (130)146.3 (65.2)60.0 (30.0)69.1 (16.7)
IPρ −0.110.25−0.070.59−0.07
p0.820.590.880.160.88
FPρ 0.13−0.05−0.020.30−0.02
p0.790.910.970.520.97
PassiveRightIPρ 0.50−0.220.27−0.350.27
p0.250.640.560.440.56
FPρ −0.790.54−0.860.95−0.86
p0.04 *0.220.01 *0.00 *0.01 *
IPρ −0.580.51−0.130.40−0.13
Leftp0.170.240.790.380.79
FPρ −0.070.11−0.070.30−0.07
p0.880.820.880.520.88
Note: Values expressed in the form of median (interquartile range (IR)). Final Position (FP); Initial Position (IP); Body Weight (BW); Flexion (Flex). * Values statistically significant for p ≤ 0.05.
Table 4. Correlation between the amplitudes of the initial and final positions of the right and left hips in an active and passive supine hip extension test in the para-sagittal plane and the isokinetic neuromuscular function towards extension at 180°/s.
Peak Torque/BW Ext (%)Time to Peak Torque Ext (ms)Acceleration Time Ext (ms)Deceleration Time Ext (ms)Agonist/Antagonist Ratio (%)
Active Median (IR)189.6 (54.2)190 (100)246.9 (126.5)40 (30)128.5 (65.1)
RightIPρ 0.180.410.180.360.18
p0.700.360.700.430.70
FPρ −0.460.52−0.460.60−0.46
p0.290.230.290.160.29
Median (IR)183.1 (67.2)190 (50)249.7 (123.6)40.0 (10.0)124.7 (64.9)
IPρ 0.040.060.04−0.040.04
Leftp0.940.900.940.940.94
FPρ 0.02−0.210.020.110.02
p0.970.660.970.810.97
PassiveRightIPρ 0.16−0.490.16−0.370.16
p0.730.260.730.420.73
FPρ −0.750.81−0.750.90−0.75
p0.05 *0.03 *0.05 *0.01 *0.05 *
IPρ 0.400.020.40−0.450.40
Leftp0.370.970.370.310.37
FPρ −0.120.09−0.110.11−0.11
p0.820.840.820.810.82
Note: Values expressed in the form of median (interquartile range (IR)). Final Position (FP); Initial Position (IP); Body Weight (BW); Extension (Ext). * Values statistically significant for p ≤ 0.05.
Table 5. Correlation between the amplitudes of the initial and final positions of the right and left hips in an active and passive supine hip extension test in the para-sagittal plane and the isokinetic neuromuscular function towards flexion at 300°/s.
Peak Torque/BW Flex (%)Time to Peak Torque Flex (ms)Acceleration Time Flex (ms)Deceleration Time Flex (ms)Agonist/Antagonist Ratio (%)
Active Median (IR)97.7 (8.4)380.0 (50.0)152.2 (93.7)110.0 (50.0)66.3 (16.5)
RightIPρ−0.140.38−0.210.400.14
p0.760.400.640.370.76
FPρ −0.070.20−0.430.44−0.36
p0.880.670.340.320.43
Median (IR)93.7 (20.0)360.0 (60.0)154.3 (74.6)100.0 (50.0)61.5 (22.0)
IPρ −0.250.22−0.210.670.00
Leftp0.590.640.640.101.00
FPρ 0.290.02−0.020.440.27
p0.530.970.970.320.56
PassiveRightIPρ0.13−0.750.45−0.320.27
p0.790.05 *0.310.480.56
FPρ0.250.66−0.820.90−0.61
p0.560.110.02 *0.00 *0.15
IPρ−0.290.03−0.130.170.20
Leftp0.530.950.790.710.67
FPρ0.11−0.11−0.250.38−0.14
p0.820.820.590.400.76
Note: Values expressed in the form of median (interquartile range (IR)). Final Position (FP); Initial Position (IP); Body Weight (BW); Flexion (Flex). * Values statistically significant for p ≤ 0.05.
Table 6. Correlation between the amplitudes of the initial and final positions of the right and left hips in an active and passive supine hip extension test in the para-sagittal plane and the isokinetic neuromuscular function towards extension at 300°/s.
Peak Torque/BW Ext (%)Time to Peak Torque Ext (ms)Acceleration Time Ext (ms)Deceleration Time Ext (ms)Agonist/Antagonist Ratio (%)
Active Median (IR)155.8 (42.6)130.0 (50.0)305.9 (163.3)60.0 (40.0)104.7 (50.7)
RightIPρ 0.210.140.110.080.14
p0.640.760.820.870.76
FPρ −0.320.46−0.500.32−0.39
p0.480.290.250.490.38
Median (IR)133.8 (51.6)140.0 (10.0)269.7 (136.5)60.0 (30.0)92.7 (48.9)
IPρ 0.04−0.220.04−0.420.04
Leftp0.940.630.940.340.94
FPρ 0.11−0.220.02−0.37−0.02
p0.820.640.970.410.97
PassiveRightIPρ 0.25−0.400.18−0.510.25
p0.580.380.700.240.58
FPρ −0.611.00−0.750.95−0.79
p0.150.00 *0.05 *0.00 *0.04 *
LeftIPρ 0.69−0.590.40−0.840.40
p0.090.160.370.02 *0.37
FPρ −0.14−0.09−0.11−0.24−0.11
p0.760.840.820.610.82
Note: Values expressed in the form of median (interquartile range (IR)). Final Position (FP); Initial Position (IP); Body Weight (BW); Extension (Ext). * Values statistically significant for p ≤ 0.05.
Table 7. Correlation between the amplitudes of the initial and final positions of the right and left hips in an active and passive supine hip extension test in the frontal plane and the isokinetic neuromuscular function towards flexion at 180°/s.
Peak Torque/BW Ext (%)Time to Peak Torque Ext (ms)Acceleration Time Ext (ms)Deceleration Time Ext (ms)Agonist/Antagonist Ratio (%)
Active Median (IR)101.6 (30.6)530 (250)140.4 (89.5)60.0 (10.0)71.8 (41.4)
RightIPρ−0.390.21−0.570.62−0.57
p0.380.640.180.140.18
FPρ−0.430.11−0.560.54−0.54
p0.340.820.220.210.22
Median (IR)97.5 (20.6)290 (130)146.3 (65.2)60.0 (30.0)69.1 (16.7)
LeftIPρ−0.190.070.290.040.29
p0.670.880.530.940.53
FPρ−0.18−0.720.47−0.150.47
p0.970.880.290.750.29
PassiveRightIPρ−0.390.46−0.540.95−0.54
p0.380.290.220.000.22
FPρ−0.460.57−0.610.82−0.61
p0.290.180.150.02 *0.15
LeftIPρ0.18−0.180.320.330.32
p0.700.700.480.460.48
FPρ−0.390.320.180.180.18
p0.380.480.700.690.70
Note: Values expressed in the form of median (interquartile range (IR)). Final Position (FP); Initial Position (IP); Body Weight (BW); Extension (Ext). * Values statistically significant for p ≤ 0.05.
Table 8. Correlation between the amplitudes of the initial and final positions of the right and left hips in an active and passive supine hip extension test in the frontal plane and the isokinetic neuromuscular function towards extension at 180°/s.
Peak Torque/BW Ext (%)Time to Peak Torque Ext (ms)Acceleration Time Ext (ms)Deceleration Time Ext (ms)Agonist/Antagonist Ratio (%)
Active Median (IR)189.6 (54.2)190 (100)246.9 (126.5)40 (30)128.5 (65.1)
RightIPρ −0.430.81−0.430.90−0.43
p0.340.03 *0.340.01 *0.34
FPρ −0.320.780.670.90−0.32
p0.480.04 *0.100.01 *0.48
Median (IR)183.1 (67.2)190 (50)249.7 (123.6)40.0 (10.0)124.7 (64.9)
IPρ 0.47−0.270.47−0.660.47
Leftp0.290.550.290.110.29
FPρ 0.61−0.410.61−0.760.61
p0.140.340.140.05 *0.14
PassiveRightIPρ −0.610.65−0.610.77−0.61
p0.140.120.150.04 *0.15
FPρ −0.640.81−0.640.88−0.64
p0.120.03 *0.120.01 *0.12
IPρ 0.32−0.430.32−0.340.32
Leftp0.480.330.480.460.48
FPρ 0.54−0.170.54−0.670.54
p0.220.720.220.010.22
Note: Values expressed in the form of median (interquartile range (IR)). Final Position (FP); Initial Position (IP); Body Weight (BW); Extension (Ext). * Values statistically significant for p ≤ 0.05.
Table 9. Correlation between the amplitudes of the initial and final positions of the right and left hips in an active and passive supine hip extension test in the frontal plane and the isokinetic neuromuscular function towards flexion at 300°/s.
Peak Torque/BW Flex (%)Time to Peak Torque Flex (ms)Acceleration Time Flex (ms)Deceleration Time Flex (ms)Agonist/Antagonist Ratio (%)
ActiveRightMedian (IR)97.7 (8.4)380.0 (50.0)152.2 (93.7)110.0 (50.0)66.3 (16.5)
IPρ −0.040.51−0.540.64−0.32
p0.940.240.220.120.48
FPρ −0.140.64−0.570.64−0.29
p0.760.120.180.120.54
LeftMedian (IR)93.7 (20.0)360.0 (60.0)154.3 (74.6)100.0 (50.0)61.5 (22.0)
IPρ −0.81−0.190.38−0.240.18
p0.03 *0.680.400.610.70
FPρ −0.70−0.30.16−0.360.36
p0.080.510.730.420.43
PassiveRightIPρ 0.570.37−0.540.81−0.29
p0.180.420.220.03 *0.54
FPρ 0.110.59−0.570.61−0.46
p0.820.170.180.150.29
IPρ −0.29−0.200.210.110.36
Leftp0.540.670.650.820.43
FPρ −0.64−0.200.000.110.21
p0.120.671.000.820.64
Note: Values expressed in the form of median (interquartile range (IR)). Final Position (FP); Initial Position (IP); Body Weight (BW); Flexion (Flex). * Values statistically significant for p ≤ 0.05.
Table 10. Correlation between the amplitudes of the initial and final positions of the right and left hips in an active and passive supine hip extension test in the frontal plane and the isokinetic neuromuscular function towards extension at 300°/s.
Peak Torque/BW Flex (%)Time to Peak Torque Flex (ms)Acceleration Time Flex (ms)Deceleration Time Flex (ms)Agonist/Antagonist Ratio (%)
ActiveRightMedian (IR)97.7 (8.4)380.0 (50.0)152.2 (93.7)110.0 (50.0)66.3 (16.5)
IPρ −0.290.68−0.460.50−0.36
p0.540.090.290.250.43
FPρ −0.210.64−0.390.50−029
p0.650.120.380.250.54
LeftMedian (IR)93.7 (20.0)360.0 (60.0)154.3 (74.6)100.0 (50.0)61.5 (22.0)
IPρ 0.29−0.410.47−0.390.47
p0.530.370.290.390.29
FPρ 0.36−0.500.61−0.390.61
p0.430.250.140.390.14
PassiveRightIPρ −0.430.86−0.460.69−0.54
p0.340.01 *0.290.080.22
FPρ −0.540.79−0.570.64−0.54
p0.220.04 *0.180.120.22
IPρ 0.14−0.370.32−0.380.32
Leftp0.760.410.480.390.48
FPρ 0.64−0.670.54−0.830.54
p0.120.100.220.02 *0.22
Values expressed in the form of median (interquartile range (IR)). Final Position (FP); Initial Position (IP); Body Weight (BW); Flexion (Flex). * Values statistically significant for p ≤ 0.05.
Disclaimer/Publisher’s Note: The statements, opinions and data contained in all publications are solely those of the individual author(s) and contributor(s) and not of MDPI and/or the editor(s). MDPI and/or the editor(s) disclaim responsibility for any injury to people or property resulting from any ideas, methods, instructions or products referred to in the content.