1. Description of the Jasień and Olechówka River Using the RHS Method
Łódź is located within a watershed zone, resulting in a divergent hydrographic system. Water from the northern part of the city flows into the Bzura River, which subsequently joins the Vistula through its tributaries. Conversely, water from the southwestern areas drains into the Ner River, which ultimately flows into the Warta [
1]. The Vistula River basin includes rivers such as the Bzura, Sokołówka, Wrząca, Brzoza, Aniołówka, Zimna Woda, Łagiewniczanka, and Miazga, whereas the Oder River basin encompasses the Dobrzynka, Jasieniec, Bałutka, Łódka, Augustówka, Karolewka, Olechówka, Jasień, Gadka, and Ner. The longest rivers within the administrative boundaries of Łódź are Ner (22.5 km), Łódka (15.6 km), Sokołówka (13 km), Jasień (12.7 km), and Olechówka (12.5 km).
Urban development has gradually obscured the original river valleys, yet the geological substratum still reveals riverine and oxbow alluvia associated with former valley systems. The present study focuses on the Olechówka River—a left-bank tributary of the Jasień—and the Jasień River itself, both of which lie within the administrative limits of Łódź. Due to their location in a highly urbanized area, only minor segments retain a natural character; the majority flow through residential and industrial districts.
To assess the hydromorphological condition of these rivers, the River Habitat Survey (RHS) methodology was employed. RHS is a widely recognized approach for assessing the physical structure of rivers and identifying anthropogenic modifications. In Poland, the method has been in use since the late 1990s, with its final version standardized in 2007 [
2]. Fieldwork using RHS is carried out in two stages, recorded on a four-page field form [
3]. Page one includes metadata and general characteristics such as valley type, number of riffles, pools, erosion basins, embankments, and engineering structures. Page two documents ten control profiles (spaced every 50 m), capturing details about substrate type, flow characteristics, channel and bank modifications, vegetation structure, and land use. Page three contains synthesized data for the 500-m survey reach, and page four addresses channel dimensions.
Field studies were conducted along the entire accessible course of the Jasień River, covering twelve 500-m sections, each subdivided into ten control profiles. This approach facilitated the identification of various anthropogenic impacts and remaining natural features.
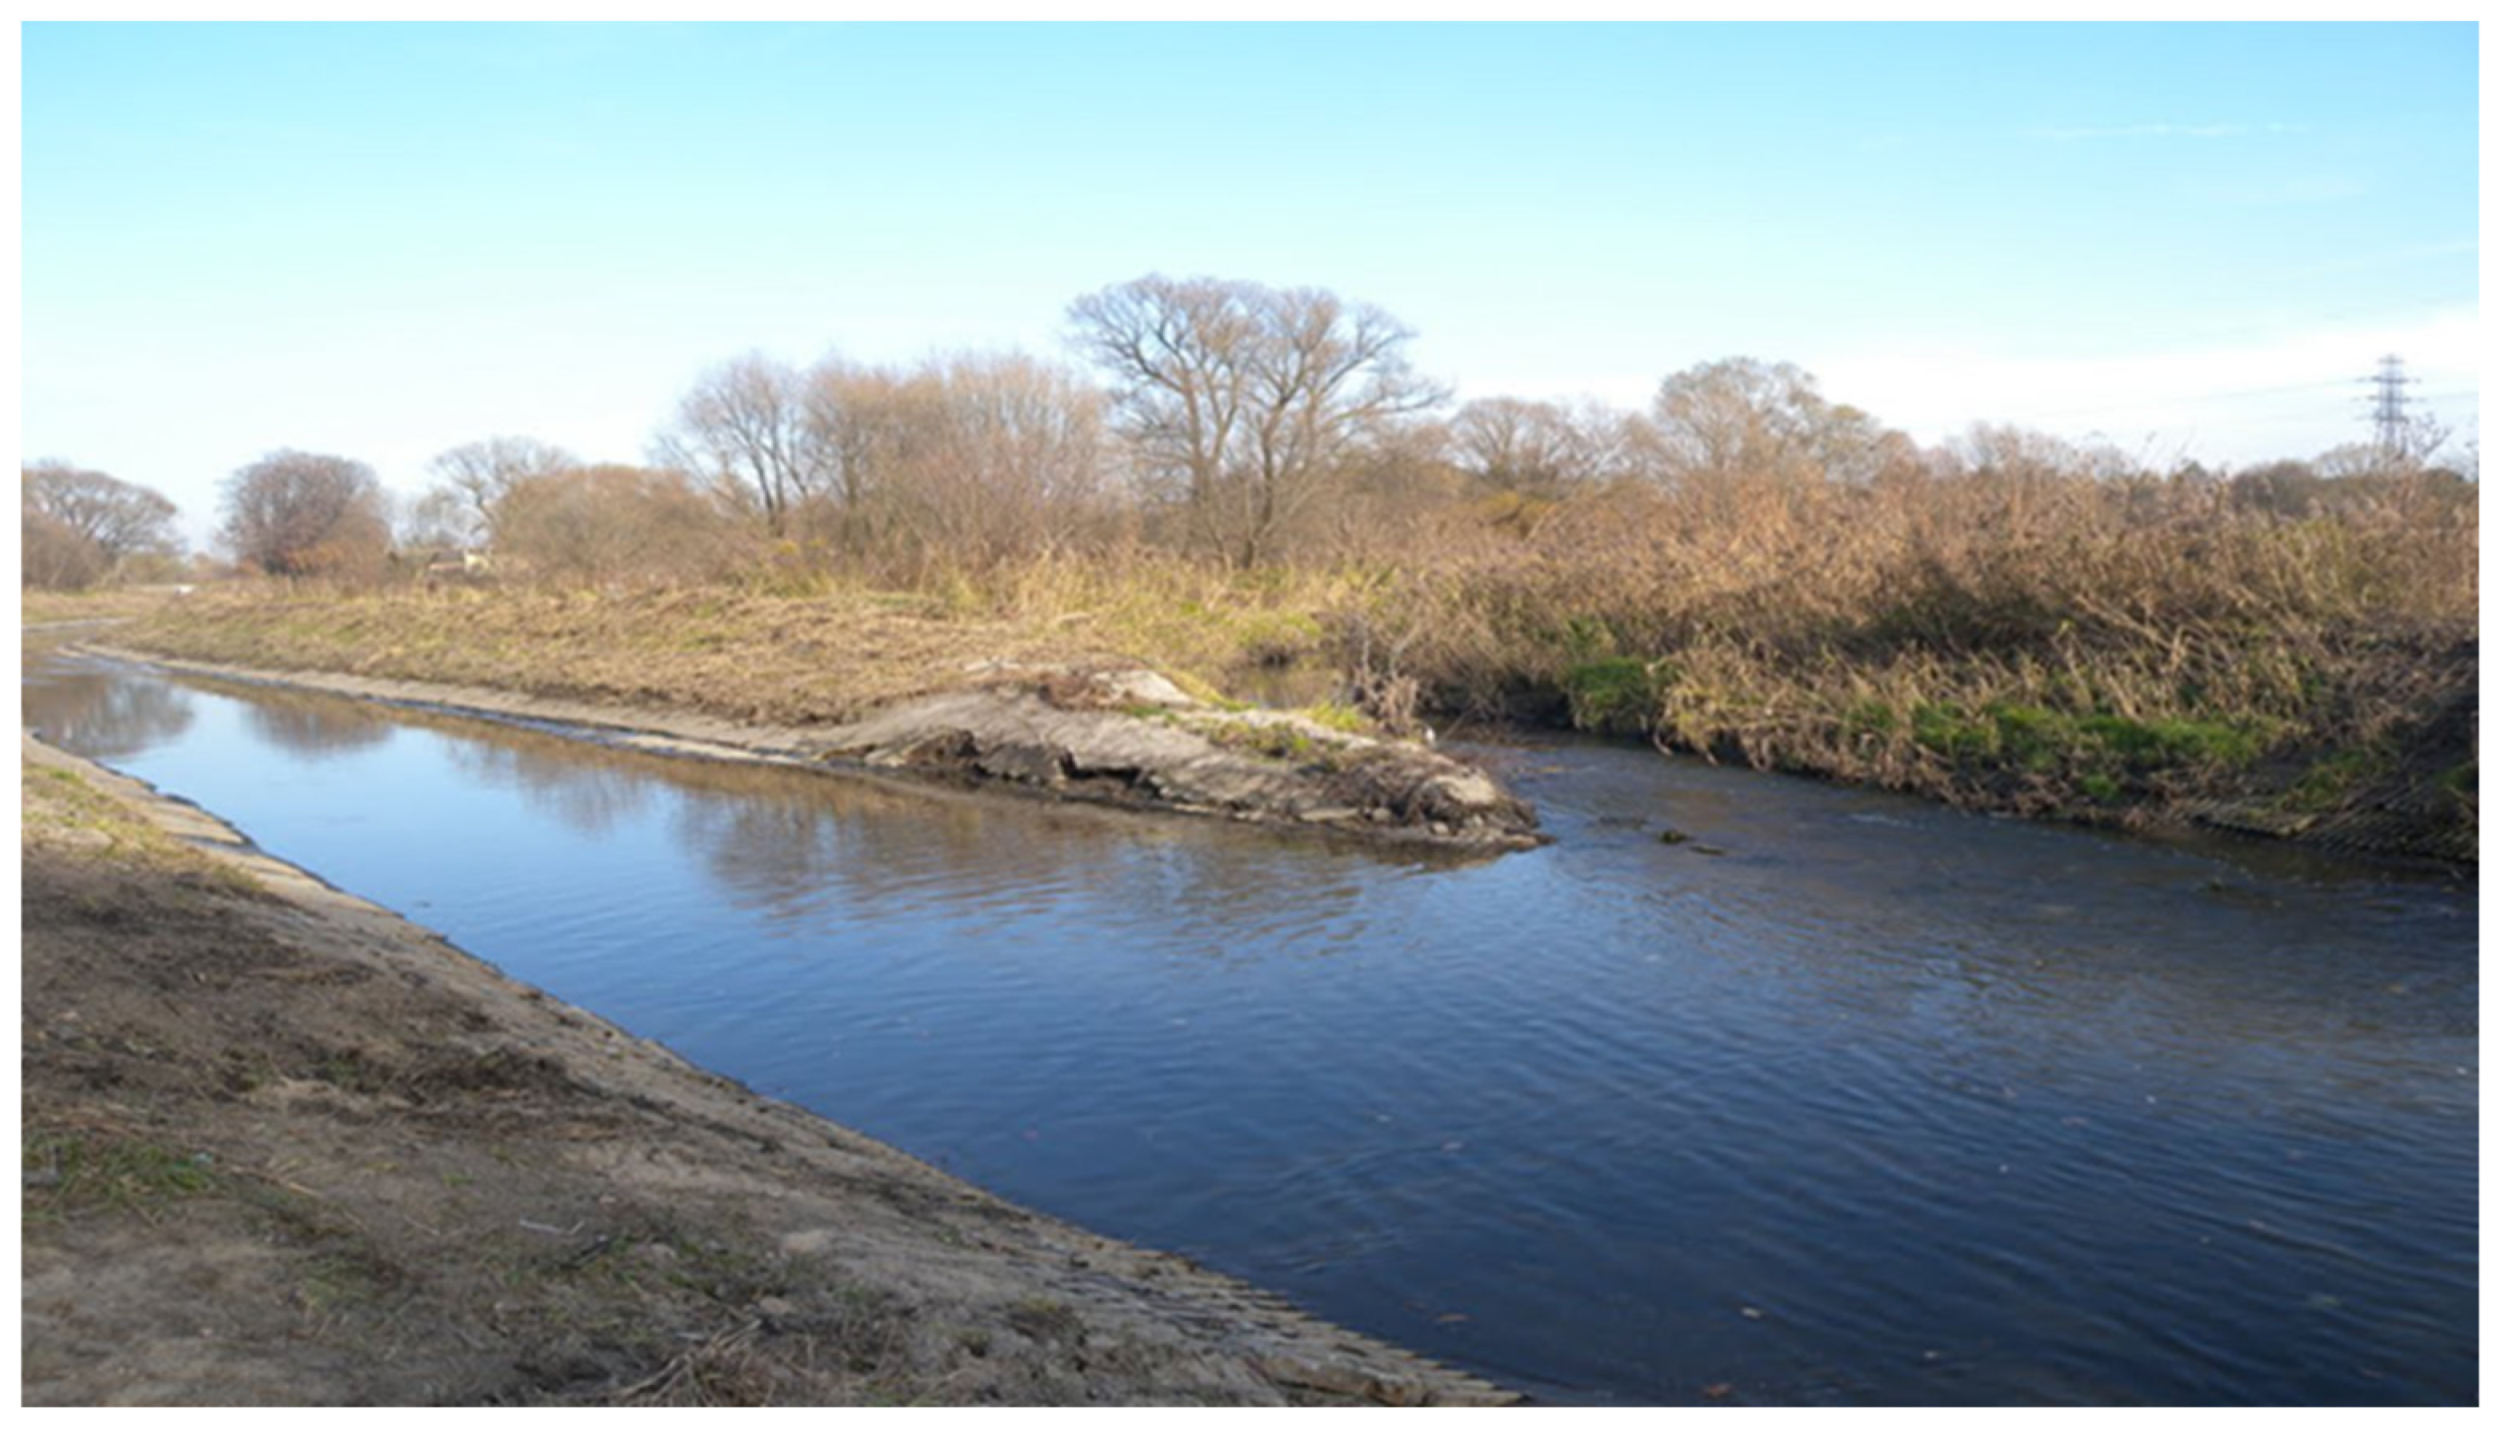
Figure 1 Shows the mouth of the Jasień River at its confluence with the Ner: the channel is clearly profiled (PR), the banks are reinforced (UM) with perforated slabs (MO), the flow is rapid (WA), and the vegetation is simplified (P), consisting of two types, herbaceous vegetation and trees.
The Olechówka River belongs to the Oder basin and has the Augustówka as a tributary. It flows entirely within the city of Łódź and is regulated along its entire length, running in an open channel—an uncommon condition in the city, where many rivers are enclosed underground. The study of Olechówka focused particularly on vegetation. Floristic data were collected for 21 cross-sections, with species-specific coverage values assigned in accordance with RHS standards. The final description of the Olechówka River was compiled into an Excel spreadsheet formatted according to RHS conventions.
For both rivers, synthetic hydromorphological indices were calculated: the Habitat Quality Assessment (HQA) and the Habitat Modification Score (HMS). The HQA reflects the diversity and presence of natural morphological features of the river and its valley, indicating how closely the reach approximates a natural or near-natural state. It is derived by summing values assigned to selected features across control profiles, as defined in the RHS methodology [
3]. The HMS index considers all anthropogenic alterations observed during the survey, ranging from 0 (no modification) to 100 (maximum alteration). Final classification under the Water Framework Directive is based on HQA and HMS values, with thresholds defined for five hydromorphological condition classes [
4].
Results indicated a poor hydromorphological status for three analyzed sections, primarily due to the dominance of anthropogenic features over natural ones. For the Jasień River, HQA values ranged from 17 to 21, while HMS values ranged from 30 to 55. These outcomes clearly demonstrate a degraded hydromorphological condition, emphasizing the prevalence of artificial structures and the loss of natural habitat components.
The expert assessment of hydromorphological conditions (HQA and HMS indices) was conducted in accordance with the standardized River Habitat Survey (RHS) protocol [
2,
3,
4]. The evaluation was performed by a single expert with extensive experience in fluvial geomorphology and hydromorphological river monitoring, trained in the application of the RHS method and authorized to carry out assessments consistent with the Water Framework Directive. All field measurements and observations were carried out directly using complete RHS field forms, which include detailed information on channel structure, bank characteristics, vegetation, and land use. To ensure consistency and repeatability, internal data verification was applied by comparing HQA and HMS values derived from independent river sections and by checking the accuracy of coding according to the RHS manual [
3]. The final index values were incorporated into the IAC neural network database as verified expert labels, serving as reference data for the network training and subsequent analysis.
This ensured that the neural network operated on high-quality, standardized expert data, allowing reliable testing of its ability to reproduce and infer hydromorphological assessments based on incomplete or partially available field information.
2. Application of the IAC Artificial Neural Network to the Description of the Jasień and Olechówka Rivers
For the automatic analysis of data included in the RHS description, one of the oldest artificial neural networks was proposed, originally presented in a classical work on this method of data processing [
5]. While modern river modeling studies typically employ other architectures, such as recurrent neural networks (LSTM), convolutional networks (CNN), or physics-informed neural networks (PINN) [
6,
7,
8], the IAC network remains an interesting alternative due to its interpretability and cluster-based structure.
This section is devoted to the description of the IAC-type network. The abbreviation stands for Interactive Activation and Competition. In this network, neurons are organized into specific “clusters”, which can be easily interpreted as structural elements of a database. In this study, the IAC network is presented in direct connection with the database over which it is “spanned”, providing a physical interpretation of the network.
The classical definition of databases typically includes both an abstract description of the information structure and a description of mechanisms enabling physical access to the stored data. In this context, the database will be considered as an ordered list of records, each containing complete information about an observed experimental event. In the analyzed case, the complete dataset describing an object corresponds to a section of the Jasień River within the RHS standard. Briefly put, the content of each record represents comprehensive information about the object.
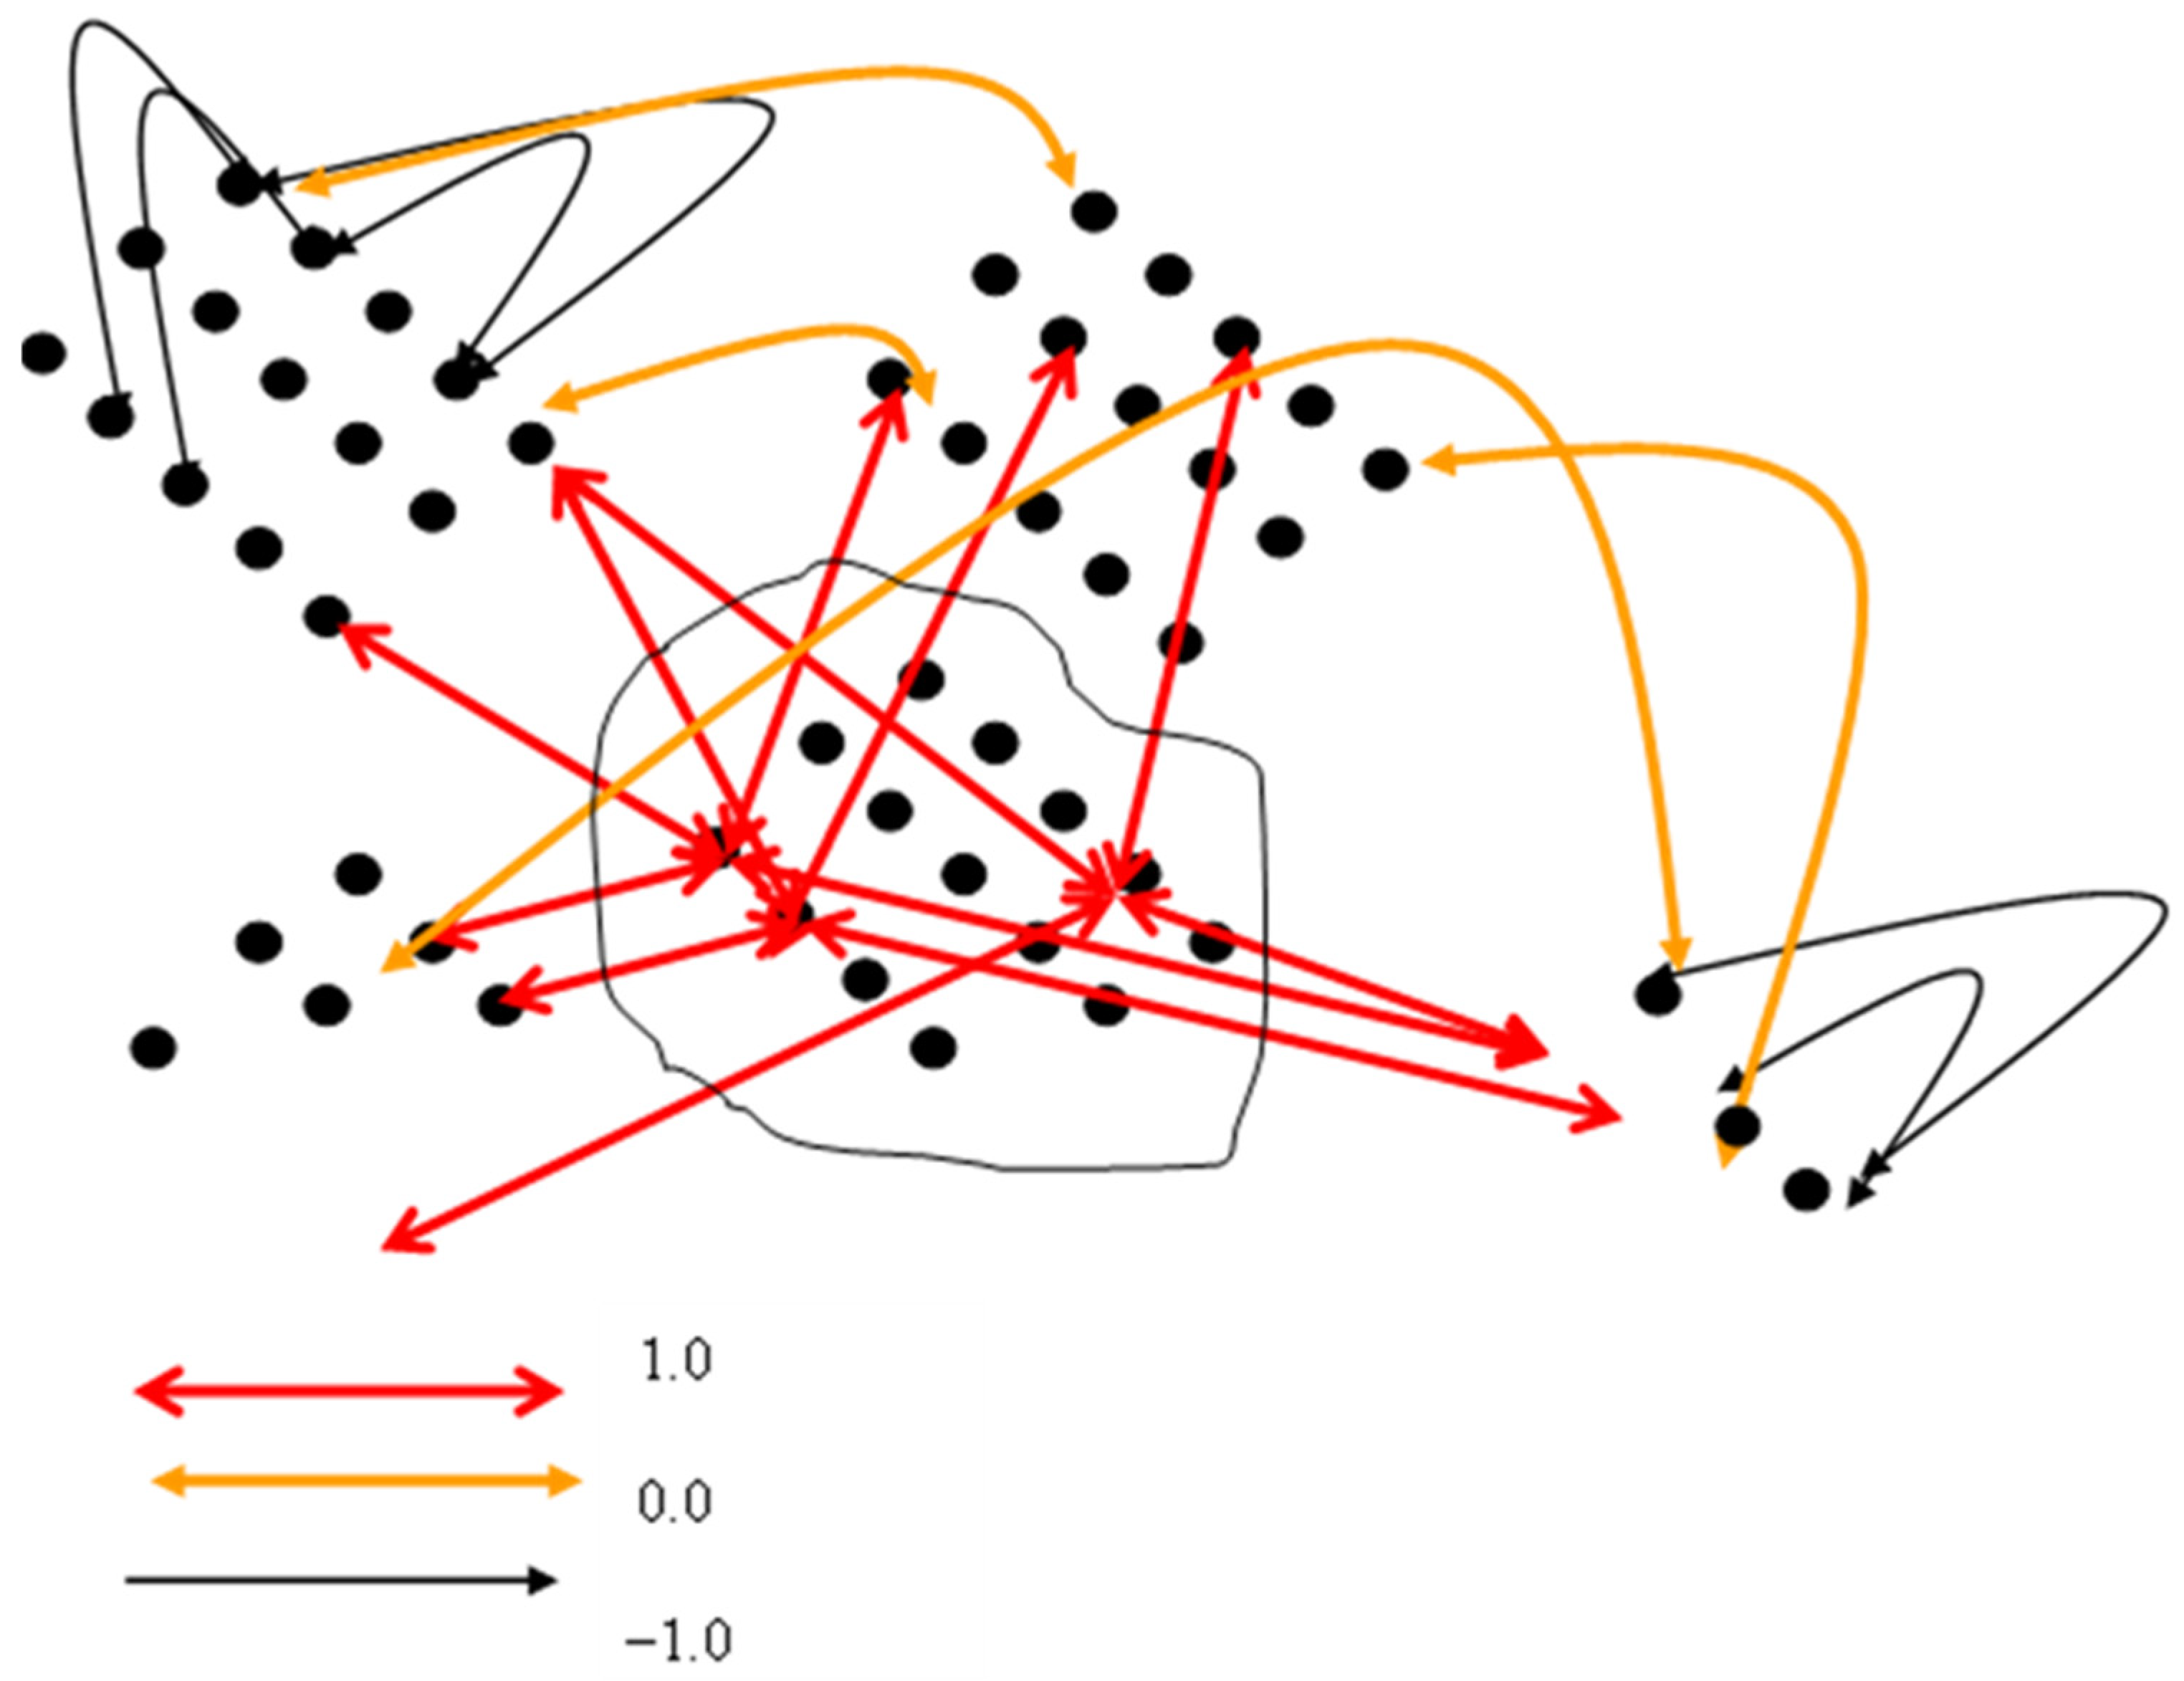
The IAC network is constructed from a set of neurons that receive signals from other neurons to which they are connected, sum those inputs, and transform the result using an activation function. The processed output signal is then transmitted through synapses to all connected neurons. Each synapse is assigned a weight w, which multiplies the transmitted signal. Neurons may be connected in various configurations. While traditional architectures often organize neurons in layers, the IAC network arranges them into clusters. All neurons within a cluster are interconnected with synapses of weight w = −1, which implements the competition mechanism within each cluster.
A label cluster is distinguished in the structure, in which each neuron is connected with weight w = 1 to exactly one neuron in each of the other clusters. Neurons in the label cluster are interpreted as names of the described entities–i.e., records in the database. The neurons in the clusters connected to the label cluster represent the attributes assigned to this cluster in a given database record. Unlike modern architectures such as LSTM, commonly used for modeling river flows [
8], the IAC network operates on the principle of local competition and mutual activation within clusters, which may offer advantages in structurally modeling environmental datasets.
The functioning of neural networks is well documented and widely described in textbooks. However, IAC-type networks are not as popular, and descriptions of them can usually be found in specialized articles rather than general publications. In recent hydrological applications, the dominant models include PINN and graph neural networks (GNN), which enable the modeling of complex spatial and physical relationships [
6,
8]. Therefore, the key formulas describing the operation of the IAC network will be presented below. The structure of the network is shown in
Figure 2.
The IAC network begins signal processing when an external activation (impulse) is applied to one or more nodes (the term node, more appropriate for technical applications, will be used synonymously with neuron). In this work, such an impulse is assumed to have a value of 1.0, while the initial activation values of the nodes are set at 0.2. These activation values are then transmitted to all nodes connected via synapses and multiplied by the corresponding synaptic weights.
The operation cycle of the network involves transmitting the signal from each node to its connected nodes and recalculating the activation value at each node. In this manner, subsequent neurons in the network are stimulated, their activation levels change, and they, in turn, send impulses to all their connected nodes.
Let us consider a single neuron in an Interactive Activation and Competition (IAC) network.
The total input signal to this neuron is computed as follows:
where
denotes the total input signal to the i-th neuron;
the output signal from the j-th neuron;
represents the external input signal (applied impulse) for the i-th neuron;
is the synaptic connection weight between neurons i and j.
The output signal of the
j-th neuron is determined as:
where
denotes the activation level of neuron
j.
The activation function is defined as a binary step function equal to 1 for positive arguments and 0 for negative ones.
The activation update for a neuron is computed based on the change in activation :
If
:
If
:
where
decay is the coefficient calibrating the damping effect of negative weights; it significantly influences the dynamics of the network. Theoretical guidelines recommend a value of 0.25, which is also used in this study.
rest represents a small resting activation value for a stable network without external input (e.g., −0.1).
min and max are limiting values within which neuron activation is confined, typically set to −0.2 and 1.0, respectively.
Software implementations of the IAC network allow the user to specify these four parameters.
After computing all activation increments at the end of cycle
n, the activation for the next
cycle + 1 is updated as:
The characteristic dynamic behavior of the IAC network results from its architecture (connection structure) and operational equations. The following key mechanisms can be identified:
Decay (inhibition): a tendency for neuron activations to return to the resting value (rest).
Bounded range: all neuron activations remain within the limits (min, max).
Neuron equilibrium: the activation of a single neuron becomes stable (changes are negligible) over consecutive cycles.
Network equilibrium: the activations of all neurons remain approximately constant across subsequent cycles.
Mutual excitation: neurons connected by positive weights mutually enhance their activations; this may occur between clusters not directly linked to the label cluster.
Competition: neurons connected by negative weights suppress one another. Within each cluster, one neuron eventually “wins,” achieving higher activation at the expense of others.
Blocking and hysteresis: an active neuron can prevent activation growth in another neuron to which it is negatively connected, even when the latter is strongly stimulated.
Oscillations: neuron activations may oscillate over successive computation cycles, repeating previous activation patterns without stabilization.
The mechanism of the IAC network causes the activation values of neurons to stabilize from a certain point (from a certain, subsequent cycle). It can be shown that, except for special cases, normal network activity leads to stabilization of neuron activation at certain values, which no longer change (or change within a certain permissible tolerance), with subsequent cycles. The stabilization of the network is facilitated by a specific mechanism of its operation, justifying its name. In each cluster, neuron activations are suppressed, neurons compete with each other because they exchange signals multiplied by negative weights. As a result of competition, in each cluster, one neuron “wins”, whose weight stabilizes at a level higher than the other neurons. The winner is the neuron that, in the process of mutual activation external to the cluster, is activated by the largest number of neurons from the label cluster. Connections between nodes are bidirectional, so neurons from the label cluster are also stimulated by the activation levels of nodes within other clusters. This is how the mechanism of mutual activation between clusters and competition within each cluster works. The obvious interpretation of this mechanism is that the winning neuron corresponds to only one of the possible properties within a given category. The attribute values in the category cluster for the selected object are mutually exclusive. One, the correct one, must be selected. Thanks to the competition mechanism between neurons in the cluster, an “almost” unique attribute value is selected from all possible ones. The measure of the uniqueness of the choice is the contrast between the activation of the winning neuron and the activations of the other neurons in this cluster.
The map of neuron activity of the stabilized network is treated as the network’s “response” to the signal that excites it. Neuron activations, as well as intentional excitation of selected neurons, are interpreted “physically” as information about the properties of objects entered into the Database. Due to the very large database, before starting the IAC network, the river data must be transformed. The list of attribute values is established by the RHS method’s standards. In each category, we therefore have a finite number of attribute values.
It should first be noted that the traditional IAC data format is well suited for organization using a Microsoft Excel (version 2010) spreadsheet. A standard Excel worksheet related to the RHS description has been included in this study. It should be emphasized that this worksheet is transposed in relation to the layout described earlier: the columns serve as database rows, while the rows serve as database columns. This minor inconvenience arises from the fact that the RHS report structure, widely adopted in both practice and literature, should not be altered. At the same time, the IAC network described herein was previously applied to other problems, for which a data representation convention identical to that used in this work was adopted.
In the RHS worksheet, data corresponding to individual river sections are entered in columns and represent objects. The categories discussed in the previous chapter correspond to attributes determined during the river survey and are entered in the rows of the Excel worksheet. The list of attribute values is defined by the RHS method standard.
The study utilized 12 profiles of the Jasień River and 21 profiles of the Olechówka River. Each category includes a finite number of possible attribute values. Since the database describing each river cross-section contains approximately 650 categories, it can be classified as a large database—this classification is generally justified for datasets exceeding 300 categories. The IAC neural network used in this study operates as a self-organizing associative system rather than a trainable model in the conventional sense. Its learning process is based on iterative activation and competition dynamics among interconnected clusters until equilibrium is reached. Parameter values (decay = 0.25, rest = −0.1, min = −0.2, max = 1.0) were adopted from theoretical guidelines and verified empirically for stability. Validation was conducted by comparing the network’s inferred hydromorphological indices (HQA, HMS) with expert-assigned values, which confirmed full agreement for all analyzed sections.
Correspondence: RHS description–IAC network is defined as follows:
- -
the names (numbers) of river sections are objects entered in the database in rows, in the IAC network they correspond to label cluster nodes.
- -
description categories are columns in the database and clusters in the IAC network.
- -
attribute values (possible observation results in the RHS standard) are neurons in individual network clusters.
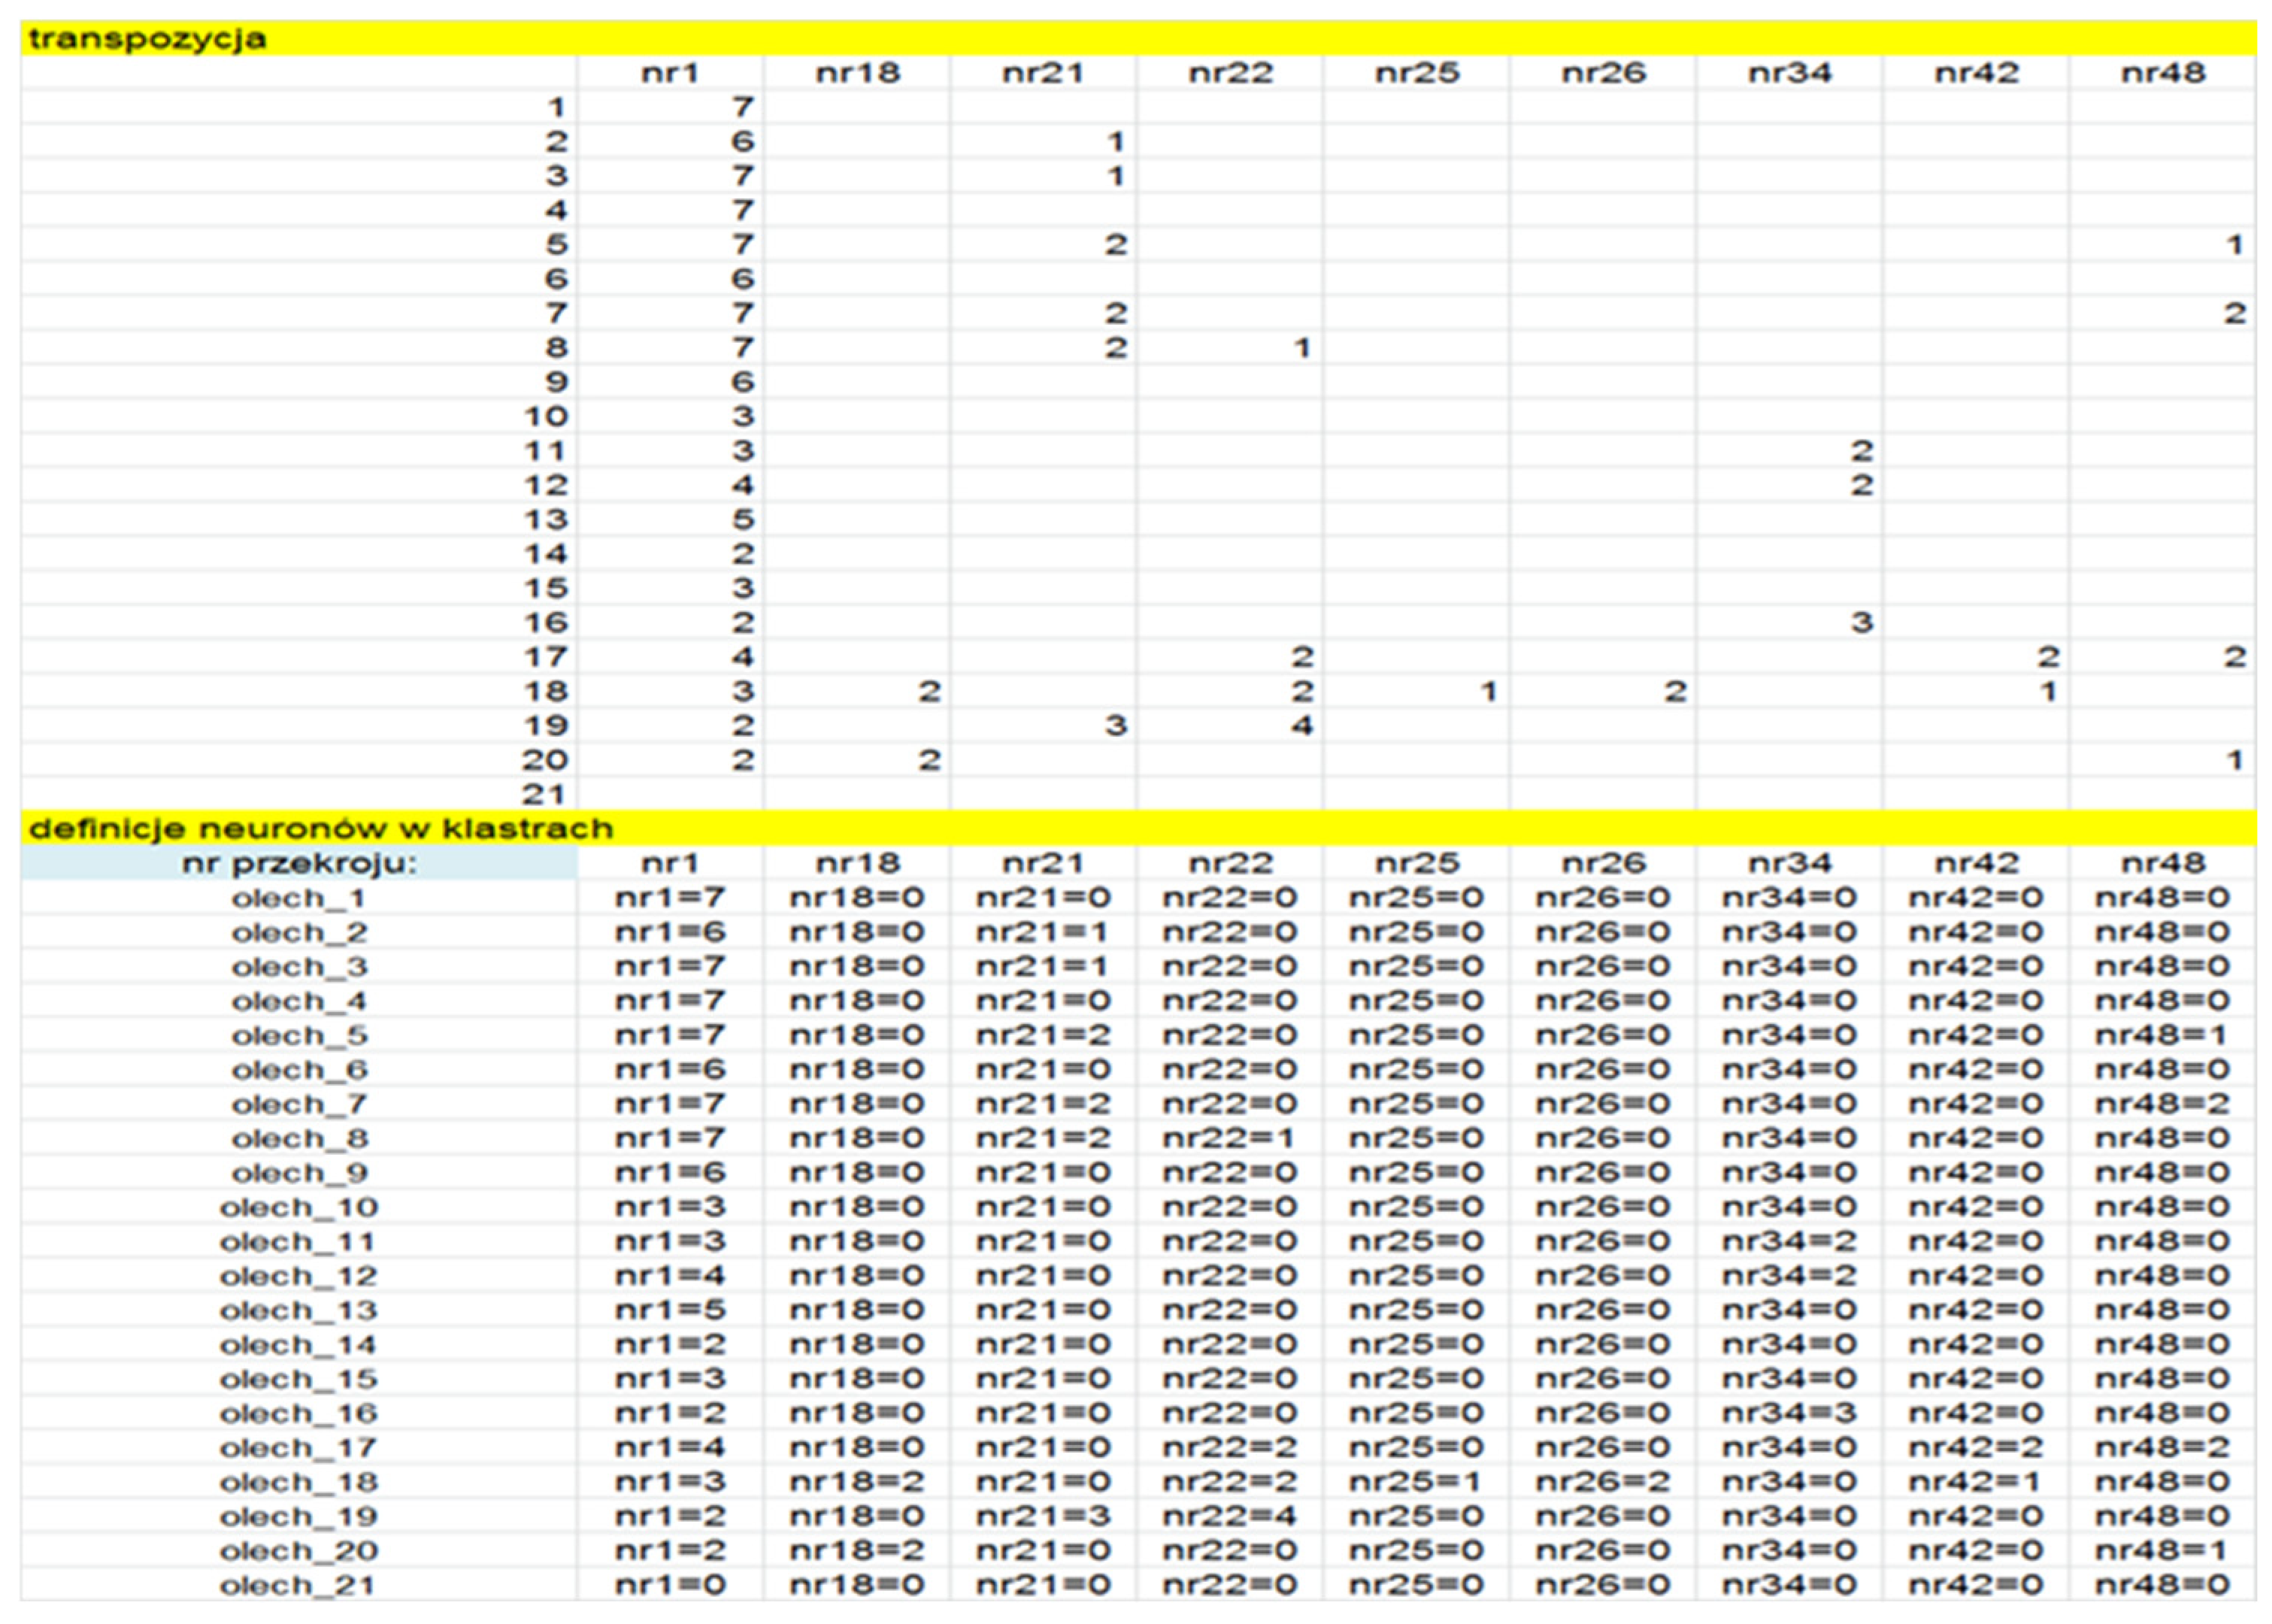
The transposition shown in
Figure 2 allows us to save data from the RHS sheet according to the IAC network logic. Those rows, in which the first column contains numbers from 1 to 21 (in the first part of the table) contain descriptions of the next twenty-one river cross-sections. In the last 21 rows, the cross-sections have automatically assigned names of neurons in the format olech_numer for the Olechówka river.
An exemplary name of a neuron of the type “nr1 = 7” (as it is, for example, in the row olech_1, in the second column (in
Figure 3) is an alphanumeric variable operated by the IAC database and corresponds to the entry “7” in the first row of the transposition of the original RHS sheet record. We interpret this name as follows: “macrophyte no. 1–occurs in the number recorded as 7”.
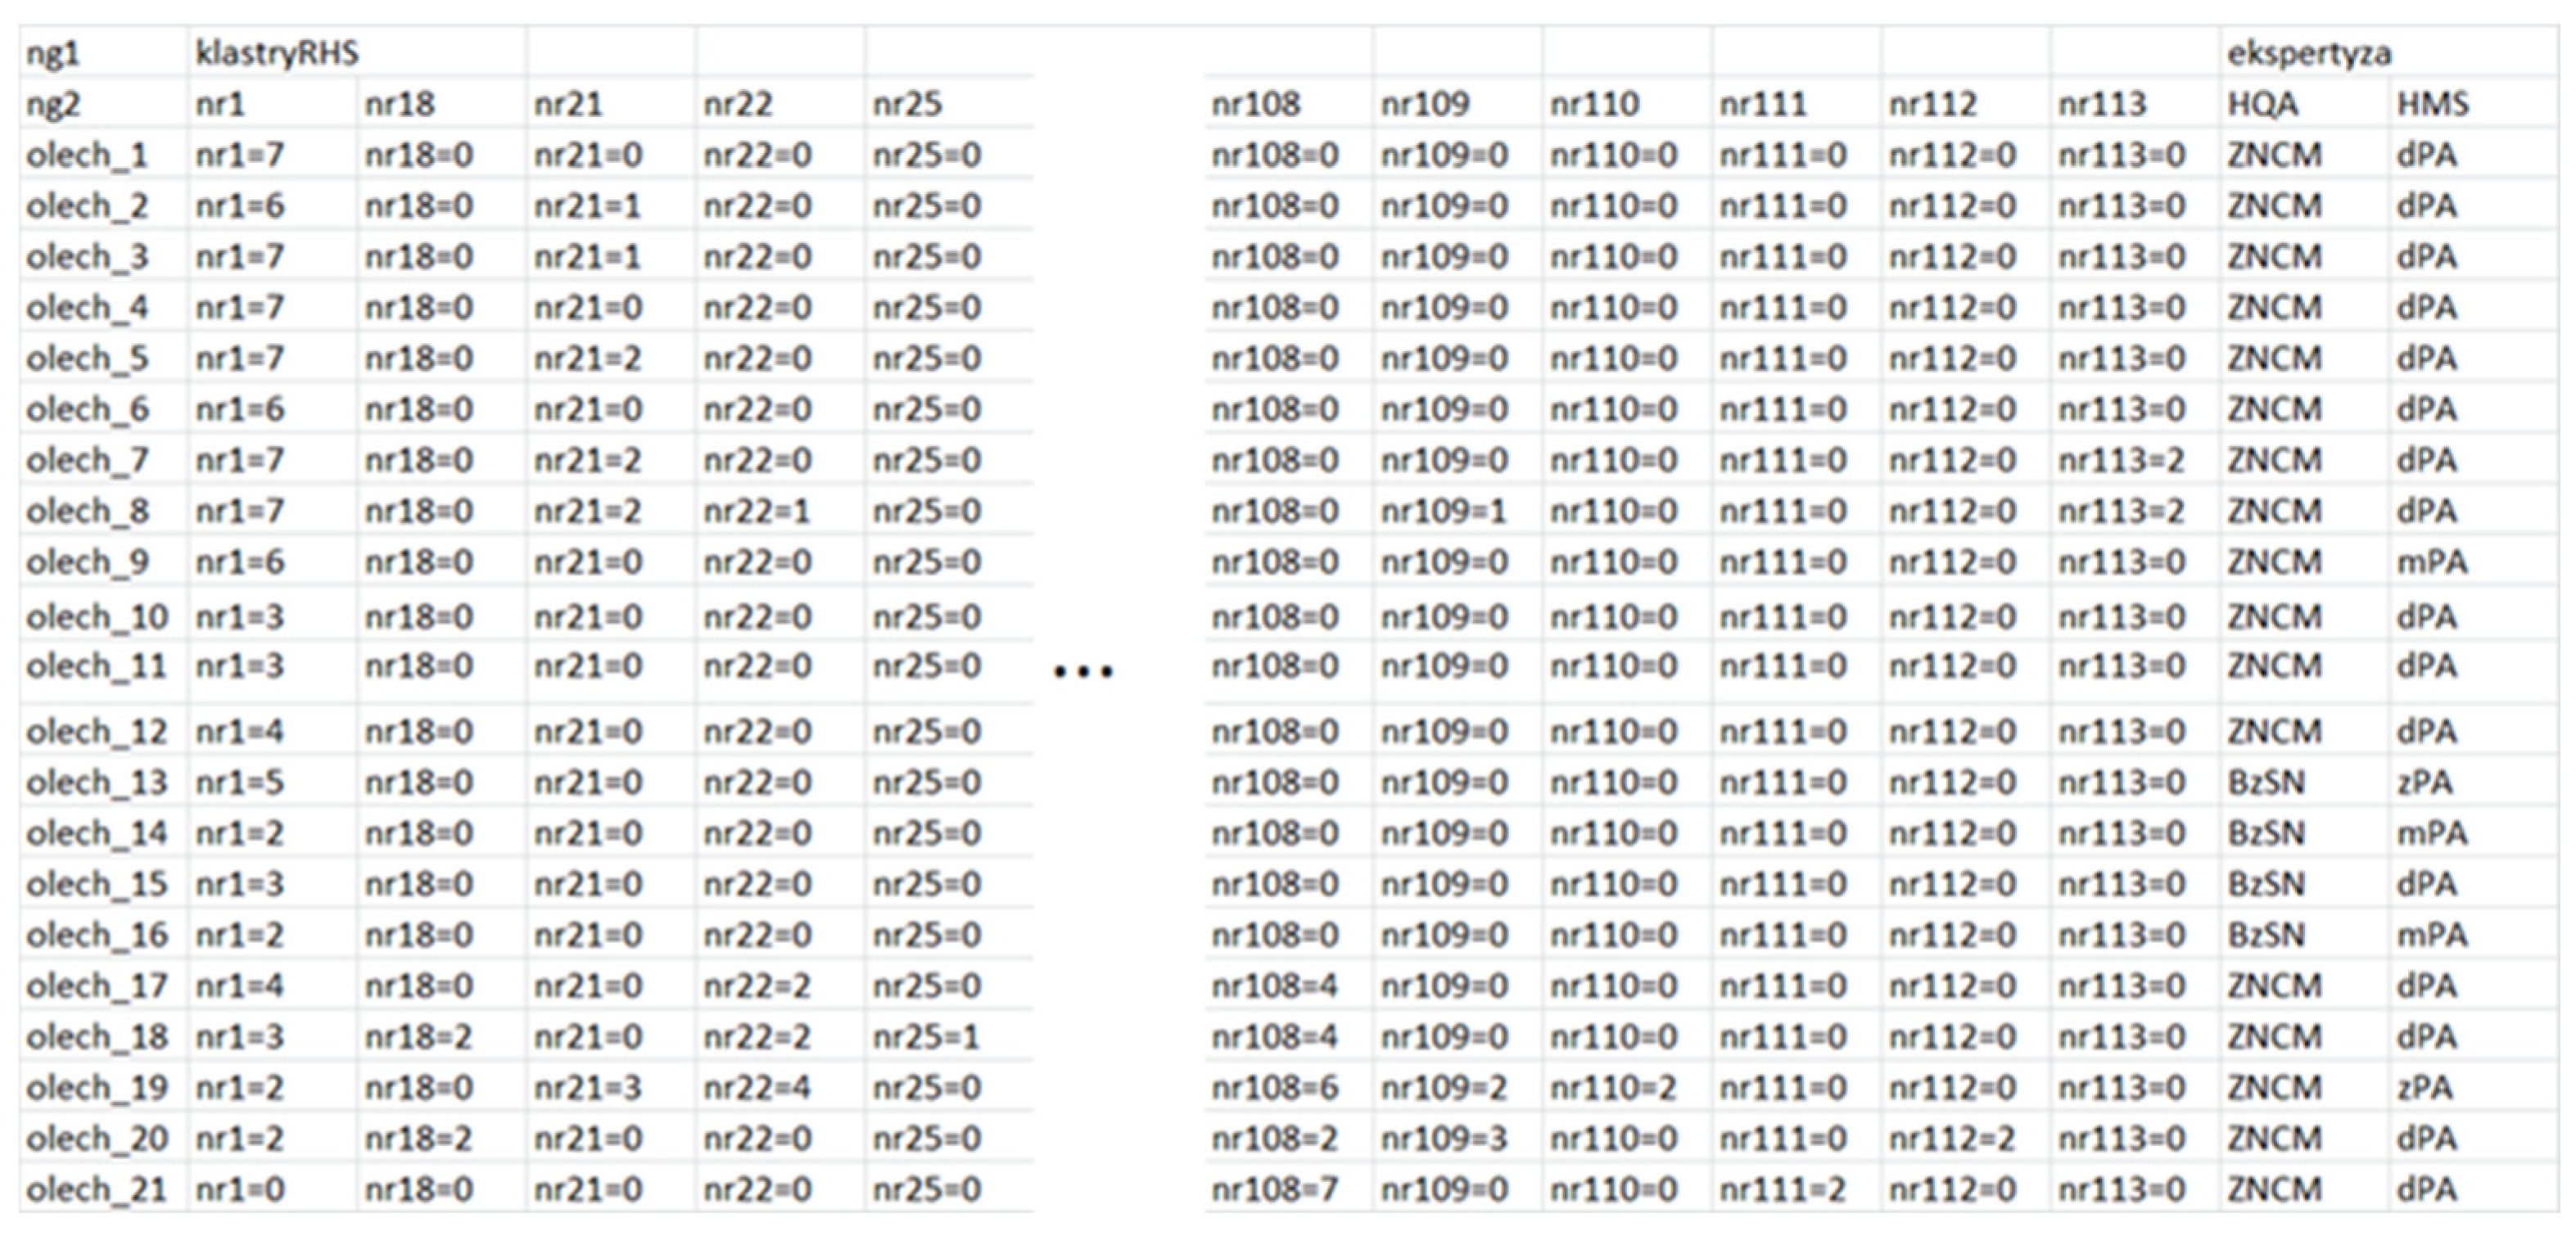
The final result of the transformations presented in
Figure 4, i.e., the input file for the IAC neural network “spanned” over the database, which is a fragment of the RHS sheet, looks as shown below (
Figure 4).
The entries in the first and second rows of the first column are the keywords of the IAC program: heading no. 1 and heading no. 2. The first heading contains two keywords: “RHS clusters” and “expert opinion”, the second heading lists the names of the clusters. In this case, these are the numbers of the observed macrophytes.
To illustrate the property of the IAC network that allows searching by context, we assign an external impulse equal to 1.0 to all neurons that correspond to the known properties of the searched object. Known properties here are the “context” describing the searched object. In this example, all neurons corresponding to the first section of the Jasień river (“jasien_1”) were excited.
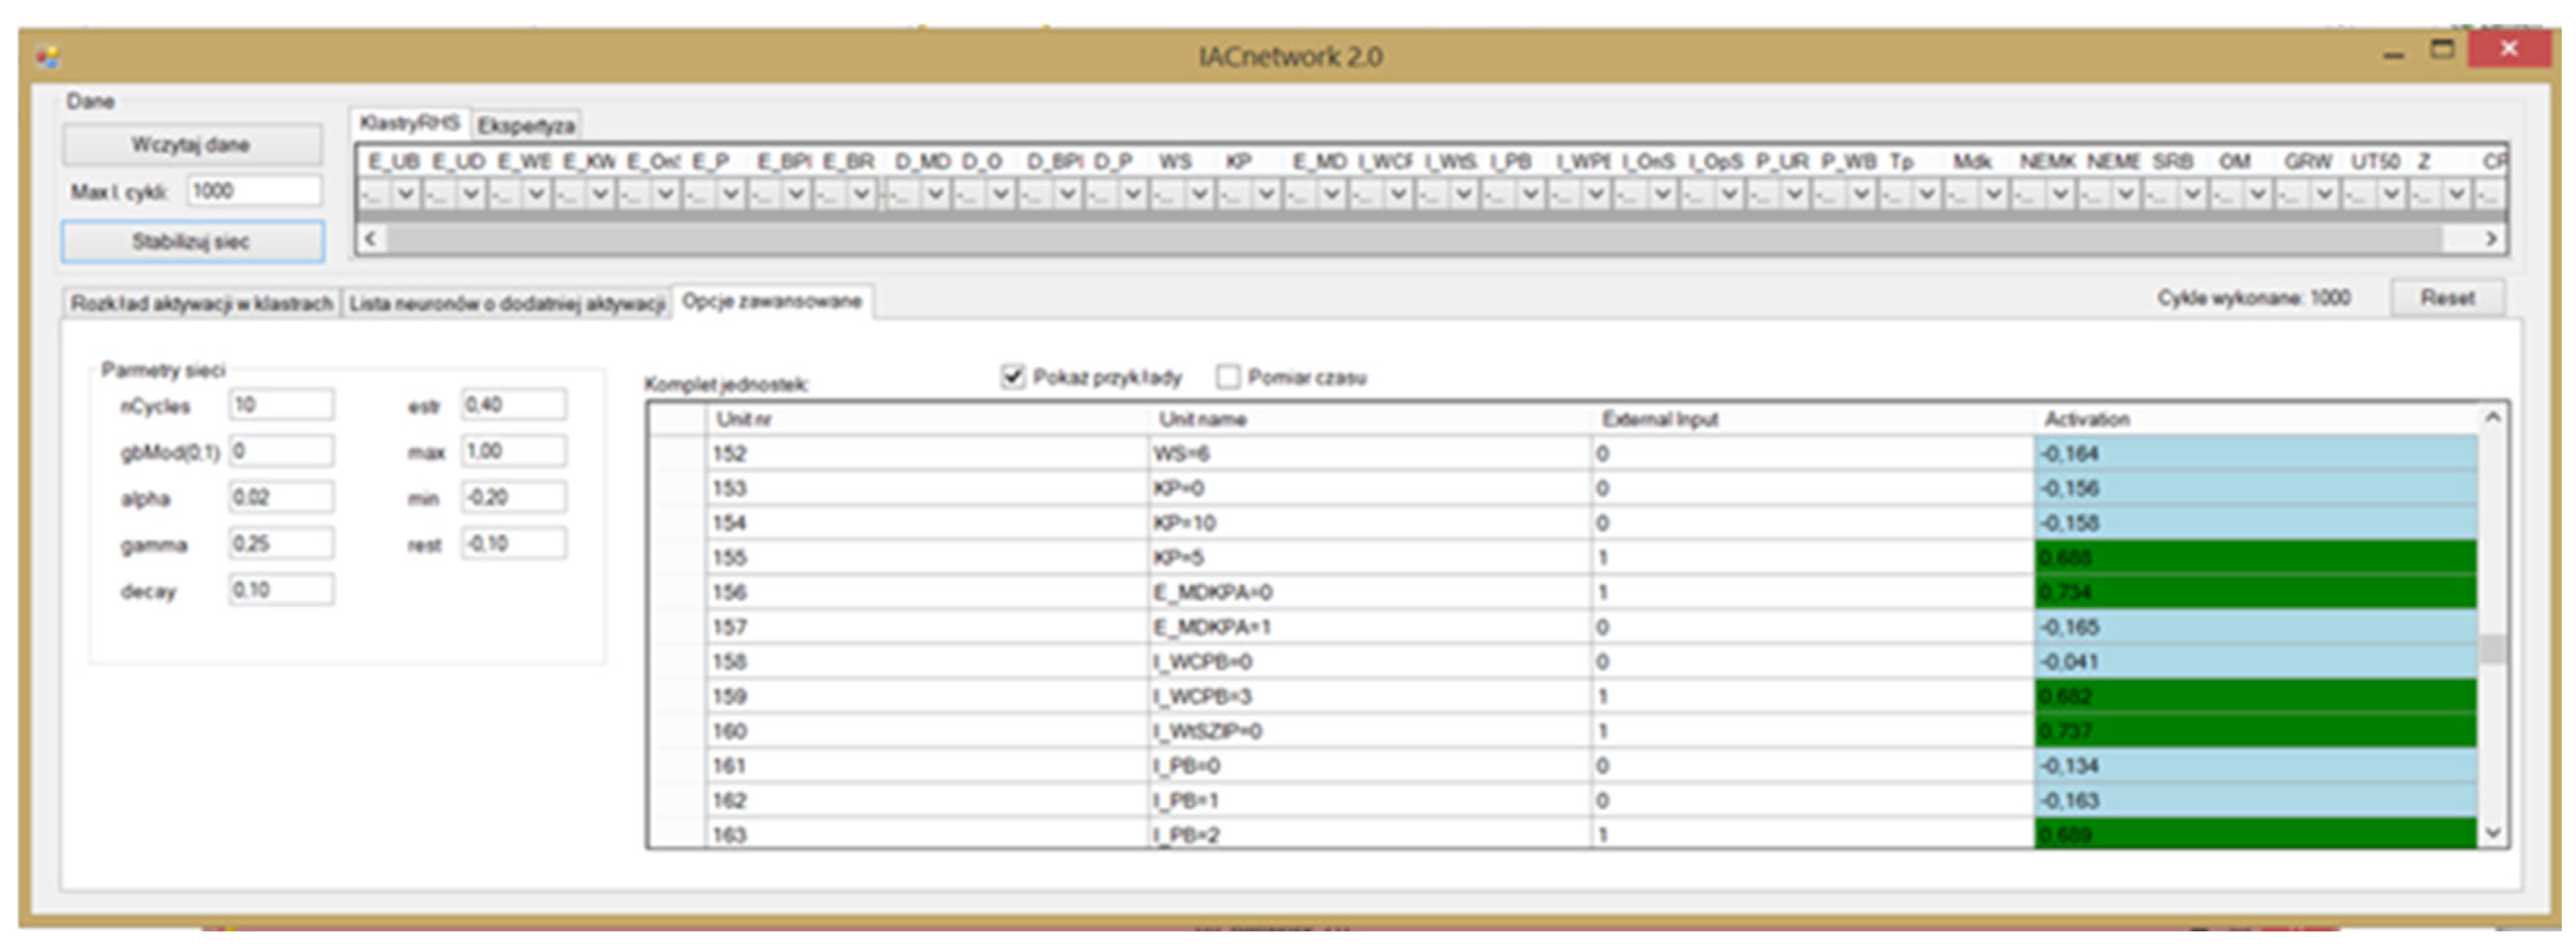
Figure 5 shows both the selected neurons that were excited with an external impulse = 1 (these are the properties of the jasien_1 section), as well as the network response in which the activation of the excited neuron is less than 1, but still always “winning” in the appropriate cluster. These are, of course, only some of the activated neurons. For the remaining neurons, the activation values are similar.
Figure 5 show that the Jasień_1 section is indicated correctly (activation 0.421 is the highest in the label cluster). The contrast of the indication is not high, hence the conclusion that other river sections are “similar”. It should be noted that no external impulse was applied to this neuron. Its activation comes entirely from excitations transmitted by the neurons to which it is connected.
Rivers of a different nature are indicated less strongly. This can be seen in
Figure 6, where the activations of river_x sections are on average three times smaller than the activations of qualitatively similar Jasień and Olechówka. For all cases for which the described numerical test was performed with the same network operating parameters, the results were numerically similar and qualitatively the same. The mechanism of mutual activation operating between clusters and competition in clusters causes that after stabilization of the activation levels of nodes, the searched object-the river section-shows increased activation in the label cluster. However, in addition to this, other neurons are also activated, which may correspond to this description to the extent to which their activations have an advantage over the others. This information allows us to understand how specific the situation that is described as the search context is. An important property of the IAC network is assigning a probable value if it is missing from part of the data. From the point of view of the applications of the IAC network as an expert program, this is the most important property of this network if the missing data is an expert assessment. The purpose of building an expert program is to obtain a tool that can reliably suggest the correct expert assessment to the user automatically. In this example, in addition to the lines with the correct expert assessments entered by the user (these will be HQA and HMS values), a line was added to the description in which the neurons from the expert assessment clusters will not have any positive synaptic connections defined (we do not know what the expert opinion is). This will be a section with the symbol Olech_021. Then, we will assign a label to the neuron representing this particular object (Olech_021) in the cluster—An external impulse increasing its activation, equal to 1.0. Observing the activation mechanism between clusters and competition in clusters, we notice that in the second cycle of the network, those neurons in the label cluster were excited, to which a signal increasing their activity reached from the property clusters. Of course-in the property clusters, only neurons with the properties of the Olech_021 section were activated. These neurons in turn activated their respective attribute values in the expertise clusters. In this way, if only similar examples appeared in the network, the unknown expert opinion value associated with the newly entered episode Olech_021 was filled in. If there were no examples similar to the episode Olech_021 in the network, none of the neurons in the expertise clusters would have been excited.
4. Summary and Conclusions
The description of urban rivers in accordance with the unified RHS (River Habitat Survey) standard is a task that has been systematically undertaken by numerous research institutions. It is particularly important in the case of urban rivers that require restoration and renaturation. This article presents an example of such a description for the Jasień and Olechówka rivers, implemented in the form of an IAC (Interactive Activation and Competition) neural network structure, applied over a database formatted accordingly.
Adding further rivers to the database constructed in this “pseudo-intelligent” format results in an increase in the number of neurons, proportional to the number of additional cross-sections. The size of the database is defined by the RHS standard, and the amount of information required is the price paid for achieving completeness of the environmental description. In this context, it is worth noting that convolutional and recurrent neural networks have been effectively applied in predicting river stages in highly urbanized catchments, as demonstrated by Chiacchiera [
12], where the models successfully predicted short-term fluctuations under complex urban hydrological conditions.
A numerical experiment conducted in this study confirms that the direct application of the IAC network to a problem generating a very large number of neurons is feasible and does not lead to significant qualitative issues. A similar approach has been adopted in modeling real-time hydraulics in urban drainage networks. For example, ref. [
13] proposed a graph neural network-based surrogate model that meets the requirements for real-time prediction and hydraulic consistency, demonstrating the scalability and efficiency of neural models in complex urban systems.
This study demonstrates that combining the standardized River Habitat Survey (RHS) with the Interactive Activation and Competition (IAC) neural network provides an innovative framework for assessing urban river conditions. The approach allows both qualitative and quantitative evaluation of anthropogenic modifications and can be easily adapted for larger datasets.
By incorporating future climate and land use change scenarios, the method could guide practical restoration and management strategies aimed at improving river resilience.
The results highlight that anthropogenic pressures—especially urbanization—are the dominant drivers of hydromorphological degradation in Łódź’s river network. However, understanding their interaction with climatic factors is essential for effective mitigation.
Ultimately, the combined RHS–IAC methodology offers a promising decision-support tool for urban planners and water managers, helping to better protect, restore, and monitor small urban rivers under growing anthropogenic and climatic stress.
