Abstract
Based on the three-dimensional Grain-Based Model, the influence of the micro-strength and micro-modulus of the intragranular structures on the mechanical behavior of the model was explored from the point of force chains. The force chain characteristic of the sample is quantified, and then the force chain characteristics of the samples were quantitatively analyzed to reveal the evolution mechanism of the overall mechanical parameters and fracture characteristics of the samples when the micro-parameters of the intragranular contact changed. It is found that with the increase in contact micro-strength, bonding can withstand a higher level of concentrated stress. In the loading process, the slippage between particles occurs, but the overall slippage distance decreases due to the decrease in the number of fracture bonds, which leads to an increase in the strength and deformation resistance of the sample. With the increase in the contact micro-modulus, the allowable distance of particle slippage decreases. The lower force chain can make the slippage distance of particles reach the threshold value, and the external load easily causes the generation of cracks. Therefore, the overall strength of the sample decreases, and the overall deformation of the sample decreases. The research results can provide some references for the construction of the heterogeneity model, quantitative analysis of the force chain network, and calibration of model micro-parameters.
1. Introduction
As one of the most common rock types, granite is widely distributed in various underground engineering projects [,,], serving as a primary component of surrounding rock that ensures engineering safety [,]. Granite is a typical crystalline hard rock composed of diverse mineral grains [,]. Its overall mechanical properties are influenced by the micro-properties of these mineral structures [,]. Therefore, investigating the effects of micro-mechanical parameters of mineral structures on the macroscopic mechanical behavior of granite is of significant importance.
To date, numerous scholars have conducted relevant laboratory tests to study granite properties. In terms of test types, these include uniaxial compression tests [], triaxial compression tests [], cyclic loading–unloading tests [], creep tests [], Brazilian splitting tests [], three-point bending tests [], and dynamic impact tests [,]. Regarding research content, studies encompass stress–strain curves [,], mesoscopic fracture behavior [], macroscopic fracture models [], deformation characteristics [,], and acoustic emission characteristics []. Testing methodologies involve acoustic emission monitoring [], X-ray diffraction [], scanning electron microscopy [], polarizing microscopy, high-resolution computed tomography [,], digital image processing, nuclear magnetic resonance [], and high-speed photography []. While these studies have yielded valuable insights into the mechanical properties of granite, they have failed to capture underlying microscopic mechanisms or address the influence of mineral structural mechanical parameters on granite’s mechanical behavior.
With the continuous advancement of computer technology, numerical simulation has progressively become a powerful tool for investigating the mechanical properties of rock materials [,]. Alongside improvements in modeling techniques, various models have been applied in rock mechanics research []. Among these, homogeneous models were developed earlier and widely adopted []. While such models offer advantages including low modeling complexity and computational efficiency, they exhibit significant limitations: all contacts within the model are calibrated with identical micro-parameters, failing to represent the structural heterogeneity inherent in rocks like granite []. To address this, scholars have recently developed the Grain-Based Model (GBM) based on the Particle Flow Code (PFC-GBM) []. In this model, a cluster of basic units forms an aggregate representing an individual mineral grain. Different mineral types are then calibrated with distinct micro-parameters, thereby accurately reproducing the structural heterogeneity of granite []. Currently, two-dimensional (2D) GBMs have been extensively employed to study mineral-scale fracture behavior in rock materials []. However, two-dimensional models possess inherent limitations in characterizing the mechanical behavior of real three-dimensional rock structures. Nevertheless, due to increased modeling complexity, three-dimensional (3D) GBMs remain relatively underutilized. Within 3D GBMs, intragranular contacts constitute a significant proportion, rendering their micro-parameters highly influential on the overall mechanical behavior of simulated specimens. Furthermore, the construction and loading simulation of 3D heterogeneous models demand considerable computational time. Consequently, investigating the impact of mineral structural mechanical parameters on macroscopic behavior is crucial. The resulting conclusions can provide valuable references for calibrating model micro-parameters, thus enhancing simulation efficiency.
In PFC, a force chain is generated between any two adjacent basic units and acts upon the contact bond between them []. When the magnitude of the force chain exceeds the micro-strength of the bond, the bond fractures, subsequently initiating a micro-crack that leads to macroscopic failure behavior []. Thus, force chains represent critical intrinsic information during rock loading, reflecting the stress distribution state within specimens [,]. While numerous scholars have conducted simulation studies related to force chains [], quantitative analysis of 3D force chains remains scarce, and the influence of micro-mechanical parameters of mineral structures on granite’s mechanical properties has yet to be revealed from the perspective of force chains.
In summary, this study reconstructs the heterogeneous structure of granite using an advanced 3D Grain-Based Model (GBM), achieving geometric delineation and mechanical differentiation of mineral grains. A hierarchical classification and quantitative analysis of the internal force chain network are implemented. Subsequently, the effects of micro-strength and micro-modulus of intragranular contacts on the overall mechanical behavior of the model are investigated, with the evolution of the force chain network precisely characterized. The conclusions provide valuable references for constructing heterogeneous models, quantitatively analyzing force chain networks, and calibrating model micro-parameters.
2. Investigation Methodology
2.1. Real Granite Characterization and Numerical Specimen Construction
The granite material utilized in this study was obtained from Suizhou City, Hubei Province, with its mineral composition comprising feldspars (55.7%), quartz (30.7%), biotite (7.7%), and other minerals (1.9%) by volume []. Additionally, randomly distributed cementitious minerals exhibiting lower strength and smaller particle size occupy 4.0% of the total volume [].
Figure 1 illustrates the model construction procedure: First, an initial particle model is generated where particles represent mineral grains, as illustrated in Figure 1a. Subsequently, all particles are converted into block units, as illustrated in Figure 1b, followed by classification of block units into groups distinguished by color-coded mineral types, as illustrated in Figure 1c. These grouped block units are then transformed into hollow geometric units, as illustrated in Figure 1d. A secondary particle model comprising Particle Flow Code (PFC) basic units is constructed, wherein particles form mineral grains within geometric boundaries defined by hollow units and undergo group assignment, as illustrated in Figure 1e. Next, 4.0% of basic units are designated as fine-grained minerals, as illustrated in Figure 1f. Upon completion of the group assignment for all units, as illustrated in Figure 1g, the specimen model is finalized. Finally, a hierarchical contact classification system is established based on mineral categories, as illustrated in Figure 1h, including primary contacts (all contacts), secondary contacts (intragranular and intergranular contacts), and tertiary contacts (intragranular: feldspar–feldspar, quartz–quartz, biotite–biotite, other mineral–other mineral, fine-grained mineral–fine-grained mineral; intergranular: homogeneous and heterogeneous mineral contacts).
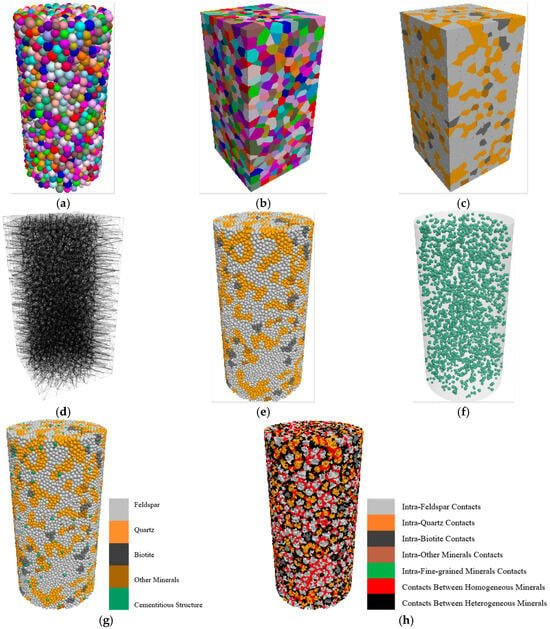
Figure 1.
Modeling process of model: (a) initial particle-based model; (b) assembly of block units; (c) grouping of block units; (d) assembly of hollow geometry units; (e) grouping of mineral grains; (f) fine-grained minerals; (g) completed numerical specimen; (h) classification of contact types.
In this Grain-Based Model (GBM), the shape of mineral particles is determined by the generated block units and geometric elements. This method ensures that the final mineral grains exhibit an irregular polygonal morphology at the macroscale instead of simple spheres, thereby better approximating the complex shapes of natural minerals. During the model generation process, particles are brought into a close packing state through an iterative process, and the porosity is set. This guarantees that the model has a reasonable initial packing density and macroscopic mechanical response.
The trial-and-error procedure was employed to calibrate micro-parameters in this model. The calibrated micro-parameters are presented in Table 1 and Table 2. To improve the validity of this paper, laboratory test and numerical simulation results of natural granite are described in Figure 2, illustrating the reliability of the model from two aspects: load–displacement curves and macroscopic fracture modes []. Figure 2 presents the experimental and numerical uniaxial compression results of intact samples, encompassing stress–strain responses and macroscopic failure characteristics []. As illustrated in Figure 2a, the simulated curve successfully mimics the elastic deformation, nonlinear deformation, and post-peak descending stages observed in the experimental curve. It is clear that the experimental uniaxial compressive strength and the elastic modulus values of the intact specimen are roughly comparable between the experimental and numerical data. As shown in Figure 2b, the post-failure structure of the actual specimen is obtained via CT scanning, while the simulated specimen’s post-failure structure is displayed by the fragment distribution. Both specimens undergo distinct shear failure: a macroscopic shear band traverses the specimen from left to right, marked by red wireframes.

Table 1.
Micro-parameters of particles and intragranular contacts [].

Table 2.
Micro-parameters of intergranular contacts [].
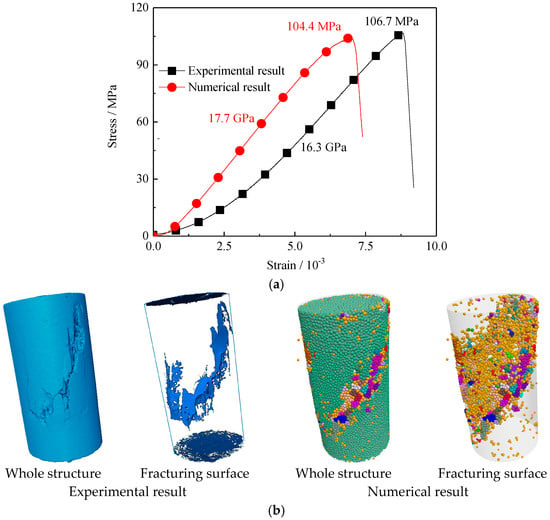
Figure 2.
Comparison of experimental and numerical results for granite sample under uniaxial compression: (a) stress–strain curve; (b) failure mode [].
2.2. Variation in Intragranular Contact Micro-Parameters
This simulation investigates the influence of intragranular contact micro-strength and micro-modulus on the overall mechanical behavior of the model. Relative to baseline values in Table 1, the micro-strength and -modulus of all mineral types in the simulated specimen were systematically varied across scaling factors T of 0.2, 0.5, 1.0, 2.0, and 5.0, with specific parameter sets detailed in Table 3 and Table 4. Throughout these variations, the ratio of bond strength to tensile strength remained constant at 2.0.

Table 3.
Values of micro-tensile strength of intragranular contact.

Table 4.
Values of micro-modulus of intragranular contact.
Figure 3 presents distribution nephograms of micro-tensile strength and micro-modulus values for the simulated specimen contacts, visually demonstrating that as T progressively increases, the overall coloration of the nephograms transitions from blue to yellow–red, indicating a systematic enhancement in contact strength and modulus values throughout the specimen.
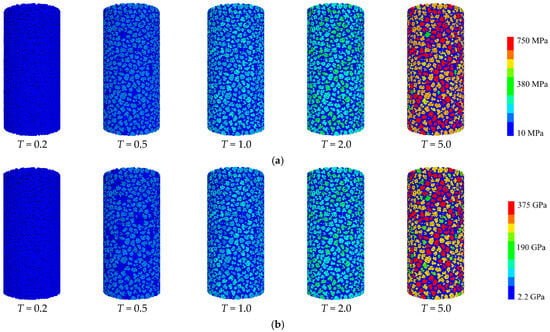
Figure 3.
Distribution of micro-parameter values for the contacts of the numerical sample: (a) micro-tensile strength; (b) micro-modulus.
2.3. Force Chain Network Definition
Within PFC simulations, force chains represent the most critical micro-mechanistic information, with Figure 4 illustrating their definition and significance.
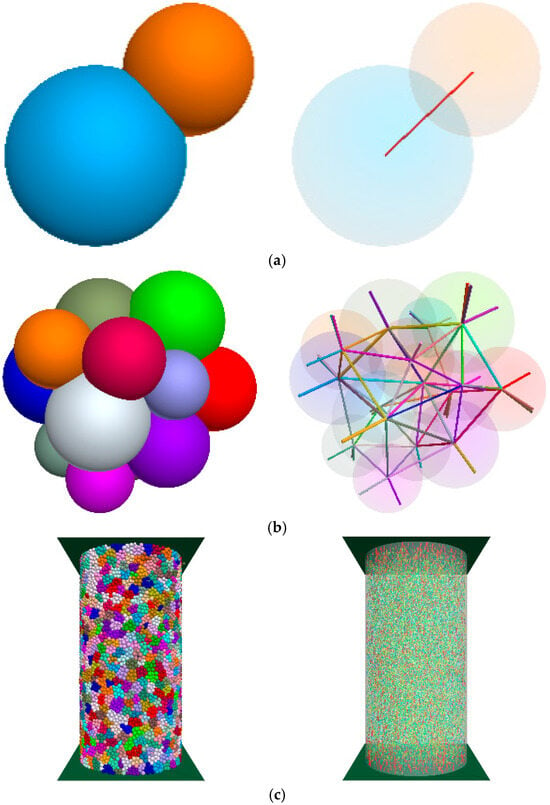
Figure 4.
The definition and significance of force chain network: (a) microscale: two adjacent basic units; (b) mesoscale: particle cluster; (c) macroscale: whole numerical specimen [].
At the microscale, as illustrated in Figure 4a, a force chain forms between two adjacent basic units, where bond fracture and subsequent micro-crack initiation occur when the force chain magnitude exceeds the contact bond’s micro-strength, with the force chain orientation aligning with the centroidal axis of the units. At the mesoscale, as illustrated in Figure 4b, loading on a particle cluster generates a relatively complete internal force chain network whose configuration governs the cluster’s fracture behavior. At the macroscale, as shown in Figure 4c, specimen loading develops a comprehensive force chain network dictating both mesoscopic and macroscopic failure mechanisms [].
This study employs 3D rose diagrams to visualize force chain orientations. As shown in Figure 5a, the orientation vector Oi of any force chain in 3D space is defined by its Cartesian components xi, yi, and zi. Custom algorithms statistically process these components across all force chains to determine orientations. Represented as unit vectors, as shown in Figure 5b, all orientation vectors terminate on a unit sphere centered at the coordinate origin, with axes aligned to the specimen’s global coordinates. The resulting rose diagram, as shown in Figure 5c, displays force chain orientations where column height and color intensity quantitatively reflect force chain density per orientation bin, maintaining consistent coordinate alignment across all diagrams [].
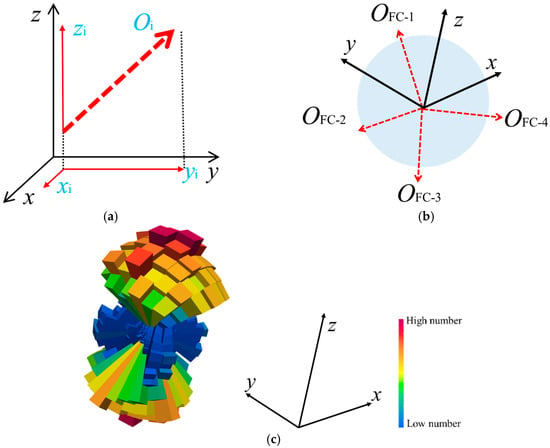
Figure 5.
Quantitative analysis of the orientation distribution of force chains: (a) unit vector and components; (b) unit sphere centered at origin; (c) 3D rose diagram [].
For quantitative force chain analysis, this study enables statistical evaluation of all force chain magnitudes. The average magnitude of general force chains at peak stress during uniaxial compression simulation is calculated as 84.67 N. Force chains exceeding this threshold are subsequently identified and defined as high-strength force chains (HF).
Regarding hierarchical classification, the force chains within the model are categorized according to contact types, establishing a multi-tiered system—primary force chains (all force chains), secondary force chains (intragranular and intergranular force chains), and tertiary force chains (intragranular: feldspar–feldspar, quartz–quartz, biotite–biotite, other mineral–other mineral, fine-grained mineral–fine-grained mineral; intergranular: homogeneous mineral and heterogeneous mineral force chains)—as shown in Figure 6.
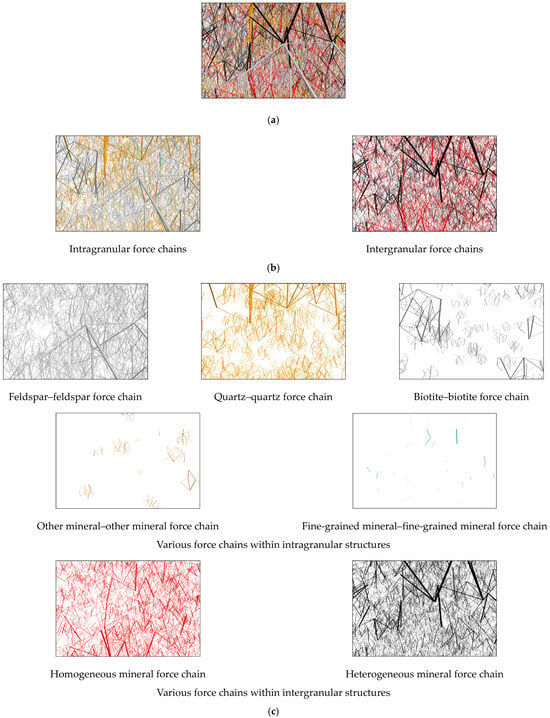
Figure 6.
Multilevel division of force chain networks: (a) primary force chains: all force chains; (b) secondary force chains; (c) tertiary force chains.
3. Macroscopic Mechanical Behavior
3.1. Stress–Strain Curves
Figure 7 presents the stress–strain curves of specimens with varying intragranular contact micro-tensile strengths. All curves exhibit consistent evolutionary trends, characterized by three distinct stages: elastic stage, damage stage, and post-peak stage. With increasing scaling factor T, the peak stress demonstrates significant enhancement, accompanied by a pronounced rise in the slope of the elastic deformation stage. Hence, the micro-strength of intragranular contacts exhibits a positive correlation with the specimen’s overall bearing capacity and deformation resistance.
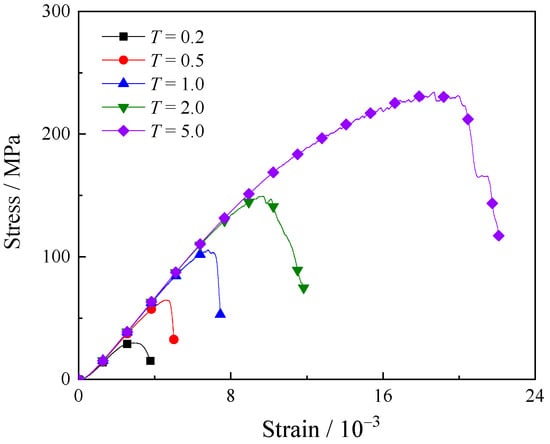
Figure 7.
The stress–strain curves of samples with different micro-tensile strengths of intragranular contacts.
Figure 8 displays the stress–strain curves of specimens with varying intragranular contact micro-moduli. All curves follow consistent evolutionary patterns, delineated into elastic, damage, and post-peak stages. With increasing scaling factor T, the peak stress demonstrates a significant reduction, while the slope of the elastic deformation stage exhibits moderate enhancement. This reveals a negative correlation between intragranular contact micro-modulus and the specimen’s overall bearing capacity, but a positive correlation with its deformation resistance.
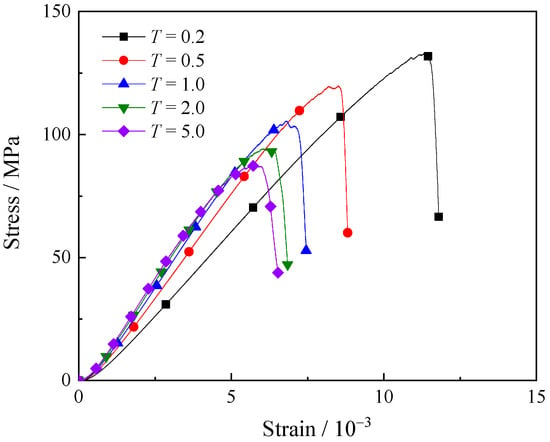
Figure 8.
The stress–strain curves of samples with different micro-moduli of intragranular contacts.
3.2. Mechanical Parameters
As illustrated in Figure 9, the compressive strength and elastic modulus of specimens exhibit distinct evolutionary trends with increasing intragranular contact micro-tensile strength. As scaling factor T rises from 0.2 to 5.0, compressive strength demonstrates substantial growth from 29.7 MPa to 234.2 MPa. Concurrently, the elastic modulus rapidly increases from 14.3 GPa to 18.1 GPa before transitioning to a gradual rise, ultimately stabilizing at 18.3 GPa.
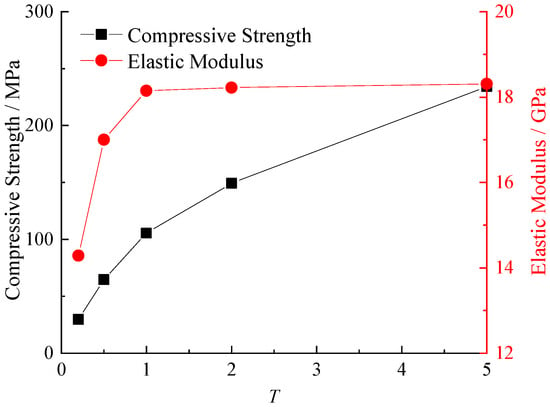
Figure 9.
The variation in mechanical parameters of samples with different micro-tensile strengths of intragranular contacts.
Figure 10 depicts the evolution of compressive strength and elastic modulus in specimens with varying intragranular contact micro-moduli. As scaling factor T increases from 0.2 to 5.0, compressive strength demonstrates a significant decline from 133.0 MPa to 87.5 MPa, while the elastic modulus rapidly rises from 13.5 GPa to 18.1 GPa before transitioning to a gradual increase, ultimately stabilizing at 19.3 GPa.
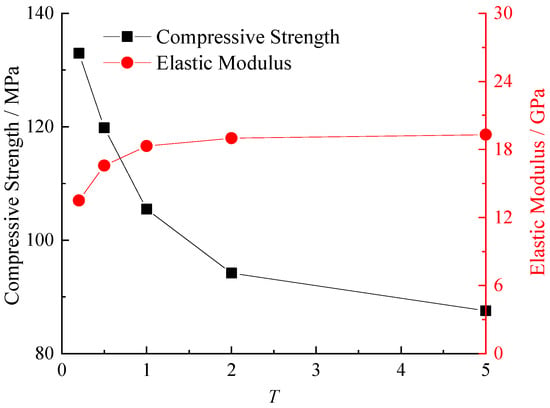
Figure 10.
The variation in mechanical parameters of samples with different micro-moduli of intragranular contacts.
3.3. Fracture Behavior
Figure 11 presents the final fracture distribution nephograms for specimens with varying intragranular contact micro-tensile strengths, where red and black denote intragranular and intergranular cracks, respectively. Visually, the overall nephogram coloration transitions from red to black with increasing scaling factor T, indicating that lower intragranular contact strength promotes intragranular fracturing. As contact strength rises, intragranular cracks decrease progressively while intergranular cracks increase substantially. Figure 12 quantitatively corroborates this trend: when T increases from 0.2 to 5.0, intragranular cracks decline from 18,263 to 747, whereas intergranular cracks surge from 282 to 74,935.

Figure 11.
The crack distribution of samples with different micro-tensile strengths of intragranular contacts.
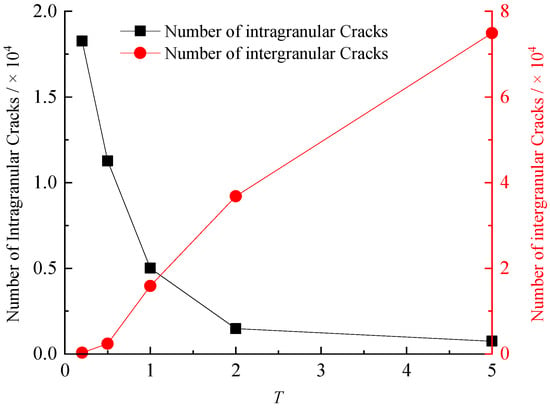
Figure 12.
The crack number of samples with different micro-tensile strengths of intragranular contacts.
Figure 13 displays fracture nephograms under varying intragranular contact micro-moduli. The dominant coloration shifts from black to red with increasing T, revealing that lower micro-moduli suppress intragranular cracking. Conversely, rising micro-moduli progressively intensify intragranular fracture. Quantitative data in Figure 14 confirm this mechanism: as T escalates from 0.2 to 5.0, intragranular cracks increase from 520 to 11,091, while intergranular cracks decrease from 34,394 to 13,500.
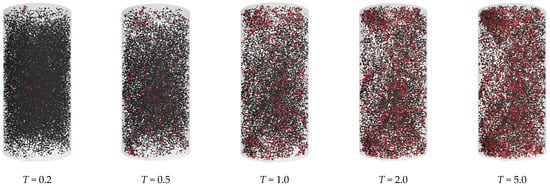
Figure 13.
The crack distribution of samples with different micro-moduli of intragranular contacts.
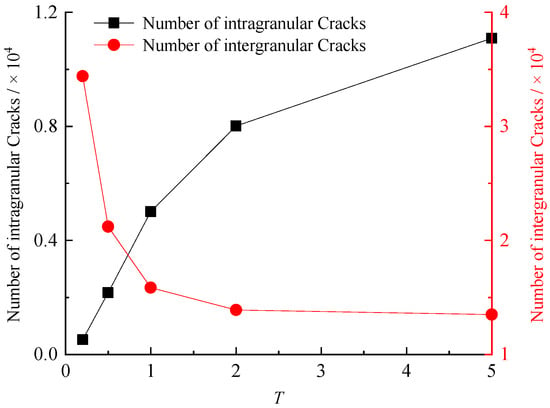
Figure 14.
The crack number of samples with different micro-moduli of intragranular contacts.
4. Force Chain Network Characteristics at Peak Load
4.1. Effect of Micro-Strength
Figure 15 displays high-strength force chain rose diagrams for specimens with varying intragranular contact micro-tensile strengths at peak load, where increasing scaling factor T visibly expands the diagram volume and induces a chromatic shift from blue to yellow–red, signifying substantial growth in HF density.
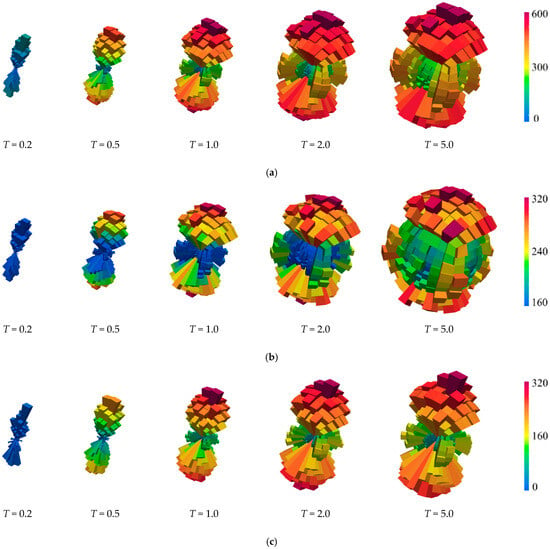
Figure 15.
The crack number of samples with different micro-moduli of intragranular contacts: (a) whole structure; (b) intragranular structure; (c) intergranular structure.
Quantitative analysis of intragranular and intergranular force chains evaluates three metrics: number of granular force chains, sum of granular force chains, and average granular force chains. As depicted in Figure 16, when T increases from 0.2 to 5.0, the intragranular number of granular force chains rises from 10.63 × 10⁴ to 10.83 × 10⁴, an increase of 1.85%, while the intergranular number of granular force chains declines from 12.11 × 10⁴ to 9.72 × 10⁴, a decrease of 19.76%. The intragranular sum of granular force chains surges from 3.00 × 10⁶ N to 27.30 × 10⁶ N, an increase of 808.78%, whereas the intergranular sum of granular force chains increases from 2.06 × 10⁶ N to 14.62 × 10⁶ N, an increase of 608.85%. Meanwhile, the intragranular average granular force chains rise from 28.26 N to 252.15 N, an increase of 792.25%, and the intergranular average granular force chains increase from 17.03 N to 150.43 N, an increase of 783.44%.
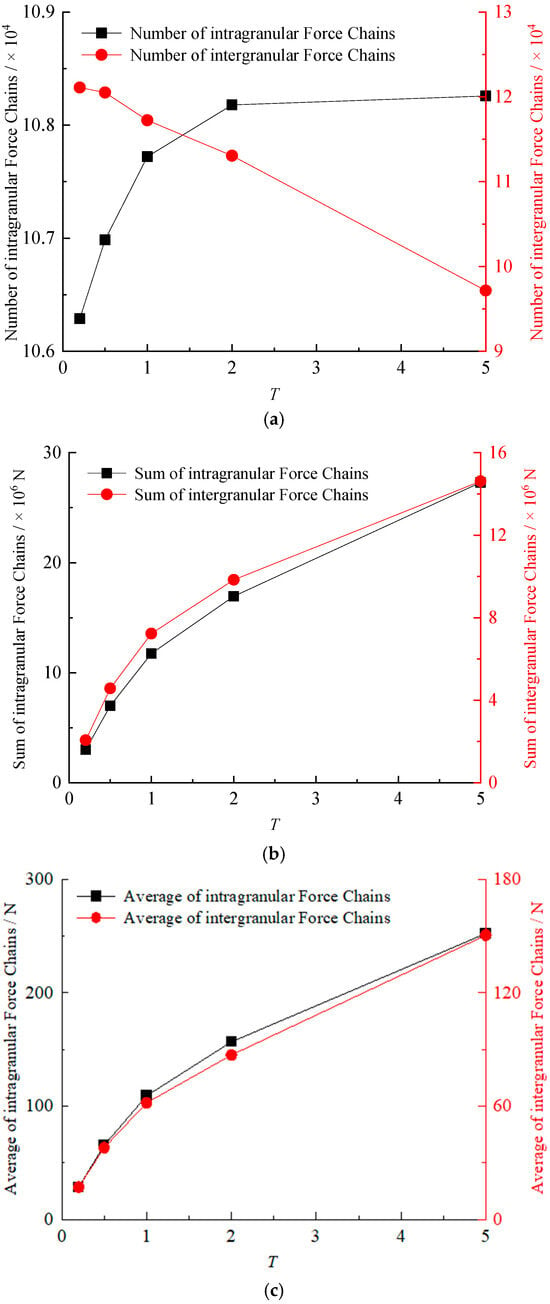
Figure 16.
The variation in characteristic values of force chains with different micro-tensile strengths of intragranular contacts: (a) number; (b) sum; (c) average.
4.2. Effect of Micro-Modulus
Figure 17 presents high-strength force chain rose diagrams at peak load for specimens with varying intragranular contact micro-moduli, where increasing scaling factor T visibly reduces diagram volume, indicating declining HF density.
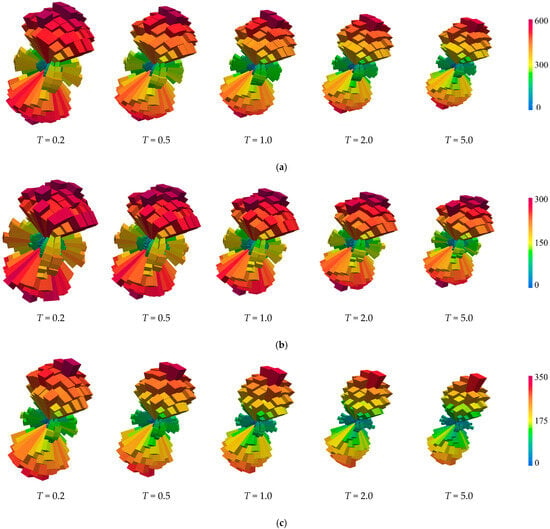
Figure 17.
The orientation distribution of force chains with different micro-moduli of intragranular contacts: (a) whole structure; (b) intragranular structure; (c) intergranular structure.
Quantitative analysis of intragranular and intergranular force chains evaluates the number of granular force chains, the sum of granular force chains, and the average granular force chains. As shown in Figure 18, when T rises from 0.2 to 5.0, the intragranular number of granular force chains decreases from 10.82 × 10⁴ to 10.71 × 10⁴, a decrease of 1.07%, while the intergranular number of granular force chains increases from 11.39 × 10⁴ to 11.81 × 10⁴, an increase of 3.68%; the intragranular sum of granular force chains declines from 13.49 × 10⁶ N to 9.97 × 10⁶ N, a decrease of 26.12%, whereas the intergranular sum of granular force chains drops from 9.04 × 10⁶ N to 6.14 × 10⁶ N, a decrease of 32.13%. The intragranular average granular force chains reduce from 124.62 N to 93.06 N, a decrease of 25.33%, and the intergranular average granular force chains fall from 79.42 N to 51.99 N, a decrease of 34.54%. This analysis confirms that force chain evolution strongly correlates with specimen strength but remains independent of elastic modulus.
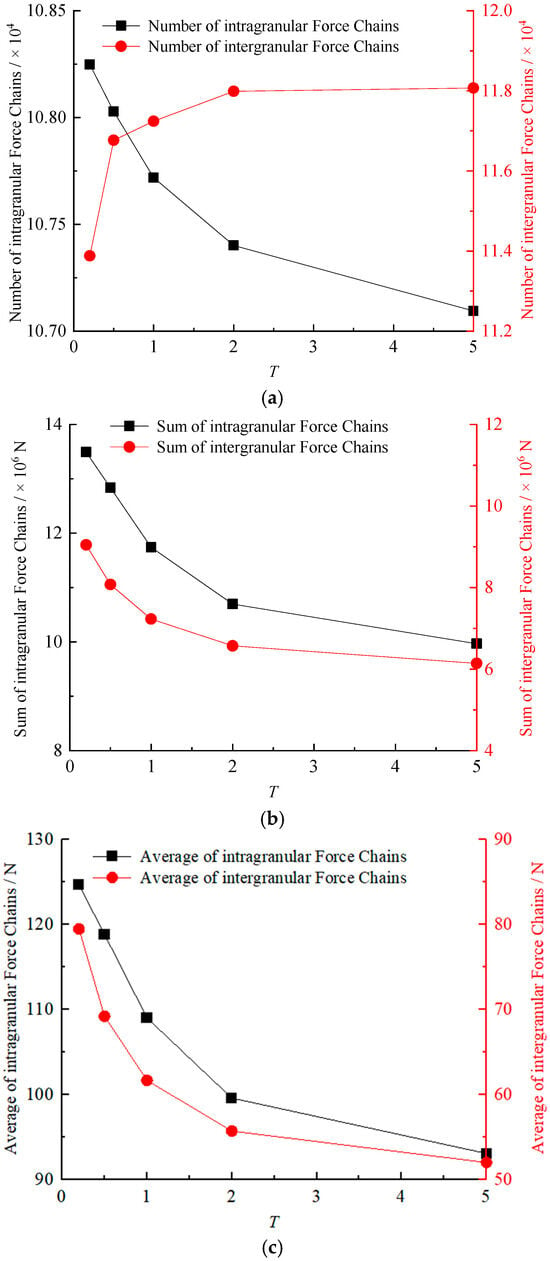
Figure 18.
The variation in characteristic values of force chains with different micro-moduli of intragranular contacts: (a) number; (b) sum; (c) average.
5. Discussion
Figure 19 illustrates the evolution of force chain networks within identical local regions of specimens under varying contact micro-strengths. Significantly, increasing scaling factor T induces a marked proliferation of red high-strength force chains, signifying enhanced overall force chain intensity. This occurs because elevated contact micro-strength raises the critical stress threshold required for bond fracture between particles, which is intragranular, showing increased red HF density. Consequently, bonds sustain higher concentrated stress levels, directly enhancing specimen strength as corroborated in Figure 20. Under external loading, particle slippage occurs, but the aggregate slippage distance progressively decreases due to reduced bond fracture incidence. This mechanism ultimately augments deformation resistance. Therefore, contact micro-strength exhibits positive correlations with both compressive strength and elastic modulus.
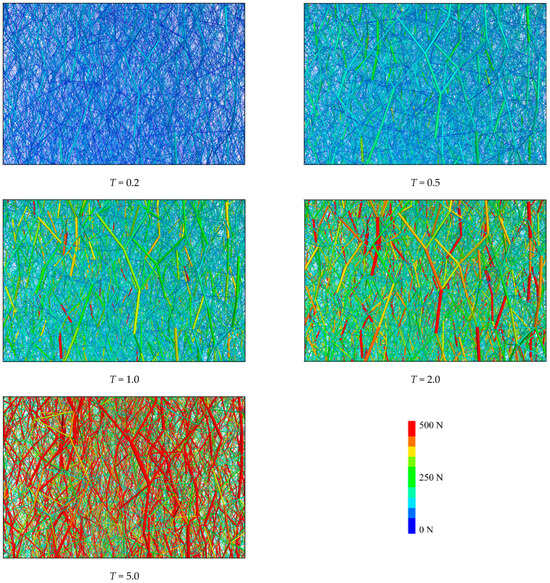
Figure 19.
Evolution of local force chains with different contact micro-strengths.
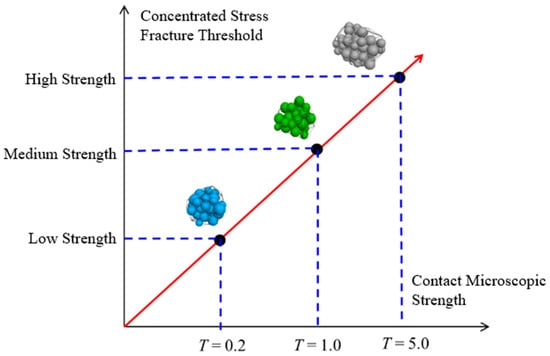
Figure 20.
The micro-strength of contacts affects the fracture threshold of the concentrated stress.
Figure 21 depicts force chain network evolution within identical local regions under varying contact micro-moduli. Notably, increasing scaling factor T causes a marked reduction in red high-strength force chains, indicating diminished overall force chain intensity. This phenomenon arises because lower contact micro-moduli permit greater macroscopic deformation during loading. At the microscale, the allowable particle slippage distance for micro-crack initiation is larger. Consequently, higher-level force chains are required to reach the slippage threshold, thereby enhancing strength and reducing intragranular cracks as evidenced in Figure 22. With rising micro-moduli, lower-level force chains readily induce slippage distances to reach the threshold (reducing red HF density). Under these conditions, external loading more readily triggers intragranular crack initiation. Therefore, the overall specimen strength decreases while total deformation reduces.
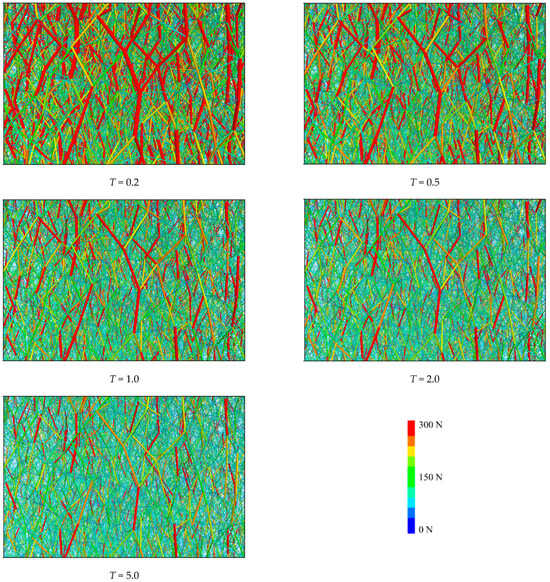
Figure 21.
Evolution of local force chains with different contact micro-moduli.
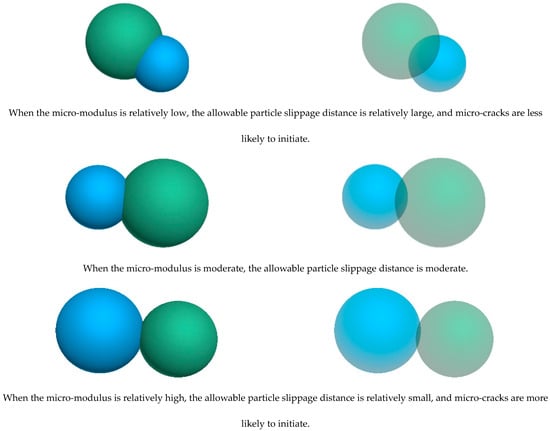
Figure 22.
The micro-modulus of contacts affects the allowable dislocation distance of particles.
The basic criterion in the PFC model—that “force chains fracture when exceeding the bond strength”—corresponds physically to the maximum tensile stress criterion in classical fracture mechanics. Previous studies have confirmed that the strength parameters of interparticle bonds directly determine the fracture behavior of materials [,]. Meanwhile, the transgranular and intergranular fractures observed in the model are direct consequences of localized stress intensity differences induced by different minerals with varying strengths and moduli. Mineral particles with higher strengths and lower moduli tend to undergo transgranular fracture, whereas grain boundaries with lower strengths preferentially experience intergranular fracture, which is fully consistent with the basic principles of composite fracture mechanics.
6. Conclusions
To investigate the influence of intragranular contact micro-strength and micro-modulus on the macroscopic mechanical behavior of granite, this study reconstructed the heterogeneous structure of granite using an advanced 3D Grain-Based Model (GBM), realizing geometric delineation and mechanical differentiation of mineral grains. Hierarchical classification and quantitative analysis of the internal force chain network were conducted, and the effects of intragranular contact micro-parameters on the model’s mechanical behavior were systematically explored, with precise characterization of force chain network evolution. The main conclusions are as follows:
- (1)
- The stress–strain curves of specimens with different intragranular contact micro-strengths (tensile and shear) and micro-moduli exhibit consistent evolutionary trends, which can all be divided into three stages: elastic stage, damage development stage, and post-peak stage.
- (2)
- An increase in intragranular contact strength increases both the total magnitude and average intensity of intragranular and intergranular force chains, while an increase in contact modulus reduces these two metrics. This confirms that the evolution of force chains is strongly correlated with the specimen’s strength but shows no significant correlation with the elastic modulus.
- (3)
- Enhanced contact micro-strength enables the bonds to withstand higher concentrated stress. During the loading process, particle slippage occurs; however, the reduced occurrence of bond fractures leads to a shorter total slippage distance of aggregates. This ultimately enhances the specimen’s strength and resistance to deformation.
- (4)
- Increased contact micro-modulus reduces the allowable particle slippage distance, which causes even low-intensity force chains to reach the slippage threshold. Under external loading, this easily triggers the initiation of intragranular cracks, thereby reducing the overall strength and total deformation capacity of the specimen.
Author Contributions
Conceptualization: T.Z.; methodology: T.Z.; validation: J.B.; formal analysis: J.B. and H.S.; investigation: W.L.; resources: T.Z. and W.L.; data curation: J.B. and H.S.; writing—original draft: T.Z.; writing—review and editing: W.L.; visualization: X.Y. and L.Z.; supervision: X.Y. and L.Z.; project administration: X.Y.; funding acquisition: T.Z., W.L. and J.B. All authors have read and agreed to the published version of the manuscript.
Funding
The research presented in this paper was carried out under the financial support of the State Key Laboratory of Intelligent Construction and Healthy Operation and Maintenance of Deep Underground Engineering (SDGZK2407), the Basic Research Program of Xu Zhou (KC23045), the National Natural Science Foundation of China (Grant Nos. U24B2040, 52409148, and 52204113), the Natural Science Foundation of Jiangsu Province (BK20241644 and BK20243050), and the Open Research Fund of Key Laboratory of Geomechanics and Geotechnical Engineering Safety, Chinese Academy of Sciences (SKLGGES-024027).
Data Availability Statement
The data that support the findings of this study are available from the corresponding author upon reasonable request.
Conflicts of Interest
The authors declare that there are no conflicts of interest regarding the publication of this paper.
References
- Zhai, M.G.; Zhang, Q.; Chen, G.N. Adventure on the research of continental evolution and related granite geochemistry. Chin. Sci. Bull. 2016, 61, 31–37. [Google Scholar] [CrossRef]
- Wang, L.; Cui, Z.; Peng, R. Numerical simulations on the structural heterogeneity and fracture bias effect of three-point bending specimen. Int. J. Numer. Anal. Methods Geomech. 2024, 132, 104466. [Google Scholar] [CrossRef]
- Xia, Y.L.; Xu, D.P.; Qiu, S.L.; Liu, X.Y. Experimental Study on Mechanical Properties of Deeply Buried Granite During Layered Excavation of Large Underground Caverns. Rock Mech. Rock. Eng. 2023, 56, 4757–4778. [Google Scholar] [CrossRef]
- Bao, X.; Huang, S.; Lv, Y. Thermal Influence on Damage Behavior and Constitutive Response of Granite under Variable Cyclic Loading. Geotech. Geol. Eng. 2023, 43, 355. [Google Scholar] [CrossRef]
- Meng, X.X.; Yang, Q.S.; Song, Y. Study on the True Triaxial Compression Mechanical Behavior of Fissured Granite and its Micro-Fracture Mechanism Based on the Grain-Based Model. Theor. Appl. Fract. Mech. 2025, 139, 105051. [Google Scholar] [CrossRef]
- Chen, Y.L.; Wang, S.R.; Ni, J. An experimental study of the mechanical properties of granite after high temperature exposure based on mineral characteristics. Eng. Geol. 2017, 220, 234–242. [Google Scholar] [CrossRef]
- An, R.; Kong, L.W.; Zhang, X.W.; Li, C.S. Effects of dry-wet cycles on three-dimensional pore structure and permeability characteristics of granite residual soil using X-ray micro computed tomography. J. Rock Mech. Geotech. Eng. 2022, 14, 851–860. [Google Scholar] [CrossRef]
- Tian, W.L.; Yang, S.Q.; Huang, Y.H.; Hu, B. Mechanical behavior of granite with different grain sizes after high-temperature treatment by particle flow simulation. Rock Mech. Rock Eng. 2019, 53, 1791–1807. [Google Scholar] [CrossRef]
- Ma, X.; Dong, W.B.; Hu, D.W. Mechanical properties of granite at high temperature subjected to true triaxial compression. Int. J. Rock Mech. Min. Sci. 2023, 164, 105313. [Google Scholar] [CrossRef]
- Zhang, X.J.; Zhao, J.; Jing, M.F. Creep failure mechanism and model of granite under true triaxial loading and unloading conditions. Int. J. Geomech. 2024, 24, 06024015. [Google Scholar] [CrossRef]
- Zhang, C.Y.; Chen, M.J. An anisotropic weighted Voronoi method for mesostructure reconstruction in rock materials and its application to Brazilian test simulations. Comput. Part. Mech. 2025, 14, 851–860. [Google Scholar] [CrossRef]
- Han, X.; Chen, Y.; Hu, X. Granite strength and toughness from small notched three–point–bend specimens of geometry dissimilarity. Eng. Fract. Mech. 2019, 216, 106482. [Google Scholar] [CrossRef]
- Wu, G.; Liu, K.; Hu, W.R. Quantification of dynamic damage and breakage in granite under confined indentation. Int. J. Rock Mech. Min. Sci. 2021, 144, 104763. [Google Scholar] [CrossRef]
- Su, H.; Qin, X.; Feng, Y. Experimental investigation of mixed mode I–II fracture property of thermally treated granite under dynamic loading. Theor. Appl. Fract. Mech. 2022, 118, 103267. [Google Scholar] [CrossRef]
- Zhou, J.; Lan, H.; Zhang, L. Novel grain-based model for simulation of brittle failure of Alxa porphyritic granite. Eng. Geol. 2019, 251, 100–114. [Google Scholar] [CrossRef]
- Han, Y.; Zhang, D.; Zhou, Z. Pre-failure deformation response and dilatancy damage characteristics of Beishan granite under different stress paths. Processes 2025, 13, 1892. [Google Scholar] [CrossRef]
- Liu, W.; Yao, Y.; Kang, Y. Uncovering the damage mechanism of different prefabricated joint inclinations in deeply buried granite: Monitoring the damage process by acoustic emission and assessing the micro-evolution by X-ray CT. Sensors 2025, 25, 3332. [Google Scholar] [CrossRef] [PubMed]
- Tichá, I.; Kučerová, L. Scanning electron microscopy as a useful tool for the analysis of non-conductive materials. Mater. Sci. Eng. 2021, 1161, 012005. [Google Scholar] [CrossRef]
- Ikeda, S.; Nakano, T.; Tsuchiyama, A. Nondestructive three-dimensional element-concentration mapping of a Cs-doped partially molten granite by X-ray computed tomography using synchrotron radiation. Am. Mineral. 2015, 89, 1304–1313. [Google Scholar] [CrossRef]
- Xi, Y.; Xing, J.; Wang, H. Evaluation of pore characteristics evolution and damage mechanism of granite under thermal-cooling cycle based on nuclear magnetic resonance technology. Geoenergy Sci. Eng. 2024, 241, 213101. [Google Scholar] [CrossRef]
- Yang, X.; Wu, B.; Zhang, Z. A study of fracture toughness of granite under impact load using three-dimensional reconstruction and high-speed photography techniques. Arab. J. Geosci. 2020, 13, 1227. [Google Scholar] [CrossRef]
- Li, X.; Zou, Y.; Zhou, Z. Numerical simulation of the rock SHPB test with a special shape striker based on the discrete element method. Rock Mech. Rock. Eng. 2014, 47, 1693–1709. [Google Scholar] [CrossRef]
- Zhou, L.; Zhu, Z.; Dong, Y. Investigation of dynamic fracture properties of multi-crack tunnel samples under impact loads. Theor. Appl. Fract. Mech. 2020, 109, 102733. [Google Scholar] [CrossRef]
- Peng, J.; Wong, L.N.Y.; Teh, C.I. Effects of grain size-to-particle size ratio on micro-cracking behavior using a bonded-particle grain-based model. Int. J. Rock Mech. Min. Sci. 2017, 100, 207–217. [Google Scholar]
- Zheng, Z.; Li, S.; Zhang, Q. True triaxial test and DEM simulation of rock mechanical behaviors, meso-cracking mechanism and precursor subject to underground excavation disturbance. Eng. Geol. 2024, 337, 107567. [Google Scholar] [CrossRef]
- Wei, J.; Wang, S.; Song, S. Experiment and numerical simulation of overburden and surface damage law in shallow coal seam mining under the gully. Bull. Eng. Geol. Environ. 2022, 81, 207. [Google Scholar] [CrossRef]
- Yang, K.; Hu, Q.; Zhao, H. Towards boundary conditions in concrete-rock joint shearing with STAs profile by PFC2D. Comput. Geotech. 2023, 162, 105616. [Google Scholar] [CrossRef]
- Zhang, T.; Yu, L.; Ma, L. An numerical investigation of the three dimensional multi-level force chain network of the sample with a single fissure under uniaxial compression. Theor. Appl. Fract. Mech. 2024, 130, 104345. [Google Scholar] [CrossRef]
- Zhang, T.; Yu, L.; Su, H. Investigation on the grain size effect of the compression characteristics of granites based on the multi-level force chain network. Chin. J. Rock Mech. Eng. 2023, 42, 1988–2003. (In Chinese) [Google Scholar] [CrossRef]
- Zhang, T.; Yu, L.; Wei, J. Stress evolution in rocks around tunnel under uniaxial loading: Insights from PFC3D-GBM modelling and force chain analysis. Theor. Appl. Fract. Mech. 2024, 134, 104728. [Google Scholar] [CrossRef]
- Li, X.F.; Li, X.; Li, H.B.; Zhang, Q.B.; Zhao, J. Dynamic tensile behaviours of heterogeneous rocks: The grain scale fracturing characteristics on strength and fragmentation. Int. J. Impact Eng. 2018, 118, 98–118. [Google Scholar] [CrossRef]
- Li, X.F.; Li, H.B.; Zhao, J. Transgranular fracturing of crystalline rocks and its influence on rock strengths: Insights from a grain-scale continuum–discontinuum approach. Comput. Methods Appl. Mech. Eng. 2021, 373, 113462. [Google Scholar] [CrossRef]
Disclaimer/Publisher’s Note: The statements, opinions and data contained in all publications are solely those of the individual author(s) and contributor(s) and not of MDPI and/or the editor(s). MDPI and/or the editor(s) disclaim responsibility for any injury to people or property resulting from any ideas, methods, instructions or products referred to in the content. |
© 2025 by the authors. Licensee MDPI, Basel, Switzerland. This article is an open access article distributed under the terms and conditions of the Creative Commons Attribution (CC BY) license (https://creativecommons.org/licenses/by/4.0/).