Abstract
Fault identification is vital for geological structure analysis and the optimization of oil–gas extraction. Deep neural networks, especially U-Net and its variants, are widely used for seismic fault interpretation. However, when applied to 3D seismic data volume, these models typically require substantial computation resources and memory consumption. For one reason, they do not take into consideration the obvious differences in characteristics of seismic data in space and time dimensions; therefore, they require a huge number of parameters to capture inherent information for seismic fault detection. This paper presents a lightweight 3D seismic fault interpretation network based on a spatial–temporal asymmetric convolution set (STA-Fault3D) to mitigate the aforementioned issue. STA-Fault3D uses the spatial–temporal asymmetric convolution set to construct a lightweight network and take into consideration seismic data dimension discrepancies. Multi-scale feature fusion operation and an enhanced-training workflow are adopted to improve the performance of the network on field data. Compared with the classic model, FaultSeg3D, it demonstrates improved performance on fault detection continuity with only 12.33% of the parameters and 18.57% of the computational quantity. Compared with the state-of-the-art (SOTA) lightweight network, Fault3DNnet, it reduces parameters by 10% and computational quantity by 4.2% for marginally improved detection results.
1. Introduction
Fault interpretation is fundamental to geological structural analysis in hydrocarbon exploration. Fault systems are key factors in controlling the formation and distribution of oil and gas reservoirs. The accurate identification of faults is critical in seismic data interpretation for effective exploration and production [,].
The manual interpretation of fault structures, usually time consuming and laborious, can be subjective and incomplete due to interpreters’ knowledge and excessive workload. In order to deal with the exponential growth of seismic data, researchers began to explore automatic fault identification methods. The early investigations mainly focused on geophysical attributes. Commonly used seismic attributes for fault identification and interpretation include coherence cube, colony and edge detection algorithms [,,,,]. Nevertheless, the performance of these methods is inherently constrained by the quality of the input seismic data. Noise contamination introduces systematic biases, thereby reducing their practical applications. In seismic volumes with strong noise, signal ambiguity significantly degrades the accuracy of fault interpretation.
In recent years, machine learning techniques, particularly those first developed in the field of computer vision, have been widely adopted for seismic data processing and interpretation [,,,,]. Fault interpretation is generally formulated under two main paradigms: as image classification or segmentation tasks. Xiong et al. [] and Zhao et al. [] formulated fault interpretation as an image classification problem in the context of computer vision. In their approach, 2D seismic slices were input into a CNN to determine whether the central pixel corresponds to a fault or not. These methods rely on pixel-wise classification using sliding overlapping windows, which requires substantial computational resources and GPU memory consumption. Furthermore, the use of 2D data limits the network’s capacity to capture the complete spatial information of seismic data, often leading to discontinuities in the predicted fault strike patterns.
On the other hand, U-Net and its variants have demonstrated excellent performance in end-to-end image segmentation tasks. Wu et al. [] proposed FaultSeg3D, which is a simplified U-Net architecture designed specifically for fault identification. Although trained on synthetic datasets, it still yielded favorable results when applied to field data. This approach addressed the challenge of limited labeled training data for 3D fault interpretation and demonstrated that deep neural networks can generalize effectively to field data even trained solely on synthetic samples. However, the original U-Net is designed for image processing, where there is no significant difference between the dimensions of the image. The simplified U-Net (FaultSeg3D) struggles to capture information effectively between different dimensions of seismic data, thus requiring a huge number of parameters and complex computations to achieve good performance. As a result, many researchers have explored the integration of additional modules to enhance the network’s performance. For instance, Zhou et al. [] proposed to enhance image resolution, thereby improving fault feature extraction from an image processing perspective. Gao et al. [] introduced a multi-scale attention mechanism into the U-Net to further strengthen its fault identification capabilities. Liu et al. [] developed Res-UNet for intelligent fault interpretation for common-azimuth seismic data.
While the integration of additional modules can enhance the segmentation capabilities and accuracy of the network, it often comes at the cost of increased computational complexity and memory usage. Meanwhile, researchers explored lightweight and efficient network architectures for segmentation tasks. In the domain of fault interpretation, Tang et al. [] proposed Fault3DNnet, a lightweight bidirectional decoding network, which achieved significant reductions in parameters and the number of floating-point operations (FLOPs). Moreover, this method produced results on field data with enhanced continuity for large fault structures and reduced noise. Yang et al. [] proposed a lightweight 3D fault detection network by introducing two modules: the global spatial convolution module (GSCM) and the semantic difference module (SDM). The network achieves improved fault continuity and structural integrity on field data while significantly reducing parameters and computational cost compared with U-Net.
Convolution block decomposition replaces high-dimensional convolution blocks with low-dimensional convolution groups, thereby significantly reducing the consumption of computational resources. It has emerged as an effective strategy to reduce the computation burden of neural networks and is increasingly attracting research attention. Guo et al. [] introduced a large kernel convolution method that decomposes a three-dimensional convolution block into two two-dimensional convolution blocks and a one-dimensional convolution block, and then they investigated the effectiveness of its components. However, their study did not elaborate on the underlying principles or detailed methodology of the decomposition process. Hou et al. [] proposed a convolution module tailored for high-resolution images, which enhances the upper limit of the convolution rank through dimensionality reduction and the decomposition of high-dimensional convolution blocks. Their work included an experimental analysis of various decomposition strategies with adjustments made to optimize the module for different image processing tasks.
The application of conventional 3D convolution blocks on fault detection networks presents two major limitations. First, the parameters of high-dimensional convolution increase exponentially compared with lower-dimensional alternatives, leading to significantly more complex computational operations. Second, while a unified high-dimension convolution kernel enables the extraction of multi-dimensional features with preserved spatial completeness, it fails to adequately account for the heterogeneous characteristics of geological information across distinct dimensions. Decomposition strategies offer a promising solution to these challenges. By replacing high-dimensional convolution operators with sets of low-dimensional convolution blocks, these methods achieve substantial reductions in parameter count, facilitating the development of lightweight network architectures with improved computational efficiency. Moreover, Dosovitskiy et al. [] revealed that the empirical receptive fields of convolution kernels are considerably smaller than their theoretical counterparts. This finding underscores the need for large kernels to capture broad spatial context information—an approach that, while effective, introduces considerable computational overhead. Conversely, overly small kernels compromise the completeness of hierarchical feature extraction due to limited receptive coverage. Convolution block decomposition addresses this trade-off by enabling the precise adjustment of kernel scales along specific dimensions, thereby achieving a balanced compromise between contextual integration and computational efficiency across heterogeneous geological structures.
In seismology, the unequal data characteristic across dimensions is particularly evident in high-dimensional geophysical data. For example, in earthquake seismology, the time dimension uniquely captures the full dynamic process of source rupture, the attenuation characteristics of seismic wave propagation, and site-specific response effects. Consequently, temporal data in seismic recordings often contain a higher density of relevant information compared with spatial dimensions. To effectively extract this rich contextual information, larger convolution receptive fields are typically required along the temporal axis [,]. However, general-purpose convolution decomposition methods tend to perform inconsistently on seismic data characterized by such uneven information distribution. Similarly, in exploration seismology, there are distinct differences in seismic data on temporal and spatial dimensions that should be taken into account for the design of fault detection neural networks.
In this study, building upon convolution block decomposition theory and the inherently uneven distribution of seismic information, we propose a spatial–temporal asymmetric convolution set for seismic feature extraction in fault detection tasks. This module forms the core of the STA-Fault3D network. As a variant of U-Net, the proposed architecture integrates multi-scale feature processing through convolution groups. Additionally, to further improve the network’s fault segmentation performance on field data, we introduce a training workflow designed to enhance prediction accuracy and robustness.
To summarize, the primary contributions of this paper are as follows:
- We propose a lightweight network architecture, STA-Fault3D, for seismic fault segmentation based on a spatial–temporal asymmetric convolution set. This convolution set can adapt to the unequal information distribution in different dimensions of seismic data. Therefore, it can predict improved fault detection results with reduced network capacity and computation;
- Multi-scale feature fusion operation promotes the integration of shallow and deep features, thereby enhancing the continuity of fault structures and suppressing noise in prediction results on field data. By enabling the aggregation of information across multiple network layers, this architecture effectively mitigates the loss of information and reduces noise;
- An enhanced-training workflow has been introduced to improve the continuity of prediction results and effectively remove noise from the results. The training workflow enhances the capability of our network by incorporating a reward mechanism, thereby improving the continuity and structural integrity of the interpretation results. We further applied this workflow to other networks and demonstrated its effectiveness.
2. Methods
We address the problem of 3D seismic fault interpretation by formulating it as an image segmentation task. To this end, we propose a variant of U-Net, STA-Fault3D, for fault detection. The network is built upon a spatial–temporal asymmetric convolution set and integrates multi-scale feature fusion operations. In order to further improve the resolution of the performance on field data, we propose an enhanced-training strategy.
2.1. The Spatial–Temporal Asymmetric Convolution Set
The convolution block is one of the basic components in a neural network. In previous studies, the increase in the dimension of convolution blocks comes along with the exponential increase in the requirements for the amount of parameters and overall calculation. Traditional 3D convolution for extracting features from seismic data can be represented as shown below:
where F represents the features extracted by convolution, is a 3D convolution kernel of size denotes the input 3D seismic data, and x and y are spatial dimensions (e.g., inline and crossline directions), while t is the temporal dimension (time or depth). Traditional 3D convolution typically aims to directly capture 3D features through a convolution operation. However, this approach often results in a large number of parameters and forces the information from different dimensions (spatial and temporal) to be blended during convolution. Consequently, it fails to extract the distinctive features unique to each individual dimension. And the convolution set for extracting features from 3D seismic data can be represented as
where represents the convolution set, and , and represent low-dimensional convolution kernels in the convolution set. M denotes the mixing step that fuses the features extracted by each convolution kernel. The convolution set enables a more flexibly capture of information across different dimensions while also significantly reducing the computational resources required.
Previous studies have basically focused on the more general convolution set. The work of Hou et al. [] has thoroughly demonstrated the advantages of a low-dimensional convolutional set over high-dimensional convolution blocks, providing a solid theoretical foundation for the application of convolution set structures.
In this study, we set relevant super-parameters according to the characteristics of seismic data. We believe that the temporal dimension contains relatively rich information of seismic data. So, we set larger kernels to the time dimension and relatively small ones to the other two dimensions. Following the decomposition method, we further discuss the influence of different settings on convolution operation of seismic data and the influence of the different kernel sizes. Through experiments, we finally devised a spatial–temporal asymmetric convolution set and designed the convolution block. The block is used as the basic module in our network for seismic fault segmentation.
Figure 1 illustrates the traditional 3D convolution block and our proposed convolution set. Hou et al. argued that a high-dimensional convolution kernel can be approximated by the sequential aggregation of small kernels across multiple layers []. This convolution set attempts to use three 1D convolutions to approximate the 3D convolution. Based on the convolution set, we designed the spatial–temporal asymmetric convolution block shown in Figure 2. In this structure, we adopted the convolution set aforementioned as the main components. Additionally, convolution blocks and a channel attention mechanism are added to fuse the features calculated separately.
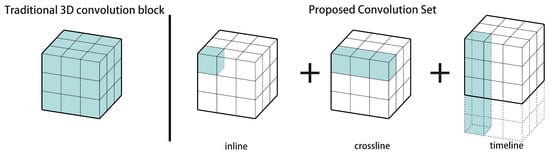
Figure 1.
Schematic diagram of traditional 3D convolution block and proposed convolution set. The set is a combination of one dimensional convolutions on crossline, inline and time with lengths of 1, 3 and 5, respectively.
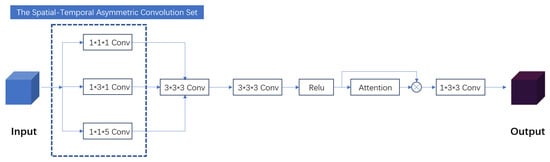
Figure 2.
Structure of the spatial–temporal asymmetric convolution block. The block structure takes the spatial–temporal asymmetric convolution set as a basic module, incorporates a channel attention mechanism and an activation function, and adds a fusion convolution block at the end.
The proposed spatial–temporal asymmetric convolution block (STA block) aims to achieve two main goals. On the one hand, it reduces computational cost by minimizing the use of 3D convolution blocks, thus significantly decreasing computation overhead. On the other hand, it offers dimension-specific flexibility: the asymmetric design enables extending the kernel length in a specific dimension like the temporal axis to expand the receptive field and extract richer information while avoiding additional costs in other dimensions. In conclusion, this block acts as a light and adaptable basic module for 3D seismic data feature extraction.
2.2. Multi-Scale Feature Fusion
Multi-scale feature fusion plays a crucial role in image segmentation by effectively addressing the challenge of scale variation inherent in visual data. This approach leverages hierarchical features extracted from different layers of neural networks, enabling the capture of fine-grained details from shallow layers alongside high-level semantic context from deeper layers.
In practical applications of multi-scale feature fusion, a common strategy involves increasing the number of connection pathways within the network to enhance the capture of multi-scale contextual information. Athira et al. [] and Chen et al. [] incorporated dense connection and multi-scale feature fusion mechanisms into their respective models, resulting in significant enhancements in segmentation performance.
To further improve the resolution of network predictions, we devised the network architecture depicted in Figure 3. Dense connections were incorporated into the down-sampling path to facilitate more efficient information propagation, which was supplemented by additional feature fusion operations. Fusion convolution blocks were embedded within the skip connections at multi-scale feature aggregation points, enabling more comprehensive and effective feature integration across different network layers.
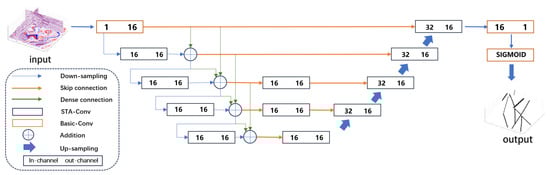
Figure 3.
Overview of STA-Fault3D structure.
The proposed network architecture consists of three primary components: down-sampling, skip connection and up-sampling. The network is primarily composed of STA convolution blocks with conventional convolution blocks serving as auxiliary components. The proposed STA block enables the network to more effectively capture information across different dimensions of seismic data while reducing the number of parameters and computational cost compared with conventional 3D convolution blocks. We deliberately maintain a consistent number of channels across the deep layers based on two key considerations. First, uniform channel dimensions enhance feature compatibility during multi-scale fusion, facilitating the integration of semantic information while effectively suppressing redundant or ambiguous features. Second, controlling the channel count allows for a reduction in the overall number of parameters and computational load.
We incorporate multi-scale feature fusion operations during the down-sampling to enable the network to capture deep and shallow layers information. The fusion processing can be formulated as
where represents the STA convolution block, while , and represent the feature maps of the i-th, (i − 1)-th and (i − 2)-th layer. Multi-scale feature fusion operations facilitate the integration of shallow features into deep layers during down-sampling, enabling the network to capture semantic information at multiple scales. This enhances the network’s ability to preserve and detect fine-grained details. In the fusion steps, the mixed features are fused to improve the stability and robustness of the results.
In the skip connections, we set STA blocks to enhance the integration of information from deep layers. The STA convolution block in skip connections is an auxiliary module to improve the quality of this fusion process. This design addresses two primary challenges: (1) features from deeper layers are typically of lower resolution and may introduce systematic position error into the output; (2) although multi-scale feature fusion enables deep layers to access information across different scales, direct summation is suboptimal for effective feature integration. A sigmoid activation function is applied at the output layer to generate probability volumes within the range [0, 1].
2.3. The Enhanced-Training Workflow
In fault image segmentation tasks, the network typically outputs a 3D probability volume, where the value of each voxel represents the likelihood of that point belonging to a fault. Within this volume, voxels with a probability of 0 can be reliably classified as non-faults, while those with a probability of 1 correspond to definite faults. However, due to the inherent variability and instability of deep learning models, these probability values may fluctuate across different training iterations. To address this issue and enhance prediction consistency, we introduce a reward mechanism in the training process, which can be formally defined as follows:
where represents the probability of a specific point in the output probability volume during training, while and denote the predefined upper and lower confidence bounds, respectively. We design an enhanced-training scheme based on the proposed reward mechanism. The network generates an initial probability volume with values ranging from 0 to 1. The reward mechanism is then applied to this probability volume to classify each voxel into one of three categories: fault, non-fault, or uncertain. After assigning the labels, the updated volume is fed into the loss computation process for model training. The workflow we proposed is illustrated in Figure 4.
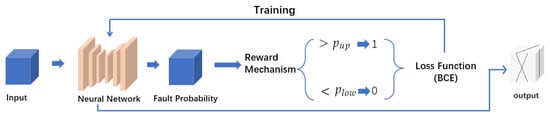
Figure 4.
Overview of enhanced-training workflow.
The proposed workflow is designed to refine the probability volume prior to loss computation during the training phase. Specifically, we apply an enhancement operation to the raw probability volume and compute the loss based on this refined output, guiding the subsequent model optimization. This refinement process increases the proportion of voxels with values approaching 0 (indicating definite non-fault) and 1 (indicating definite fault), which in turn influences the loss. To ensure balanced learning between fault and non-fault classes, we adopt a balanced cross-entropy loss, which is formally defined as follows:
where is the refined probability value of the i-th point, is the ground truth label, and is a balancing weight to address class imbalance.
In the enhanced-training workflow, our primary objective is to drive the output probability distribution toward its binary extremes, 0 and 1, in order to achieve more distinct and reliable segmentation results. Specifically, the training strategy is designed to encourage the majority of voxels to be identified as either faults (with probabilities approaching 1) or non-faults (with probabilities approaching 0).
By introducing the three-segment probability guidance strategy, the network is encouraged to perform secondary validation on high-confidence predictions. Voxels with probabilities exceeding the upper threshold are reinforced as fault points, enhancing the consistency of subsequent training iterations. In contrast, voxels with probabilities falling below the lower threshold are excluded, thereby reducing the impact of noise and improving the resolution of the result.
3. Results
The experimental evaluation in this study consists of two main components: field data testing and ablation studies. For field data evaluation, we employ publicly available seismic datasets. To assess the effectiveness of the proposed method, we conduct comparative experiments against two approaches: FaultSeg3D [] and Fault3DNnet []. All experiments are implemented on an NVIDIA RTX 3090 GPU, a high-performance graphics processing unit equipped with 24 GB of GDDR6X memory, which provides powerful parallel computing capability for deep learning tasks. Model optimization is performed using the Adam optimizer.
3.1. Dataset
The proposed STA-Fault3D is trained on a synthetic seismic dataset provided by Wu et al. []. The training set and the validation set contain 200 and 20 seismic data volumes sized 128 × 128 × 128, along with their corresponding labels, respectively.
We selected the Netherlands F3 dataset, New Zealand Kerry3D dataset and Thebe dataset as field data examples. To validate the effectiveness of the proposed method on field data, we conducted ablation studies based on the F3 dataset and analyzed the fault prediction results.
The F3 dataset, acquired from the North Sea offshore the Netherlands, is a widely used open-source benchmark characterized by complex fault structures and clear stratigraphic features. The Kerry3D dataset, obtained from the Taranaki Basin in New Zealand, is fault-rich marine seismic data with a variety of geological patterns, making it suitable for evaluating model generalization across different tectonic settings. The Thebe dataset, collected from the Exmouth Plateau in the Northwest Shelf of Australia, is one of the largest publicly available field-scale fault-interpretation datasets, providing high-resolution seismic volumes with detailed fault annotations.
Due to the significant variation in amplitude values across different seismic datasets, all data were first standardized using z-score normalization, which is defined as follows:
where represents the data after normalization, X represents the original data, and and denote the mean and standard deviation of X.
3.2. The Computation Comparison of Execution Efficiency
To evaluate the computational efficiency of the proposed network, we conducted a quantitative comparison across four key metrics among FaultSeg3D, Fault3DNnet and STA-Fault3D. The metrics include the number of parameters, the number of floating-point operations (FLOPs) for input volumes of size , the maximum data cube size that can be processed within a 10 GB memory constraint, and the inference time on the F3 dataset.
As shown in Table 1, our method demonstrates notable advantages across all evaluated aspects. Compared with FaultSeg3D, STA-Fault3D achieves a remarkable reduction in computational complexity, requiring only 12.3% of the parameters and 18.6% of the FLOPs, while reducing the inference time to merely 5% of that required by FaultSeg3D, as shown in Table 1. Furthermore, when benchmarked against the SOTA lightweight model Fault3DNnet, our method still demonstrates superior efficiency, achieving a 10% reduction in parameter count and a 4.2% decrease in FLOPs, which is accompanied by an additional acceleration in inference speed. These results clearly indicate that STA-Fault3D maintains competitive accuracy while significantly improving computational efficiency and deployment feasibility for large-scale seismic fault interpretation.

Table 1.
The computation comparison of STA-Fault3D, Fault3DNnet and FaultSeg3D.
These empirical results underscore the superior efficiency of the proposed method in terms of both resource consumption and processing time. The efficiency gains are primarily attributed to the convolution block decomposition strategy, which systematically replaces high-dimensional convolution operations with STA blocks, thereby preserving feature extraction capability while reducing computational overhead.
3.3. Netherlands F3 Data
Figure 5 demonstrates the experimental results of three methods: the proposed STA-Fault3D, FaultSeg3D, and Fault3DNnet—on a 512 × 384 × 128 seismic data cube extracted from the Netherlands off-shore F3 block field data.
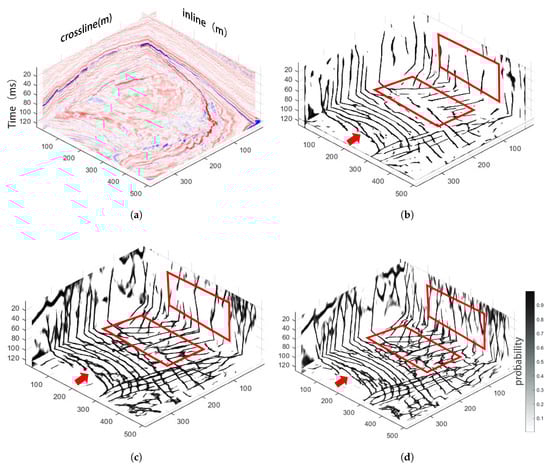
Figure 5.
Fault prediction results on F3 dataset: (a) the original F3 seismic data; (b) FaultSeg3D []; (c) Fault3DNnet []; (d) STA-Fault3D.
The original data are shown in Figure 5a. Figure 5b–d present the result from FaultSeg3D, Fault3DNnet and STA-Fault3D, respectively. While all three methods demonstrate a similar identification of major fault structures, the proposed STA-Fault3D exhibits distinct advantages in the red-boxed regions. Comparative analysis reveals that STA-Fault3D achieves more complete and continuous fault structures compared with the other two methods. As indicated by the red arrows, STA-Fault3D better maintains structural continuity in fault interpretation. Notably, STA-Fault3D demonstrates enhanced capability in detecting subtle fault features that appear as broken strikes or remain undetected by the compared methods.
3.4. New Zealand Kerry3D Data
For the second field data, we selected the New Zealand Kerry3D dataset, extracting an irregular cuboid of dimensions 286 × 734 × 300 (Figure 6a) for comparative analysis. To facilitate a comprehensive comparison of the three methods, we further analyzed their performance at two specific time slices: slice 200 (Figure 7a,c,e,g) and slice 250 (Figure 7b,d,f,h).
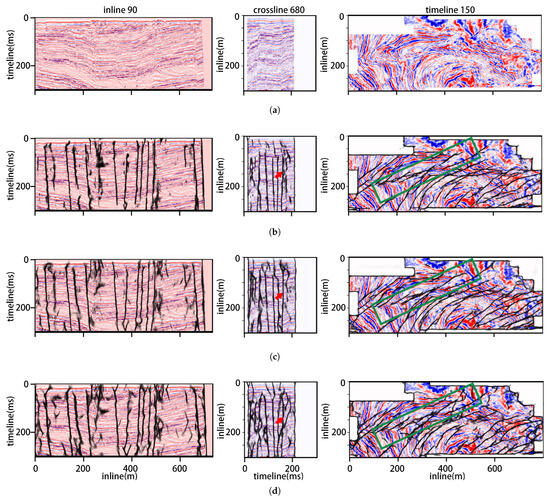
Figure 6.
Fault prediction results on Kerry3D seismic dataset: (a) the original Kerry3D seismic data; (b) FaultSeg3D []; (c) Fault3DNnet []; (d) STA-Fault3D.
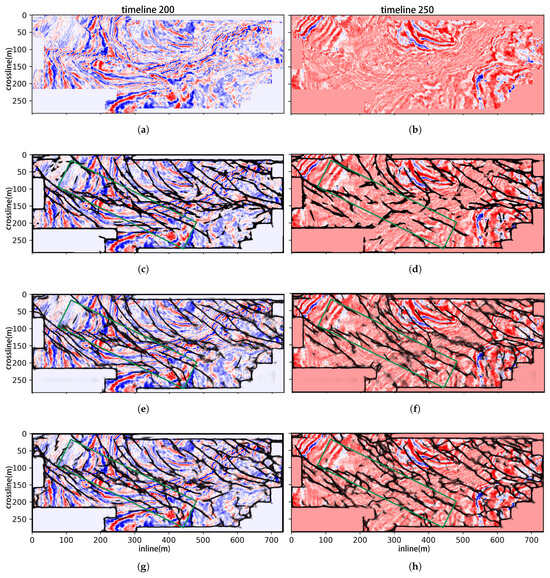
Figure 7.
Fault prediction results on Kerry3D dataset of the 200 (a,c,e,g) and 250 time slices (b,d,f,h). (a,b) are the original 200 and 250 time slice profiles of Kerry3D; (c,d) FaultSeg3D []; (e,f) Fault3DNnet []; (g,h) STA-Fault3D.
In Figure 6, all three networks demonstrate excellent predictive performance on the Kerry3D dataset. By comparing the regions marked by red arrows and green boxes, STA-Fault3D enhances the continuity of fault structures and improves the structural integrity of the results. Figure 7 demonstrates results of the 200 and 250 time slices in Kerry3D. The proposed STA-Fault3D achieves results comparable to both FaultSeg3D and Fault3DNnet with fewer parameters and less memory consumption. Meanwhile, on time slice 250, STA-Fault3D maintains superior performance: it outperforms FaultSeg3D in terms of both fault continuity and structural integrity while also exhibiting better continuity in detailed regions compared with the SOTA network Fault3DNnet.
The experimental results on Kerry3D further validate the effectiveness of the proposed STA-Fault3D and highlight its generalization capability. Even when handling irregular seismic data, STA-Fault3D demonstrates robust fault recognition performance, enabling high-quality structural reconstruction in complex geological scenarios.
3.5. Thebe Gas Field Data
For the third field dataset, we used seismic data from the Thebe gas field in the Exmouth Plateau of Australia’s Northwest Shelf (Carnarvon Basin). As noted by An et al. [] (2021), this dataset contains professionally annotated labels for deep faults interpreted by experts (Figure 8b). Figure 8 shows the results of FaultSeg3D, Fault3DNnet, and the proposed STA-Fault3D, respectively.
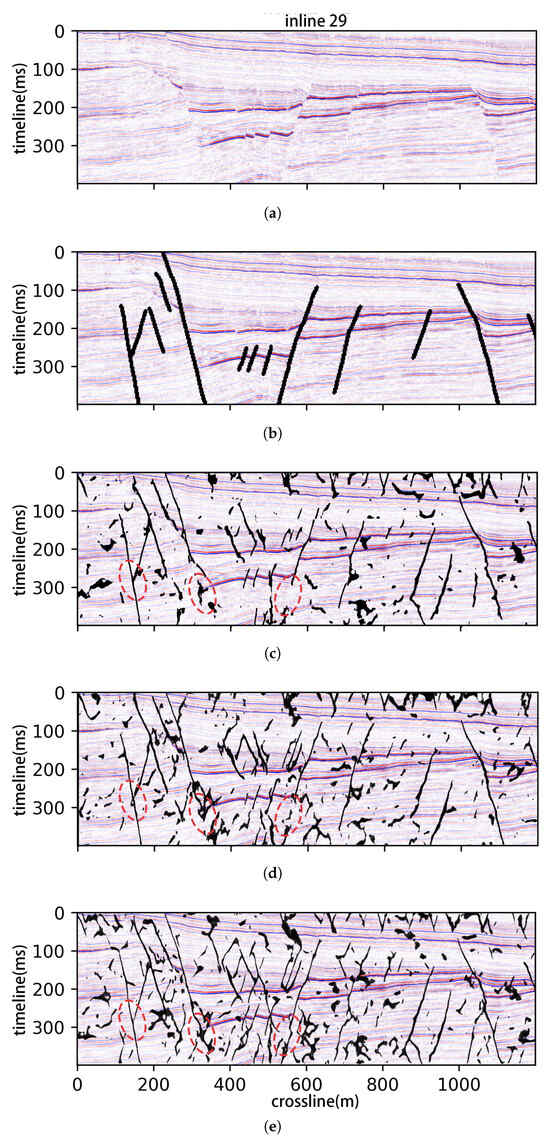
Figure 8.
Fault prediction results on Thebe dataset: (a) the original cube of Thebe seismic data; (b) expert interpreted faults; (c) FaultSeg3D []; (d) Fault3DNnet []; (e) STA-Fault3D.
Compared with the expert labels, the results demonstrate that STA-Fault3D accurately predicts most fault structures with completeness. Compared with FaultSeg3D, STA-Fault3D exhibits better continuity and structural integrity, effectively avoiding missing fault segments. In the red dashed elliptical areas, STA-Fault3D shows more complete and continuous predictions for elongated fault structures with higher accuracy in detailed features and fewer blurred regions. Overall, STA-Fault3D achieves superior continuity and structural completeness in fault predictions compared with the aforementioned methods on the Thebe gas field dataset.
In all field data experiments, the fault prediction results of the proposed STA-Fault3D exhibit satisfactory performance in all directions with advantages in both the continuity and structural integrity of the predicted fault structures. During the design of convolution blocks, we implemented an uneven allocation of kernel sizes for 1D convolution blocks across different dimensions. However, the experimental results revealed no significant decline in fault recognition capability in any profile or notable performance discrepancies between profiles. The experimental results on field data demonstrate that the spatial–temporal asymmetric convolution set can effectively adapt to field data of varying scales while maintaining reliable fault prediction capabilities across all profiles, thereby proving the generalization capability of STA-Fault3D.
4. Ablation Studies
4.1. Convolution Block Decomposition
To verify the effectiveness of the convolution block decomposition method and the spatial–temporal asymmetric convolution set on field seismic data, we test different convolution sets for fault detection on the F3 dataset.
We tested the impact of kernel length combination across dimensions within the 390 convolution set for fault interpretation on the field dataset. In the experiment, we mainly set up the following three groups: (1) Figure 9b–d increase the length in a single dimension; (2) Figure 9e–g demonstrate the case of two-dimensional decomposition; (3) Figure 9h,i show symmetric and asymmetric decomposition. To evaluate the generalization performance of the decomposed approach, we compared the prediction results on the F3 dataset. We selected the 115 time slice for visual comparison, and the experimental results are shown in Figure 9.
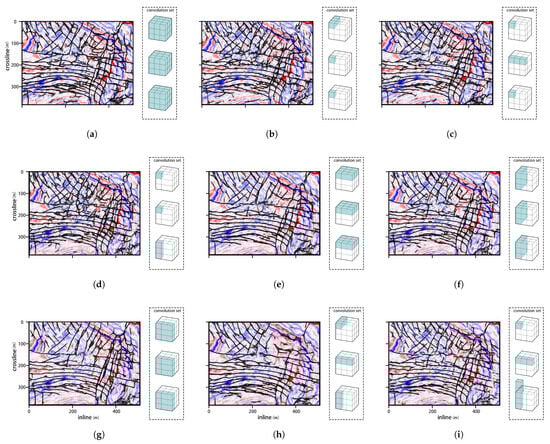
Figure 9.
Convolution set ablation results: time slice of the F3 dataset: (a) the result of the 3D convolution block; (b–d) larger kernel length on inline, crossline and time, respectively; (e–g) two dimensional kernel on inline–crossline, inline–time and crossline–time, respectively; (h,i) one-dimensional symmetrical and asymmetric decomposition, respectively.
Figure 9a presents the prediction results obtained using three-dimension convolution. Although the method yields satisfactory prediction results, its high computational complexity, substantial GPU memory consumption, and prolonged inference time pose considerable challenges for practical implementation.
The first group (Figure 9b–d) illustrates the impact of convolutions on individual dimensions for fault interpretation. To minimize inter-dimensional interference, the convolution block length was set to 1 except for the designated dimension. Experimental results from three cases demonstrate that the larger kernel length on temporal dimension exhibits superior performance in both fault identification accuracy and structural continuity. These findings offer valuable insights for the design of the asymmetric convolution set: that is, the kernel size should have larger temporal dimensions for the fault segmentation task.
As illustrated in Figure 9e–g, the results highlight the influence of different dimensional configurations in 2D convolution decomposition, revealing two major limitations. First, the application of 2D decomposition significantly degrades the network’s fault interpretation performance, yielding results that are markedly inferior. Second, compared with 1D decomposition, the 2D approach leads to an exponential increase in both the number of parameters and computational overhead.
Figure 9h,i, respectively, display the prediction results obtained using symmetric and asymmetric 1D convolution sets. The asymmetric configuration exhibits superior performance, particularly in terms of fault continuity and identification accuracy. In addition, the flexibility to adjust the convolution kernel length along specific dimensions within the asymmetric design enables more precise control over the network’s parameter count and computation resource.
4.2. Multi-Scale Feature Fusion Architecture
Multi-scale feature fusion was implemented to further improve the proposed STA-Fault3D. While this decomposition significantly reduces parameter burden and computational costs, it simultaneously prevents the convolution blocks from capturing multi-scale information. This limitation introduces noise into the fault interpretation results on field data. The normal implementation involves feature concatenation across different layers, yet many connection patterns and enhancement options required careful selection.
During the experiments, we selected four network architectures: the U-Net structure; a connection structure with shallow layers (layer 1 to 3); and multi-scale feature fusion operations without or with the STA blocks in skip connection.
As shown in Figure 10, without multi-scale feature fusion operations, the U-Net structure produces interpretation results with lots of scattered points. Shallow-layer feature fusion alone effectively mitigates the scattered point issue but reduces the network’s fault segmentation capability. The multi-scale feature fusion operation effectively addresses the issues. Multi-scale feature fusion operation enables the network to better capture information from shallow and deep layers. Simultaneously, this structure can produce continuous and clear outputs. The incorporation of STA convolution blocks within the skip connections of deep neural network layers facilitates the effective fusion of multi-scale features extracted from shallow and deep network layers. This architecture enhances model stability while mitigating scattered points in outputs.
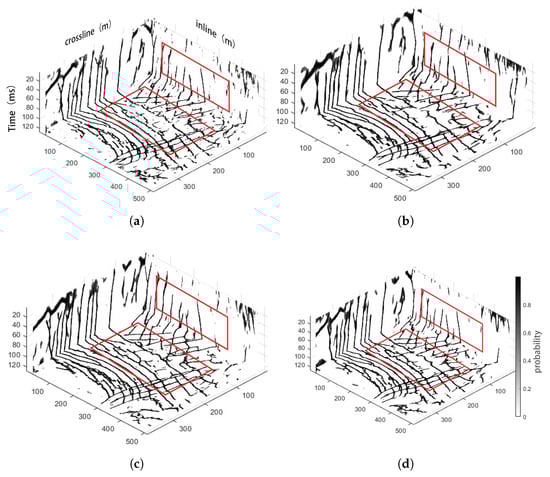
Figure 10.
Network structure ablation experiment. (a) U-Net structure using the STA blocks; (b) fusion the shallow layers (layers 1 to 3); (c) multi-scale feature fusion operations without STA blocks in skip connection; (d) multi-scale feature fusion with STA blocks in skip connection.
We compared the training and validation loss curves of the four aforementioned network, as illustrated in Figure 11. It shows all four models exhibit broadly similar descending trends. Specifically, the U-Net with the STA module and the shallow fusion strategy show slower loss reduction compared with methods incorporating the multi-scale feature fusion strategy. When comparing multi-scale fusion approaches, the convolution-enhanced fusion method achieves more stable loss reduction with its loss curve approximating a smoother trajectory. These observations are more pronounced in the validation loss curves shown in Figure 11b. In the validation loss comparison, while all curves exhibit fluctuations during the decline phase, the proposed architecture demonstrates superior performance in both convergence speed and stability. The combination of convolution enhancement and multi-scale feature fusion operation enhances the stability of the network architecture, thereby improving the reliability of fault prediction results.
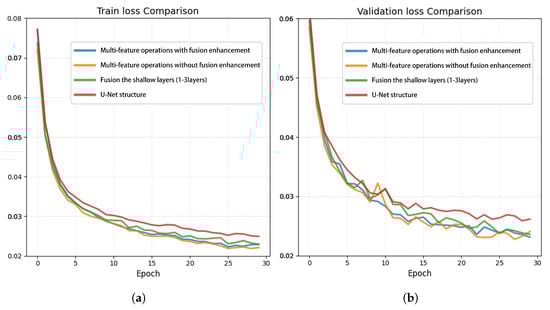
Figure 11.
Train loss and validation loss of different network on synthetic datasets: (a) train loss; (b) validation loss.
4.3. Enhanced-Training Workflow
The enhanced-training workflow we proposed involves setting upper and lower confidence bounds to further differentiate points in the probability volume generated during training. By establishing probability thresholds, we categorize points in the probability volume into three distinct regions and apply a reward strategy: intensifying probability concentration in high-confidence regions while filtering out low-confidence areas. This approach encourages the network to cluster probabilities toward the defined bounds during prediction while enhancing fault recognition capabilities. The core implementation lies in pre-classifying and assigning values to the probability volume before loss function computation. The selection of different upper/lower threshold combinations critically influences the network, as varying threshold settings yield distinct learning effects.
The numerical experiments tested the impact of the upper and lower threshold on prediction results and the influence of the size of interval ranges. To validate the effectiveness of the enhanced-training workflow, we applied the enhanced-training workflow on Fault3DNnet. The experimental results are shown in Figure 12. In the experiments, we used the STA-Fault3D and adjusted the upper/lower threshold in the enhanced-training workflow.
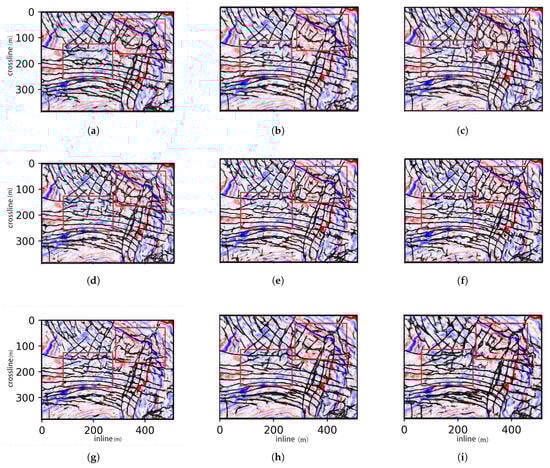
Figure 12.
Results with different upper/lower thresholds: (a) STA-Fault3D without enhanced-training workflow; (b–g) STA-Fault3D with different threshold settings: (b) 0.15/0.65; (c) 0.15/0.75; (d) 0.15/0.85; (e) 0.25/0.75; (f) 0.25/0.85; (g) 0.35/0.65; (h) Fault3DNnet; (i) Fault3DNnet with enhanced-training workflow.
The results demonstrate that all outcomes using the enhanced-training workflow showed improvements in continuity and resolution. The results also demonstrate that the upper/lower bounds and interval length of the reward mechanism significantly influence the network performance on field data. Elevating either threshold boundary enhances the network’s capacity to capture details, thereby reducing noise in outputs. Furthermore, narrower threshold intervals yield higher-resolution predictions but compromise both the continuity of fault structures and structural integrity. These findings collectively suggest the necessity for balanced threshold selection to optimize the resolution and continuity of the results. Based on the results of the experiments, and taking into account the continuity and resolution of the prediction results, we have set the workflow thresholds at 0.15 and 0.75 during implementation.
To validate the effectiveness of the enhanced-training workflow, we applied the enhanced-training workflow on Fault3DNnet. The results of Fault3DNnet with/out the enhanced-training workflow are shown in Figure 12h,i, respectively. Compared with non-enhancement training results, the workflow substantially improves the continuity of the result, proving its effectiveness in enhancing prediction performance across different network architectures.
5. Discussion
The proposed STA-Fault3D network and the enhanced-training workflow we developed have successfully accomplished fault identification tasks, demonstrating their generalization capability and effectiveness in fault detection across multiple field datasets. Our network primarily relies on three key approaches: convolution block decomposition theory, multi-scale feature fusion, and a reward mechanism within the enhanced-training workflow.
The convolution block decomposition method significantly reduces computational costs, enabling STA-Fault3D to capture different information across dimensions and, at the same time, become a highly efficient lightweight network. However, ablation experiments on convolution block decomposition and network architecture revealed that decomposing convolution blocks leads to the issue of scattered points, which is particularly evident when deploying the proposed STA blocks in the U-Net framework. To address this, we introduced multi-scale feature fusion operations in the network architecture. Future research may explore more effective fusion methods to further optimize the integration of decomposed convolution blocks into traditional networks.
Furthermore, the enhanced-training workflow employs a reward mechanism to improve the continuity and structural integrity of the identified fault features. However, networks utilizing this workflow exhibit unstable loss curves, indicating variability in the prediction stability. Subsequent research on the reward mechanism and loss function will focus on enhancing stability to achieve more reliable predictions.
6. Conclusions
In this work, we designed the spatial–temporal asymmetric convolution set for fault interpretation, leveraging convolution block decomposition and the inherent uneven distribution of seismic information across dimensions. Additionally, we introduce a multi-scale feature fusion to construct the STA-Fault3D network. We further introduced an enhanced-training workflow to improve the performance of the network on field seismic data. Experiments on three field datasets demonstrate that STA-Fault3D predicts more complete fault structures with better continuity compared with the classic network FaultSeg3D, and it outperforms the SOTA lightweight network Fault3DNnet in specific regions. Remarkably, STA-Fault3D requires only 12.33% of the parameters and 18.57% of the computational load compared with FaultSeg3D, and reduces parameters by 10% and computation by 4.2% relative to Fault3DNnet, significantly lowering computational costs. The proposed STA-Fault3D delivers accurate fault predictions and performs well on multiple field datasets. We hope this research will inspire future designs of lightweight fault identification networks.
Author Contributions
Conceptualization, L.Z.; Investigation, B.W.; Methodology, L.Z.; Resources, J.J.; Software, Y.Y.; Validation, B.W.; Writing—original draft, L.Z.; Writing—review and editing, B.W. All authors have read and agreed to the published version of the manuscript.
Funding
This research is funded by the National Natural Science Foundation of China (41874164). This work is partially supported by the NSFC grants 12326606, 12322116, and 12271428, the Major projects of the NSFC grants 12090021 and 12090020, and the Social Science Foundation of the Ministry of Education of China with Grant No. 24YJC790233.
Institutional Review Board Statement
Not applicable.
Informed Consent Statement
Not applicable.
Data Availability Statement
The data used in this study are publicly available at the following sources. The synthetic training dataset is provided by the open-source FaultSeg3D repository (https://github.com/xinwucwp/faultSeg accessed on 9 November 2025). The field datasets used include the Thebe dataset from the Thebe Gas Field in the Exmouth Plateau, Australia (https://dataverse.harvard.edu/dataset.xhtml?persistentId=doi:10.7910/DVN/YBYGBK accessed on 9 November 2025), the Netherlands F3 dataset from the North Sea (https://zenodo.org/records/1471548 accessed on 9 November 2025), and the Kerry3D dataset from the Taranaki Basin, New Zealand (https://www.dataenergy.ca/opendata accessed on 9 November 2025).
Conflicts of Interest
The authors declare no conflicts of interest.
Abbreviations
The following abbreviations are used in this manuscript:
| SOTA | state-of-the-art |
| FLOPs | the number of floating-point operations |
References
- Lazos, I.; Papanikolaou, I.; Sboras, S.; Foumelis, M.; Pikridas, C. Geodetic Upper Crust Deformation Based on Primary GNSS and INSAR Data in the Strymon Basin, Northern Greece—Correlation with Active Faults. Appl. Sci. 2022, 12, 9391. [Google Scholar] [CrossRef]
- Ayad, A.; Tagma, T. Lithostratigraphic and seismic investigation of the weathered zone in the exploration of deep petroleum structures (Boujdour area, Morocco). Egypt. J. Pet. 2024, 33, 12. [Google Scholar] [CrossRef]
- Gersztenkorn, A.; Marfurt, K.J. Eigenstructure-based coherence computations as an aid to 3-D structural and stratigraphic mapping. Geophysics 1999, 64, 1468–1479. [Google Scholar] [CrossRef]
- Han, T.; Ding, R.; Zhao, S.; Ma, Y.; Su, C.; Zhang, Y.; Li, J.; Zhao, L. Algorithm for Intelligent Recognition Low-Grade Seismic Faults Using Codec Target Edges. IEEE Trans. Geosci. Remote Sens. 2023, 61, 1–12. [Google Scholar] [CrossRef]
- Chuai, X.Y.; Wang, S.X.; Shi, P.D.; Wei, X.; Chen, W. Applications of texture attribute analysis to seismic interpretation. J. Cent. S. Univ. 2014, 21, 3617–3626. [Google Scholar] [CrossRef]
- Zhang, Q.; Yang, L. Application of an Improved Ant Colony in Faults Tracking. In Proceedings of the 2015 8th International Symposium on Computational Intelligence and Design (ISCID), Hangzhou, China, 12–13 December 2015; IEEE: New York, NY, USA, 2015; pp. 547–550. [Google Scholar] [CrossRef]
- Li, F.; Lyu, B.; Qi, J.; Verma, S.; Zhang, B. Seismic Coherence for Discontinuity Interpretation. Surv. Geophys. 2021, 42, 1229–1280. [Google Scholar] [CrossRef]
- Vincent, P.; Larochelle, H.; Lajoie, I.; Bengio, Y.; Manzagol, P.A. Stacked Denoising Autoencoders: Learning Useful Representations in a Deep Network with a Local Denoising Criterion. JMLR 2010, 38, 1532–4435. Available online: https://dl.acm.org/doi/10.5555/1756006.1953039 (accessed on 10 September 2024).
- Hinton, G.E.; Osindero, S.; Teh, Y.W. A Fast Learning Algorithm for Deep Belief Nets. Neural Comput. 2006, 18, 1527–1554. [Google Scholar] [CrossRef]
- Lecun, Y.; Bottou, L.; Bengio, Y.; Haffner, P. Gradient-based learning applied to document recognition. Proc. IEEE 1998, 86, 2278–2324. [Google Scholar] [CrossRef]
- Ronneberger, O.; Fischer, P.; Brox, T. U-Net: Convolutional Networks for Biomedical Image Segmentation. In Proceedings of the Medical Image Computing and Computer-Assisted Intervention—MICCAI 2015, Munich, Germany, 5–9 October 2015; Navab, N., Hornegger, J., Wells, W.M., Frangi, A.F., Eds.; Springer: Cham, Switzerland, 2015; pp. 234–241. Available online: https://link.springer.com/chapter/10.1007/978-3-319-24574-4_28 (accessed on 10 September 2024).
- Xie, S.; Tu, Z. Holistically-Nested Edge Detection. In Proceedings of the 2015 IEEE International Conference on Computer Vision (ICCV), Santiago, Chile, 7–13 December 2015; pp. 1395–1403. [Google Scholar] [CrossRef]
- Xiong, W.; Ji, X.; Ma, Y.; Wang, Y.; AlBinHassan, N.M.; Ali, M.N.; Luo, Y. Seismic fault detection with convolutional neural network. Soc. Explor. Geophys. 2018, 83, O97–O103. [Google Scholar] [CrossRef]
- An, Y.; Guo, J.; Ye, Q.; Childs, C.; Walsh, J.; Dong, R. Deep convolutional neural network for automatic fault recognition from 3D seismic datasets. Comput. Geosci. 2021, 153, 104776. [Google Scholar] [CrossRef]
- Wu, X.; Liang, L.; Shi, Y.; Fomel, S. FaultSeg3D: Using synthetic data sets to train an end-to-end convolutional neural network for 3D seismic fault segmentation. Geophysics 2019, 84, IM35–IM45. [Google Scholar] [CrossRef]
- Zhou, R.; Zhou, C.; Wang, Y.; Yao, X.; Hu, G.; Yu, F. Frequency adaptive fault detection by feature pyramid network with wavelet transform. Geophysics 2023, 88, IM113–IM130. [Google Scholar] [CrossRef]
- Gao, K.; Huang, L.; Zheng, Y.; Lin, R.; Hu, H.; Cladohous, T. Automatic fault detection on seismic images using a multiscale attention convolutional neural network. Geophysics 2022, 87, N13–N29. [Google Scholar] [CrossRef]
- Liu, N.; He, T.; Tian, Y.; Wu, B.; Gao, J.; Xu, Z. Common-azimuth seismic data fault analysis using residual UNet. Interpretation 2020, 8, SM25–SM37. [Google Scholar] [CrossRef]
- Tang, Z.; Wu, B.; Ma, D. Fault3DNnet: A lightweight 3D seismic fault detection network with bidirectional decoding. Geophysics 2024, 89, IM91–IM103. [Google Scholar] [CrossRef]
- Yang, Y.; Li, B.; Wu, B.; Jia, J. LightUNetFault3D: A Lightweight U-Net for 3-D Seismic Fault Detection. IEEE Geosci. Remote Sens. Lett. 2025, 22, 1–5. [Google Scholar] [CrossRef]
- Guo, M.H.; Lu, C.Z.; Liu, Z.N.; Cheng, M.M.; Hu, S.M. Visual Attention Network. arXiv 2022, arXiv:2202.09741. [Google Scholar] [CrossRef]
- Hou, J.; Zhu, Z.; Hou, J.; Liu, H.; Zeng, H.; Meng, D. Deep Diversity-Enhanced Feature Representation of Hyperspectral Images. IEEE Trans. Pattern Anal. Mach. Intell. 2024, 46, 8123–8138. [Google Scholar] [CrossRef]
- Dosovitskiy, A.; Beyer, L.; Kolesnikov, A.; Weissenborn, D.; Zhai, X.; Unterthiner, T.; Dehghani, M.; Minderer, M.; Heigold, G.; Gelly, S.; et al. An Image is Worth 16x16 Words: Transformers for Image Recognition at Scale. arXiv 2020, arXiv:2010.11929. [Google Scholar] [CrossRef]
- Kagan; Yan, Y. Earthquake spatial distribution: The correlation dimension. Geophys. J. Int. 2007, 3, 1175–1194. [Google Scholar] [CrossRef]
- Lou, Y.; Wu, L.; Liu, L.; Yu, K.; Liu, N.; Wang, Z.; Wang, W. Irregularly sampled seismic data interpolation via wavelet-based convolutional block attention deep learning. Artif. Intell. Geosci. 2022, 3, 192–202. [Google Scholar] [CrossRef]
- R, A.; Prakash, P. An In-Depth Analysis of U-Net Variations for Advancing Precision in Medical Image Segmentation. In Proceedings of the 2024 10th International Conference on Advanced Computing and Communication Systems (ICACCS), Coimbatore, India, 14–15 March 2024; IEEE: New York, NY, USA, 2024; pp. 1397–1402. [Google Scholar] [CrossRef]
- Chen, Z.; Xu, T.; Pan, Y.; Shen, N.; Chen, H.; Li, J. Edge Feature Enhancement for Fine-Grained Segmentation of Remote Sensing Images. IEEE Trans. Geosci. Remote Sens. 2024, 62, 5636613. [Google Scholar] [CrossRef]
- Yu, A.; Jiulin, G.; Qing, Y.; Conrad, C.; John, W.; Ruihai, D. A gigabyte interpreted seismic dataset for automatic fault recognition, Data in Brief. Data Brief 2021, 37, 2352–3409. [Google Scholar] [CrossRef]
Disclaimer/Publisher’s Note: The statements, opinions and data contained in all publications are solely those of the individual author(s) and contributor(s) and not of MDPI and/or the editor(s). MDPI and/or the editor(s) disclaim responsibility for any injury to people or property resulting from any ideas, methods, instructions or products referred to in the content. |
© 2025 by the authors. Licensee MDPI, Basel, Switzerland. This article is an open access article distributed under the terms and conditions of the Creative Commons Attribution (CC BY) license (https://creativecommons.org/licenses/by/4.0/).