1. Introduction
Modern telecommunications and technological developments have caused a major change in public transportation networks, making them more adaptable and responsive. The shift from conventional transportation services to more dynamic, user-focused mobility solutions has been fueled by this transformation. DRT evolved from Dial-a-Ride services of the late 1960s and early 1970s, one of the inventive ideas that emerged in response to the desire for easily available and convenient services. From its inception as a door-to-door service for people with physical disabilities, DRT has developed to meet the needs of a wide range of users while maintaining its fundamental emphasis on accessibility and flexibility [
1].
Currently, DRT systems are expanding in several countries due to their flexibility. For example, in China, with its increasing urbanization and rising private vehicle ownership, cities are facing challenges such as traffic congestion, parking shortages, and environmental pollution, and are now focusing on shared mobility services [
2].
In Korea, there are numerous popular and convenient taxi-hailing service platforms, including Kakao-Taxi and T-map, which also offer shared ride services [
3,
4]. These services differ from traditional ride-sharing as they accommodate multiple passengers with different origins and destinations. Traditional ride-hailing services typically serve single passengers or groups traveling from the same origin to the same destination. DiDi in China and Grab in Southeast Asia are other examples of ride-hailing services and customized bus, carpooling, and DRT services [
5,
6]. In Europe, DRT systems have been implemented to address mobility challenges in both rural and urban contexts. In Germany, studies have examined user acceptance and satisfaction factors, finding that performance expectancy and facilitating conditions significantly influence behavioral intentions to adopt DRT services, with the model explaining 47% of variance in user adoption [
7,
8]. Research in Belgium’s Flanders region has focused on the long-established Belbus system, investigating how DRT services address transport-related social exclusion among different social groups in peri-urban and rural areas [
9]. A comparative analysis of European cities revealed that the strategic role of DRT in public transport systems varies considerably based on cultural context, with different cities prioritizing either urban or rural connectivity depending on local needs and policy objectives [
10].
Machine learning approaches are relatively new to the area of mobility studies. Some research studies use machine learning for ride-hailing services [
11,
12]. Dyon Kyoum Shin et al. [
13] use a to investigate why taxi drivers might reject calls from customers, and the factors that influence the success of matching within the service. This study used origin and destination data in Seoul and the Daejeon Region from T-map taxis and determined how distances, socioeconomic factors, and land uses affected the matching success rate. They found that distance was the most important factor in Seoul and Daejeon. Long Chen et al. [
14] proposed Uber Net, a deep learning model for short-term ride-hailing demand prediction, incorporating spatial and temporal features like weather, demographics, and the built environment. Using NYC Uber data, the study showed that UberNet outperforms traditional models in accuracy and demand forecasting.
Yang Liu et al. [
15] reviewed machine-learning-based methodologies for on-demand ride-hailing services, emphasizing their role in urban traffic dynamics and intelligent transportation planning. It summarizes research on travel behavior, carpooling, modal choices, order matching, and vehicle dispatching. Lastly, it discusses key challenges and future opportunities in the ride-hailing services.
Finally, Saadi et al. [
16] forecasted short-term ride-hailing demand using spatial-temporal factors from DiDi Chuxing data. Among tested models, boosted decision trees performed best (RMSE = 16.41), followed by neural networks (20.09) and Random Forests (RFs) (23.50). The study highlights the superiority of advanced models for accurate demand prediction.
Overview of DRT
An integrated DRT system comprises several interconnected components, including the user interface (booking system), selection of stop points, fleet management, routing, and dispatching [
17]. Among these, vehicle dispatching plays a pivotal role in ensuring the efficient assignment of vehicles to passenger requests. A well-designed dispatching system balances user needs and operator requirements by efficiently matching passenger requests with available vehicles, maximizing vehicle utilization, improving overall system efficiency, and handling requests seamlessly. Dispatching is thus central to the operational success of DRT systems, making it a critical area of focus for research.
DRT can serve as a first-mile and last-mile transportation solution, helping bridge the gap between the main public transit network and passengers’ origins or destinations [
18]. DRT is ideal for low-density suburban and rural areas, regions with fluctuating transit demand (e.g., late nights, weekends, events), and for providing flexible, door-to-door mobility for seniors and disabled individuals [
19,
20].
This research was undertaken on the campus of the Korea KNUT, in Chungju, Korea. Within this area, DRT plays a crucial role in enhancing connectivity. The Chungju campus of KNUT experiences low transit demand, particularly on weekends, public holidays, and semester breaks. The existing public bus service only operates on weekdays with a low frequency (30-min headways), making it inconvenient for students. While shared electric kickboards are available, they are unsafe due to steep slopes and are difficult to use in summer and winter. Given these challenges, DRT offers a flexible and efficient solution, providing reliable transportation when and where it is needed most. KNUT aims to enhance transportation safety by replacing bicycles and electric kickboards with a DRT service. Since their introduction in 2019, these modes have led to numerous accidents, including a fatal electric kickboard crash in 2023, as the roads are particularly steep [
21]. To support the transition, data from bicycle and kickboard usage will be analyzed to develop an effective dispatch system, identifying potential DRT users and ensuring a safer alternative for current riders.
Examining previous research conducted in the KNUT area. Kim et al. [
22] explores the creation of virtual bus stops for DRT by comparing fixed and dynamic stop methods based on real-time bookings and OD similarity, finding that virtual stops reduce total travel time, improve operational efficiency, and enhance vehicle dispatch decision-making. The limitation of this research is that it only considers spatial-based clustering and does not take the time window into account.
The application of machine learning in ride-hailing services, such as taxi dispatch systems, has been widely studied, with numerous works exploring predictive models and optimization techniques to improve efficiency and service quality. However, despite growing interest in AI-driven mobility solutions, its application in ride-sharing systems, particularly DRT, remains limited. Unlike traditional ride-hailing, DRT involves shared vehicles and dynamic routing, requiring a distinct approach that considers factors like passenger pooling, real-time demand fluctuations, and vehicle capacity constraints. This study applies a decision tree-based approach for classifying service requests as “assign” or “reject” based on operational constraints. We find their importance value that contributes to the classification, and compare the results with the user preference in DRT fields based on previous research results. By doing so, the study highlights the potential of DTMs to enhance efficiency and accessibility in sharing.
Although there has been recent advancement in the application of machine learning in ride-hailing and urban mobility services, there is still limited research that compares machine learning-based dispatching models under varying fleet sizes in DRT systems. The majority of previous works have either conducted single-vehicle or aggregated system-level analysis without investigating how fleet size affects variable importance and request-matching efficiency. This gap is particularly relevant for small-scale DRT operations, such as university campuses or suburbs with low demands, where the optimal assignment of vehicles in different fleet scenarios is crucial to the service’s reliability and efficiency.
Therefore, this study investigates request-matching factors in DRT services using a Decision Tree Model under different fleet sizes (1–3 vehicles). By comparing the variations in feature importance and model performance under different fleet settings, this study provides novel knowledge on how fleet size affects dispatching decisions, contributing to both academic knowledge and real-world optimization of small-scale DRT systems.
2. Methodology
The methodology for this study focuses on data analysis and the development of a DTM for the classification of data to ‘Accept’ or ‘Reject’ and finds the relevant importance of the attribute that contributes to classification. The result is based on the data for the different fleet sizes. A DTM is a supervised learning algorithm used for classification and regression tree (CART) tasks [
23]. It represents decisions and their possible consequences using a tree-like structure, making it an interpretable and efficient method for decision-making.
2.1. Data Collection
This research utilizes actual origin-to-destination data from a shared bicycle system, named Elecle bicycle, to develop a dispatch system for a hypothetical DRT service, aiming to identify potential users and provide a safer transportation alternative. Bicycle-sharing systems are often used in low-demand areas as first- and last-mile solutions [
24,
25], connecting passengers to major transit hubs or local destinations. Since DRT serves a similar feeder role where fixed-route transit is less efficient, bicycle-sharing demand patterns can provide valuable insights into short-trip mobility and potential demand profiles for DRT, particularly in low-demand and first/last-mile contexts. As shown in
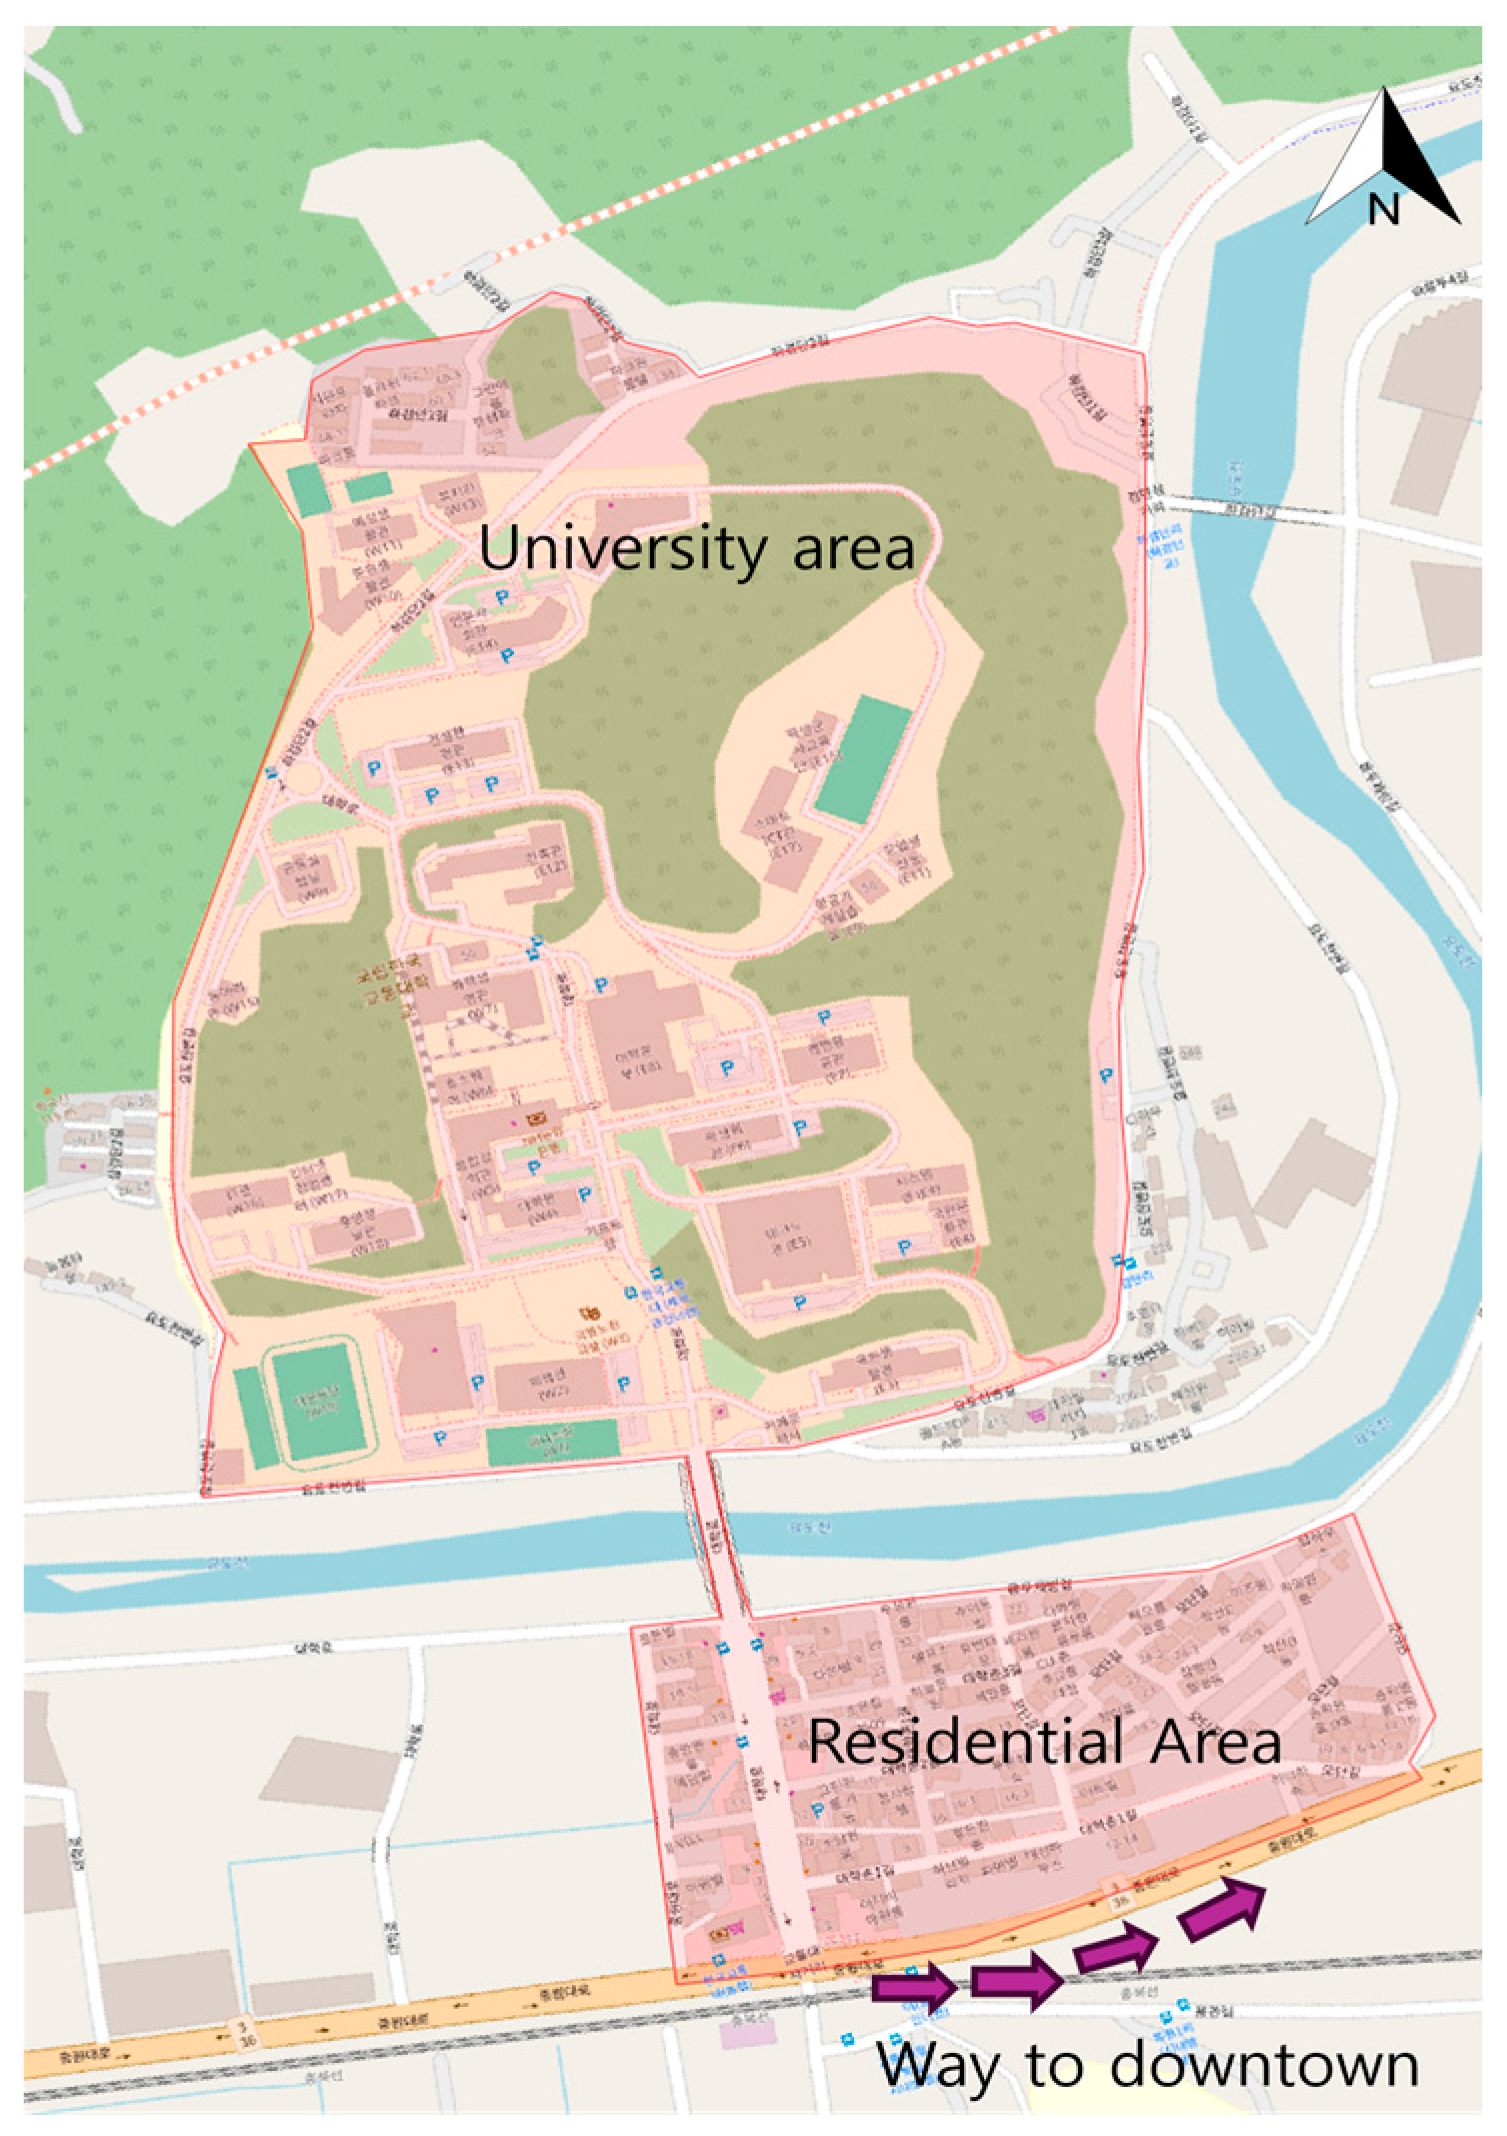
Figure 1, DRT plays a crucial role in enhancing connectivity within the study area. It links the university area to nearby downtown, ensuring that students and faculty can easily access broader public transportation networks.
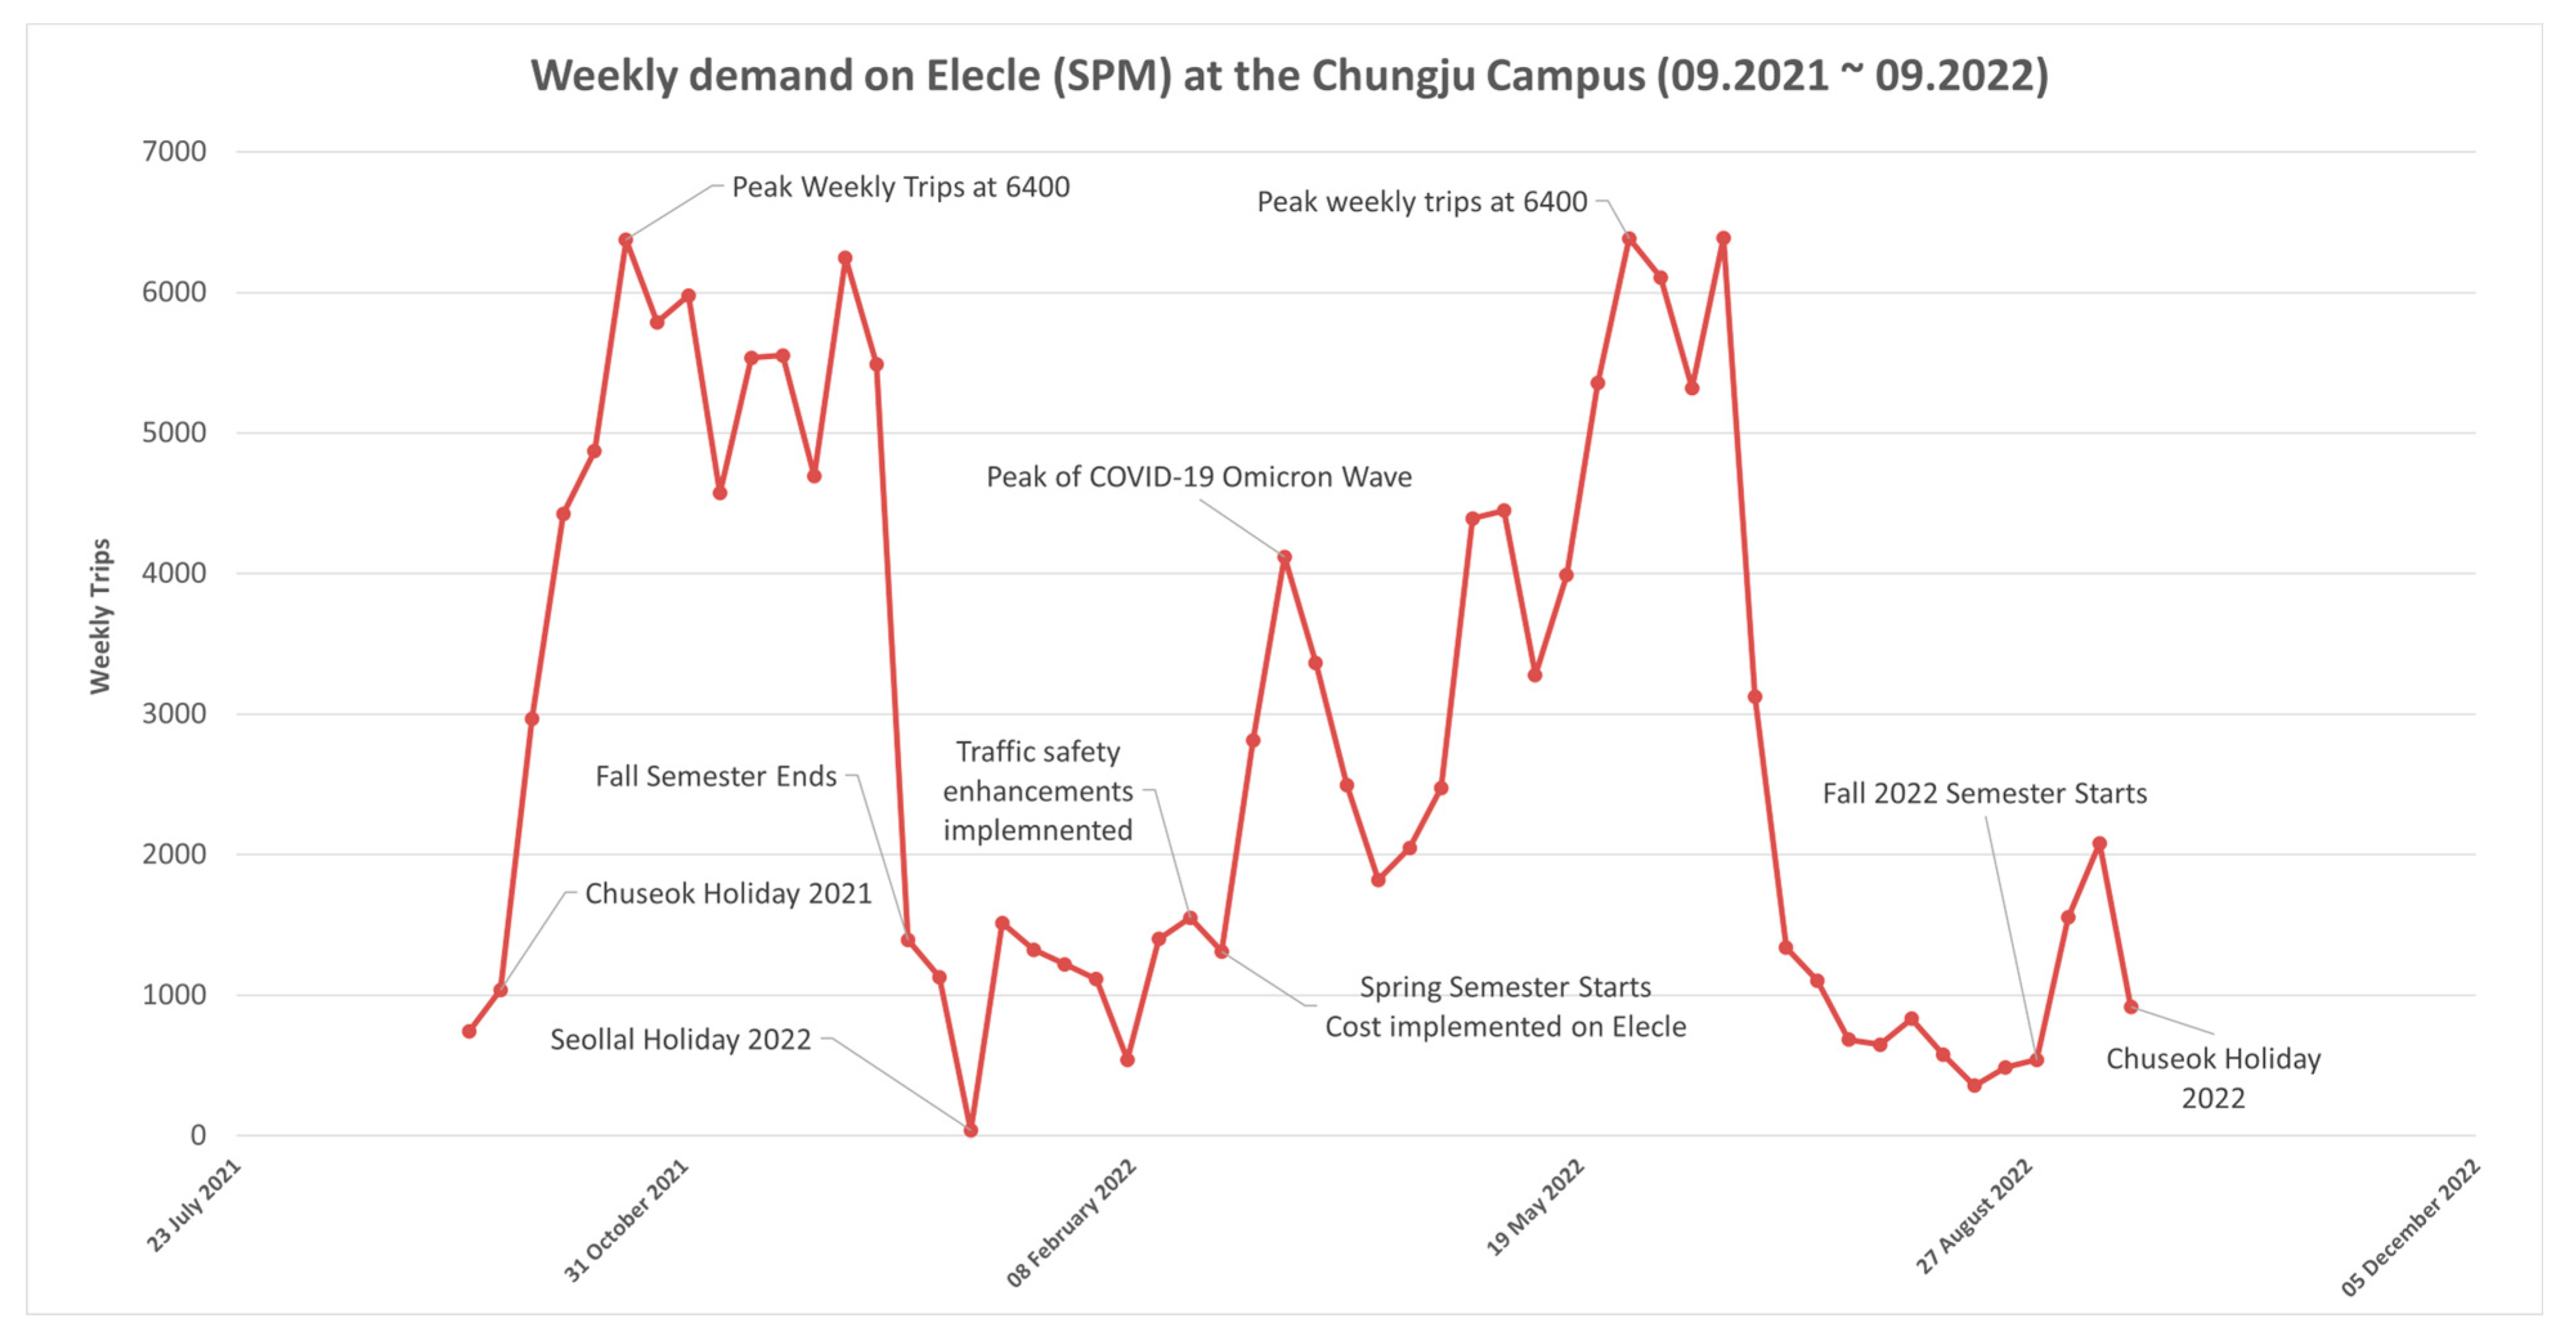
As shown in
Figure 2, a 12-month analysis (September 2021–September 2022) reveals seasonal demand variations, with peak usage in October and November and lower demand in January, February, July, and August due to semester vacations. Further examination of weekly and daily patterns indicates reduced demand on weekends and during semester breaks. These insights contribute to optimizing the DRT service by aligning availability with user demand trends.
The original Elecle bicycle dataset contains only trip origin, destination, start time, and end time, as users access bicycles directly by visiting the nearest parking location and scanning the QR code using the mobile application. The user parks the bike in the designated parking lot after completing the trip, and the user’s destination is unknown. Therefore, the dataset lacks records for access time, waiting time, egress time, and vehicle ETA. Examining the Elecle data, the origin and destination of travel are between two bicycle parking lots. This case is quite different from DRT, as calls can be requested from anywhere within the service area. All historical trips were successful, but DTM training requires both ‘Assign’ and ‘Reject’ classifications. To address these gaps and ensure a comprehensive analysis, a simulation was conducted to generate these critical attributes, allowing the model to capture real-world DRT operational dynamics. The absence of these essential variables in the Elecle dataset would significantly hinder the accuracy and functionality of the DTM. Thus, the dataset used in this study was simulated based on shared bicycle OD records. In the simulation, the origin and destination points are considered as the call request point and destination, respectively. Furthermore, a simulation approach ensures that the model reflects realistic DRT operations, where vehicle dispatching and passenger accessibility depend on dynamic factors such as vehicle availability, detours, and capacity constraints.
2.2. Simulation Framework
The dataset used in this study was generated using a custom-built simulation engine designed to emulate the real-time operations of an autonomous DRT system. The simulation was conducted within a defined testbed area covering the Chungju campus of KNUT and its surrounding community. Demand patterns were synthesized based on historical data from the Elecle bike-sharing system and were used to model trip requests with spatial and temporal realism.
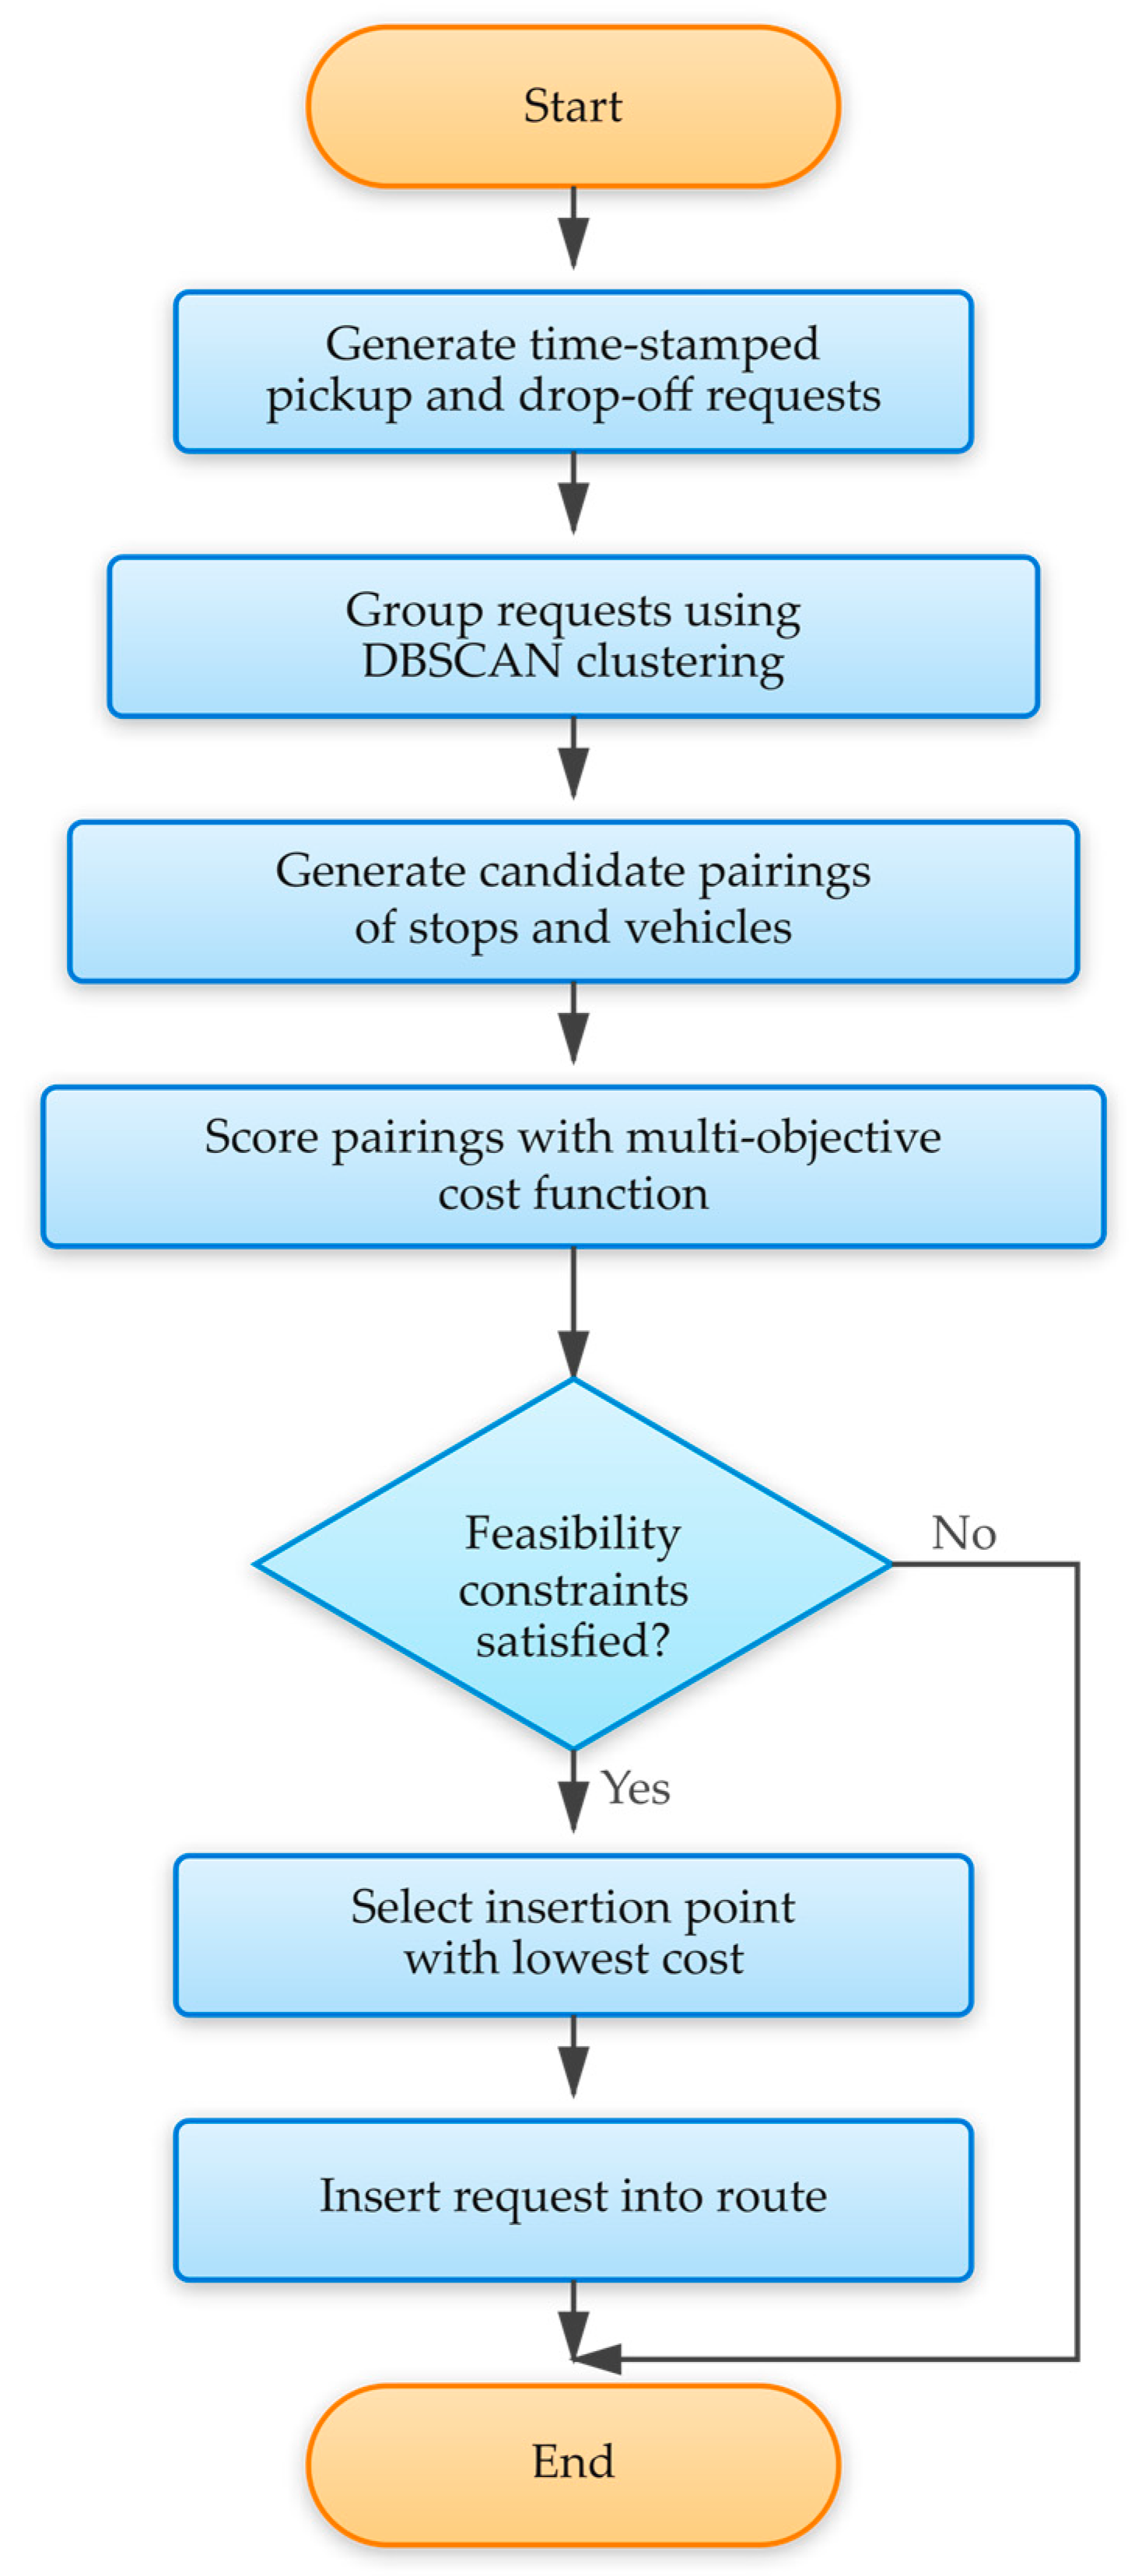
The simulation replicates a live dispatching system by generating time-stamped pickup and drop-off requests that follow spatial-temporal distributions informed by the Elecle dataset. Vehicles operate within a predefined Operational Design Domain (ODD), with fixed seating capacities and routing logic. Each incoming request is dynamically evaluated and either assigned or rejected using a multi-objective heuristic insertion, subject to strict feasibility constraints.
Initially, trip requests are grouped using a modified DBSCAN clustering algorithm that accounts for the spatial proximity of origins and destinations. Requests that fall outside cluster boundaries are handled independently. The simulator generates multiple candidate pairings of virtual stops and vehicles for each clustered or individual request. Each pairing is scored using a multi-objective cost function that incorporates several factors, including walking time to the pickup point, expected wait time, estimated ride duration, vehicle detour distance, passenger occupancy, and the projected impact on current onboard passengers. A customized insertion heuristic evaluates the cost of incorporating the new stops into existing routes. Pairings with favorable scores are then subjected to feasibility checks.
Requests are only accepted if they satisfy hard constraints, including vehicle capacity limits, a maximum wait time of 600 s, a ride time not exceeding 600 s, a walk distance to the virtual stop of no more than 350 m, vehicle access time within 600 s, and a maximum delay of 300 s imposed on existing passengers. Once a feasible candidate is identified, the routing module computes all possible route insertion points and selects the one with the lowest weighted insertion cost. This cost is calculated using the following formula:
where β
1 and β
2 represent the weighting coefficients that determine the relative importance of travel time and passenger impact, respectively. ΔTravel Time denotes the increase in total travel time caused by inserting a new request, while Passenger Impact refers to the cumulative additional delay imposed on existing passengers due to the adjusted route. If no feasible insertion point is found, the request is labeled as rejected. Traditional insertion algorithms in dial-a-ride problems have consistently focused on minimizing travel time and operational costs. Research has established classical insertion heuristics based on the earliest pickup time and minimal travel time increase [
26]. Studies have demonstrated that route planning approaches concentrated on minimizing travel time and distance yield optimal performance [
27]. Recent work has explored regret-based insertion methods to effectively reduce travel time in large-scale systems [
28]. However, existing approaches tend to treat passenger experience as a secondary consideration, incorporating it only through hard constraints such as ride time limits and time windows, rather than integrating it directly into the objective function. To address this research gap, the present study introduces a dual-objective insertion cost function designed to systematically balance travel time efficiency (weight = 0.75) and passenger impact (weight = 0.25), thereby advancing a user-centric optimization framework for dynamic vehicle routing. The selected weighting factors were determined through a sensitivity analysis in which various combinations of weight distributions were examined to identify the most effective trade-off between operational efficiency and passenger convenience, as shown in
Figure 3. The simulation utilizes three algorithms: a clustering algorithm based on O-D similarity, the virtual stop, and the vehicle assignment algorithm, as well as route management and stop insertion algorithms. There are already some research studies related to DRT Simulation in this area (KNUT). A study to determine virtual stops for pick-up and drop-off in DRT was conducted using shared bicycle data [
22]. The candidates’ virtual stops were selected from the locations that the vehicle can access and legally stop, and for the request handling, it selects the virtual stops by identifying the nearest link, balancing passenger walking time with vehicle arrival (Δt ≈ 1), and minimizing ETA to the destination. The total travel time values were compared between fixed stops and the virtual stops scenario. There is an absence of a time window in this paper, which limits the ability to group requests and optimize fleet utilization through shared stops [
29]. A hybrid approach was used to overcome limitations in real-time dynamic routing by combining reinforcement learning and a genetic algorithm. This study assigns stops within 400 m and groups nearby requests. Routing uses RL with a reward balancing local travel cost and global efficiency, and GA with a fitness function minimizing total walking, waiting, and ride times for optimal real-time routing.
2.3. Sensitivity Check on the Weightage Factor of the Insertion Cost
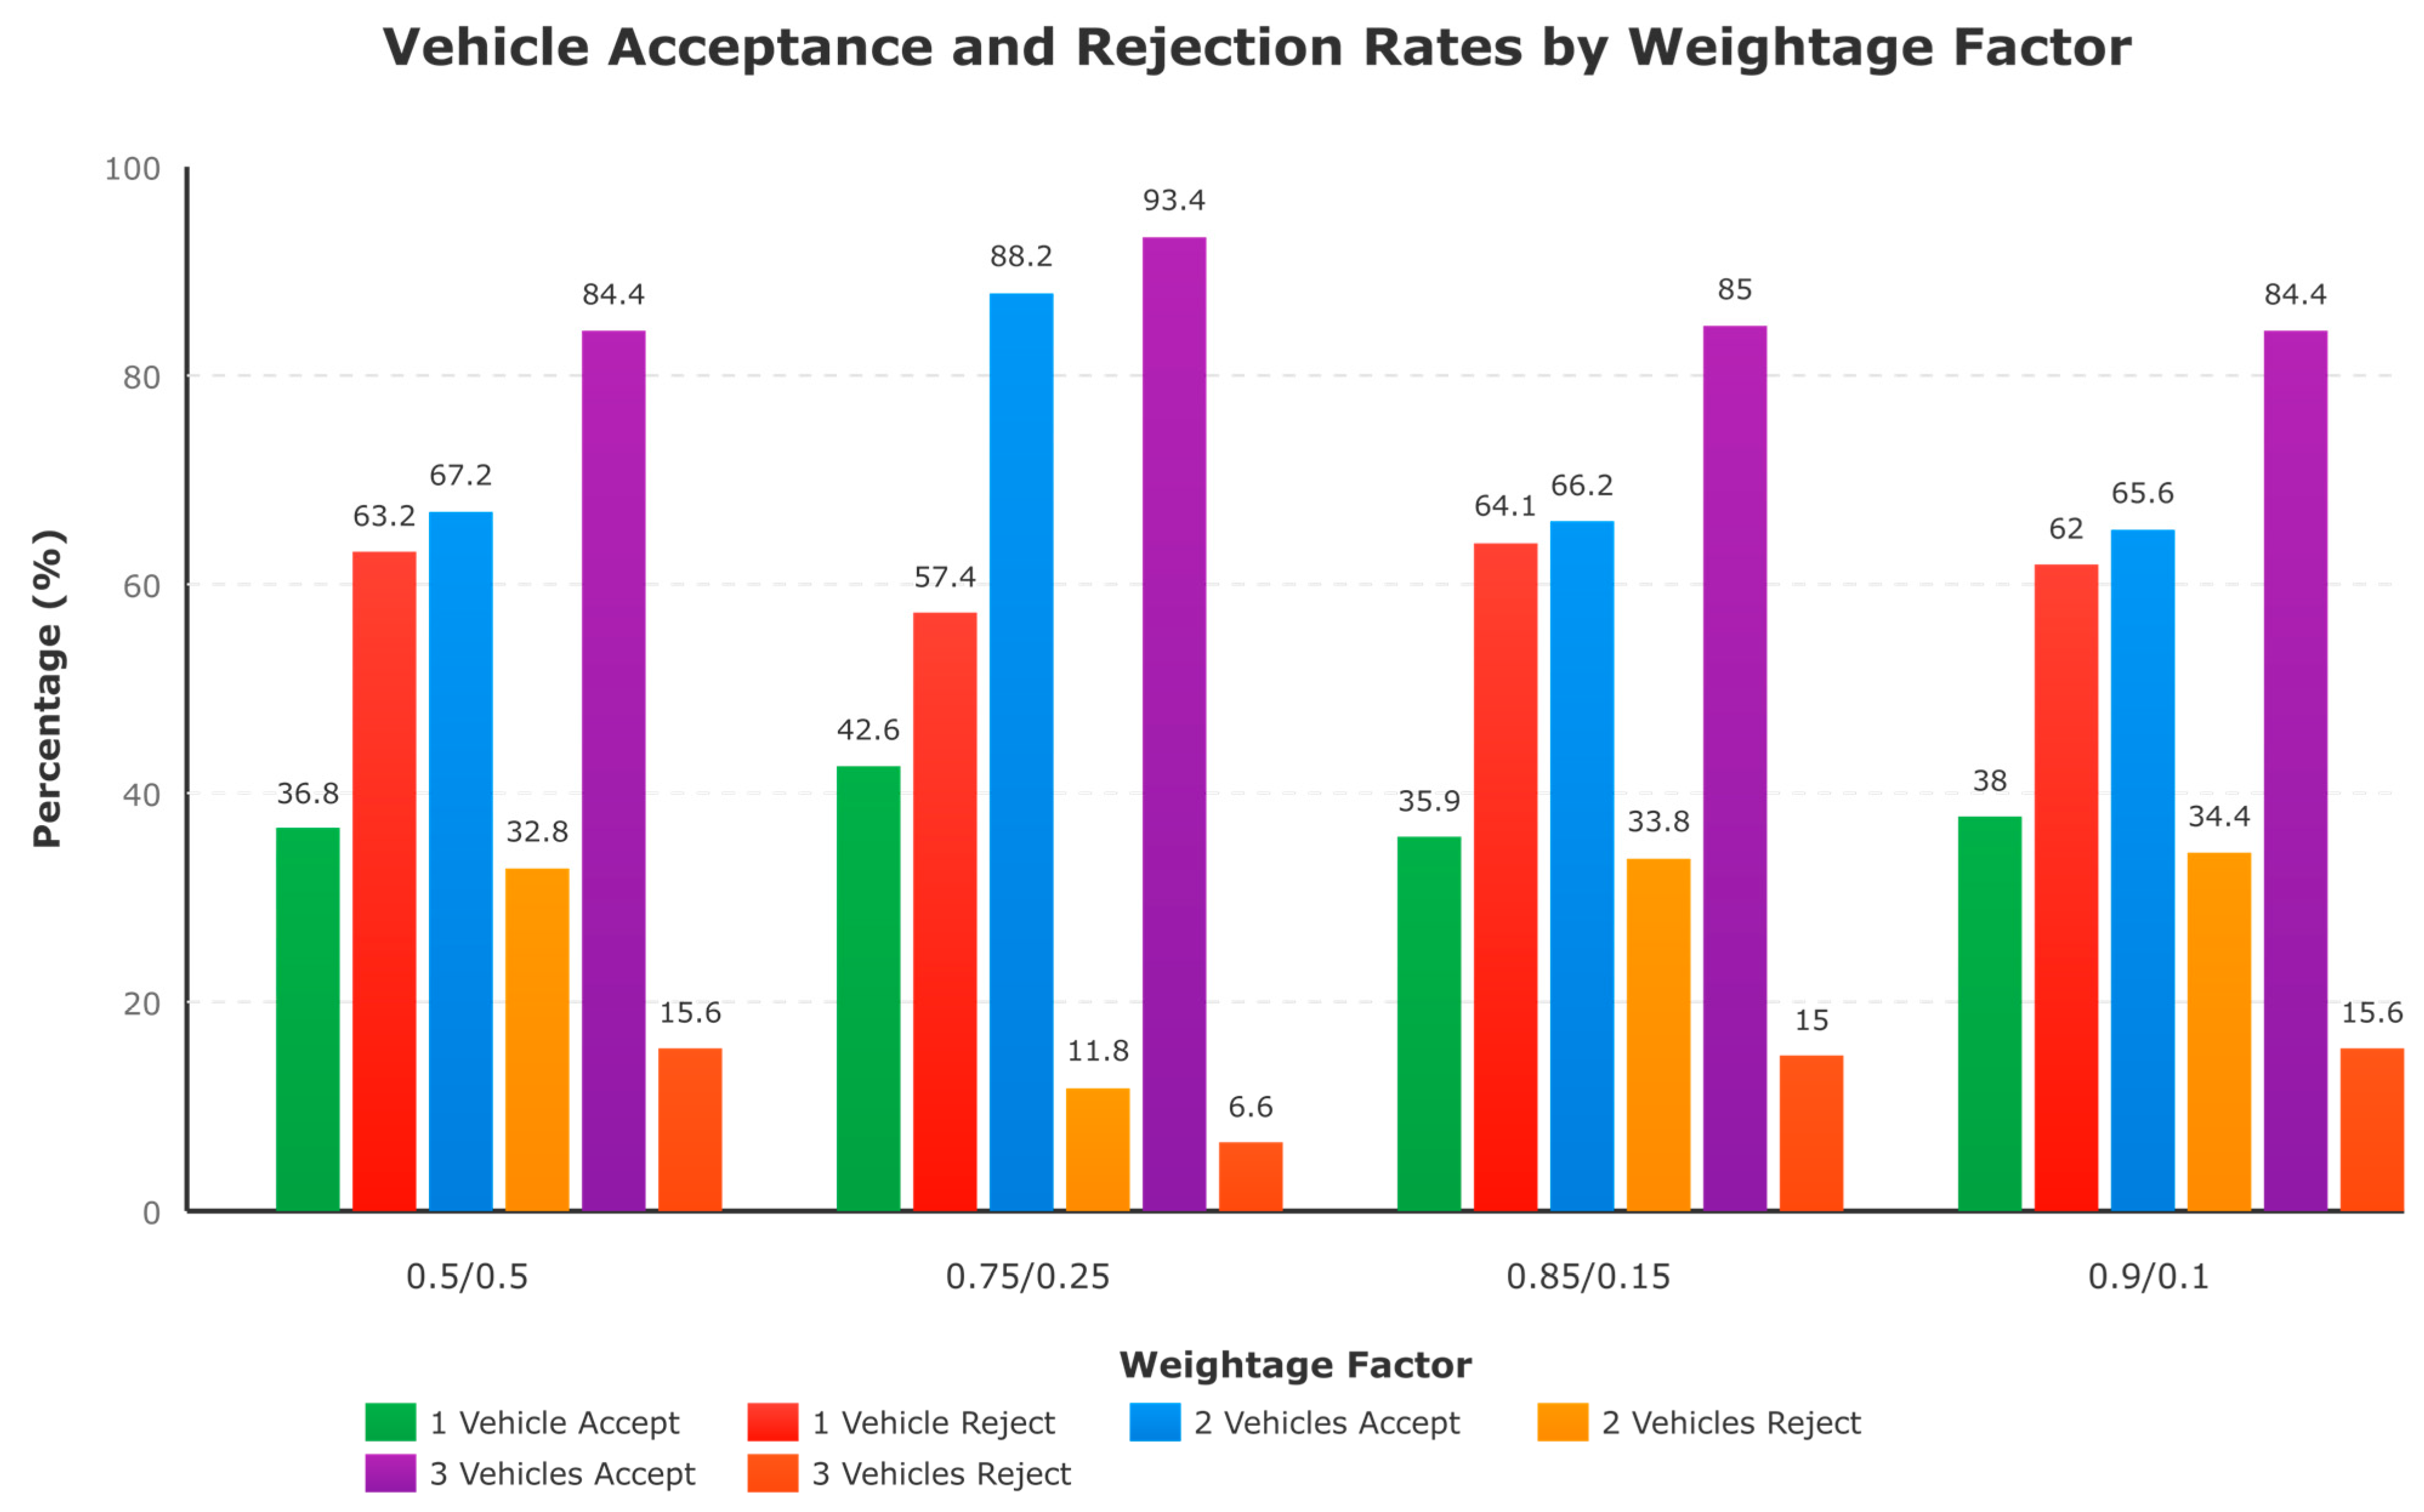
A sensitivity analysis was conducted to examine the effect of the weighting factors used in Equation (1) on the simulation outcomes. Four weight configurations (0.5/0.5), (0.75/0.25), (0.85/0.15), and (0.9/0.1) were tested to observe changes in acceptance rate (shown in
Figure 4), waiting time, walking time, and overall operational efficiency. The baseline configuration (0.75/0.25) was chosen to represent a balanced trade-off.
The results indicated that increasing the weight on travel time (e.g., 0.9/0.1) improved system efficiency but slightly reduced passenger-related performance measures. In contrast, more balanced ratios (e.g., 0.5/0.5) led to fairer outcomes at the cost of longer travel times. The 0.75/0.25 configuration reflects a pragmatic compromise between operator efficiency and user satisfaction. A higher β1 (travel time weight) prioritizes minimizing system-level travel time and fleet circulation, ensuring efficient dispatching and reduced operational cost. However, maintaining a smaller β2 (0.25) still preserves sensitivity to passenger delay, thereby avoiding excessive detours or long waiting times for existing passengers.
Empirically, this weighting produced stable and realistic acceptance–rejection patterns across different fleet sizes, avoiding both the overly conservative tendencies of high β2 settings and the aggressive acceptance patterns of very high β1 configurations (e.g., 0.85/0.15 or 0.9/0.1). Therefore, the 0.75/0.25 combination can be considered optimal for dynamic vehicle routing where both travel-time efficiency and passenger experience must be jointly optimized.
The simulation was divided into 3 scenarios based on the number of vehicles in operation (1, 2, and 3). The low rejection rate (11.8%,6.6% for 2 and 3 vehicle scenarios, respectively) primarily resulted from the simulation design and the increasing fleet size. As the number of vehicles increased, service coverage and matching efficiency improved, naturally reducing the number of rejected requests. In addition, the moderate user tolerance parameters, 600 s for maximum waiting time and 350 m for walking distance, enabled most requests to be served feasibly within the compact study area. These combined factors contributed to the observed class imbalance between assigned and rejected requests. Such an imbalance can cause machine learning models to be biased toward the majority class (accepted requests), reducing their ability to correctly identify and learn from the minority class.
2.4. Model Selection Rationale
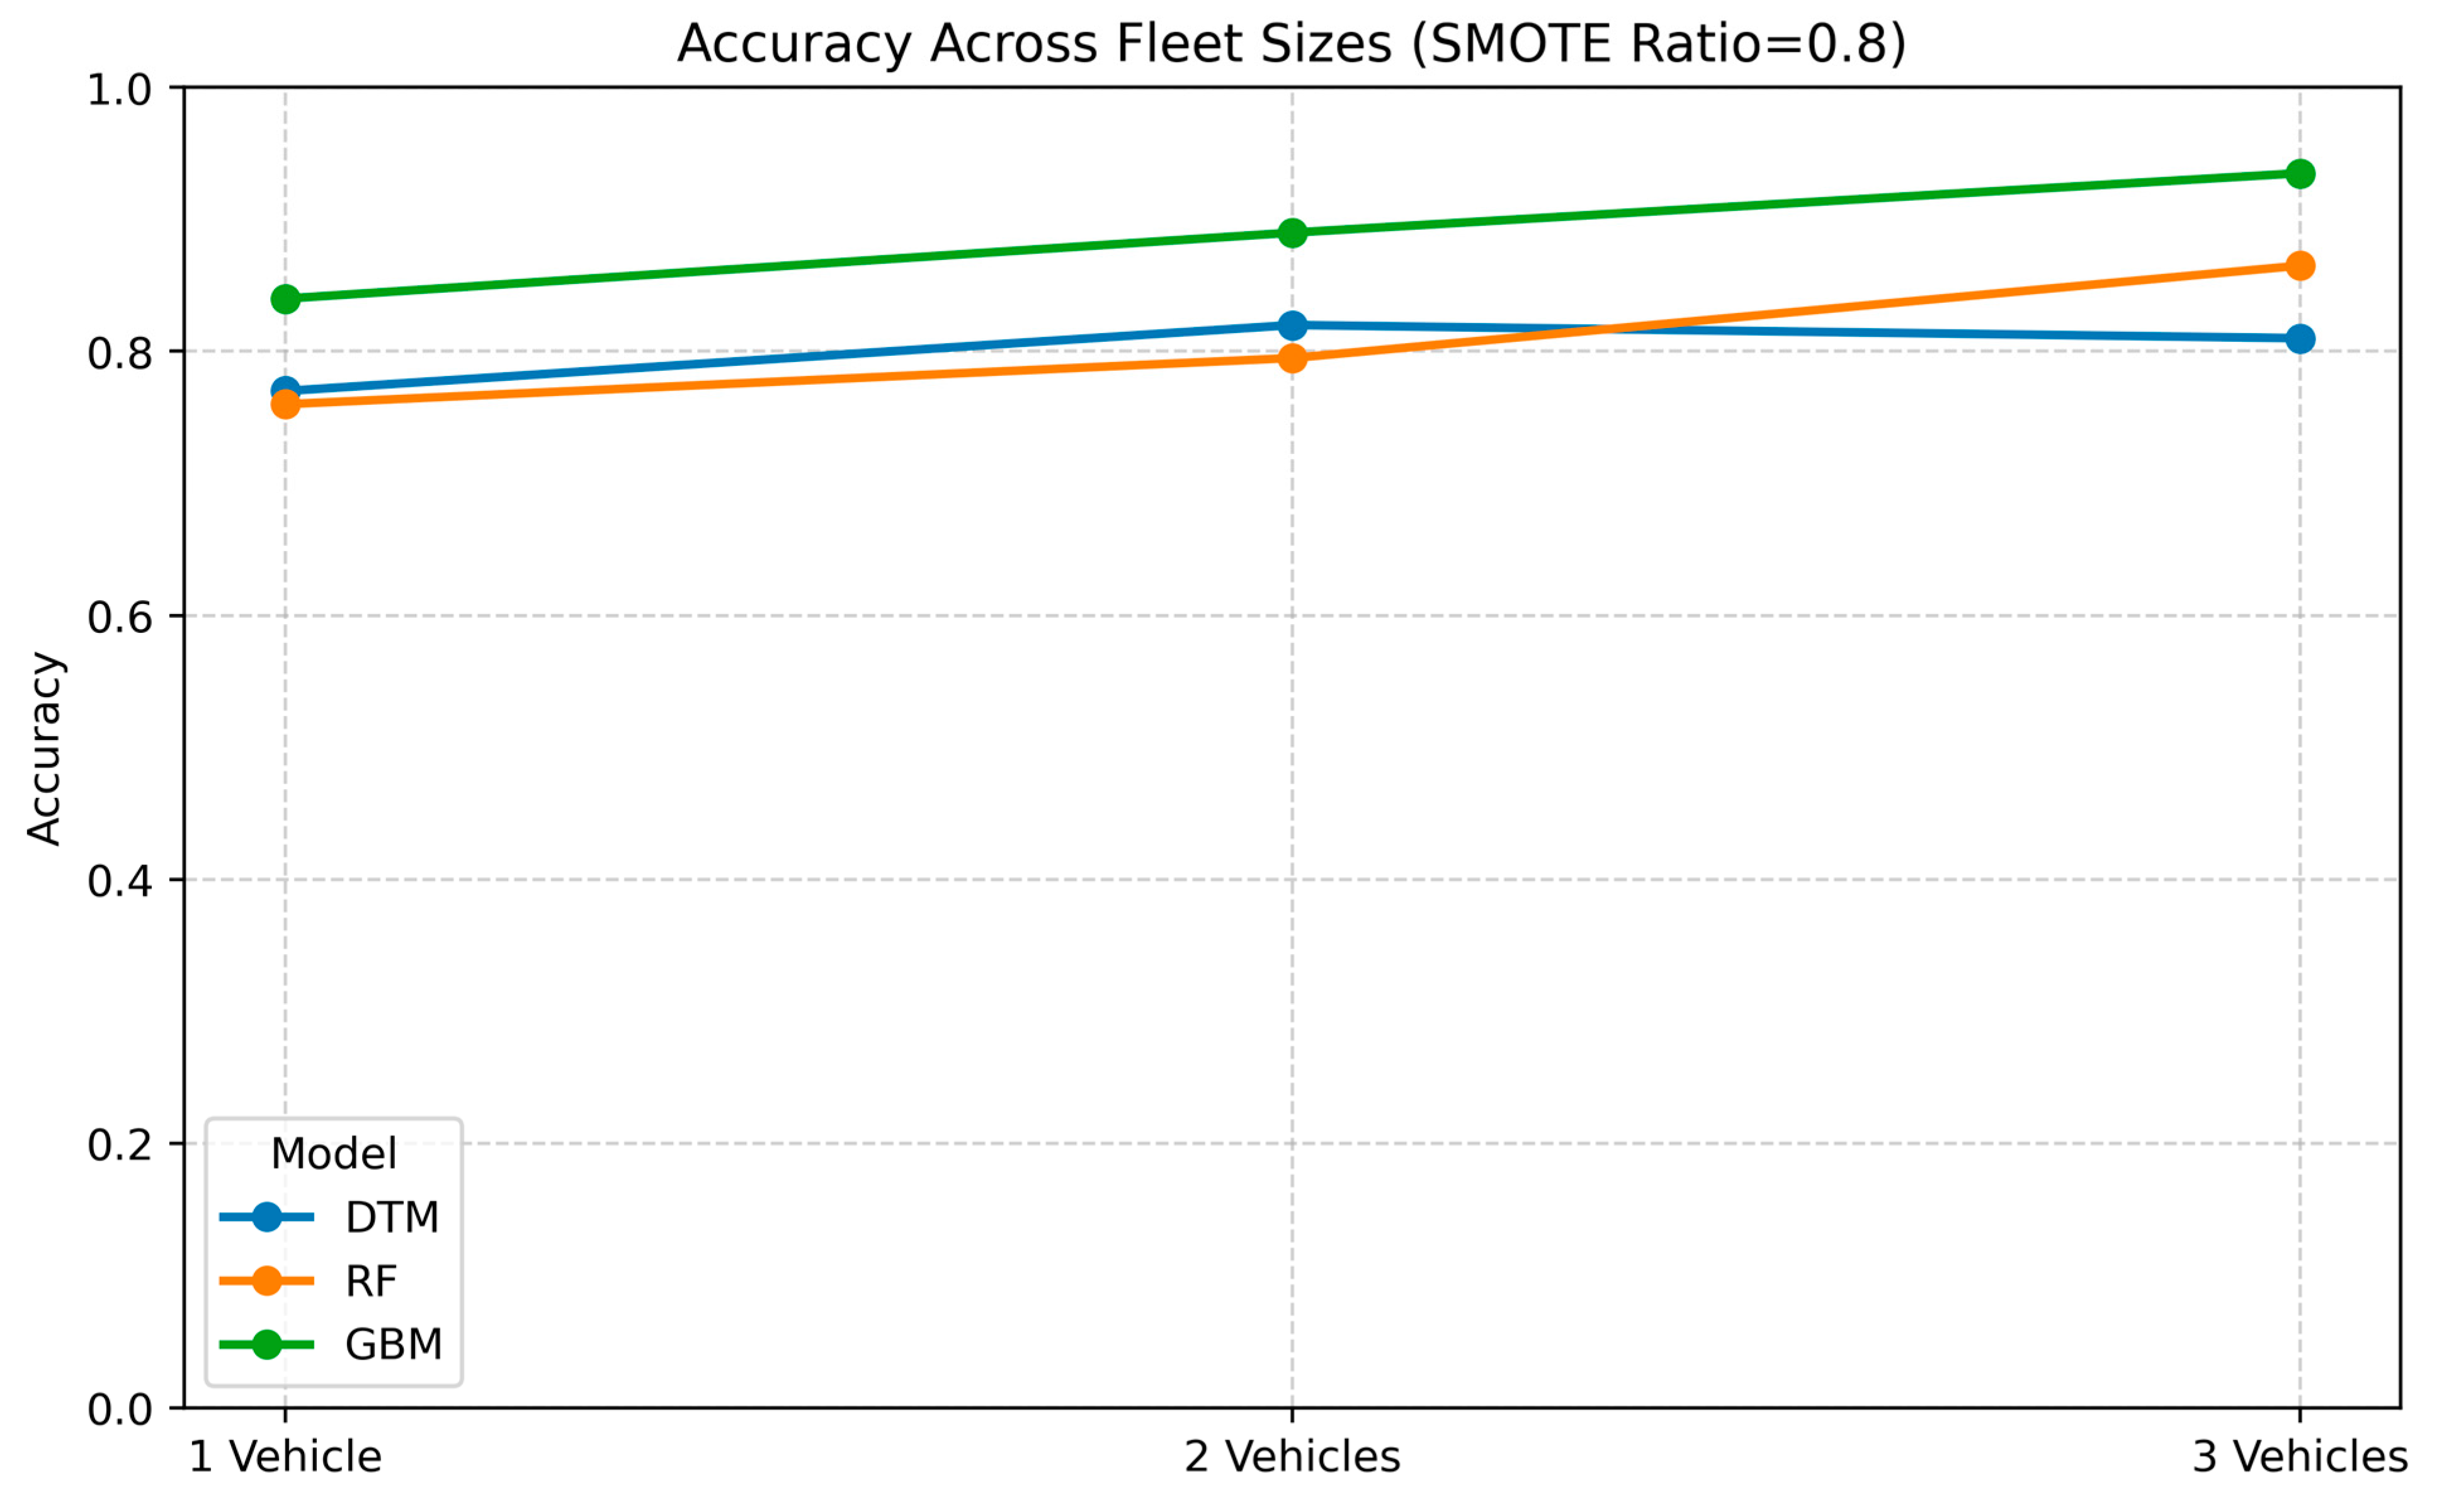
The comparative analysis revealed that Gradient Boosting Machine (GBM) achieved the highest accuracy across all scenarios (0.84–0.935), followed by Random Forest (0.76–0.865), while the DTM demonstrated competitive performance (0.77–0.82). Although ensemble methods outperformed DTM by 7–15% in multi-vehicle scenarios, the performance gap was minimal for single-vehicle detection, with only 0.01–0.07 accuracy point differences observed.
Despite lower accuracy scores, the DTM was selected due to its superior interpretability and practical advantages. The model’s transparent structure enables explicit feature importance analysis and clear decision rule extraction, which are critical for stakeholder communication and regulatory compliance in transportation applications. Furthermore, DTM’s computational efficiency and reduced complexity make it suitable for real-time deployment. The modest accuracy trade-off was considered acceptable given the substantial gains in model explainability and operational feasibility.
Figure 5 shows the accuracy of DTM, RF, and GBM on different fleet sizes.
2.5. Feature Engineering and Independent Variable Selection
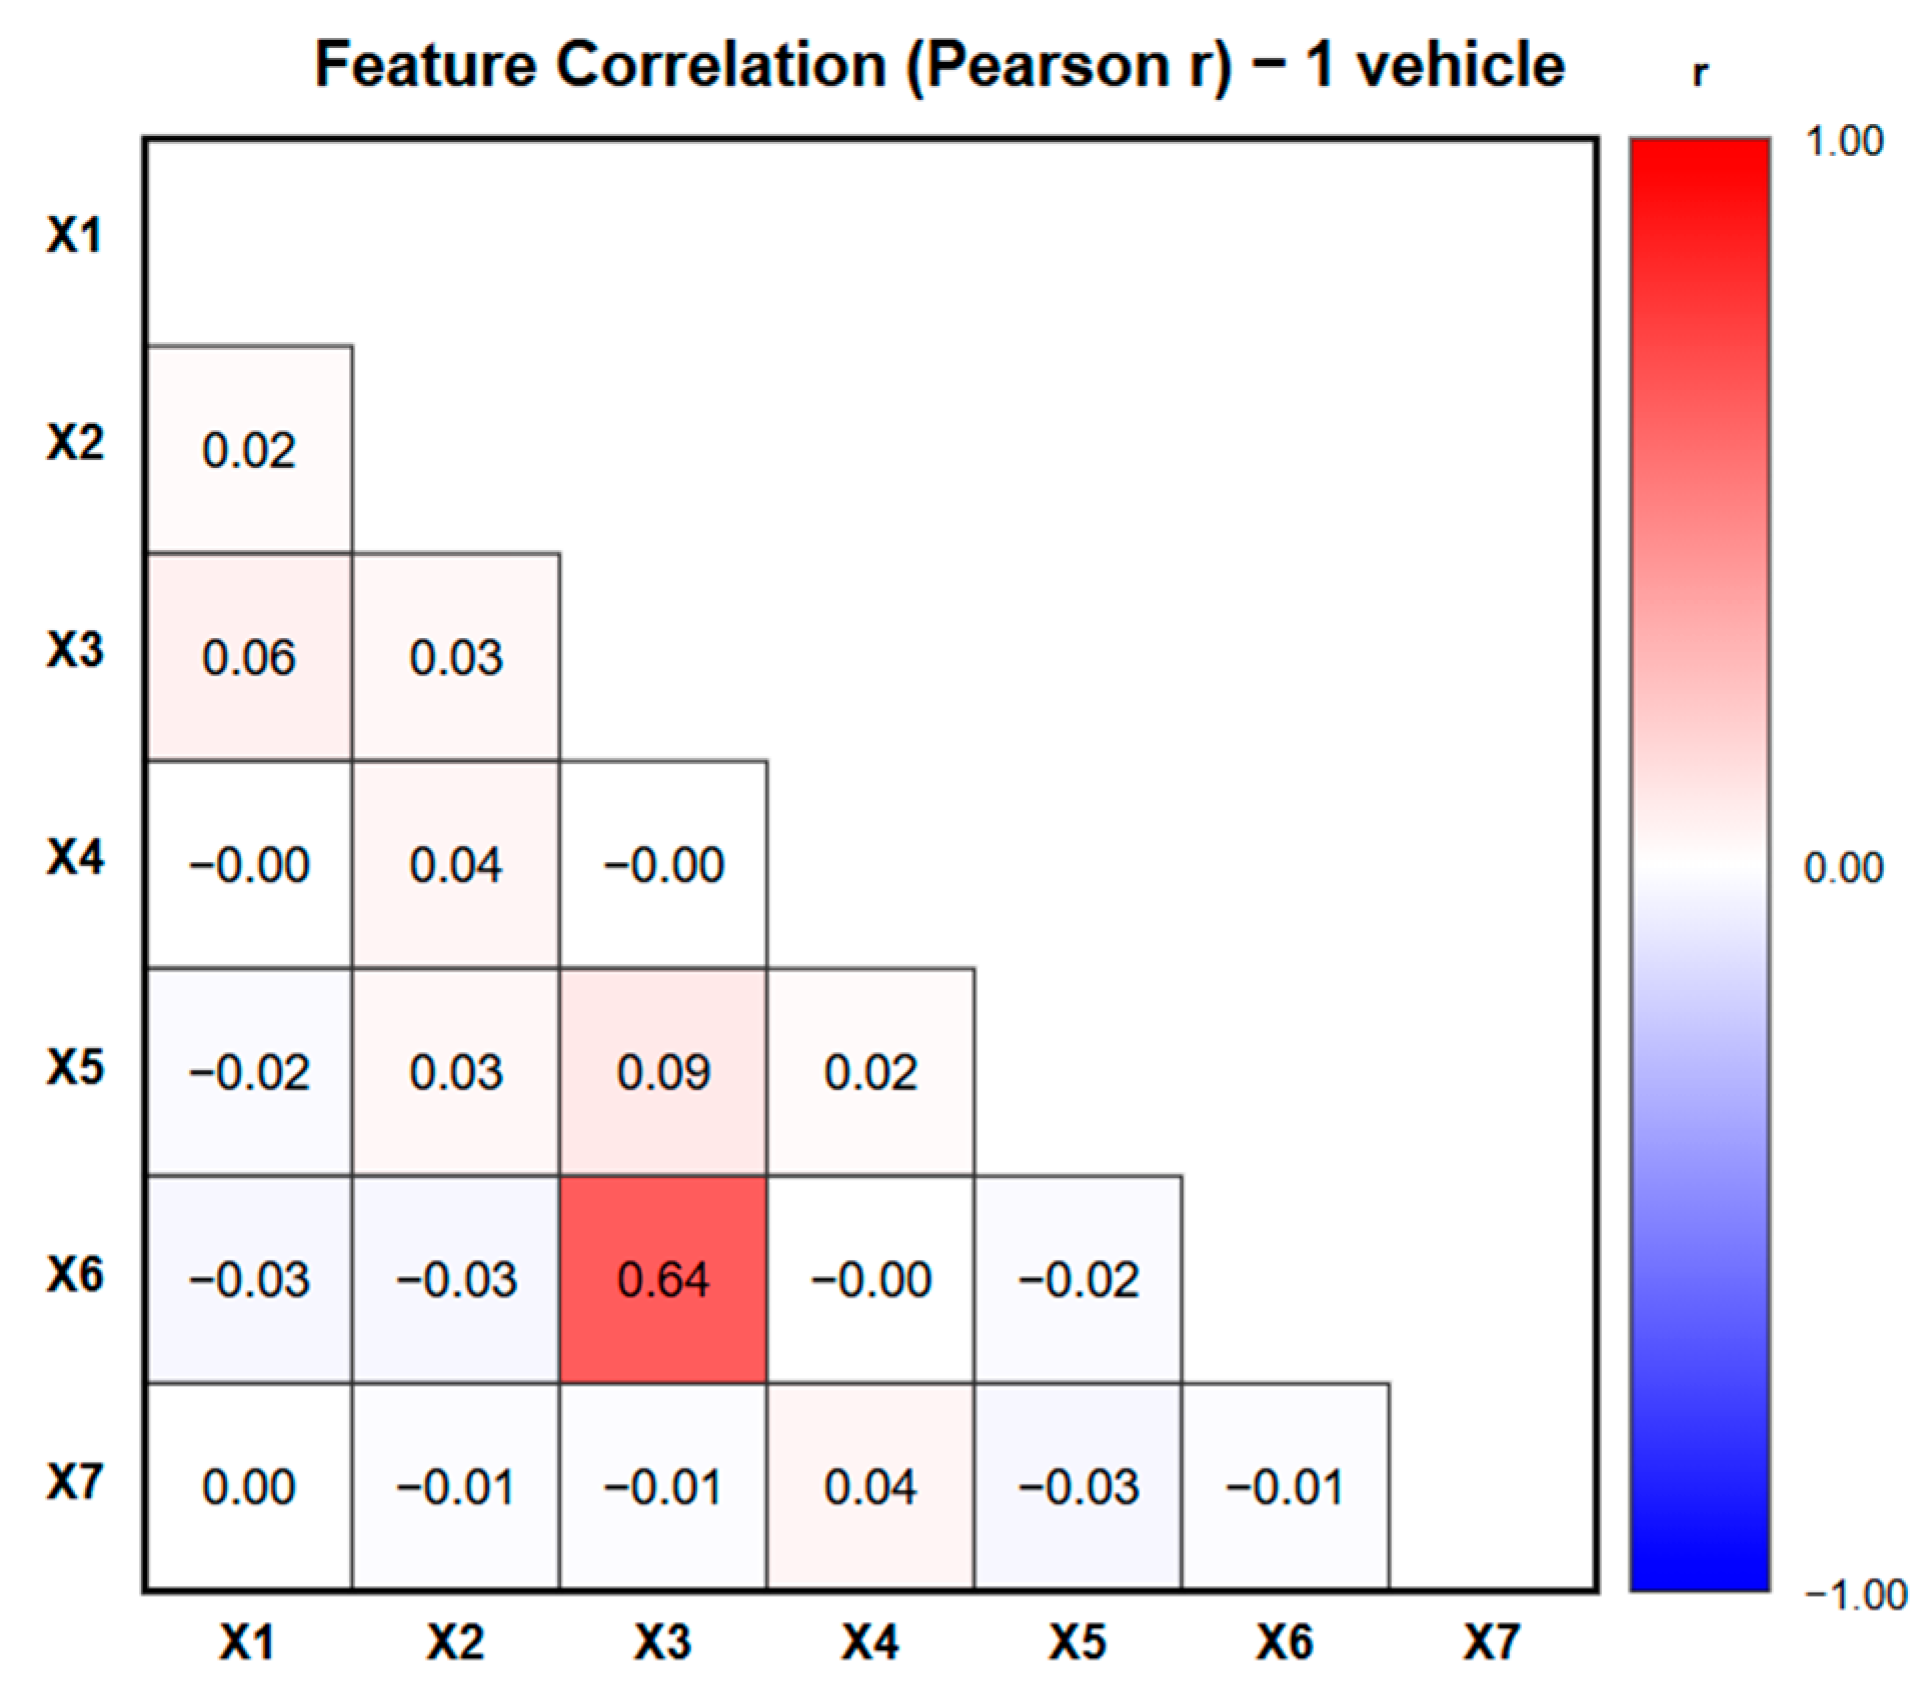
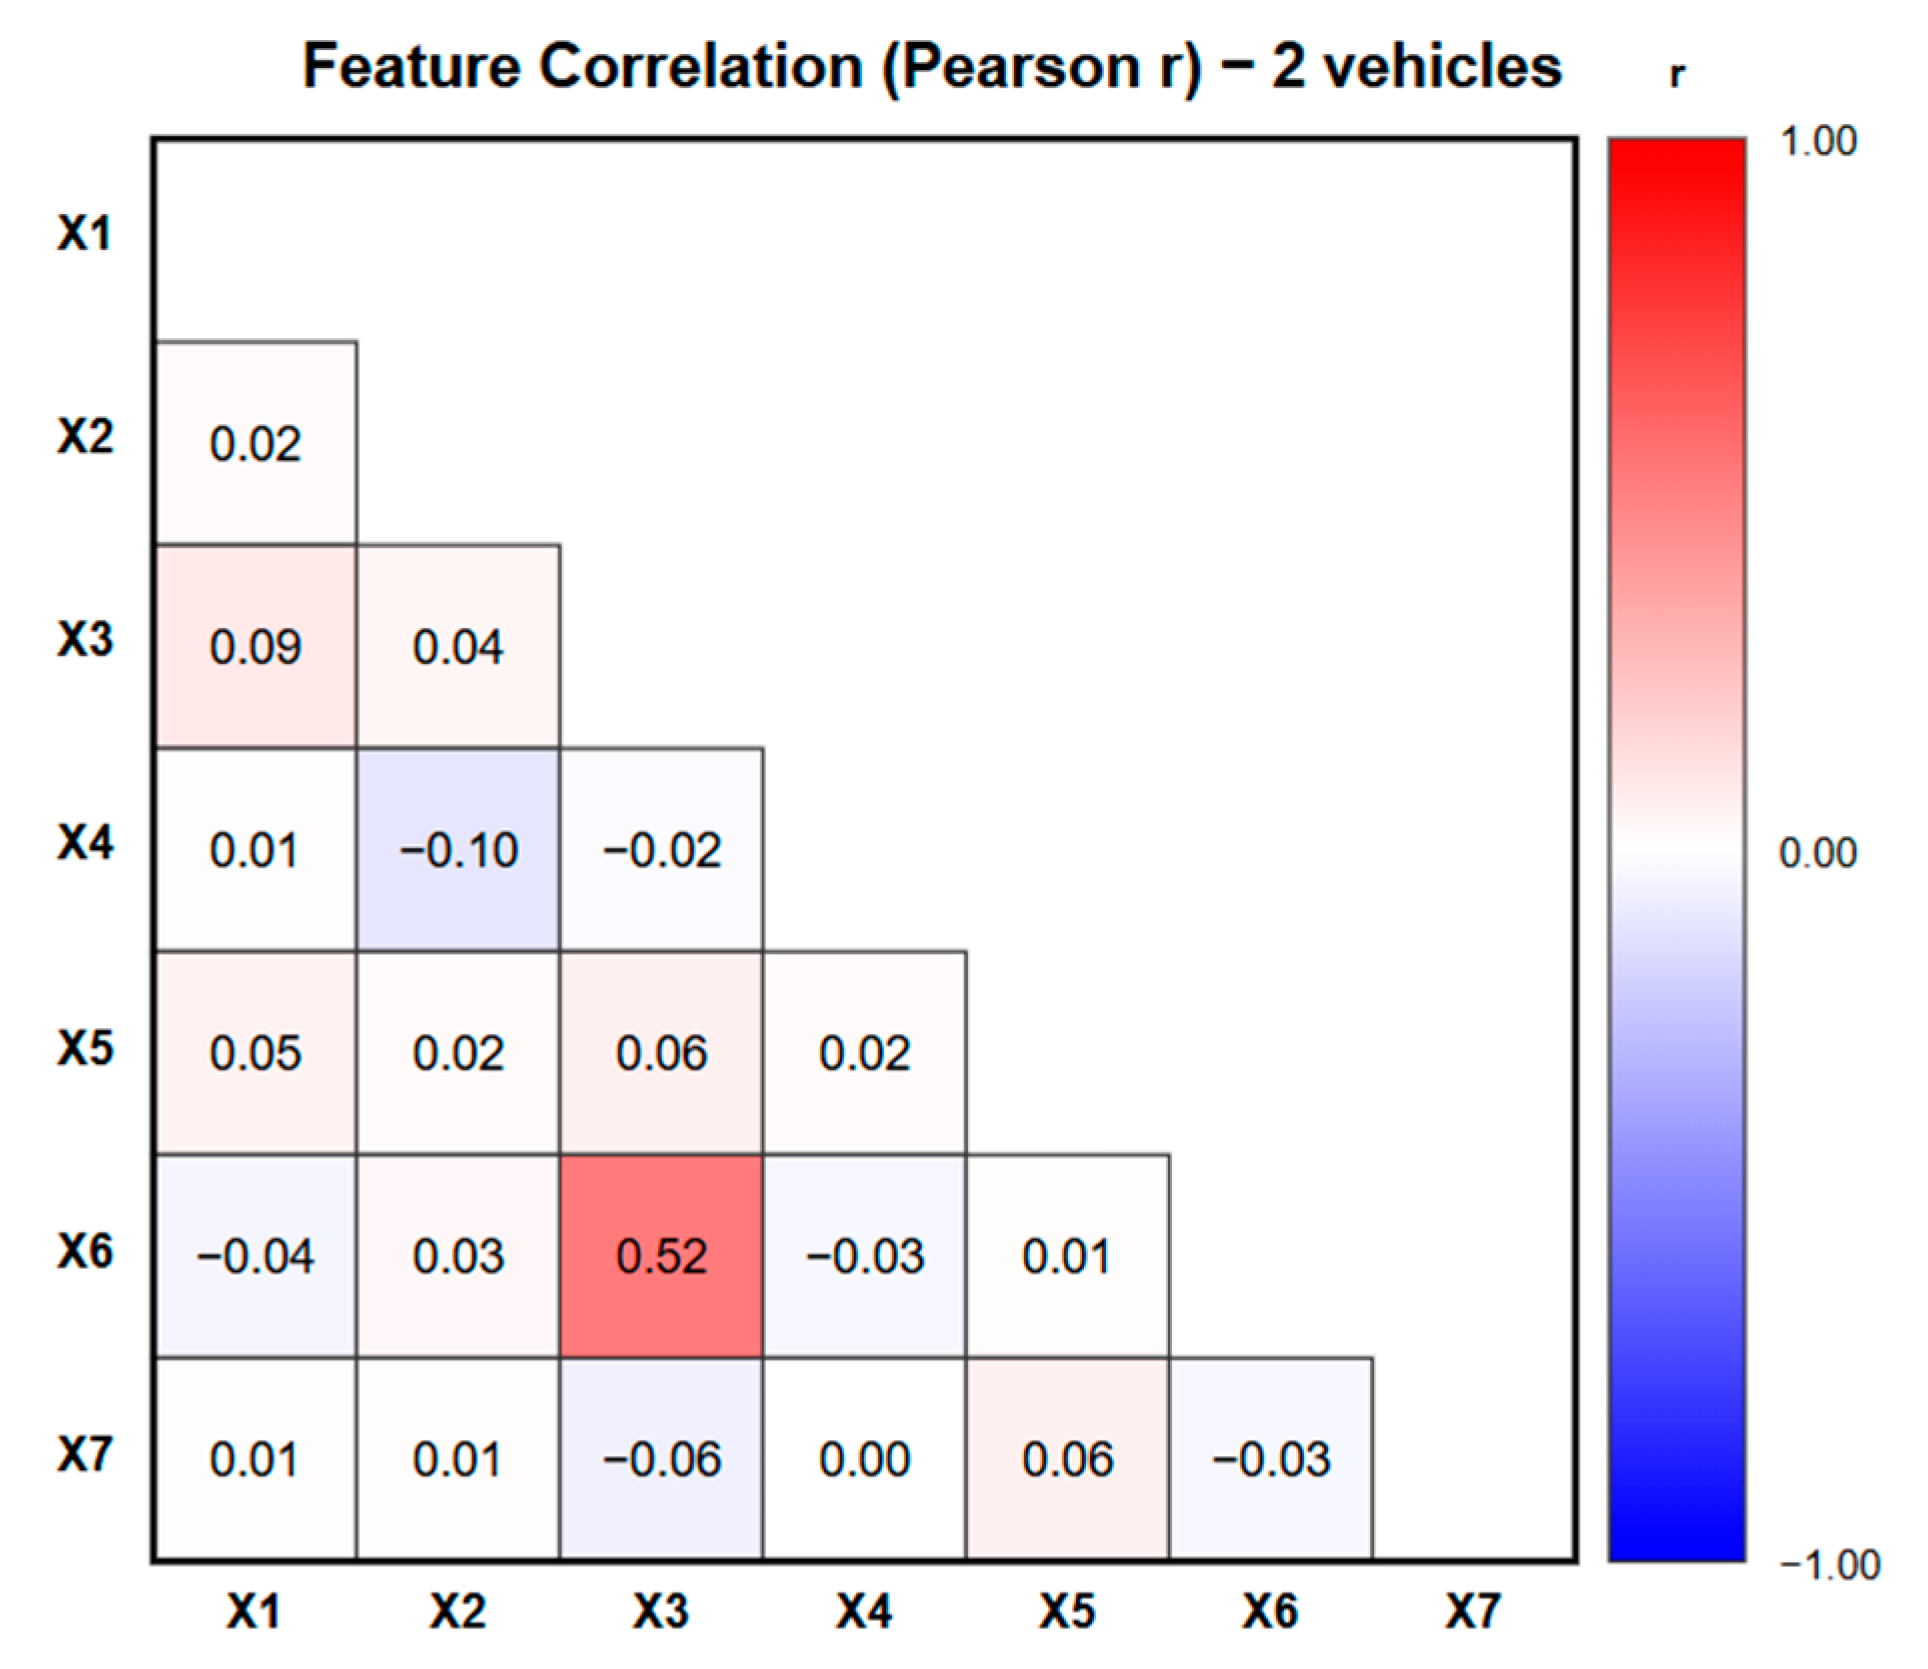
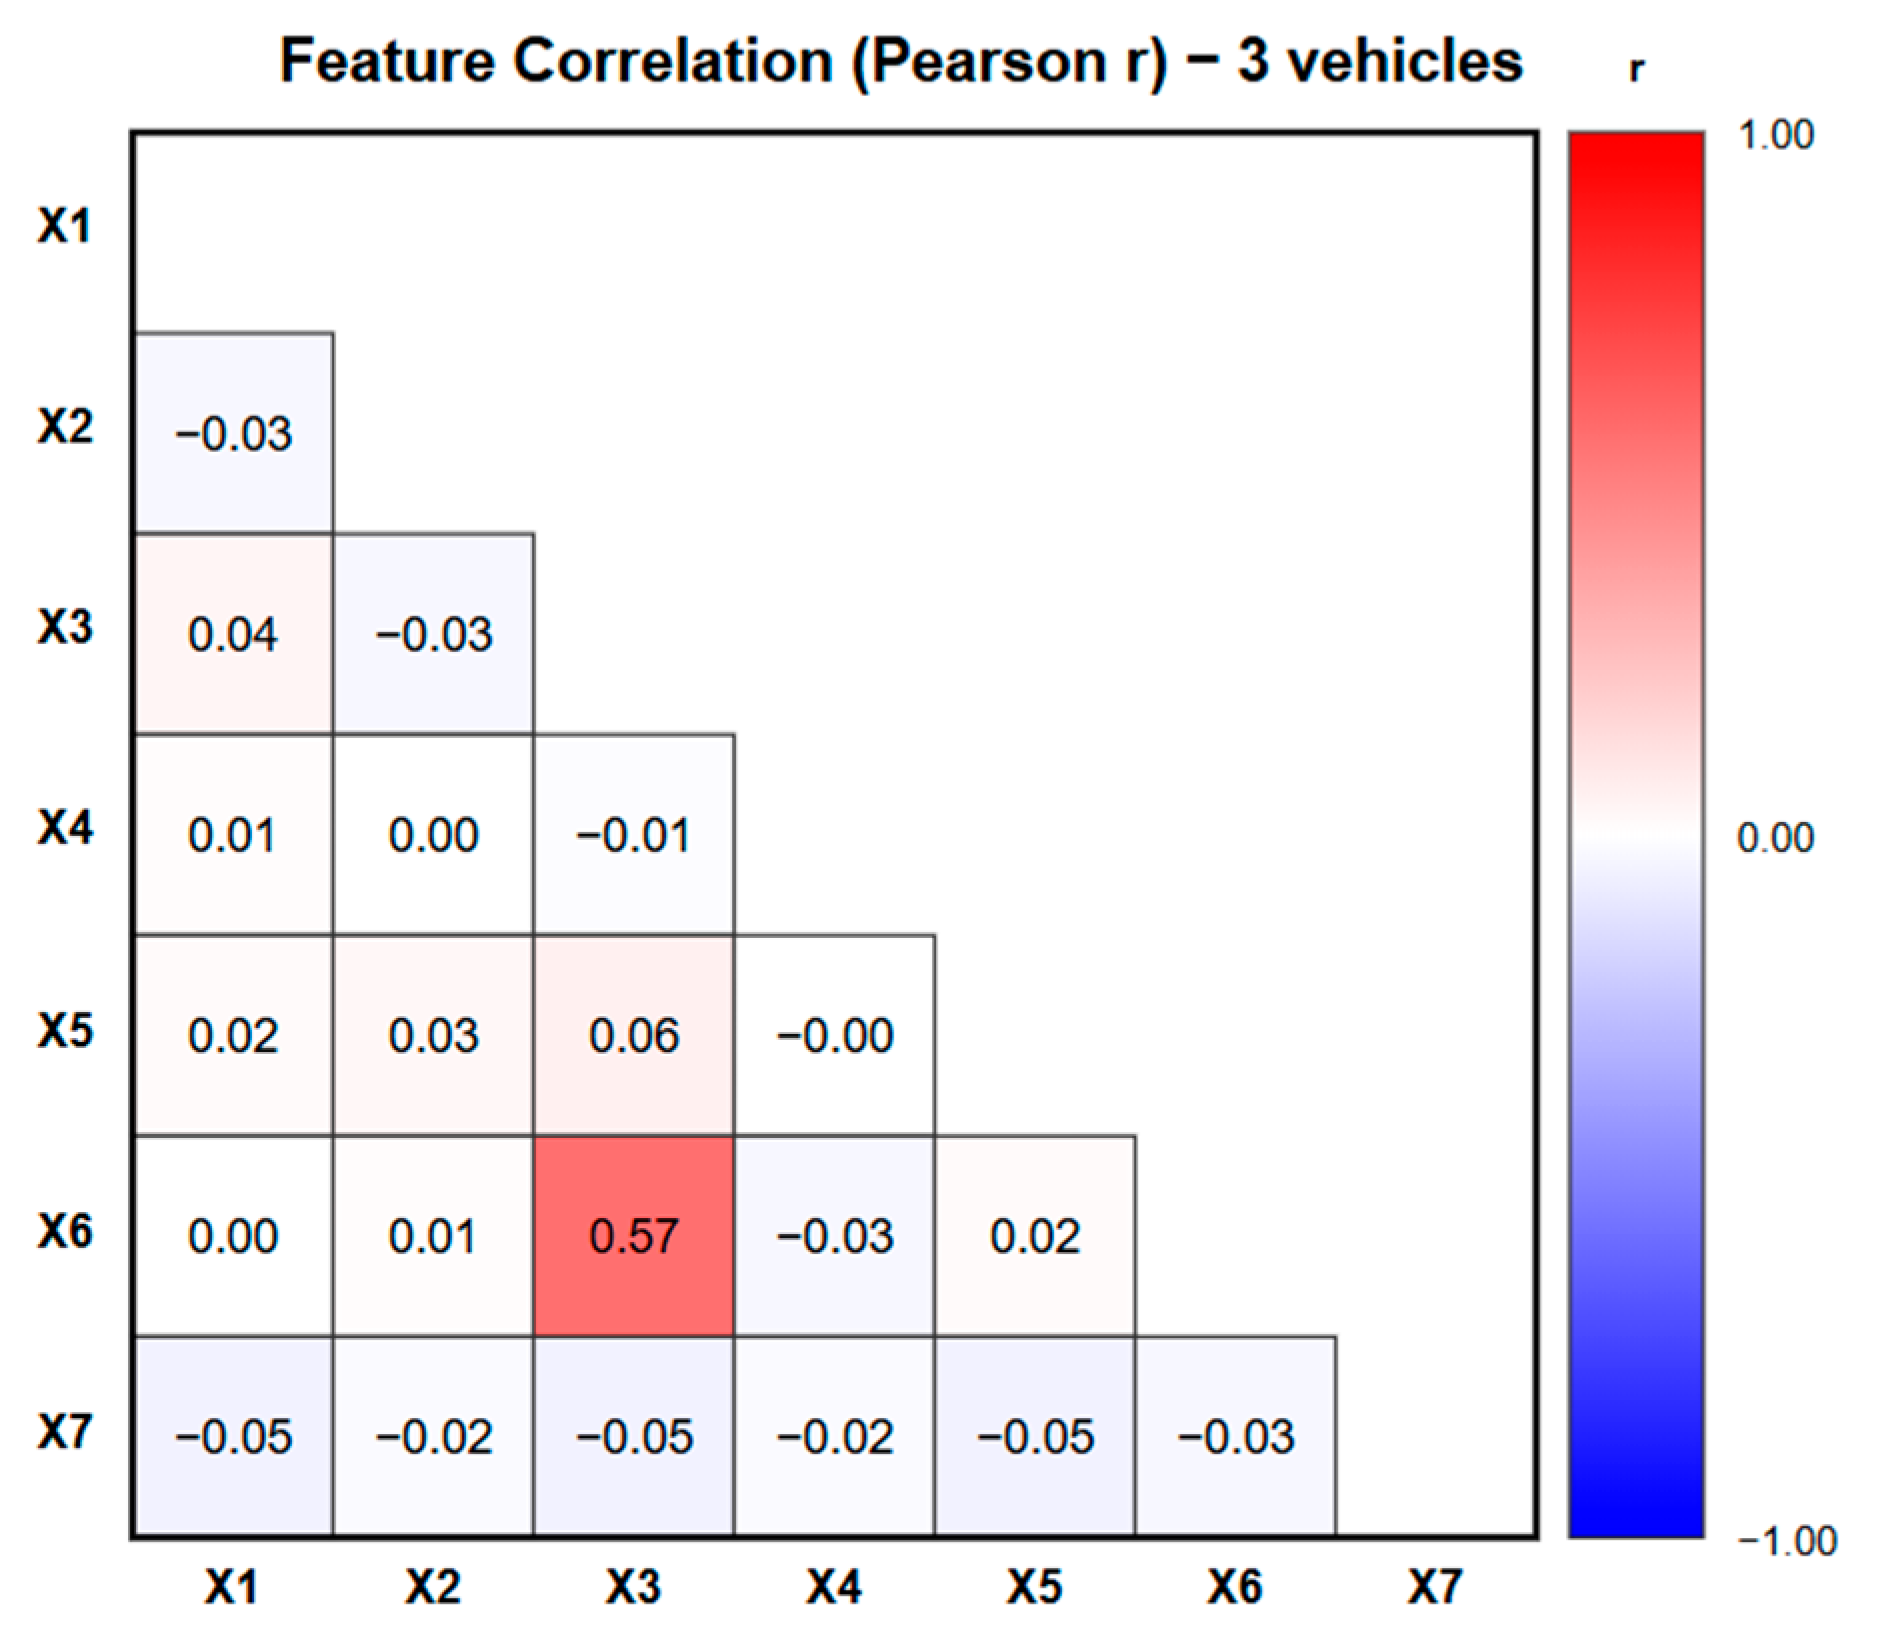
Before developing the machine learning models, a feature correlation analysis was conducted to examine potential linear dependencies among the seven explanatory variables (X1–X7). The seven explanatory variables are presented below in
Table 1.
The purpose of this analysis was to detect possible multicollinearity that could distort the DTM’s feature importance rankings and reduce model interpretability. Pearson’s correlation coefficients (r) were calculated for all feature pairs under each fleet configuration (1-, 2-, and 3-vehicle), and the resulting matrices were visualized as triangular heatmaps. Following standard interpretation, ∣r∣ ≥ 0.70 was considered strong, 0.40 ≤ ∣r∣ < 0.70 moderate, and ∣r∣ < 0.40 a weak correlation [
30].
The results in
Figure 6,
Figure 7 and
Figure 8 show that most features exhibit weak or negligible correlations, indicating that the input variables are largely independent. A moderate positive correlation was found between ride time (X3) and detour factor (X6) across all fleet scenarios, with coefficients of r = 0.64 (1 vehicle), r = 0.52 (2 vehicles), and r = 0.57 (3 vehicles). This relationship is logically consistent, as greater detour distances naturally result in longer ride times. However, since these values remain below the strong correlation threshold, the impact on model reliability is limited. Therefore, all features were retained to preserve their distinct explanatory contributions. Overall, the weak-to-moderate correlation pattern confirms minimal multicollinearity and supports the robustness of the DTM’s feature-importance interpretation.
2.6. Model Training
A DTM is a recursive partitioning model used for classification and prediction that splits data into progressively homogeneous subsets [
31]. A decision tree performs classification based on the input features or attributes, so it uses several independent parameters for classification. This study used a decision tree for binary classification [
32] DTMs have been used in various classification problems. Recent studies have explored DTMs in ride-hailing services and dynamic transport systems, where quick and transparent decision-making is crucial. Jain et al. [
33] estimates demand for on-demand shared transport using spatial data rather than costly surveys, identifies ideal areas, and validates the method against existing transport modes.
There are several decision tree algorithms, each with unique characteristics. Iterative Dichotomiser ID3 uses entropy and information gain for splitting [
34] while C4.5 enhances it by handling both categorical and continuous data [
35]. CART relies on Gini impurity for classification and also supports regression [
36]. Meanwhile, CHAID uses chi-square tests for multiway splits, making it ideal for categorical data analysis [
37].
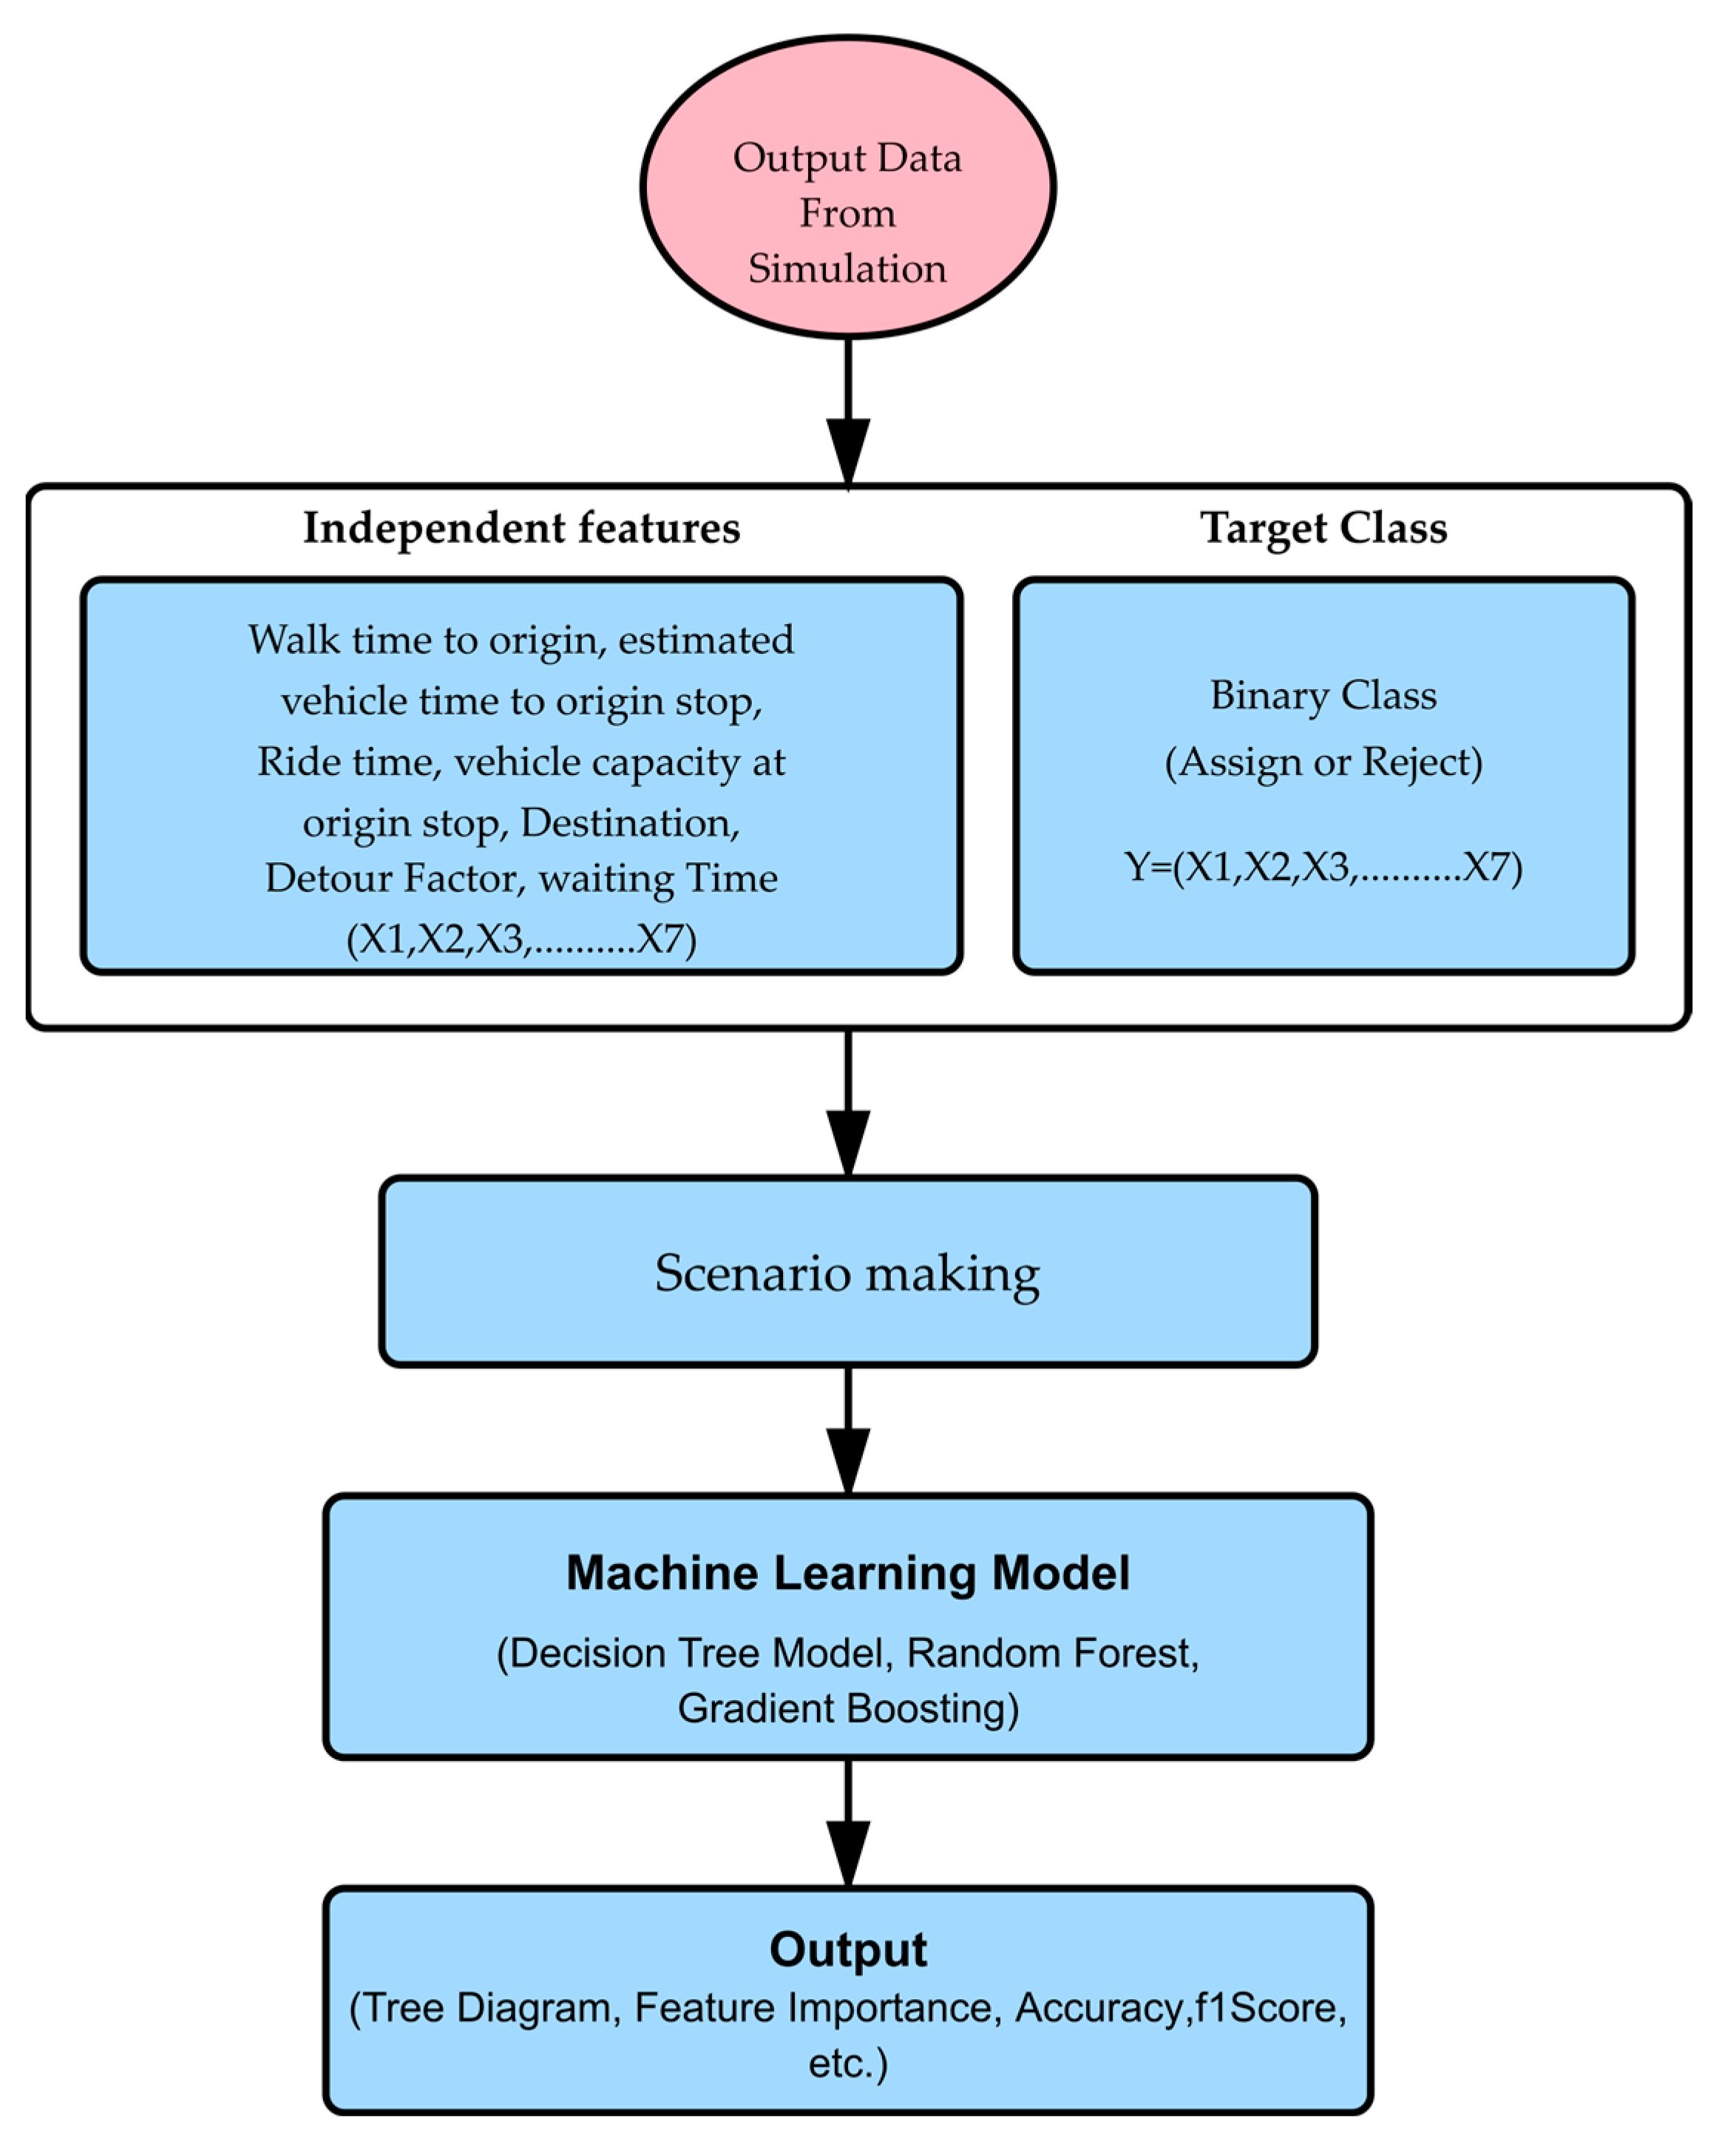
Figure 9 shows the model development process. First, data collection and preprocessing were conducted, where relevant data were cleaned by handling missing values and encoding (0 for reject and 1 for accept) categorical variables.
Next, the problem is defined by identifying the target variable and relevant input features that will guide the decision tree.
Table 1 shows the description of all the input features used in this research study. The decision tree is built by recursively splitting the dataset based on the chosen criteria of the Gini Index [
38]. The Gini Index is a measure of impurity in a dataset, used in decision trees to determine how mixed the classes are, with 0 indicating complete purity and higher values indicating more diversity. The mathematical expression for the Gini Index is as follows [
39].
where
G: Gini index.
c: the total number of possible categories of the target variable.
P(i): the probability of an object in the node belonging to the ith category of the target variable.
n: the total number of observations in the parent node.
n(i): the number of observations in the ith category within the parent node.
The model performance parameters accuracy, precision, Recall, and F1-score were calculated as follows [
40]:
Here, the F1-score is a single metric that represents the harmonic mean of Precision and Recall.
where
TP (True Positive): Correctly predicted positive cases.
TN (True Negative): Correctly predicted negative cases.
FP (False Positive): Incorrectly predicted positive cases (Type I error).
FN (False Negative): Incorrectly predicted negative cases (Type II error).
In this study, the Synthetic Minority Oversampling Technique (SMOTE) [
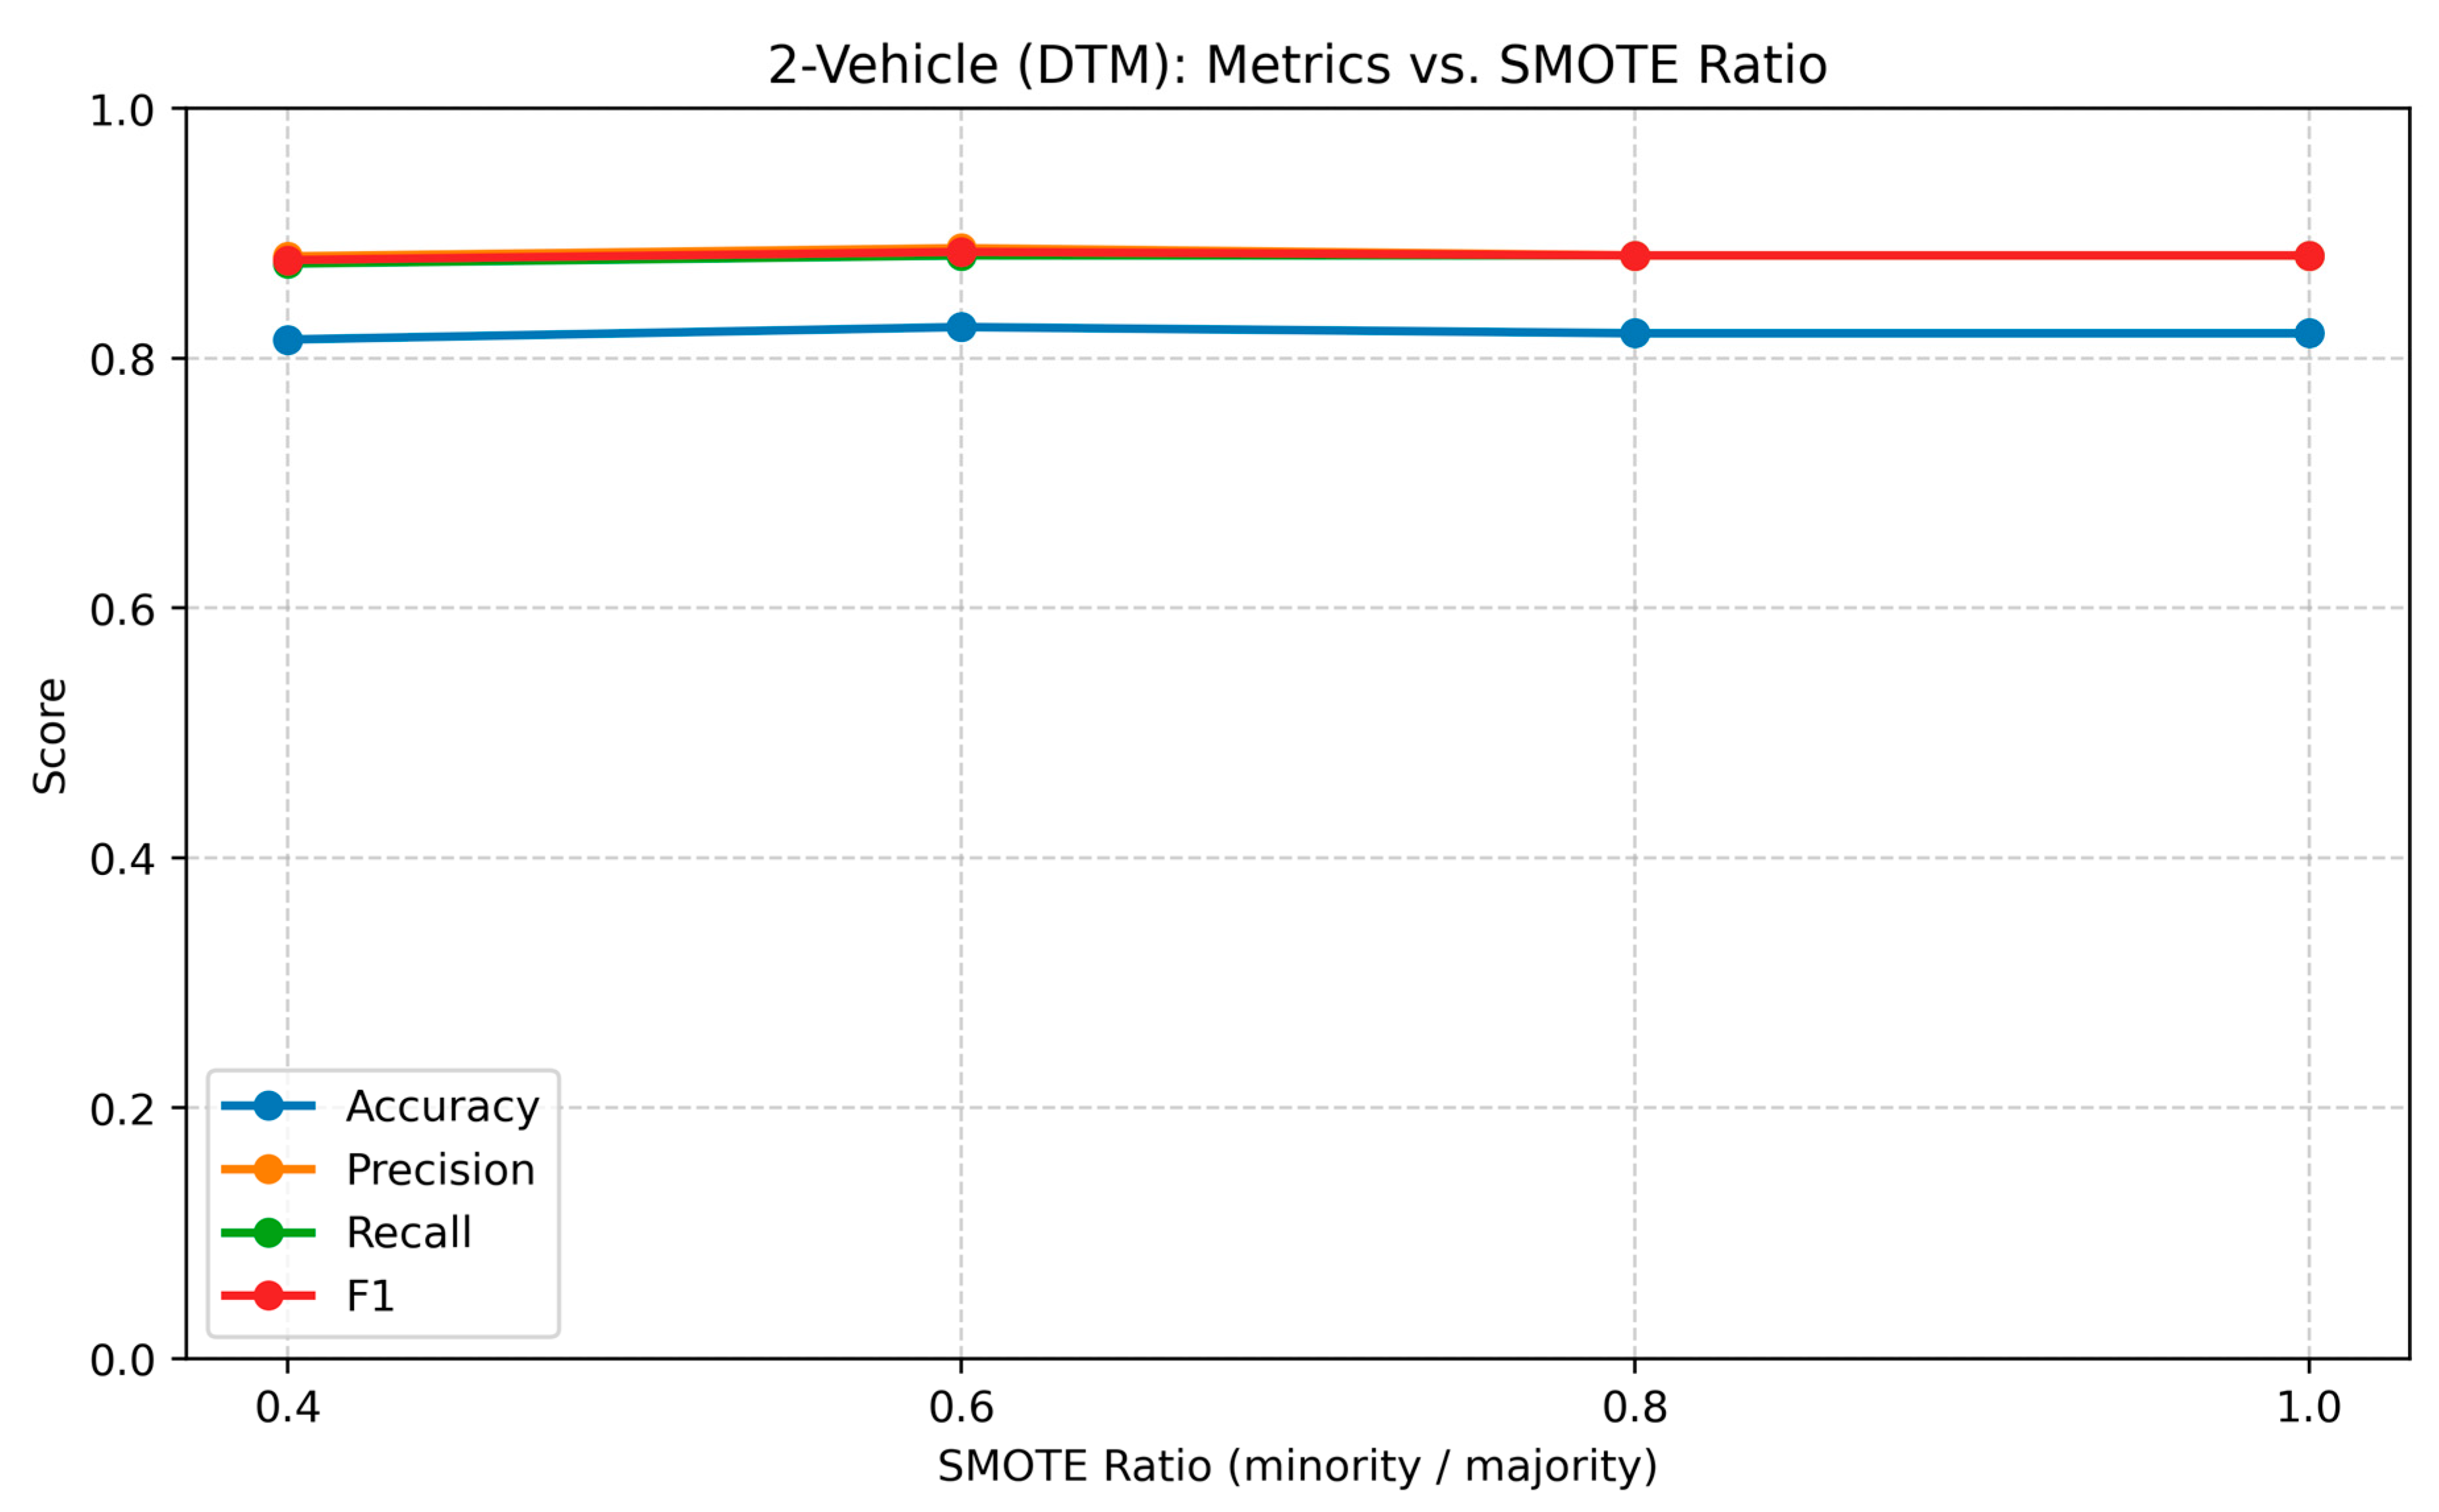
41] was applied to the minority “Reject” class of the target variable Decision, which comprises the categories “Assign” and “Reject.” To examine the influence of different oversampling levels, SMOTE ratios of 0.4, 0.6, 0.8, and 1.0 were tested on the two-vehicle dataset. As shown in
Table 2 and
Figure 10, the classification performance of the Decision Tree Model (DTM) improved as the sampling ratio increased, with the F1-score rising from 0.879 at a ratio of 0.4 to 0.882 at 0.8, after which no further improvement was observed. At a ratio of 1.0, the number of synthetic “Reject” samples increased substantially (from 299 to 422) without any gain in predictive performance. Therefore, a sampling ratio of 0.8 was selected as the optimal balance between class representativeness and model generalization, achieving stable accuracy (0.82) and F1-score values (0.882) while avoiding potential overfitting caused by excessive artificial data generation.
2.7. Hyperparameter Tuning
To ensure optimal model performance while maintaining interpretability, the hyperparameters of the Decision Tree Model (DTM) were carefully configured based on standard machine learning practices. The tree is ‘pruned’ by removing unnecessary branches to prevent overfitting and enhance model generalization [
42]. The maximum tree depth was fixed at 4 for all scenarios to control model complexity and prevent overfitting, while still allowing the tree to capture the main decision patterns in the dataset. The minimum samples required to split a node were set to 2, and the minimum samples per leaf were set to 5, ensuring that each terminal node contained a sufficient number of observations to represent stable decision rules. A random state value of 42 was applied to ensure reproducibility. These selected values align with common practice in decision tree modeling, where maximum depth is typically kept between 3 and 10, the minimum samples required to split a node is between 2 and 10, and the minimum samples per leaf is between 1 and 5, balancing generalization and interpretability.
2.8. Model Validation (K-Fold Cross Validation)
To evaluate the generalization ability of the Decision Tree Model and to ensure consistent and unbiased performance estimation, a five-fold cross-validation approach was employed. Cross-validation allows the model to be trained and tested multiple times on different partitions of the dataset, thereby minimizing the effect of random data splits and providing a more reliable measure of predictive accuracy.
In this procedure, the complete dataset was divided into five equal subsets (folds) of approximately the same size. The model was then trained and validated over five iterations, each time using a different combination of training and testing folds. Specifically, in the first iteration the model was trained on folds 1–4 and tested on fold 5; in the second iteration it was trained on folds 1–3 and 5 and tested on fold 4; in the third iteration it was trained on folds 1–2 and 4–5 and tested on fold 3; in the fourth iteration it was trained on folds 1 and 3–5 and tested on fold 2; and in the fifth iteration it was trained on folds 2–5 and tested on fold 1. This process ensured that each data subset served once as the validation set, while all observations were used for both training and testing exactly once.
After completing all five iterations, the evaluation metrics Accuracy, Precision, Recall, F1-score, and ROC-AUC were averaged and expressed as mean ± standard deviation (mean ± std), providing both the central tendency and variability of model performance.
All simulations and analyses were performed using the Python (version 3.10.6; Python Software Foundation, Wilmington, DE, USA) Visual Studio Code (VS Code) (version 1.105.1; Microsoft Corporation, Redmond, WA, USA) environment. The DTM was implemented using the scikit-learn library, while imbalanced-learn was used for SMOTE (version 0.12.4; open-source Python library) oversampling. Data preprocessing and visualization were conducted with pandas (version 2.2.2; open-source Python library), NumPy (version 1.26.4; open-source Python library), and matplotlib (Version 3.9.2; open-source Python library), ensuring efficient handling and analysis of large datasets.
The performance of the decision tree is evaluated using various metrics, including accuracy, precision, recall, F1-score, and the ROC-AUC curve [
43].
3. Results and Discussion
3.1. Decision Tree Output
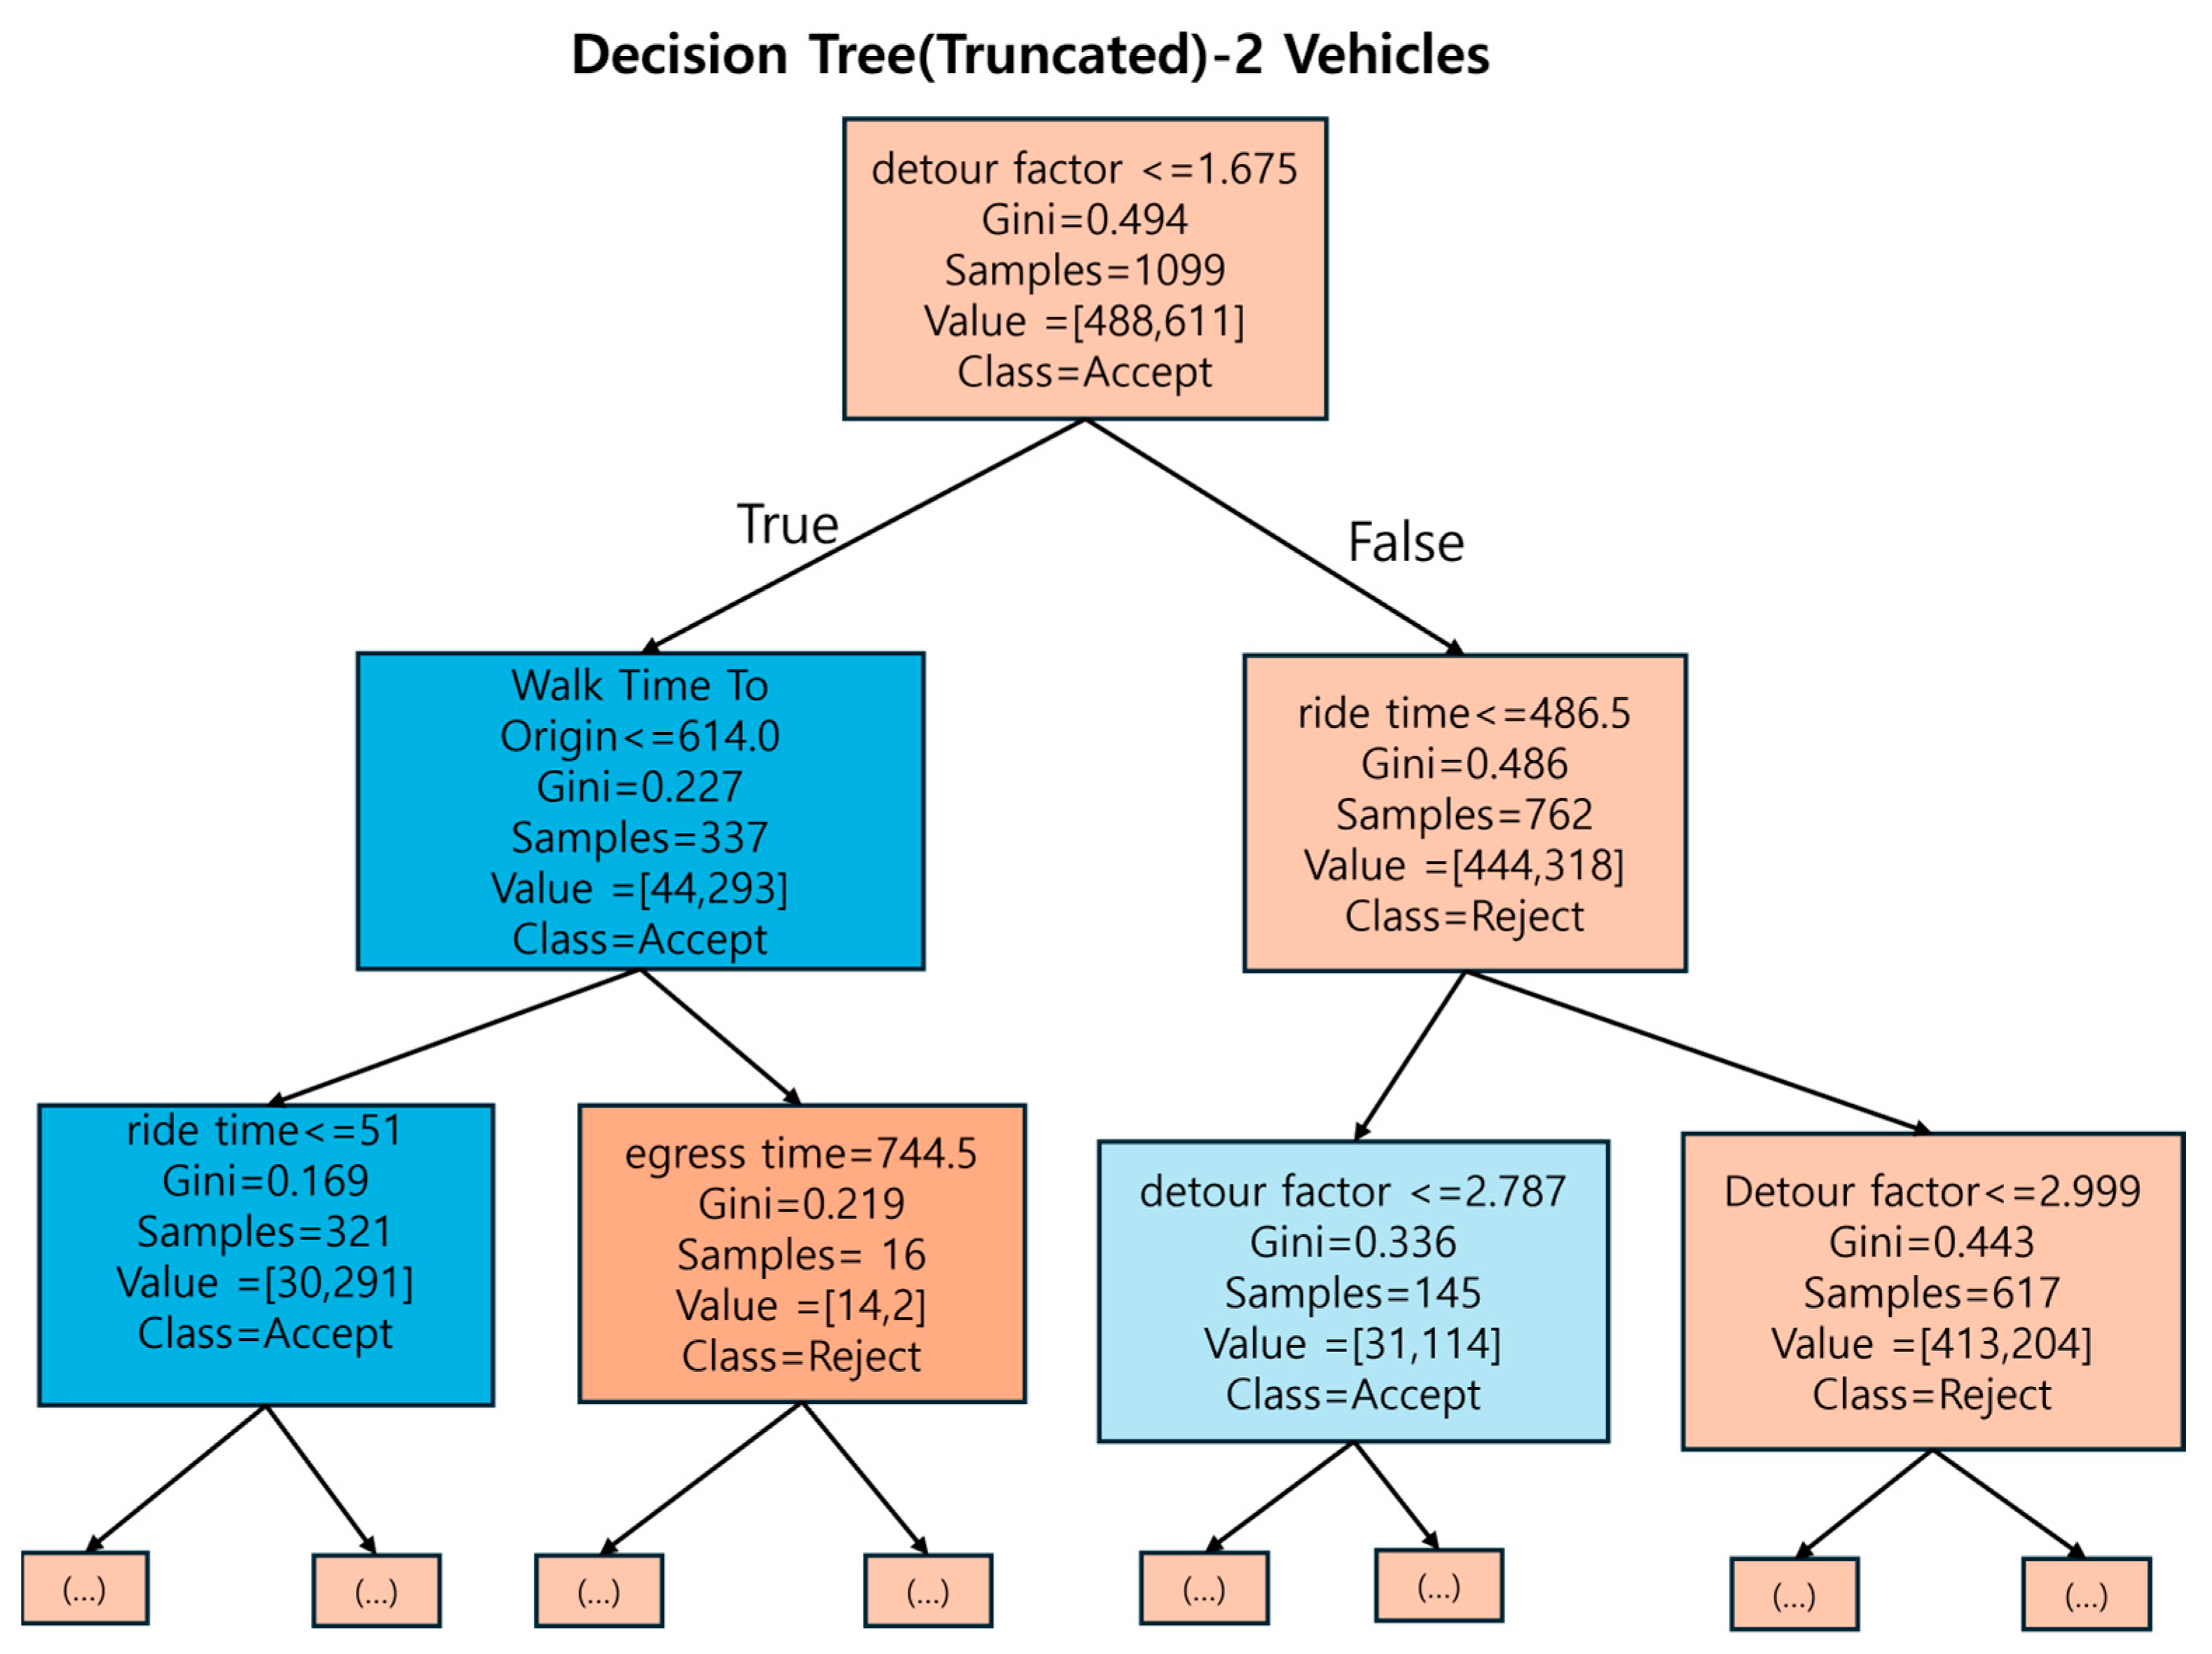
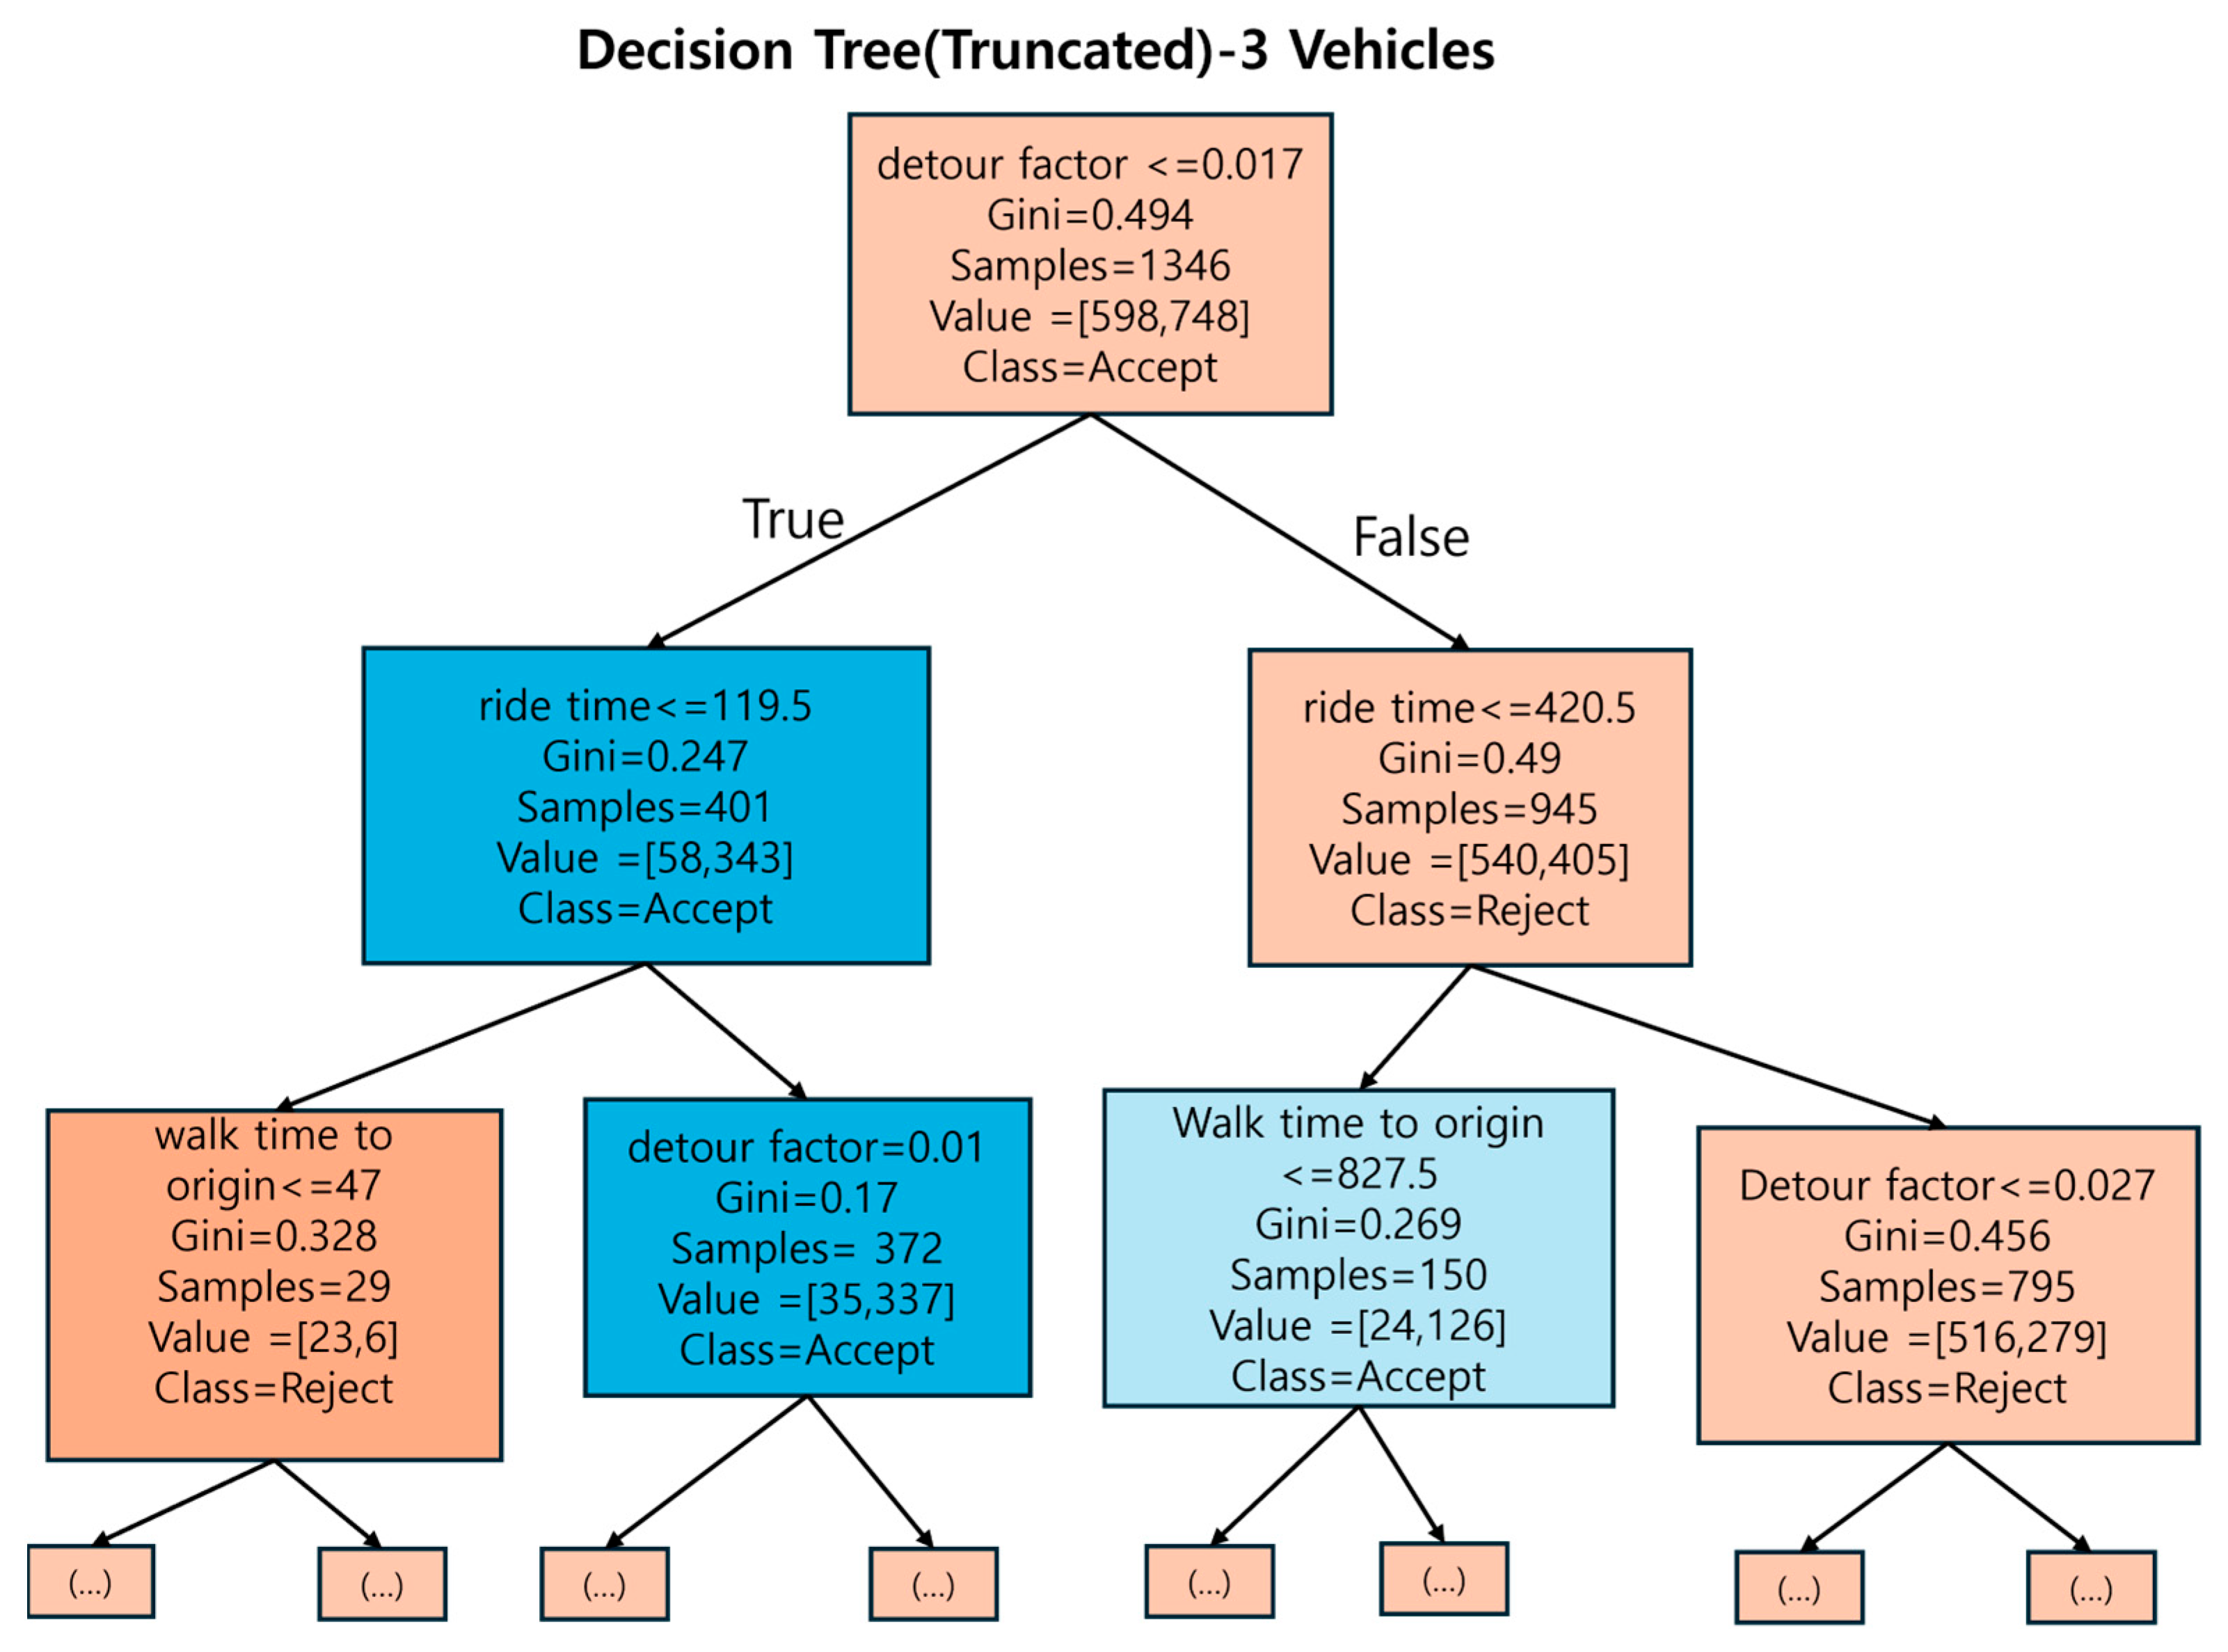
The DTM is designed to predict whether a vehicle assignment request will be accepted or rejected, based on input features and threshold values. The representative folds for each fleet scenario were selected based on the proximity of their F1-scores to the mean F1-score obtained from the 5-fold cross-validation. Specifically, Fold 1 was selected for the 1-vehicle scenario (F1 = 0.630, closest to the mean = 0.646), Fold 2 for the 2-vehicle scenario (F1 = 0.890, closest to the mean = 0.882), and Fold 5 for the 3-vehicle scenario (F1 = 0.893, closest to the mean = 0.900). The Decision Tree diagrams were developed using the training data from these representative folds, ensuring that each visualization reflects the model’s typical and balanced decision-making behavior. The corresponding decision tree diagrams for each fleet configuration are presented below in
Figure 11,
Figure 12 and
Figure 13, which illustrate the hierarchical structure and dominant decision rules derived from the representative folds.
3.2. Feature Importance
Table 3 presents the feature importance values and classification performance of the Decision Tree Model (DTM) in one-, two-, and three-vehicle fleet scenarios, evaluated using 5-fold cross-validation. The feature importance scores represent the relative contribution of each variable to the model’s decision-making process, while the performance metrics (accuracy, precision, recall, F1-score, and ROC_AUC) summarize the predictive capability of the trained models.
Across all fleet configurations, the detour factor (X6) consistently emerged as the most influential feature, with importance values of 0.582 ± 0.055, 0.550 ± 0.047, and 0.447 ± 0.073 for the one-, two-, and three-vehicle cases, respectively. This indicates that route deviation plays a dominant role in determining whether a request is assigned or rejected, reflecting the model’s sensitivity to operational efficiency and service quality trade-offs. The ride time (X3) was the second-most important factor in all scenarios, suggesting that longer in-vehicle travel times significantly influence assignment feasibility. The walk time to origin (X1) ranked third, highlighting the role of passenger accessibility in the decision process.
Other features, such as vehicle capacity at assignment (X4) and egress time (X5), contributed moderately, particularly in the multi-vehicle cases, where capacity management and post-trip accessibility become relevant. Variables like estimated time to origin (X2) and waiting time (X7) exhibited low or zero importance in most folds, indicating that their influence on decision splitting was minimal within the given operational conditions.
In terms of model performance, the DTM achieved mean accuracies of 0.73 ± 0.02, 0.82 ± 0.04, and 0.83 ± 0.07 for the one-, two-, and three-vehicle scenarios, respectively. Both precision and recall improved notably with larger fleet sizes, reflecting enhanced request-matching flexibility. The F1-score increased from 0.65 ± 0.06 (one vehicle) to 0.90 ± 0.04 (three vehicles), indicating a more balanced classification between “assign” and “reject” decisions. The ROC_AUC values, ranging from 0.75 to 0.83, confirm satisfactory discriminatory ability across scenarios. Overall, these results demonstrate that expanding the fleet size improves the model’s predictive reliability while maintaining interpretable decision structures.
In summary, ride time and detour factors are consistently the most important features across all vehicle scenarios because they directly influence service efficiency and user satisfaction. As more vehicles are added, the system gradually begins to factor in accessibility and proximity (ETA), while static features like vehicle capacity and wait time remain insignificant due to either dataset characteristics or effective pre-filtering during simulation.
The above results align well with previous research, which shows that passengers are particularly sensitive to detours, especially during non-commuting trips, making it essential to keep routes direct for better user satisfaction [
44]. Similarly, reducing ride time has been recognized as a key goal in improving the overall efficiency of demand-responsive transit operations [
45]. Recent studies have also emphasized the importance of including both detour and travel time in optimization frameworks for vehicle scheduling, highlighting their direct impact on system performance and cost-effectiveness [
46]. As the number of available vehicles increases, the ETA to the pickup point becomes more relevant, supporting the need for responsive and timely service.
3.3. Error Analysis and Operational Implications
In addition to overall accuracy, the confusion matrices in
Figure 14 were further analyzed to examine the distribution of Type I and Type II errors across the three fleet-size scenarios. In the context of DRT operations, a Type I error (False Positive) occurs when the model incorrectly accepts an infeasible request, potentially leading to vehicle overload, service delays, or route infeasibility. Conversely, a Type II error (False Negative) occurs when the model rejects a feasible request, which can reduce vehicle utilization and negatively affect passenger satisfaction. The Type I Error Rate was computed as FP/(FP + TN) and the Type II Error Rate was computed as FN/(FN + TP).
As summarized in
Table 4, the 1-vehicle scenario showed a Type I error rate of 0.16 ± 0.09 and a Type II error rate of 0.41 ± 0.13, indicating a conservative dispatching pattern in which feasible requests were frequently rejected due to limited vehicle availability. The 2-vehicle scenario achieved the most balanced performance, with a Type I error rate of 0.38 ± 0.12 and a Type II error rate of 0.12 ± 0.04, demonstrating that two vehicles provide sufficient flexibility to maintain both operational feasibility and high service coverage. In contrast, the 3-vehicle scenario exhibited a Type I error rate of 0.50 ± 0.14 and a Type II error rate of 0.15 ± 0.07, suggesting an overly permissive assignment tendency, where an abundance of available vehicles led to excessive acceptance of infeasible requests.
From an operational standpoint, minimizing Type I errors is more critical in DRT dispatching, since over-accepting infeasible requests can directly degrade service reliability and passenger experience. However, persistently high Type II errors can suppress potential ridership and limit system efficiency. Therefore, maintaining an optimal balance between the two error types is essential for real-time DRT performance. The findings confirm that the two-vehicle configuration achieves this trade-off most effectively, providing the best compromise between service availability and operational feasibility.
3.4. Confusion Matrix
The normalized confusion matrices are presented below in
Figure 14a–c.
4. Conclusions, Limitations, and Future Research
This study demonstrates that the DTM provides a structured and interpretable approach for assigning or rejecting calls in a DRT system based on demand patterns and origin–destination (O–D) characteristics. The DTM generates threshold-based decision rules derived from the training dataset, where the value of each input parameter determines whether a call request should be accepted or rejected. This approach can significantly reduce simulation time because requests rejected early in the decision process do not need to pass through subsequent nodes for further evaluation.
The threshold values for decision-making may vary depending on factors such as the study area, fleet size, and operational constraints. Among the evaluated scenarios, the two-vehicle configuration achieved good model accuracy (0.82 ± 0.04), and low type I error rate (0.377 ± 0.130) and type II error rate (0.118 ± 0.046), representing an optimal balance between operational efficiency and service flexibility. Thus, the findings suggest that the small DRT systems, like in university areas, achieve optimal efficiency with 2 vehicles. Feature importance analysis consistently identified ride time and detour factor as the primary determinants influencing assignment decisions. In the one-vehicle scenario, minimizing route deviations and managing trip duration were crucial for maintaining vehicle availability. This emphasis became even more important in the two-vehicle case, where these two features accounted for most of the feature importance, reflecting the need for tight operational control despite increased capacity. In the three-vehicle scenario, the importance of ride time increased slightly, while that of detour factors decreased, suggesting that greater vehicle availability allows for more routing flexibility and better passenger convenience. Other features, such as vehicle capacity, waiting time, and ETA, had a relatively minor influence, except ETA, which became more relevant in the three-vehicle setting, indicating that vehicle proximity becomes important when multiple options are available. Overall, the findings suggest that two vehicles provide the most effective operational balance under the study conditions given.
The results provide actionable insights for transit operators and planners. The proposed DTM framework can serve as a decision-support tool for real-time dispatching, helping operators determine optimal fleet size and assignment strategies based on demand density and service constraints. By analyzing feature importance, operators can identify the key operational parameters, such as ride time and detour factors, that most influence system performance. This information can guide policy decisions on acceptable detour limits, maximum waiting times, and service coverage area adjustments. Additionally, the interpretable nature of the decision tree allows agencies to visualize decision thresholds, facilitating transparent policy setting and system calibration without the need for complex black-box algorithms.
This study has several limitations. The analysis was conducted within a relatively small study area using a limited number of vehicles, which may not fully represent the operational complexity of large-scale DRT systems characterized by diverse demand patterns and heterogeneous fleet configurations. In addition, real-time external factors such as weather conditions, traffic congestion, and unanticipated road incidents were not incorporated into the current framework. Considering these dynamic elements in future research could enhance the realism and robustness of DRT operational modeling and improve the applicability of the developed model to real-world conditions.
Future research should address these limitations by integrating behavioral variables and expanding the model framework to encompass larger networks and heterogeneous operational conditions. Incorporating real-time operational data and reinforcement learning approaches may also improve the model’s adaptability to dynamic service environments. Finally, validation using real-world DRT operation data or field experiments would provide stronger empirical evidence for the model’s practical applicability, stability, and scalability under real operating conditions.
