Abstract
Predicting Tunnel Boring Machine (TBM) working parameters, such as cutterhead torque, is crucial for ensuring safe and efficient tunneling. However, complex and changing geological conditions pose a significant challenge to this study, leading to degradation in the model’s performance and poor generalization ability. To overcome these limitations, this study proposes a novel method to predict the TBM working parameters under changing geological conditions. The proposed method first divides the TBM working parameters into short subseries and assigns pseudo labels to each subseries according to their statistical values. The proposed method then creates a balanced dataset for the TBM performance prediction task by generating new samples for minority classes and undersampling majority classes. The mean absolute percentage error (MAPE) of the test dataset decreased from 1.893% to 1.338%, resulting in a 29.3% increase in the model’s performance. Using pseudo labels of the subseries, a more comprehensive assessment of the proposed method was performed. A comparison with several traditional methods also proves the effectiveness of the method. This research is not only significant for studying TBM performance prediction in changing geological conditions but also provides insights for other complex equipment operating under changing working conditions.
1. Introduction
Tunnel boring machines (TBMs) are large and intricate pieces of equipment commonly used in tunnel construction because of their safety, high excavation efficiency, and environmental friendliness [1]. Tunneling is a complex process that involves interactions between the machine and the surrounding rocks. A series of tasks, including condition monitoring [2], ahead-of-time geology prediction [3], and performance prediction [1], were conducted to ensure safe and efficient tunneling. The prediction of the TBM performance or workload plays a vital role in several stages of tunnel construction. Accurately estimating the TBM penetration rate is crucial for determining the project schedule during the tunnel design phase. During tunneling, a TBM operator can establish appropriate control parameters by forecasting the thrust force and cutterhead torque for sections of the tunnel that have not yet been excavated. Traditionally, prediction methods can be classified into theoretical and empirical approaches based on the steps involved in creating a model and the input variables being used [4]. With the rapid development of the Internet of Things (IoT) and cloud computing technology, it is now convenient to acquire and store massive TBM working parameters at low cost. Adjacent TBM working parameters are highly correlated in the temporal domain owing to the consistency of tunnel geology in small ranges. Consequently, time-series methods have become popular for predicting the TBM performance. Deep learning, which is characterized by its ability to automatically extract features from large datasets, has become the preferred approach for creating time series prediction models.
Despite the successful application of various proposed methods, the imbalanced distribution of geological conditions presents a significant challenge in predicting the TBM performance [5]. The geological imbalance phenomenon manifests in multiple ways. The composition of the surrounding rock varies across the entire tunnel range, with one rock type being particularly prevalent and dominant in the tunnel. The uneven distribution of the surrounding rock types along the tunnel axis also reflects an imbalance phenomenon. Typically, the surrounding rock remains fixed within a specific tunnel range. With the excavation of the TBM, the surrounding rock gradually changed to a new type. As a reflection of the machine–tunnel interaction, the changing geological conditions lead to fluctuations in the TBM operational data, which harms the TBM performance prediction. This study investigated the performance prediction of TBM under imbalanced geological conditions. First, the influence of geological imbalance on the TBM performance prediction results was analyzed. Subsequently, a synthetic method for creating a balanced dataset for TBM performance prediction models was proposed.
The remainder of this paper is organized as follows. Section 2 introduces the TBM performance prediction methods and the classification of imbalanced datasets. Section 3 proposes a technique for creating balanced datasets for TBM performance prediction tasks using resampling and data synthesis techniques. In Section 4, the prediction results obtained using the imbalanced and balanced datasets are comprehensively compared. Finally, concluding remarks are presented in Section 5.
2. Related Work
2.1. TBM Performance Prediction Methods
2.1.1. Theoretical Method
Traditional prediction methods for the TBM performance can be classified into theoretical and empirical models. Theoretical methods based on rock failure mechanisms analyze the influence of cutterhead parameters such as disk cutter diameter, tip width, and spacing on the TBM boring process [6,7,8]. A scaled test rig was constructed to develop a theoretical prediction method. By simulating the tunnel boring process and analyzing the various forces exerted on the cutters, the load of a real TBM can be induced. The most frequently used theoretical model is the Colorado School of Mines (CSM) model [4]. Gertsch et al. [9] conducted a series of full-scale disk-cutting tests using a single cutter. By measuring the normal, rolling, and side forces, the influence of different combinations of spacings and penetrations on the specific energy (SE) was analyzed. Cho et al. [10] conducted various full-scale tests on a linear cutting machine (LCM) and obtained the optimum cutting conditions for Korean granite rock at the minimum SE value. Entacher et al. [11] used disk cutters to cut rock samples while adjusting indentation depth and spacing. A comparison of the results showed that the scaled rock cutting tests were superior to geotechnical standard tests when building a prediction model. Ma et al. [12] studied the influence of confining stress on TBM cutting forces using a linear cutting test. Yin, Miao, He, Dai and Gong [7] investigated the influence of joint spacing on the rock fragmentation process through a linear cutting test. Park et al. [13] investigated the cutting efficiency and structural stability of a new type of pick cutter by using a linear cutting test and finite element analysis. The theoretical method simulates the real working process of the TBM and can thus achieve relatively high accuracy. However, because cutting tests rely on test rigs and cutting specimens, they are usually expensive and time-consuming.
2.1.2. Empirical Method
Empirical methods are data-driven, taking rock mass parameters as inputs and TBM performance metrics as outputs. TBM design parameters, such as the cutterhead diameter and installed cutterhead power, are occasionally used as inputs to an empirical model. Frequently used rock mass properties of empirical models include the uniaxial compression strength (UCS), Brazilian tensile strength (BTS), and distance between planes of weakness (DPW). Frequently used TBM performance metrics include rate of penetration (ROP), advance rate (AR), utilization rate (UR), field penetration index (FPI) and torque penetration index (TPI). Various machine learning and artificial intelligence (AI) methods have been employed to establish the relationship between the inputs and outputs of an empirical model for predicting the TBM performance [14,15]. Regression methods are frequently used to build empirical models because of their simplicity and efficiency [16,17,18]. Yagiz [19] proposed a dataset collected from Queens Water Tunnel #3, which contained 151 items containing rock mass properties, such as USC, BTS, and DPW. Statistical analysis and stepwise regression analysis were performed to study the relationship between the rock mass properties and TBM performance. Statistical and deep learning methods have also been employed to construct empirical models [14,15,20]. For example, Fattahi and Babanouri [14] used a hybrid of support vector regression (SVR), differential evolution algorithm (DE), artificial bee colony algorithm (ABC), and gravitational search algorithm (GSA) to predict the TBM performance on available open data. Salimi, Faradonbeh, Monjezi and Moormann [20] used a classification and regression tree (CART) to predict the specific rock mass boreability index (SRMBI). The process of building an empirical prediction model was straightforward. However, model accuracy is usually restricted by the lack of sufficient rock mass data.
2.1.3. Time-Series Prediction Method
Time-series prediction methods for TBM performance are gaining popularity because of the vast amount of available operational data. Time series prediction methods utilize the historical values of the TBM working parameters to predict future values [21,22,23,24,25]. Gao et al. [26] used recurrent neural networks (RNNs) to predict six distinct TBM working parameters. Numerical experiments demonstrated that RNNs can accurately predict TBM working parameters in real time. Feng, Chen, Luo, Wang, Zhao, Liu, Ling and Jing [21] conducted similar research using a deep belief network (DBN). Wang et al. [27] employed a convolutional gated-recurrent-unit (C-GRU) neural network to forecast the TBM attitude and examined how the duration of previous time steps and the number of output steps affected the prediction outcomes. Wang, Zhang and Fu [25] employed a causal explainable gated recurrent unit (CX-GRU) to address the “black-box” problem associated with the use of AI methods to predict the TBM performance. The prediction results revealed that the thrust force was more sensitive to the input TBM features, whereas the soil pressure was more sensitive to the historical data. Zhang [28] proposed temporal and spatial prediction methods of TBM performance based on massive operational data collected from a water conveyance tunnel. The transferring ability of both methods in different aspects was compared comprehensively. In summary, time-series prediction methods can generate better results than theoretical and numerical methods and have the potential for realizing real-time prediction. However, the demand for higher computational power on the edge side may restrict its application in real tunnel projects.
2.2. Classification on Imbalanced Datasets
In classification tasks, the issue of imbalanced datasets arises when the number of training samples for one category is substantially greater than that for another category, with ratios potentially reaching as high as 100:1 [29]. Most classifiers are designed to perform well on balanced datasets, and when faced with imbalanced training datasets, they can be easily manipulated by dominant categories. The accuracy metric is no longer appropriate for evaluating the classification results on imbalanced datasets. The current practice is to use the Receiver Operating Characteristic (ROC) curve to describe the classifier’s ability to distinguish between false positive and true positive rates, and the Area Under the Curve (AUC) is used to evaluate the classifier’s accuracy [29,30,31]. The proposed classification methods for imbalanced datasets are as follows:
2.2.1. Misclassification Cost Method
This method sets different misclassification costs for minority and majority categories [32,33,34], such as setting higher misclassification costs for minority categories. Domingos [35] proposed the MetaCost method, which recalibrates the training samples using the category that achieves the minimum estimated misclassification cost and reapplies the error-based classifier to newly generated training samples. Greiner et al. [36] proposed the concept of active classifier with cost-sensitive characteristics. Liu and Zhou [37] studied the impact of data imbalance on cost-sensitive learning methods. The results showed that when the misclassification costs of different categories differed slightly, cost-sensitive classifiers preferred the natural distribution of the dataset. When there is a significant cost difference, the classifier tends to prefer a balanced dataset distribution. Sun, Kamel, Wong and Wang [32] investigated methods to enhance the accuracy of classifiers while reducing the computation time of the AdaBoost algorithm and pointed out that the effectiveness of the AdaBoost algorithm in improving classification accuracy was limited when facing imbalanced datasets.
2.2.2. Resampling Method
This method utilizes sampling techniques to balance the class distribution of the original training dataset [29,30,38,39,40]. For minority classes, oversampling is used to generate the same number of training samples as the majority class, whereas for the majority class, undersampling is used to retain the same number of training samples as the minority class. In minority classes, oversampling can easily lead to overfitting in machine learning algorithms. In contrast, undersampling of majority classes artificially removes some samples, resulting in the loss of useful information in the newly generated dataset. Chawla, Bowyer, Hall and Kegelmeyer [29] proposed a generative minority oversampling technique (SMOTE). The SMOTE algorithm first identifies the k-nearest neighbors of each minority class sample. When generating a new sample in the minority class, SMOTE first selects a sample from the k-nearest neighbors and calculates the difference between the two samples. The SMOTE algorithm then selects a random number within the range (0,1). A new sample is created according to Equation (1). The SMOTE algorithm uses artificial synthesis to generate new training samples for minority classes, thereby alleviating the problem of model overfitting caused by random oversampling to some extent.
where is the sample of the minority class, is the difference between and selected neighbor sample, and is the synthetic coefficient.
Han, Wang and Mao [39] proposed the boundary SMOTE oversampling method (Borderline-SMOTE), on the judgment that training samples near the boundary are more prone to misclassification, while samples far from the boundary have a more minor impact on classifier performance. He et al. [41] proposed an adaptive synthesis (ADASYN) method that can adaptively distinguish between easy-to-learn and difficult-to-learn samples in minority classes and generate more new samples for the latter. The results showed that ADASYN can not only eliminate machine learning bias caused by imbalanced datasets, but also adaptively focus decision boundaries on difficult-to-learn training samples. Wang [40] proposed a hybrid SMOTE and Transfer Conditional Wasserstein Generative Adversarial Network (Trans-CWGAN) to address the class imbalance problem in the fault diagnosis task of air handling units (AHUs). Different combinations of SMOTE and Trans-CWGAN were investigated, and the fault diagnosis performance of the three machine learning methods was significantly improved.
2.2.3. One-Class Classification Method
This method transforms the classification problem into a recognition task for minority class samples [42,43,44]. Japkowicz, Myers and Gluck [42] trained an autoencoder by using majority class samples. When minority class samples are input into the autoencoder, the output end cannot effectively reconstruct the input signal. Hence, the classification of imbalanced datasets becomes a form of anomaly detection for minority class samples. Manevitz and Yousef [43] compared the performance of several one-class classification algorithms applied to text classification and found that SVM performed better than k-nearest neighbors and naive Bayesian algorithms but was slightly inferior to neural network classification algorithms. Raskutti and Kowalczyk [44] investigated the limitations of supervised learning methods in handling imbalanced datasets and analyzed the impact of sampling and imbalanced weight compensation methods on the SVM.
2.2.4. Active Learning Method
Some researchers have used active learning methods to solve classification problems in imbalanced datasets [45,46]. Active learning methods extract the most valuable training samples from a training dataset through efficient query strategies, allowing them to be applied to large-scale datasets at lower computational costs. Ertekin, Huang, Bottou and Giles [45] conducted research on active learning on imbalanced datasets using online SVM algorithms. The experimental results showed that active learning methods could generate a balanced dataset in the early stages of machine learning without preprocessing the original training data, making them more efficient than traditional oversampling or undersampling methods. Zhu and Hovy [47] investigated the impact of various resampling methods on active learning, pointing out that undersampling methods can have adverse effects on the results of active learning. A bootstrap oversampling method (BootOS) was proposed to eliminate the intraclass imbalance caused by oversampling.
3. Proposed Method
3.1. Dataset Preparation and Model Establishment
The process of establishing and evaluating the time series prediction model for TBM performance is presented in Figure 1. We used the working parameters collected from the excavated sections of a tunnel to establish the prediction model and evaluate the model performance on the unexcavated sections of the same tunnel. The data used in this study were collected from a water conveyance tunnel located in Jilin Province, China. The geological information of the tunnel can be found in [48]. After data preprocessing, 2768 subseries with a length of 60 were extracted, and the time interval between two adjacent working records was 1 min. The first 150 subseries were used to create training and validation datasets for the prediction model, and the remaining 2618 subseries were used to evaluate the model’s performance. The dataset format of a time series prediction model is shown in Figure 2. As 55 training samples could be extracted from a single subseries, 8250 training samples were created using 150 subseries. The datasets created using the traditional method and the proposed method are referred to as the imbalanced and balanced datasets, respectively. We employed the long short-term memory (LSTM) method to develop a time-series prediction model for TBM performance, as artificial neural networks (ANN) usually outperform other machine learning methods, such as SVM or decision tree, when massive operational data are available for model training [49]. The hyperparameters of LSTM are listed in Table 1, and we used six historical steps to predict the next step of the torque. We ran the LSTM model five times with different seeds and obtained the results by averaging five numerical experiments. We adopted an early stopping strategy to avoid model overfitting.
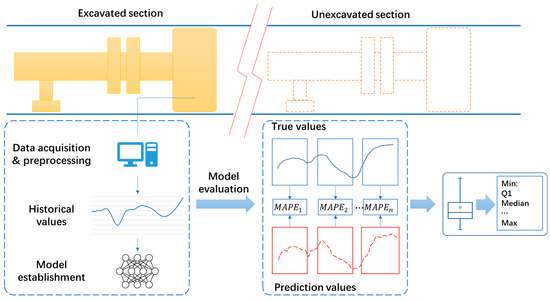
Figure 1.
Workflow of establishment and evaluation of prediction models of TBM performance [28].
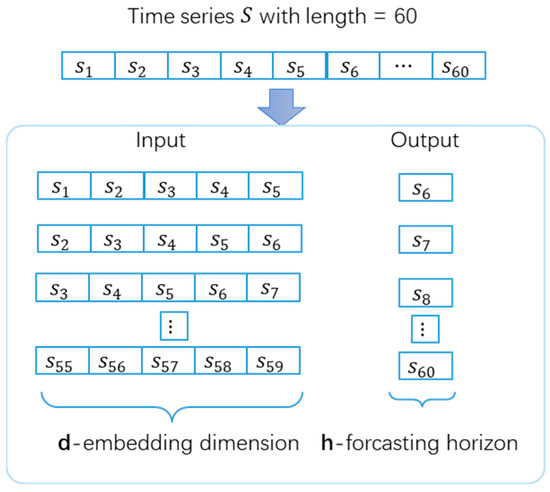
Figure 2.
Dataset format of a time series prediction model.

Table 1.
Hyperparameters of the LSTM model.
Segmenting the TBM working parameters into short subseries can also help evaluate the performance of a prediction model more effectively, as it allows us to obtain prediction results for local regions. As shown in Figure 1, we first calculated the mean absolute percentage error (MAPE) of all the subseries using Equation (2) and then calculated the statistical information of all results.
where is the prediction of , and is the length of the ith subseries.
3.2. Influence of Amount of Training Subseries on Prediction Results
We used different numbers of subseries to create imbalanced training and validation datasets and evaluated the model performance on the testing subseries. After creating imbalanced datasets with a given number of subseries, the training and testing datasets were sampled at a ratio of 4:1. In Figure 3, the black line refers to the connected medians of different boxplots, symbol “-” refers to the minimum and maximum values of all MAPEs, symbol “✕” refers to the 1% and 99% percentiles, and symbol “□” refers to the mean value of all MAPEs. As shown in Figure 3, when the number of subseries was increased from 50 to 150, the overall prediction results decreased significantly as model overfitting occurred owing to the limited number of training samples. When the number of subseries increased from 150 to 250, the model performance decreased slightly owing to model underfitting. In light of this finding, the imbalanced dataset created using 150 subseries was selected as a promising foundation for future research.
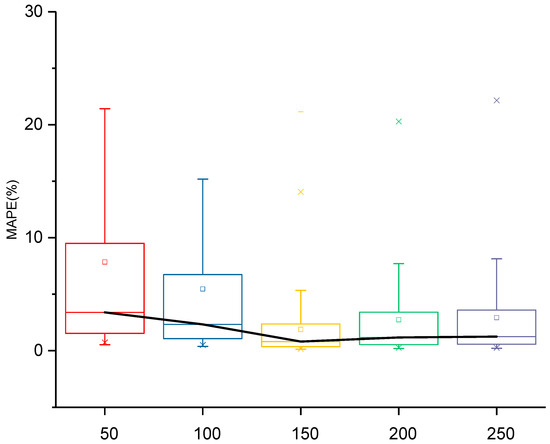
Figure 3.
Prediction results obtained when using different numbers of subseries to create imbalanced datasets.
3.3. Influence of Dataset Imbalance on Prediction Results of TBM Performance
In Section 2, the class imbalance phenomenon and its solutions are introduced. In contrast to classification problems, the TBM performance prediction is a regression task. The first challenge faced by TBM performance prediction is describing the imbalance phenomenon in a regression task. Time-series prediction methods use the historical values of the TBM performance to forecast future values. Unlike theoretical or empirical methods, explicit geological information cannot be acquired from training datasets. Therefore, it is usually difficult to describe the dataset imbalance phenomenon using geological information such as the distribution of rock mass types. To solve this problem, pseudo-labels were assigned to a subseries of TBM working parameters by calculating their mean values. Using pseudo-labels, classification methods for imbalanced datasets can be referenced. We used Equation (3) to assign pseudo-labels to the subseries. Upward rounding is used in Equation (3). If the mean value of a subseries is 0.38, the pseudo-label is 4.
The distribution of the training dataset with pseudo-labels is shown in Figure 4. We can observe that the training dataset is highly imbalanced; the number of type 9 instances can be as high as 39, whereas the number of type 1 instances is only 2.
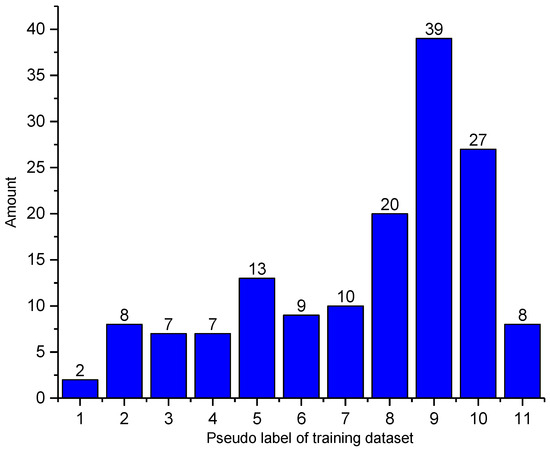
Figure 4.
The dataset imbalance phenomenon in the training dataset.
Figure 5 presents the relationship between the number of pseudo-labels and the prediction results. We can conclude that when the number of a specific pseudo-label increases, the mean MAPE of the testing subseries decreases significantly. Inspired by this finding, a method for creating a balanced dataset for TBM performance prediction is introduced in the next section.

Figure 5.
Influence of the number of pseudo-labels on the prediction results.
3.4. Creating Balanced Training Datasets for the TBM Performance Prediction Model
A flowchart illustrating the creation of a balanced training dataset for the time-series prediction model of TBM performance is shown in Figure 6. The input to the algorithm is an N-subseries of TBM working data such as the torque. Suppose the number of pseudo labels is t and the average amount of subseries for each pseudo label is set as bNum if the training dataset is balanced. For each pseudo-label, the number of corresponding subseries is set as numi. If numi ≥ bNum, then randomly select the bNum subseries with pseudo labels from the input variables without replacement. Otherwise, we first select all subseries with pseudo labeli from the input variables and then generate (bNum-numi) new subseries. To create a new subseries, a subseries is first randomly selected from the input variables of the training dataset. Because we acquired the pseudo-label for each subseries by calculating its mean value, the selected subseries was not in the same range as the target pseudo-label. We then scaled the subseries according to Equation (4) and put it into a balanced dataset.
where is the randomly selected subseries, is the pseudo label of , is the pseudo label of minority working data, and is the newly created subseries for pseudo labeli.
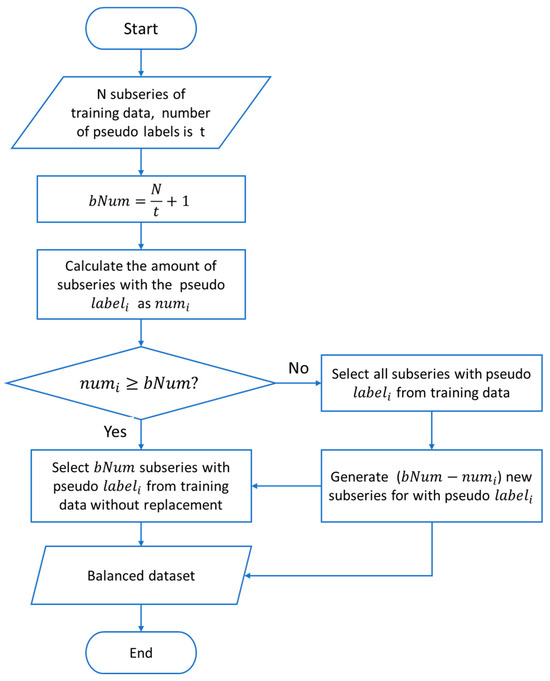
Figure 6.
Flowchart of the proposed method.
The proposed method undersamples majority pseudo-labels and creates new training samples for minority pseudo-labels. Unlike the SMOTE algorithm, which creates new training data by combining samples from the same class, the proposed method uses samples from a different class to generate new training data, thereby avoiding potential overfitting.
4. Results and Discussion
In this section, we compare the prediction results of the TBM performance obtained using imbalanced and balanced datasets in several respects.
4.1. An Overall Comparison of Prediction Results
A comparison of the prediction results using descriptive statistics is presented in Table 2 and Figure 7, and a comparison of the prediction results at the subseries level is shown in Figure 8. The results obtained using the balanced dataset indicated a significant improvement in model performance. The mean MAPE on the testing subseries was reduced from 1.893% to 1.338%, resulting in a 29.3% increase in the model performance. To confirm the significance of the model performance improvement, we conducted further statistical tests. First, the Shapiro–Wilk tests revealed that the prediction results of imbalanced and balanced datasets were not significantly drawn from normally distributed population. Subsequently, we performed a paired sample Wilcoxon signed rank test, and the results indicated that the two distributions of the prediction results of the imbalanced and balanced datasets were significantly different at the 0.05 level. The statistical tests proved that the improvement in the prediction results was due to the resampling and data synthesis strategy instead of random factors.
Table 2.
Descriptive statistics of prediction results using MAPE.
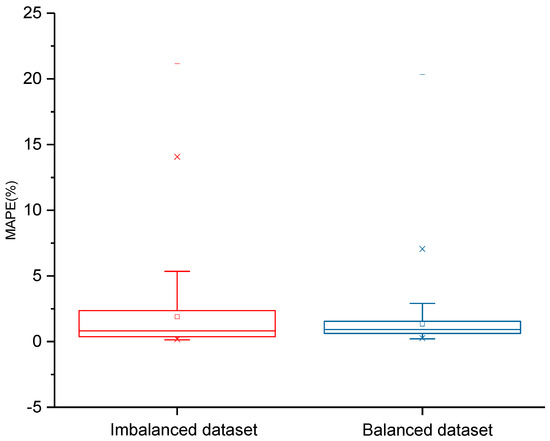
Figure 7.
Comparison of prediction results using different datasets.
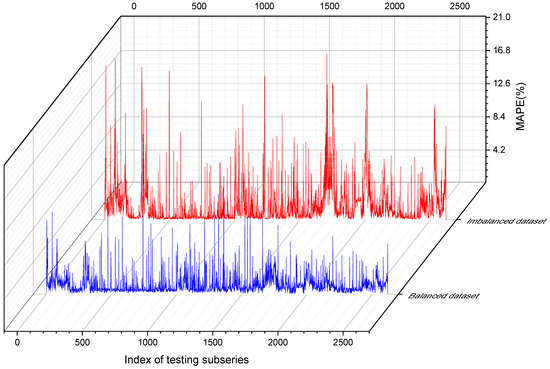
Figure 8.
Comparison of the prediction results at the subseries level.
According to Table 2, some descriptive statistics, such as Q1 and the median, are higher than those of the imbalanced dataset, implying that although the overall model performance has increased, the performance of the prediction model may decrease for some subseries. To better understand the effectiveness of the proposed method, we performed a pairwise comparison of the prediction results for different pseudo-labels in the next section.
4.2. A Detailed Comparison of Prediction Results Using Pseudo Labels
A comparison of the prediction results using different pseudo-labels is presented in Table 3 and Figure 9, where Categories A and B refer to the prediction results obtained from the imbalanced and balanced datasets, respectively. For pseudo-labels, where oversampling was conducted to generate new training samples, the prediction results improved. For the pseudo-labels of undersampling, the prediction results for types 9 and 10 decreased slightly. This finding is consistent with that shown in Figure 5. Generally, when the number of training subseries for a specific pseudo-label was increased, the prediction results improved simultaneously.
Table 3.
Prediction results of TBM performance on different pseudo labels.

Figure 9.
Pairwise comparison of prediction results for different pseudo-labels.
4.3. Comparison with Traditional Methods
In this section, we further compare the proposed method with four other methods frequently used to solve dataset imbalance problems. These algorithms include random oversampling, SMOTE, random undersampling, and prototype generation algorithms. The Python (v3.10) Imbalanced-learn (v.0.14.0) toolbox was adopted to implement these four methods and the default hyperparameters were used [50]. Random oversampling generates new samples through random sampling with replacement, whereas random undersampling generates samples without replacement. Prototype generation is another undersampling method that generates new samples instead of simple sampling. SMOTE generates new training samples for minority classes by interpolating the samples from the same class, which differs from the proposed method. Each method was run five times, and the results were obtained through averaging five experiments. A comparison of the different methods is presented in Table 4 and Figure 10. The proposed method outperformed the other algorithms in terms of the TBM performance prediction.
Table 4.
Prediction results of TBM performance using different resampling methods.
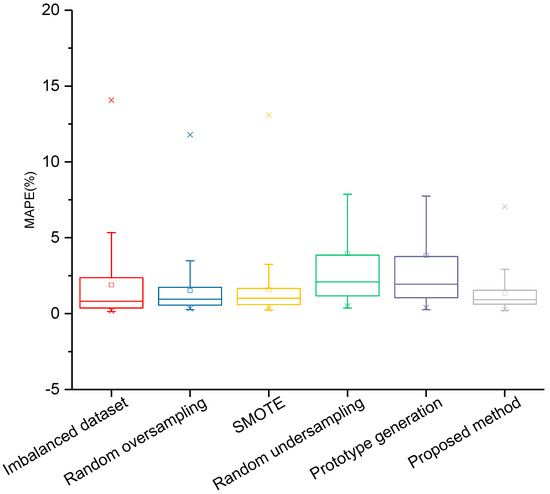
Figure 10.
Comparison of prediction results of TBM performance using different resampling methods.
5. Conclusions
In this study, we predicted the TBM performance under changing geological conditions. The classification of imbalanced datasets has been well studied, but few studies have focused on regression tasks. To illustrate the dataset imbalance phenomenon, pseudo-labels were assigned to the TBM working data subseries. By analyzing the relationship between the number of pseudo-labels and the prediction results, a resampling method was proposed to generate a balanced dataset for the time-series prediction method of TBM performance. The proposed method combines the undersampling of subseries with majority pseudo-labels and the synthesis of new samples for minority pseudo-labels. Numerical experimental results demonstrate that the proposed method can significantly enhance the prediction accuracy of the TBM performance. We also performed a pairwise comparison of the prediction results for the different pseudo-labels. A comparison with other methods for creating balanced datasets also demonstrates the superiority of the proposed method. In future research, it is meaningful to validate the proposed method across multiple projects and TBMs.
Author Contributions
Q.Z., conceptualization, methodology, validation, writing—original draft preparation, visualization, and funding acquisition; S.L. and J.L., validation, data curation, and formal analysis; Z.L., writing—review and editing, resources, supervision, and project administration. All authors have read and agreed to the published version of the manuscript.
Funding
This research was funded by the Shandong Provincial Natural Science Foundation, grant number ZR2021QE303.
Institutional Review Board Statement
Not applicable.
Informed Consent Statement
Not applicable.
Data Availability Statement
The data presented in this study are available upon request from the corresponding author. The data are not publicly available due to privacy.
Acknowledgments
During the preparation of this manuscript, the authors used PaperPal (https://paperpal.cn/) for the purposes of grammar and language polishing. The authors have reviewed and edited the output and take full responsibility for the content of this publication.
Conflicts of Interest
The authors declare no conflicts of interest.
References
- Li, C.; Wang, S.; Qu, T.; Zheng, X.; Zhang, X. Overcoming time delays challenges: Decomposition–Reconstruction approaches for time-series TBM performance predictions. Expert Syst. Appl. 2025, 283, 127739. [Google Scholar] [CrossRef]
- Wu, H.; Jiang, Y.; Li, H.; Xu, W.; Le, Y.; Wang, D.; Huo, J. Electromechanical sensor-based condition monitoring and dynamic load characterization for TBM drive system synchronization analysis. IEEE Sens. J. 2025, 1. [Google Scholar] [CrossRef]
- Mostafa, S.; Sousa, R.L.; Einstein, H.H. Toward the automation of mechanized tunneling “exploring the use of big data analytics for ground forecast in TBM tunnels”. Tunn. Undergr. Space Technol. 2024, 146, 105643. [Google Scholar] [CrossRef]
- Rostami, J. Performance prediction of hard rock Tunnel Boring Machines (TBMs) in difficult ground. Tunn. Undergr. Space Technol. 2016, 57, 173–182. [Google Scholar] [CrossRef]
- Hou, S.; Cheng, L.; Liu, Y. Advance prediction of rockmass conditions during TBM tunnelling based on cost-sensitive learning under imbalance dataset. In Proceedings of the 57th U.S. Rock Mechanics/Geomechanics Symposium, Atlanta, GA, USA, 25–28 June 2023. [Google Scholar]
- Salimi, A.; Rostami, J.; Moormann, C. Evaluating the suitability of existing rock mass classification systems for TBM performance prediction by using a regression tree. Procedia Eng. 2017, 191, 299–309. [Google Scholar] [CrossRef]
- Yin, L.; Miao, C.; He, G.; Dai, F.; Gong, Q. Study on the influence of joint spacing on rock fragmentation under TBM cutter by linear cutting test. Tunn. Undergr. Space Technol. 2016, 57, 137–144. [Google Scholar] [CrossRef]
- Entacher, M.; Rostami, J. TBM performance prediction model with a linear base function and adjustment factors obtained from rock cutting and indentation tests. Tunn. Undergr. Space Technol. 2019, 93, 103085. [Google Scholar] [CrossRef]
- Gertsch, R.; Gertsch, L.; Rostami, J. Disc cutting tests in Colorado Red Granite: Implications for TBM performance prediction. Int. J. Rock Mech. Min. Sci. 2007, 44, 238–246. [Google Scholar] [CrossRef]
- Cho, J.-W.; Jeon, S.; Jeong, H.-Y.; Chang, S.-H. Evaluation of cutting efficiency during TBM disc cutter excavation within a Korean granitic rock using linear-cutting-machine testing and photogrammetric measurement. Tunn. Undergr. Space Technol. 2013, 35, 37–54. [Google Scholar] [CrossRef]
- Entacher, M.; Lorenz, S.; Galler, R. Tunnel boring machine performance prediction with scaled rock cutting tests. Int. J. Rock Mech. Min. Sci. 2014, 70, 450–459. [Google Scholar] [CrossRef]
- Ma, H.; Gong, Q.; Wang, J.; Yin, L.; Zhao, X. Study on the influence of confining stress on TBM performance in granite rock by linear cutting test. Tunn. Undergr. Space Technol. 2016, 57, 145–150. [Google Scholar] [CrossRef]
- Park, J.-Y.; Kang, H.; Lee, J.-W.; Kim, J.-H.; Oh, J.-Y.; Cho, J.-W.; Rostami, J.; Kim, H.D. A study on rock cutting efficiency and structural stability of a point attack pick cutter by lab-scale linear cutting machine testing and finite element analysis. Int. J. Rock Mech. Min. Sci. 2018, 103, 215–229. [Google Scholar] [CrossRef]
- Fattahi, H.; Babanouri, N. Applying optimized support vector regression models for prediction of tunnel boring machine performance. Geotech. Geol. Eng. 2017, 35, 2205–2217. [Google Scholar] [CrossRef]
- Mikaeil, R.; Naghadehi, M.Z.; Ghadernejad, S. An extended multifactorial fuzzy prediction of hard rock TBM penetrability. Geotech. Geol. Eng. 2018, 36, 1779–1804. [Google Scholar] [CrossRef]
- Salimi, A.; Rostami, J.; Moormann, C.; Hassanpour, J. Examining feasibility of developing a rock mass classification for hard rock TBM application using non-linear regression, regression tree and generic programming. Geotech. Geol. Eng. 2018, 36, 1145–1159. [Google Scholar] [CrossRef]
- Narimani, S.; Chakeri, H.; Davarpanah, S.M. Simple and non-linear regression techniques used in Sandy-Clayey soils to predict the pressuremeter modulus and limit pressure: A case study of Tabriz subway. Period. Polytech. Civ. Eng. 2018, 62, 825–839. [Google Scholar] [CrossRef]
- Jakubowski, J.; Stypulkowski, J.B.; Bernardeau, F.G. Multivariate linear regression and cart regression analysis of TBM performance at Abu Hamour phase-I tunnel. Arch. Min. Sci. 2017, 62, 825–841. [Google Scholar] [CrossRef]
- Yagiz, S. Utilizing rock mass properties for predicting TBM performance in hard rock condition. Tunn. Undergr. Space Technol. 2008, 23, 326–339. [Google Scholar] [CrossRef]
- Salimi, A.; Faradonbeh, R.S.; Monjezi, M.; Moormann, C. TBM performance estimation using a classification and regression tree (CART) technique. Bull. Eng. Geol. Environ. 2018, 77, 429–440. [Google Scholar] [CrossRef]
- Feng, S.; Chen, Z.; Luo, H.; Wang, S.; Zhao, Y.; Liu, L.; Ling, D.; Jing, L. Tunnel boring machines (TBM) performance prediction: A case study using big data and deep learning. Tunn. Undergr. Space Technol. 2021, 110, 103636. [Google Scholar] [CrossRef]
- Lee, H.-L.; Song, K.-I.; Qi, C.; Kim, J.-S.; Kim, K.-S. Real-time prediction of operating parameter of TBM during tunneling. Appl. Sci. 2021, 11, 2967. [Google Scholar] [CrossRef]
- Qin, C.; Shi, G.; Tao, J.; Yu, H.; Jin, Y.; Lei, J.; Liu, C. Precise cutterhead torque prediction for shield tunneling machines using a novel hybrid deep neural network. Mech. Syst. Signal Process. 2021, 151, 107386. [Google Scholar] [CrossRef]
- Mahmoodzadeh, A.; Nejati, H.R.; Mohammadi, M.; Hashim Ibrahim, H.; Rashidi, S.; Ahmed Rashid, T. Forecasting tunnel boring machine penetration rate using LSTM deep neural network optimized by grey wolf optimization algorithm. Expert Syst. Appl. 2022, 209, 118303. [Google Scholar] [CrossRef]
- Wang, K.; Zhang, L.; Fu, X. Time series prediction of tunnel boring machine (TBM) performance during excavation using causal explainable artificial intelligence (CX-AI). Autom. Constr. 2023, 147, 104730. [Google Scholar] [CrossRef]
- Gao, X.; Shi, M.; Song, X.; Zhang, C.; Zhang, H. Recurrent neural networks for real-time prediction of TBM operating parameters. Autom. Constr. 2019, 98, 225–235. [Google Scholar] [CrossRef]
- Wang, K.; Wu, X.; Zhang, L.; Song, X. Data-driven multi-step robust prediction of TBM attitude using a hybrid deep learning approach. Adv. Eng. Inform. 2023, 55, 101854. [Google Scholar] [CrossRef]
- Zhang, Q. Temporal-spatial prediction methods of TBM performance with evaluation of its transferring ability. KSCE J. Civ. Eng. 2025, 29, 100077. [Google Scholar] [CrossRef]
- Chawla, N.V.; Bowyer, K.W.; Hall, L.O.; Kegelmeyer, W.P. SMOTE: Synthetic minority over-sampling technique. J. Artif. Intell. Res. 2002, 16, 321–357. [Google Scholar] [CrossRef]
- Batista, G.E.; Prati, R.C.; Monard, M.C. A study of the behavior of several methods for balancing machine learning training data. ACM SIGKDD Explor. Newsl. 2004, 6, 20–29. [Google Scholar] [CrossRef]
- Guo, H.; Viktor, H.L. Learning from imbalanced data sets with boosting and data generation: The databoost-im approach. ACM SIGKDD Explor. Newsl. 2004, 6, 30–39. [Google Scholar] [CrossRef]
- Sun, Y.; Kamel, M.S.; Wong, A.K.; Wang, Y. Cost-sensitive boosting for classification of imbalanced data. Pattern Recognit. 2007, 40, 3358–3378. [Google Scholar] [CrossRef]
- Masnadi-Shirazi, H.; Vasconcelos, N. Cost-sensitive boosting. IEEE Trans. Pattern Anal. Mach. Intell. 2010, 33, 294–309. [Google Scholar] [CrossRef] [PubMed]
- Thai-Nghe, N.; Gantner, Z.; Schmidt-Thieme, L. Cost-sensitive learning methods for imbalanced data. In Proceedings of the 2010 International Joint Conference on Neural Networks (IJCNN), Barcelona, Spain, 18–23 July 2010; pp. 1–8. [Google Scholar]
- Domingos, P. Metacost: A general method for making classifiers cost-sensitive. In Proceedings of the Fifth ACM SIGKDD International Conference on Knowledge Discovery and Data Mining, San Diego, CA, USA, 15–18 August 1999; pp. 155–164. [Google Scholar]
- Greiner, R.; Grove, A.J.; Roth, D. Learning cost-sensitive active classifiers. Artif. Intell. 2002, 139, 137–174. [Google Scholar] [CrossRef]
- Liu, X.-Y.; Zhou, Z.-H. The influence of class imbalance on cost-sensitive learning: An empirical study. In Proceedings of the Sixth International Conference on Data Mining (ICDM’06), Hong Kong, China, 18–22 December 2006; pp. 970–974. [Google Scholar]
- Chawla, N.V.; Japkowicz, N.; Kotcz, A. Special issue on learning from imbalanced data sets. ACM SIGKDD Explor. Newsl. 2004, 6, 1–6. [Google Scholar] [CrossRef]
- Han, H.; Wang, W.-Y.; Mao, B.-H. Borderline-SMOTE: A new over-sampling method in imbalanced data sets learning. In Proceedings of the 2005 International Conference on Intelligent Computing, Hefei, China, 23–26 August 2005; pp. 878–887. [Google Scholar]
- Wang, S. A hybrid SMOTE and Trans-CWGAN for data imbalance in real operational AHU AFDD: A case study of an auditorium building. Energy Build. 2025, 348, 116447. [Google Scholar] [CrossRef]
- He, H.; Bai, Y.; Garcia, E.A.; Li, S. ADASYN: Adaptive synthetic sampling approach for imbalanced learning. In Proceedings of the 2008 IEEE International Joint Conference on Neural Networks (IEEE World Congress on Computational Intelligence), Hong Kong, China, 1–8 June 2008; pp. 1322–1328. [Google Scholar]
- Japkowicz, N.; Myers, C.; Gluck, M. A novelty detection approach to classification. In Proceedings of the IJCAI, Montreal, QC, Canada, 20–25 August 1995; pp. 518–523. [Google Scholar]
- Manevitz, L.M.; Yousef, M. One-class SVMs for document classification. J. Mach. Learn. Res. 2001, 2, 139–154. Available online: https://dl.acm.org/doi/10.5555/944790.944808 (accessed on 9 November 2025).
- Raskutti, B.; Kowalczyk, A. Extreme re-balancing for SVMs: A case study. ACM SIGKDD Explor. Newsl. 2004, 6, 60–69. [Google Scholar] [CrossRef]
- Ertekin, S.; Huang, J.; Bottou, L.; Giles, L. Learning on the border: Active learning in imbalanced data classification. In Proceedings of the Sixteenth ACM Conference on Information and Knowledge Management, Lisbon, Portugal, 6–10 November 2007; pp. 127–136. [Google Scholar]
- Tomanek, K.; Hahn, U. Reducing class imbalance during active learning for named entity annotation. In Proceedings of the Fifth International Conference on Knowledge Capture, Redondo Beach, CA, USA, 1–4 September 2009; pp. 105–112. [Google Scholar]
- Zhu, J.; Hovy, E. Active learning for word sense disambiguation with methods for addressing the class imbalance problem. In Proceedings of the 2007 Joint Conference on Empirical Methods in Natural Language Processing and Computational Natural Language Learning (EMNLP-CoNLL), Prague, Czech Republic, 28–30 June 2007; pp. 783–790. [Google Scholar]
- Zhang, Q.; Liu, Z.; Tan, J. Prediction of geological conditions for a tunnel boring machine using big operational data. Autom. Constr. 2019, 100, 73–83. [Google Scholar] [CrossRef]
- Park, S.; Kim, J.; Kim, J.; Wang, S. Fault diagnosis of air handling units in an auditorium using real operational labeled data across different operation modes. J. Comput. Civ. Eng. 2025, 39, 04025065. [Google Scholar] [CrossRef]
- Lemaître, G.; Nogueira, F.; Aridas, C.K. Imbalanced-learn: A python toolbox to tackle the curse of imbalanced datasets in machine learning. J. Mach. Learn. Res. 2017, 18, 559–563. [Google Scholar]
Disclaimer/Publisher’s Note: The statements, opinions and data contained in all publications are solely those of the individual author(s) and contributor(s) and not of MDPI and/or the editor(s). MDPI and/or the editor(s) disclaim responsibility for any injury to people or property resulting from any ideas, methods, instructions or products referred to in the content. |
© 2025 by the authors. Licensee MDPI, Basel, Switzerland. This article is an open access article distributed under the terms and conditions of the Creative Commons Attribution (CC BY) license (https://creativecommons.org/licenses/by/4.0/).