Abstract
In intelligent meter reading and other applications, power line communication can use relay technology to solve the problem of cross-station or long-distance reliable communication. This study investigates the combined impact of the physical and Media Access Control (MAC) layers on power line relay communication system performance. To this end, cross-layer modeling, optimization, and simulation analysis integrating both layers are conducted. Based on the CSMA algorithm of IEEE 1901 protocol, a cross-layer performance analysis model of two-hop relay power line communication system is established considering the influence of non-ideal channel transmission at physical layer and competitive access at MAC layer on system performance. In order to reduce the high collision probability caused by two competitions of packets in the above scheme, an improved two-hop transmission algorithm based on CSMA-TDMA is proposed. The cross-layer performance of the system under different single-hop and two-hop schemes is compared, and the mechanism of how parameters such as the MAC layer and the physical layer affect the cross-layer performance of the power line communication system is analyzed. And the optimal power allocation factor is obtained by using the sequential quadratic programming method for the joint system throughput and packet loss rate optimization model with the two-hop power constraint. Simulation results show that the two-hop transmission scheme based on CSMA-TDMA can avoid the second-hop competition and backoff process, and has better performance in terms of throughput, packet loss rate, and delay.
1. Introduction
Power Line Communication (PLC) is not only a key technology supporting communication in Advanced Metering Infrastructure (AMI), but also an essential means for establishing a reliable, efficient, and bidirectional communication network in the smart grid, enabling the seamless integration of power flow and information flow [1,2]. Compared with other communication technologies such as wireless and optical fiber communication, PLC leverages existing power distribution lines to transmit data and provides flexible access for various terminal devices. It offers significant advantages, including low deployment cost and wide coverage, making it an effective communication solution for ensuring reliable data exchange in power distribution and consumption services, as well as for addressing the “last mile” communication challenge [3,4]. PLC has been widely applied in remote automatic meter reading, ubiquitous power Internet of Things (UPIoT), and smart home scenarios, and thus holds substantial potential for future development.
However, PLC channels are subject to noise, multipath effects, impedance mismatch, and frequency-selective fading due to connected electrical devices, which severely degrade communication quality and stability [5,6,7]. Moreover, PLC is typically confined to a specific transformer area or meter coverage. To enable reliable long-distance communication, cooperative PLC techniques using two-hop relaying and hybrid communication have gained significant research attention. Reference [8] conducted a comprehensive comparison between single-hop and two-hop PLC systems and analyzed the energy efficiency performance of different relay schemes, including amplify-and-forward (AF), decode-and-forward (DF), selective decode-and-forward (SDF), and incremental decode-and-forward (IDF), deriving precise analytical expressions for the outage probability and minimum energy per bit. Reference [9] investigated the trade-off between throughput and energy efficiency under the AF relaying protocol and proposed an algorithm that determines, based on feedback from the destination node, whether direct transmission succeeds and whether relaying is necessary. Fernandes V. et al. [10] studied a hybrid wireless–PLC relay network architecture for smart grids, demonstrating that parallel transmission can achieve diversity gains through complementary advantages, thereby improving overall system reliability. For hybrid wireless–PLC networks, reference [11] proposed a dual-interface adaptive relay selection algorithm that autonomously selects the optimal interface for message forwarding according to the channel state. These studies have effectively enhanced the data rate and reliability of PLC systems at the physical layer and can be applied to cross-transformer-area or cross-meter communication in automatic meter reading scenarios.
Meanwhile, data communication performance is closely tied to the Medium Access Control (MAC) layer [12]. Unfair resource allocation, starvation, collisions, and channel access delays can impair upper-layer user satisfaction and overall system efficiency. Therefore, an in-depth study of MAC protocols for PLC is of great importance. Reference [13] proposed a random access MAC protocol based on the combination of time and frequency multiplexing, which demonstrated excellent performance in terms of collision probability, system throughput, and delay. Reference [14] introduced an improved CSMA-based selection algorithm designed for hybrid power line and wireless communication networks, which utilizes both power line and wireless idle detection strategies. This algorithm effectively enhances throughput and ensures network efficiency. de Oliveira R. M. et al. [15] developed a dynamic network-coded MAC protocol for PLC based on a time division multiple access–orthogonal frequency division multiplexing (TDMA–OFDM) scheme. The protocol dynamically selects relay nodes and performs store-and-forward operations using linear combinations of PLC frames, which are then decoded at the final destination. The aforementioned schemes improve the performance and efficiency of PLC networks in terms of packet loss rate, throughput, and transmission delay.
Most existing PLC studies focus separately on the physical or MAC layer, paying limited attention to how physical-layer errors affect MAC performance. Few have adopted a cross-layer perspective, yet such analysis is essential for accurate performance prediction and protocol optimization. Reference [16] proposed a MAC-layer access control scheme based on channel prediction, which fully exploits channel sensing results and contention conditions to forecast the channel state in the next and remaining time slots, while employing a recursive prediction error method for parameter estimation. Reference [17] addressed the issue of resource allocation under concurrent multi-service conditions by establishing a cross-layer resource allocation model through data mapping among the application, data link, and physical layers. The proposed algorithm significantly improves resource utilization in orthogonal frequency-division multiplexing (OFDM)-based broadband PLC systems. Qian Y. et al. [18] considered the constraints of network topology, interference, and traffic fairness, formulating the subchannel allocation problem in home PLC networks within smart grids as a linear programming problem. This method achieves superior performance in enhancing overall network throughput while maintaining traffic fairness among network users.
At present, most cross-layer performance studies on power line communication (PLC) have primarily focused on end-to-end single-hop transmission, emphasizing techniques such as resource scheduling, optimized allocation, and adaptive retransmission to enhance overall system performance. However, limited research has been devoted to exploring the interaction mechanisms between physical-layer and MAC-layer parameters in two-hop PLC systems, and comprehensive cross-layer performance analyses remain scarce. Crucially, existing two-hop MAC strategies often inherit the contention-based access of protocols like IEEE 1901′s CSMA for both hops. In dense node deployments typical of AMI or UPIoT scenarios, this leads to a fundamental performance bottleneck: data packets must survive two independent and sequential contention processes, exponentially increasing the likelihood of collision-induced failure and unpredictable delay, which severely undermines the reliability gains achieved at the physical layer through relaying [8,9].
In recent years, significant advances have been made in cross-layer design and hybrid communication techniques for PLC systems. To reflect these advances and clarify the motivation of this study, several recent and representative research works are reviewed. Reference [19] developed a blockchain-enabled communication framework that emphasizes the significance of MAC-layer coordination for improving smart grid reliability. In addition, Liu et al. [20] investigated opportunistic decode-and-forward (DF) and amplify-and-forward (AF) selection relaying in hybrid wireless–PLC networks for indoor IoT environments, validating that adaptive relay cooperation can effectively enhance system robustness against noise and multipath interference.
These studies indicate that although independent physical- or MAC-layer optimization techniques have achieved considerable progress, joint modeling and interaction analysis across both layers have not been sufficiently investigated in relay-based PLC networks. Furthermore, there is a lack of MAC-layer solutions specifically designed to mitigate the dual-contention problem in two-hop PLC, which is critical for applications like automatic meter reading across transformer areas where reliable and timely data delivery is paramount. Building upon these observations, it is essential to integrate the physical and MAC layers for accurate system performance analysis and cross-layer protocol optimization. Therefore, this paper establishes a cross-layer performance modeling, optimization, and simulation framework for a two-hop relay PLC system that jointly considers both the physical and MAC layers. To succinctly position our work against the existing literature, a comparative summary is provided in Table 1.

Table 1.
Comparative summary of existing PLC-related research and this work.
The main contributions of this paper are summarized as follows:
- A cross-layer performance analysis model combining the physical layer and MAC layer is developed for a two-hop relay PLC system. Based on the IEEE 1901 MAC-layer CSMA algorithm, both hops adopt CSMA-based transmission schemes. To mitigate the high collision probability caused by dual contention processes, an improved CSMA–TDMA-based two-hop transmission scheme is proposed, which eliminates the contention in the second hop and is therefore particularly suited for delay-sensitive and reliable communication in AMI and UPIoT scenarios. Its performance is analyzed and compared with conventional schemes.
- The impact of imperfect channel transmission on the MAC layer is considered by jointly modeling the MAC-layer backoff procedure and physical-layer channel conditions. Analytical expressions for normalized throughput, packet loss rate, and transmission delay are derived, and extensive simulations are conducted to validate the accuracy and reliability of the theoretical model. Our results quantitatively demonstrate that the dual contention in a conventional two-hop CSMA scheme can lead to a collision probability exceeding 60% under moderate network loads, severely limiting throughput. The simulation results further compare the cross-layer performance of single-hop and two-hop schemes and reveal the effects of physical-layer and MAC-layer parameters on system behavior.
- For the PLC relay system, a joint optimization model is established to maximize system throughput and minimize packet loss under power constraints. The optimal power allocation factor under various parameter settings is determined using the Sequential Quadratic Programming (SQP) method, which effectively optimizes power allocation with high computational accuracy.
2. System Model
Figure 1 illustrates the cross-layer performance analysis model of the two-hop relay power line communication (PLC) system. At the physical layer, a typical three-node model is adopted, consisting of a source node (S), a destination node (D), and a relay node (R), operating under a two-slot, half-duplex relay scheme. Power line communication is performed between the source S and relay R, and between the relay R and destination D. The PLC channel considers log-normal fading (logarithmic normal distribution, LgN-D) and Bernoulli–Gaussian noise to capture realistic channel impairments. The source node S contains nodes , the destination node D contains nodes , and within the listening range of relay node R there are interference nodes randomly distributed within a defined area. The relay node R does not generate its own data packets but serves solely to forward packets between the source and destination. Specifically, the source node S sends packets containing the destination address to relay R. Upon receiving the packets, relay R verifies the destination address and then forwards the packets accordingly. Finally, the destination node D receives the relayed packets, completing the two-hop communication process.
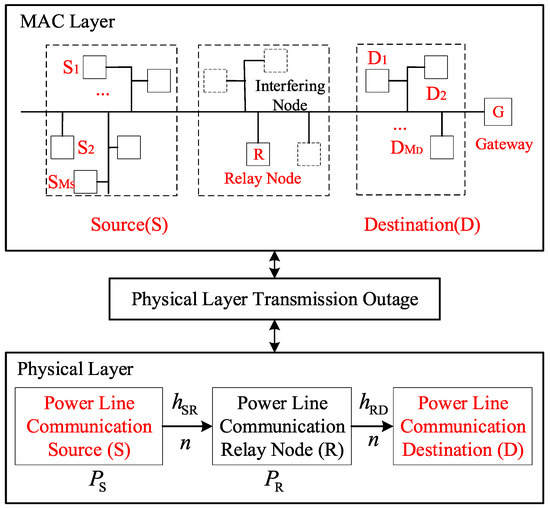
Figure 1.
Two-hop power line cross-layer performance analysis model.
and denote the channel fading coefficients for the S–R link and R–D link, respectively. Considering that power-line channel fading follows a log-normal distribution (LgN-D) and assuming that all channels are independent, the fading coefficients for the S–R and R–D links satisfy the log-normal distribution:
where , and are the mean and standard deviation of the variables, respectively. To avoid the influence of channel fading on the average signal power, the envelope energy of the fading channel is normalized, i.e., , such that .
Let denote the noise in the power line channel, which is modeled using the Bernoulli–Gaussian model. It comprises background noise and impulse noise. Its probability density function (PDF) is given as follows:
Here, and represent normal distributions, and is the probability of impulse noise occurrence. and denote the power of background noise and impulse noise, respectively, with the average total noise power being . To simplify the model, let represent the ratio between the background noise power and the impulse noise power.
3. Cross-Layer Analysis of Two-Hop Relay Power Line Communication
Figure 2 logically divides the functional modules of the two-hop PLC relay system: the physical layer is responsible for channel modeling and outage analysis, the MAC layer focuses on protocol parameter configuration and collision calculation, and the cross-layer module integrates data from both layers to derive key performance metrics. This diagram lays a graphical foundation for the cross-layer performance analysis in Section 3.
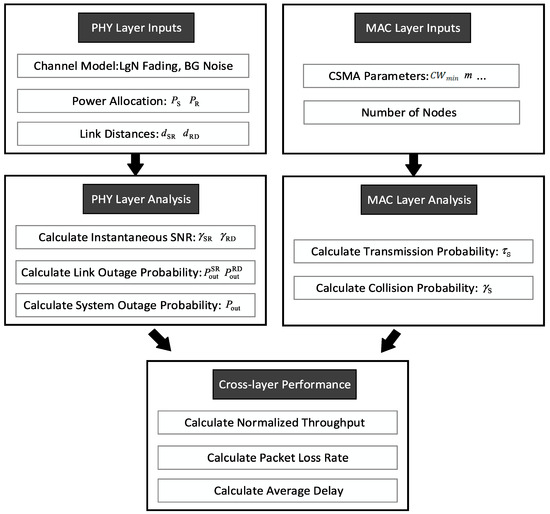
Figure 2.
Flowchart for cross-layer performance analysis of two-hop PLC relay networks.
3.1. Physical Layer Signal Processing
The relay R operates in half-duplex mode, with transmission and reception occurring in two orthogonal time slots to avoid self-interference. The signal at R is given by:
In the equation, denotes the transmitted signal from S, satisfying ; represents the transmission power of S, and is the noise term.
Taking into account both small-scale fading and shadow fading, can be expressed as:
Here, denotes the channel fading coefficient of the S–R link in the power line channel, and represents the link distance between the source S and the relay node R. is the path loss exponent, which typically ranges from 1.3 to 3.3 [21].
Under the DF protocol, the relay node R decodes the received signal by hard decision and then forwards it to the destination D. The signal at D is given by:
In the equation, ; represents the channel fading coefficient of the R–D link in the power line channel, and denotes the link distance between the relay node R and the destination D. is the transmission power of R, and is the noise term.
The instantaneous signal-to-noise ratios (SNRs) of the S–R and R–D links in the system model can be expressed as:
Here, ; represents the noise power when only background noise exists, and represents the noise power under the combined effect of background and impulse noise. According to the properties of log-normal fading distribution: if , then . Thus, also follows a log-normal distribution and can be expressed as . According to Equation (6), when is constant, by the property of the log-normal distribution: if , then . Therefore, the probability density function (PDF) of the instantaneous signal-to-noise ratio (SNR) of the S–R link in the power line channel satisfies:
Similarly, the probability density function (PDF) of the instantaneous signal-to-noise ratio (SNR) of the R–D link satisfies:
3.2. Outage Probability Analysis
According to the definition of outage probability, when the signal-to-noise ratio (SNR) of the channel, γ, falls below a minimum threshold , normal system communication will be interrupted. Thus, the outage probability of the S–R link in the power line channel is given by:
In the above equation, denotes the cumulative distribution function (CDF) of γ. According to Equation (8), the CDF of the instantaneous signal-to-noise ratio (SNR) of the S–R link can be expressed as:
By substituting Equation (11) into Equation (10), the outage probability of the S–R link can be expressed as follows:
Here, is the probability of impulse noise occurrence. and denote the cumulative distribution functions (CDFs) of the instantaneous signal-to-noise ratio (SNR) of the S–R link under background noise alone and under combined background and impulse noise, respectively.
Similarly, the outage probability of the R–D link can be expressed as:
From Equations (12) and (13), the system outage probability can be expressed as:
3.3. Cross-Layer Performance Analysis of a Two-Hop Relay PLC System
Based on the above resource allocation scheme, when the resource demands of nodes exceed the available resources, and under dynamically changing network conditions, finding the optimal solution becomes complex. To address this, we introduce Deep Reinforcement Learning (DRL) technology to optimize the resource allocation strategy and achieve adaptive allocation of multi-frame resources, thereby responding more effectively to the dynamic network environment.
Previous MAC-layer studies in PLC assume ideal physical-layer conditions, neglecting outages caused by channel fading or noise and attributing transmission failures solely to MAC-layer collisions. This section incorporates the impact of physical-layer outages into the performance analysis of a two-hop relay PLC system. This approach facilitates the evaluation of key cross-layer performance metrics, including normalized throughput and packet loss rate.
In the IEEE 1901 CSMA algorithm, let be a random variable representing the number of transmission attempts experienced by a successfully transmitted packet. At the same time, let also be a random variable representing the total number of time slots consumed during the backoff process for a successfully transmitted packet. According to the renewal–reward theorem (where is the reward and is the renewal period), the average transmission attempt probability of nodes at the source S [22] is given as follows:
In the above equation, represents the expected number of time slots spent in the backoff process for each successfully transmitted packet, and represents the expected number of transmission attempts for each successfully transmitted packet. The expressions for and are given as follows:
Here, is the number of backoff stages, denotes the expected number of time slots a node spends in backoff stage , represents the probability that a node in backoff stage ends this stage through a transmission attempt, and denotes the probability that backoff stage ends with a successful transmission. Their expressions are given as follows:
Here, denotes the contention window size of stage in the power line, represents the value randomly selected by the backoff counter BC within when a node enters backoff stage , and denotes the initial value of the defer counter (DC) in backoff stage .
A node’s transmission attempt experiences a fixed collision probability , and nodes detect the medium as busy during any time slot with a fixed probability . Therefore, the probability that a node transmits in a randomly chosen time slot can be calculated as a function of . The collision probability for the source node S is given as follows:
Here, denotes the number of nodes at the source S. By jointly solving Equations (15) and (19) through iteration, the values of and can be obtained. Similarly, the transmission probability and collision probability of the relay node R can also be derived.
3.3.1. Two-Hop Transmission Scheme Based on CSMA
This section considers a two-hop transmission protocol based on independent contention, where both the first hop and the second hop adopt the IEEE 1901 CSMA protocol. The second-hop transmission only occurs when the data packet of the first hop is successfully transmitted to the relay R. Furthermore, to enable relay R to avoid unnecessary forwarding, a bit defined as the PLCP flag [23] is reserved in the PHY Layer Convergence Protocol (PLCP) header of IEEE 1901. If a packet at the source S requires relaying by R, ; otherwise, . Upon receiving a packet with , relay R forwards it to the destination D.
Figure 3 illustrates the timing diagram of the two-hop transmission protocol. In the first hop, the source S first senses the channel and waits for a Contention Inter-Frame Space (CIFS) delay. Then, after two Priority Resolution Slots (PRS0 and PRS1), it begins the CSMA backoff process. Nodes that win the contention transmit their data packets to the relay node R. Upon successfully receiving a packet, R waits for a Response Inter-Frame Space (RIFS) and then sends an acknowledgment (ACK). Next, R repeats the first-hop process to relay the successfully received packets from S. If interference nodes around R transmit packets to the destination D simultaneously with R, a collision occurs during the second-hop transmission. In such cases, R delays for an Extended Inter-Frame Space (SIFS) and then re-enters the backoff process until the packet is successfully delivered to the destination D.
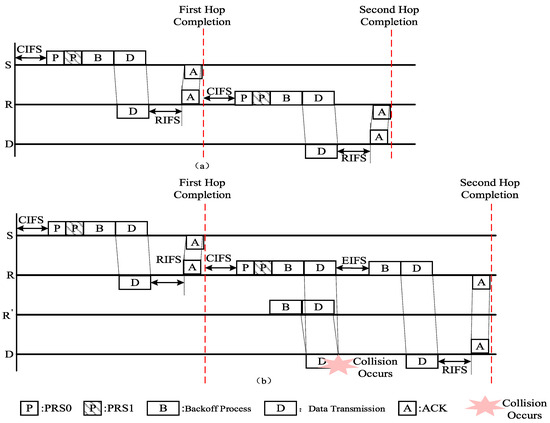
Figure 3.
Two-hop transmission protocol based on independent contention. (a) Successful two-hop transmission; (b) Collision in the second hop.
To calculate the normalized throughput of the system, it is first necessary to compute the total idle time of the system channel , the duration of a successful packet transmission , the total time of packet collisions , and the total time of packet transmission failures due to channel outages , as follows:
Here, represent the idle probabilities of the source S and the relay node R, represent the probabilities of successful transmissions by S and R, and represent the probabilities of collisions involving S and R. The normalized throughput of the cross-layer model can be expressed as:
Here, is the frame duration, is the slot duration, is the duration of a successful transmission, is the duration of a collision, and is the duration of an outage.
Furthermore, according to Equations (14) and (19), the packet loss rate of the cross-layer model in which both hops use the CSMA algorithm can also be calculated. The system packet loss rate consists of three parts: packets that fail to transmit due to collisions in the two contention processes and packets that fail to transmit due to channel outages, as expressed below:
For a two-hop relay transmission system, the average delay required for a packet to be successfully transmitted over both hops is given by Equation (26). This includes the average backoff delay experienced by the node before transmitting the packet, the time lost due to collisions during the two-hop transmission, and the overhead of other time intervals.
Here, is the average number of time slots spent in the backoff process for a node to successfully transmit a packet, and its expression is given in Equation (16). denotes the average time length of one backoff slot in the BC process for the first hop and the second hop of the power line, and its expressions are as follows:
3.3.2. CSMA-TDMA-Based Two-Hop Transmission Scheme
The CSMA algorithm is a contention-based mechanism, and as the number of nodes increases, contention among nodes becomes more frequent, leading to a higher collision probability. To ensure throughput and reliability in a two-hop relay transmission system and to reduce the delay of two-hop transmissions, this section considers a two-hop transmission protocol based on CSMA-TDMA. In this scheme, the first hop uses the IEEE 1901 CSMA protocol, while the second hop adopts a contention-free centralized TDMA protocol. The relay node R acts as the central control node in the region, periodically exchanging control information with other nodes within its listening range to accomplish dynamic slot requests and allocation. Slot synchronization adopts a master–slave synchronization approach, with relay node R broadcasting beacon frames for time synchronization [24], ensuring that the times of other nodes remain consistent with R’s time. The first-hop transmission process during the CSMA-TDMA two-hop transmission scheme is the same as the CSMA-based process described above. The following focuses on the frame structure and process of the second-hop TDMA protocol.
Figure 4 illustrates the frame structure and transmission timing diagram of the second-hop TDMA protocol during the CSMA-TDMA two-hop transmission scheme. The TDMA frame structure is divided into a beacon frame, a control period, and a data period [23,24,25,26,27]. The beacon frame is used for time synchronization among nodes. The control period facilitates the exchange of control packets between the relay node and other nodes, reserving transmission slots for each node. The control period consists of a request subframe and a response subframe. Both subframes are divided into (N) slots, where (N) is the number of nodes within the listening range of relay node R. Each node is assigned one control slot. The data period is used for data transmission and is divided into (N+1) slots. Each node within the listening range is assigned an ID number, which is used to identify its corresponding control slot and the transmission slot assigned to it. The protocol’s control packets include Slot Request (SRQ) frames and Slot Confirm (SCF) frames. The SRQ frame is used by each node to request transmission slots from relay node R and contains the frame type, node ID, destination node ID, and other information. The SCF frame is used by each node to confirm the assigned transmission slots from R and contains the frame type and the assigned slot numbers.
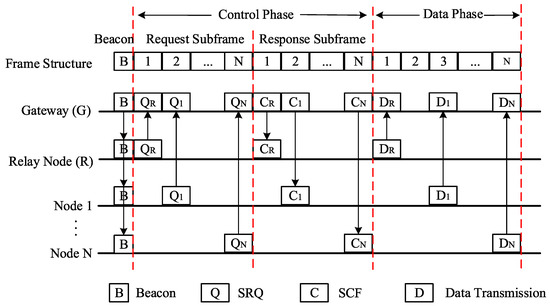
Figure 4.
TDMA protocol frame structure and second-hop transmission timing diagram.
Nodes at the source S that succeed in contention transmit their packets to the relay node R. When R receives a packet from S that requires relaying, it initiates the second-hop TDMA process. First, the relay node broadcasts a Beacon message to the nodes within its listening range to wake them and perform time synchronization. Nodes with packets to send transmit Slot Request (SRQ) frames to relay node R during the request subframe phase. Relay node R maintains a slot occupancy table recording the usage of slots in the data period and the destination node information, as shown in Table 2. Based on the information in the SRQ frames, R allocates available slots in the data period to requesting nodes and updates the slot occupancy table. During the response subframe, R sends the slot allocation information to the corresponding nodes via Slot Confirm (SCF) frames. Each node then transmits its data packet in the assigned transmission slot. The first slot in the data period is fixedly assigned to relay node R to forward the packet from S that requires relaying, while the remaining slots are dynamically allocated to other nodes needing to transmit data. After transmission is completed, all slots are released and the slot occupancy table is updated. Meanwhile, relay node R maintains its association with the destination node, periodically receiving Beacon messages broadcasted by the gateway and initiating necessary slot reservation requests based on different service requirements.

Table 2.
Slot occupancy table structure.
The normalized throughput and the average delay of the cross-layer system based on the CSMA-TDMA two-hop transmission scheme can be expressed as follows:
Here, is the length of the superframe, is the duration of the beacon period, is the duration of the control period, and is the duration of the data period.
The system packet loss rate of the CSMA-TDMA two-hop algorithm consists of two parts: packet transmission failures due to collisions during the first-hop contention process, and packet transmission failures during the second hop in the assigned time slots due to channel outages, as expressed below:
3.3.3. Complexity and Scalability Analysis
Building upon the comparative analysis, a further examination of the complexity and scalability of the proposed CSMA-TDMA scheme is provided. While the standard two-hop CSMA protocol suffers from a linear increase in contention overhead and collision probability with the number of nodes N, leading to an unsustainable escalation of latency and packet loss, the proposed hybrid scheme introduces a more favorable complexity profile.
The primary source of complexity in the CSMA-TDMA scheme resides at the relay node, which acts as a central coordinator for the second hop. Its computational burden involves managing a slot allocation table and processing slot requests, resulting in a manageable computational complexity. The memory overhead is similarly linear, , required for storing the slot occupancy state. Although the TDMA frame introduces fixed communication overheads (e.g., for beacon and control periods), this overhead is bounded and predictable, contrasting with the unbounded backoff delays inherent in the fully distributed CSMA approach.
For end nodes, the complexity remains low. They operate with standard CSMA/CA in the first hop and merely adhere to a fixed TDMA schedule in the second hop, requiring minimal additional logic. This architectural choice leads to superior scalability compared to fully contention-based two-hop schemes.
Placing our CSMA-TDMA scheme in the context of other advanced MAC approaches reveals its distinct trade-offs and applicability. For instance:
- The hybrid wireless-PLC architecture in [10] leverages dual interfaces for diversity gain, improving reliability but requiring additional hardware and introducing cross-technology coordination overhead. In contrast, our scheme operates purely over PLC, presenting a unified and potentially lower-cost solution for environments where power line infrastructure is the primary or sole communication medium.
- The dynamic network-coded MAC in [15] utilizes linear combinations of packets to improve throughput and reliability. While effective, it introduces computational complexity for encoding/decoding and requires significant modifications to the standard frame processing logic. Our CSMA-TDMA scheme, by comparison, achieves collision avoidance in the second hop primarily through scheduling, maintaining compatibility with standard CSMA in the first hop and requiring minimal additional logic at end nodes. This results in lower computational overhead and ease of implementation.
Therefore, while each scheme has its merits, our proposed CSMA-TDMA scheme specifically and efficiently targets the dual-contention bottleneck in symmetric two-hop PLC networks with a favorable complexity–performance trade-off and strong practical implement ability.
4. Simulation and Analysis
4.1. Parameter Settings
This section conducts Monte Carlo simulations to verify the accuracy and reproducibility of the theoretical results. All simulations were implemented in MATLAB R2023a, with fixed random seeds to ensure consistency and reproducibility. The Monte Carlo simulation emulates the actual data packet transmission process in a two-hop PLC network. Each iteration represents one complete transmission attempt, including contention, potential collision, and backoff procedures governed by the CSMA protocol. The number of loop executions is equivalent to the number of data packet transmissions in the simulated network, allowing sufficient collision–avoidance and retransmission events to achieve statistical convergence.
The simulation is governed by a time-driven constraint mechanism, in which the total simulation duration accumulates according to the time spent on successful transmissions and collision events. Once the cumulative simulated time reaches the predefined limit, the iteration process automatically terminates. This mechanism ensures that the obtained results—throughput, packet loss rate, and delay—accurately represent the temporal dynamics of the network under continuous traffic load, while maintaining computational efficiency. Unless otherwise specified, the parameters for simulation and theoretical calculation are configured as follows [19,28]: (1) The distance of each hop link is normalized, with and the path fading factor ; (2) Channel fading coefficient ; (3) The transmit power of the source and relay nodes is set as ; (4) The average signal-to-noise ratio of the power line channel is , and the average channel noise power is , hence , ; (5) Bernoulli–Gaussian impulse noise parameter ; (6) Physical layer channel outage threshold .
Additionally, it is assumed that the number of nodes that the relay node R can detect is the same as the number of nodes at the source S, and they are randomly distributed within the range [0.75, 1.25]. The MAC layer of IEEE 1901 introduces certain overheads due to priority recognition, preamble, acknowledgment, and interframe spacing [29]. The fixed general parameter settings for these overheads are shown in Table 3. In the TDMA stage, the beacon frame is set to 1280 μs, the CP period is set to 104 μs, and the CFP contains TDMA slots, each with a duration of 3000 μs.

Table 3.
Main parameters and values of the MAC protocol.
Assuming that all packets use the same physical transmission rate and adopt the slot duration and timing parameters specified by the standard, the successful transmission duration , the collision duration , and the outage duration can be expressed as follows:
It is important to note that the simulation results presented in this study are based on a single, long-duration run for each parameter configuration. This approach was adopted to model the system’s behavior over an extended operational period. To address the statistical reliability of the results, a post hoc analysis was conducted. The sample variance of key performance metrics (e.g., throughput) was computed by segmenting the long-duration data log. The analysis revealed that the variance was consistently very low (e.g., on the order of 10−4 for normalized throughput across various scenarios), indicating that the system had achieved a stable state and that the reported mean values are robust and representative of the expected performance.
4.2. Simulation Results and Analysis
4.2.1. System Throughput Performance
After selecting the parameters, the loss function and reward function of the neural network model are obtained, as shown in Figure 5 and Figure 6. During the simulation process, the number of nodes K = 40 in the network.
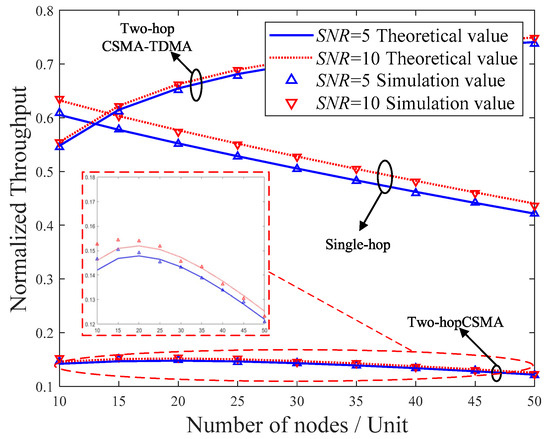
Figure 5.
Comparison of throughput performance among different schemes.
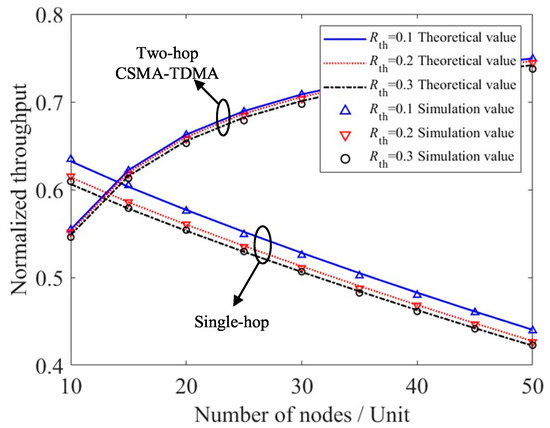
Figure 6.
Comparison of system throughput variation with channel interruption threshold.
Figure 5 compares the system throughput performance under different average SNR conditions for the considered schemes. The theoretical results align closely with the simulation outcomes, thereby validating the analytical model. When both hops utilize the CSMA algorithm, the normalized system throughput initially increases with the number of nodes. However, further increases in the node count intensify channel contention, resulting in more frequent collisions and a consequent reduction in throughput. Comparing the single-hop and two-hop schemes shows that when both hops use CSMA, the two-hop performance is even worse than the single-hop case. This is because although introducing a relay can enhance physical-layer reliability by reducing the outage probability, the overall benefit is limited. The two-hop process requires two rounds of contention, increasing the collision probability and thus degrading performance. The proposed CSMA-TDMA hybrid algorithm avoids contention and backoff in the second hop, significantly reducing packet loss due to collisions. Consequently, the average transmission time per node is shortened, leading to a substantial improvement in the normalized system throughput.
Figure 6 shows the comparison of normalized system throughput between the two-hop and single-hop cases as the channel outage threshold varies. It can be observed that system throughput decreases with the increase in , because a higher outage threshold corresponds to stricter requirements on the information rate, thereby degrading system performance. Moreover, the system performance in the two-hop scenario is more stable with respect to changes in compared to the single-hop case. This is because introducing a relay enhances the reliability of the physical layer, reducing the sensitivity of the overall system performance to physical-layer variations. In addition, as the number of nodes increases, the throughput of the single-hop system decreases, while the throughput of the system employing the CSMA-TDMA algorithm increases gradually. This is because, in this scheme, the TDMA algorithm in the second hop reserves more transmission slots for nodes within each superframe, thereby increasing the number of successfully transmitted packets. However, as the number of reserved slots increases, the average delay required for successful two-hop transmission also grows. Therefore, by adjusting the number of reserved and allocated slots according to different service requirements, the system can achieve a balance between efficiency and delay performance.
4.2.2. System Packet Loss Rate Performance
Figure 7 compares the packet loss rate performance of different cross-layer schemes under various average signal-to-noise ratios (SNRs). It can be observed that the theoretical results are consistent with the simulation results. As the channel’s average SNR increases, indicating improved physical layer conditions, the packet loss rate decreases for all schemes. Moreover, the system packet loss rate increases with the number of nodes, since more nodes lead to more frequent packet collisions during transmission, thereby degrading performance. The two-hop scheme that uses CSMA for both hops exhibits a significantly higher packet loss rate than the other schemes, whereas the proposed CSMA-TDMA two-hop transmission scheme achieves the lowest packet loss rate, demonstrating the best overall system performance.
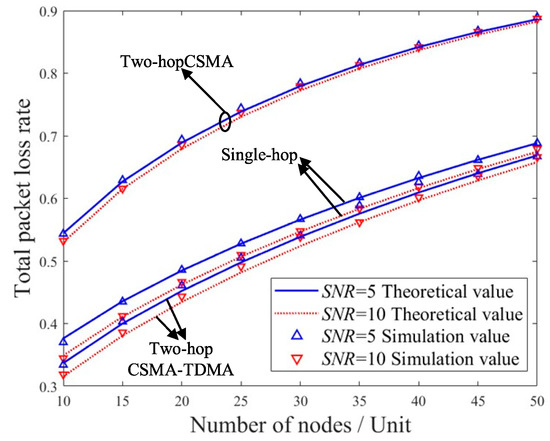
Figure 7.
Comparison of packet loss rate performance for different schemes.
Figure 8 presents a comparison of the MAC-layer collision probability and the physical-layer end-to-end interruption probability under different schemes based on the IEEE 1901 protocol when . Figure 9 compares the physical-layer end-to-end interruption probability of different schemes as the average channel changes. As the average increases, the interruption probability of all schemes decreases. The two-hop schemes exhibit lower interruption probabilities than the single-hop scheme, and their rates of decrease are faster. This indicates that introducing relays significantly reduces the probability of packet interruption due to channel conditions compared to single-hop transmission, thereby enhancing the reliability of physical-layer channel transmission.
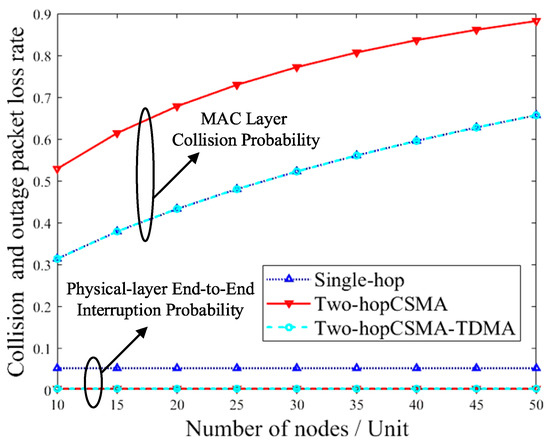
Figure 8.
Comparison of collision probability and interruption probability for different schemes.
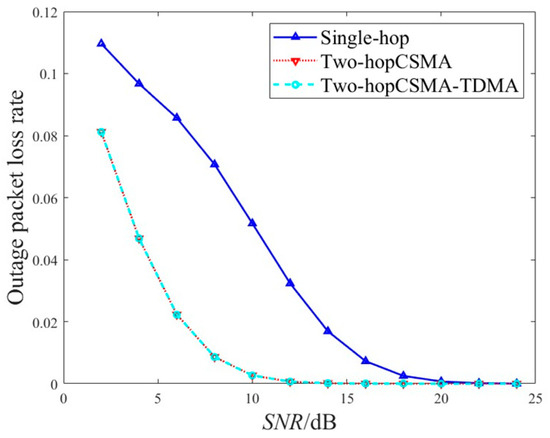
Figure 9.
Comparison of interruption probability variation with for different schemes.
Comparing Figure 8 and Figure 9, when both hops use the CSMA algorithm, a successful packet transmission requires two rounds of contention, which significantly increases the probability of collisions. Although introducing relays improves physical-layer reliability, its ability to reduce interruption probability is limited and cannot offset the high collision probability caused by the two rounds of contention, resulting in poorer packet loss performance. In contrast, the CSMA-TDMA algorithm avoids contention in the second hop, so its MAC-layer collision probability depends only on the first hop’s CSMA backoff process. Compared with single-hop transmission, it achieves a lower interruption probability and thus offers the optimal system reliability.
Figure 10 shows the relationship between the total packet loss rate of the CSMA-TDMA algorithm and the channel fading parameters and . It can be observed that when and remain constant, an increase in ; or when and remain constant, an increase in will both lead to a rise in the system’s packet loss rate. This is because as the channel fading coefficients increase, channel fading becomes more severe, leading to degraded system performance. Moreover, at high signal-to-noise ratios, the impact of and on packet loss rate becomes less significant, and the performance tends to stabilize. When the S–R channel deteriorates, the decline in system performance is more pronounced, indicating that the system is more sensitive to changes in parameter . Therefore, in practical applications, improving the channel quality of the first hop S–R link can effectively enhance the overall communication quality of the system.
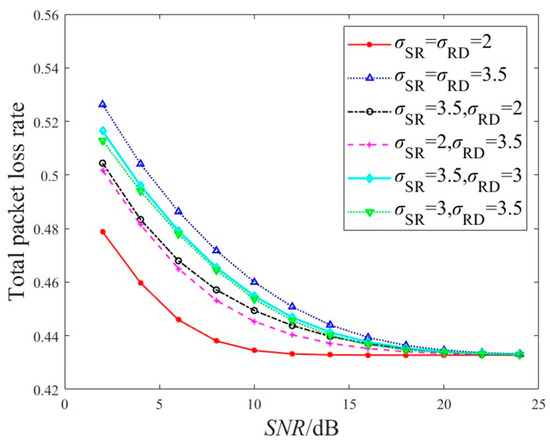
Figure 10.
Comparison of system packet loss rate under different fading parameters.
Let and , and change under the condition that the total system power remains constant. Figure 11 shows the variation in the system’s total packet loss rate with the source transmission power under different channel fading parameters. It can be seen that under different combinations of channel fading parameters, as the source transmission power changes, the system packet loss rate first decreases and then increases, and the curve is continuous and smooth. That is, there exists a unique extremum point over the interval (0, 2) where the system packet loss rate reaches its minimum. Therefore, in a two-hop scenario, there exists an optimal power allocation that can achieve the best system performance. In practical system design, the optimal transmission power can be chosen according to the channel quality. By selecting the optimal power allocation, system performance can be optimized to achieve green and reliable communication while conserving energy.
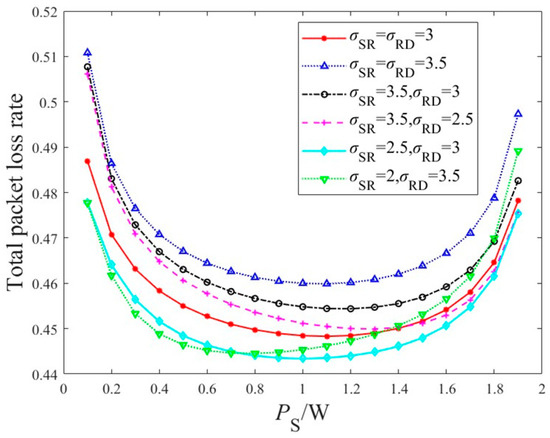
Figure 11.
Comparison of system packet loss rate with respect to source transmission power.
Beyond the internal comparison, it is valuable to discuss our system’s physical layer foundation relative to other relay protocols. This work employs the Decode-and-Forward (DF) protocol. In contrast, the Amplify-and-Forward (AF) protocol studied in [8] forwards an amplified version of the received signal, including noise. The canonical end-to-end SNR expression for AF relaying [8] leads to a different outage probability characteristic compared to DF. Generally, DF outperforms AF in medium-to-high SNR regimes by mitigating noise propagation through decoding, while AF may have lower complexity. Our choice of DF provides a more reliable physical-layer foundation for the cross-layer model, which is crucial for supporting the MAC-layer enhancements proposed in this paper.
4.2.3. Delay Performance
Figure 12 compares the delay performance of different schemes under various minimum contention window sizes. It can be seen that when the number of nodes is small, the delay performance of the two schemes is similar. As the number of nodes increases, system delay also increases, but the two-hop CSMA-TDMA algorithm proposed in this paper achieves lower transmission delay, and the delay increases more slowly. This is because as the number of nodes grows, the probability of collisions during packet transmission rises, which not only increases the average time required for the backoff process but also increases the average number of slots spent for successful packet transmissions during backoff. Compared with the scheme where both hops use the CSMA algorithm, the two-hop CSMA-TDMA algorithm avoids contention and backoff in the second hop, thereby reducing the average system delay. When , compared with the system delay performance improves because a larger minimum contention window allows nodes to randomly select values over a wider range, reducing the probability of selecting the same or similar values simultaneously. This lowers the likelihood of collisions and shortens the average time required for the backoff process. Therefore, when the number of nodes is large, appropriately increasing the minimum contention window can not only reduce collisions caused by high channel congestion but also improve network throughput and delay performance.
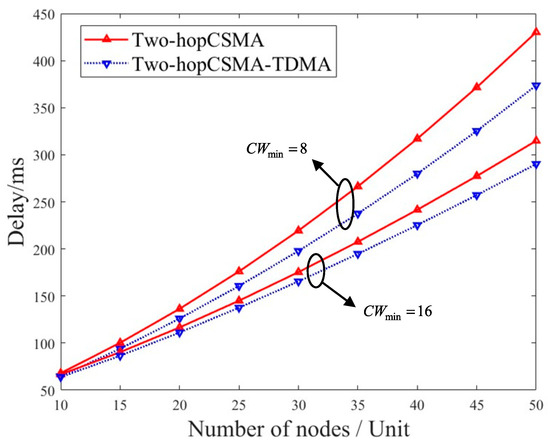
Figure 12.
Comparison of delay performance for different schemes.
Simulation results demonstrate that the proposed CSMA-TDMA-based two-hop transmission scheme effectively circumvents the contention and backoff processes in the second hop, thereby exhibiting significant advantages in key performance metrics such as system throughput, packet loss rate, and transmission delay. It should be emphasized that the primary contribution of this study lies in the establishment of a theoretical framework and performance validation via simulation. We fully acknowledge that experimental validation based on a practical power line communication (PLC) testbed or real-world channel noise traces is essential for comprehensively evaluating the performance and robustness of the proposed algorithm in real application scenarios. However, constrained by the ongoing development of our experimental testbed, the inability to incorporate hardware-in-the-loop validation constitutes a limitation of the current research. Consequently, a primary objective of our subsequent research will be to construct a practical hardware test environment for PLC relay systems, implement and validate the proposed CSMA-TDMA algorithm on this platform, and further evaluate its performance under complex operational conditions based on realistic power line noise characteristics.
5. Power Allocation Optimization
The optimal power allocation problem for the joint normalized throughput and packet loss rate in two-hop power line communication can be described mathematically as follows:
Here, and represent the system’s normalized throughput and packet loss rate, respectively; and denote the weights of these metrics, which can be flexibly set according to different service requirements. Without loss of generality, this paper sets ; denotes the total power.
From Figure 13, it can be seen that as changes, the system optimization objective = forms a continuous and smooth curve that first rises and then falls, with a unique extremum point in the interval (0, 2). This indicates that the optimization objective function with aaa as the variable is continuously differentiable and has a global optimum. This paper uses MATLAB’s fmincon function based on the SQP algorithm to determine the optimal power allocation values. Using the same parameters as in Figure 13, the optimal power allocation parameters and the corresponding objective values, normalized throughput values, and packet loss rates can be obtained. Comparing Figure 13 and Table 4, it can be seen that this function can effectively optimize power allocation with high accuracy.
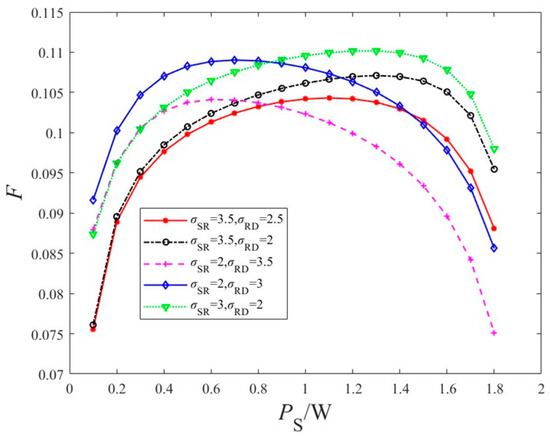
Figure 13.
Comparison of comprehensive utility variation with source transmission power.

Table 4.
Optimal power allocation values under different parameter settings.
6. Conclusions
This paper presents a comprehensive investigation of cross-layer mechanisms in two-hop relay power line communication. To mitigate the high collision probability inherent in the CSMA-based two-hop transmission scheme, a hybrid CSMA-TDMA two-hop transmission scheme is proposed. The influence of MAC-layer and physical-layer parameters on cross-layer performance is compared and analyzed, revealing key trends that impact system performance. By determining the optimal power allocation factor, the system throughput and packet loss rate of the cross-layer model are optimized. As the number of nodes increases, the contention-based CSMA protocol leads to a higher probability of collisions among nodes. Although introducing relays improves physical layer reliability, this cannot effectively translate physical layer data rates into MAC layer throughput. The CSMA-TDMA two-hop transmission scheme avoids contention and backoff in the second hop, achieving higher throughput and lower packet loss rate and delay compared to other schemes.
This research provides important technical foundations for practical applications in industrial IoT, smart grid automation, and home energy management systems. Specifically, the framework enables reliable data exchange in complex power network environments by supporting high-density device connectivity while ensuring communication robustness and reduced latency. However, this study acknowledges certain limitations that merit further investigation. The scalability of the proposed scheme for large-scale deployments beyond 100 nodes requires careful consideration of potential latency increases due to extended TDMA frames. Additionally, practical implementation challenges including TDMA slot synchronization overhead in real PLC hardware environments need to be addressed. Future research directions will focus on developing adaptive slot allocation strategies capable of dynamically optimizing resource allocation based on real-time network conditions, along with comprehensive validation of low-voltage PLC testbeds to bridge the gap between theoretical modeling and practical deployment.
Author Contributions
Methodology, P.W.; Investigation, T.C., J.L. and P.C.; Writing—original draft, P.W.; Writing—review & editing, Z.C. All authors have read and agreed to the published version of the manuscript.
Funding
This research received no external funding.
Data Availability Statement
No new data were created or analyzed in this study.
Conflicts of Interest
Author Peiru Chen was employed by the company State Grid Urumqi Power Supply Company. The remaining authors declare that the research was conducted in the absence of any commercial or financial relationships that could be construed as a potential conflict of interest.
References
- Tan, Z.W.; Liu, H.L.; Zhan, J.; Ma, Z.J.; Liu, S.G. Adaptive noise suppression based on peak estimation and feedback compensation in power line communication. J. Commun. 2017, 38, 86–97. [Google Scholar]
- Zhang, W.Y.; Li, T.H. Relative influence of power line transmission characteristics and noise interference on communication performance. Power Syst. Prot. Control 2022, 50, 145–152. [Google Scholar]
- Righini, D.; Passerini, F.; Tonello, A.M. Modeling transmission and radiation effects when exploiting power line networks for communication. IEEE Trans. Electromagn. Compat. 2017, 60, 59–67. [Google Scholar] [CrossRef]
- Jin, X.; Xiao, Y.; Zeng, Y.G.; Zhang, L.P. Low-voltage power line broadband carrier communication channel modeling and error compensation. Chin. J. Electr. Eng. 2020, 40, 2800–2809. [Google Scholar]
- Liu, J.B.; Li, S.; Jiang Y, F.; Cheng, X.-N. Powerline communication technology based on on-angle modulation in intelligent lighting. Acta Electron. Sin. 2021, 49, 1331–1338. [Google Scholar]
- Xu, Z.Q.; Zhai, M.Y.; Zhao, Y.M. Adaptive resource allocation in powerline communication system based on improved NSGA-II. Acta Electron. Sin. 2010, 38, 1305–1310. [Google Scholar]
- Hwang, Y.M.; Jung, J.H.; Seo, J.K.; Lee, J.-J.; Kim, J.Y. Energy-efficient transmission strategy with dynamic load for power line communications. IEEE Trans. Smart Grid 2017, 9, 2382–2390. [Google Scholar] [CrossRef]
- Rabie, K.M.; Adebisi, B.; Gacanin, H.; Yarkan, S. Energy-per-bit performance analysis of relay-assisted power line communication systems. IEEE Trans. Green Commun. Netw. 2018, 2, 360–368. [Google Scholar] [CrossRef]
- Tuan, N.T.; Kim, D.S.; Lee, J.M. On the performance of cooperative transmission schemes in industrial wireless sensor networks. IEEE Trans. Ind. Inform. 2018, 14, 4007–4018. [Google Scholar] [CrossRef]
- Fernandes, V.; Poor, H.V.; Ribeiro, M.V. Analyses of the incomplete low-bit-rate hybrid plc-wireless single-relay channel. IEEE Internet Things J. 2018, 5, 917–929. [Google Scholar] [CrossRef]
- Qian, Y.; Yan, J.; Guan, H.; Li, J.; Zhou, X.; Guo, S.; Jayakody, D.N.K. Design of hybrid wireless and power line sensor networks with dual-interface relay in IoT. IEEE Internet Things J. 2017, 6, 239–249. [Google Scholar] [CrossRef]
- De Oliveira, R.M.; Vieira, A.B.; Latchman, H.A.; Ribeiro, M.V. Medium access control protocols for power line communication: A survey. IEEE Commun. Surv. Tutor. 2018, 21, 920–939. [Google Scholar] [CrossRef]
- Sheng, Z.; Kenarsari-Anhari, A.; Taherinejad, N.; Leung, V.C.M. A multichannel medium access control protocol for vehicular power line communication systems. IEEE Trans. Veh. Technol. 2015, 65, 542–554. [Google Scholar] [CrossRef]
- Chen, Z.; Liu, Y.; Liu, R.; Yuan, J.; Han, D. Improved CSMA/CA algorithm based on alternative channel of power line and wireless and first-time idle first acquisition. IEEE Access 2019, 7, 41380–41394. [Google Scholar] [CrossRef]
- De Oliveira, R.M.; Vieira, L.F.M.; Vieira, M.A.M.; Vieira, A.B. A dynamic network coding MAC protocol for power line communication. Telecommun. Syst. 2021, 77, 359–375. [Google Scholar] [CrossRef]
- Wang, L.; Wang, X.; Li, B. Channel prediction based MAC layer access scheme of broadband power line communication network. In Proceedings of the 2017 IEEE 9th International Conference on Communication Software and Networks (ICCSN), Guangzhou, China, 6–8 May 2017; IEEE: Piscataway, NJ, USA, 2017; pp. 571–574. [Google Scholar]
- Yang, T.; He, Z.Y.; Sun, Z.S.; Cai, S.T.; Li, F.J. Research on cross-layer resource allocation algorithm for broadband power line carrier communication for concurrent multi-service. Power Grid Technol. 2021, 45, 3257–3267. [Google Scholar]
- Qian, Y.; Wang, Z.; Li, J.; Zhang, T.; Shu, F. Sub-channel assignment and link schedule for In-Home power line communication network. IET Commun. 2017, 11, 673–679. [Google Scholar] [CrossRef]
- Faheem, M.; Kuusniemi, H.; Eltahawy, B.; Bhutta, M.S.; Raza, B. A lightweight smart contracts framework for blockchain-based secure communication in smart grid applications. IET Gener. Transm. Distrib. 2024, 18, 625–638. [Google Scholar] [CrossRef]
- Liu, J.; Ghassemlooy, Z.; Zhang, M. Opportunistic DF-AF selection relaying in hybrid wireless and power line communication for indoor IoT networks. Sensors 2021, 21, 5469. [Google Scholar]
- Dubey, A.; Mallik, R.K.; Schober, R. Performance analysis of a multi-hop power line communication system over log-normal fading in presence of impulsive noise. IET Commun. 2015, 9, 1–9. [Google Scholar] [CrossRef]
- Vlachou, C.; Banchs, A.; Salvador, P.; Herzen, J.; Thiran, P. Analysis and enhancement of CSMA/CA with deferral in power-line communications. IEEE J. Sel. Areas Commun. 2016, 34, 1978–1991. [Google Scholar] [CrossRef]
- Baek, H.; Lim, J. Time mirroring based CSMA/CA for improving performance of UAV-relay network system. IEEE Syst. J. 2019, 13, 4478–4481. [Google Scholar] [CrossRef]
- IEEE 1901-2010; IEEE Standard for Broadband over Power Line Networks: Medium Access Control and Physical Layer Specifications. IEEE Unapproved Draft Std/D2. IEEE Standards Association (IEEE SA): Piscataway, NJ, USA, 2010; 2436p.
- Zhu, C.; Corson, M.S. A Five-Phase Reservation Protocol (FPRP) for Mobile Ad Hoc Networks. In Proceedings of the 17th Annual Joint Conference of the IEEE Computer and Communication Societies, San Francisco, CA, USA, 29 March–2 April 1998; Volume 1, pp. 322–331. [Google Scholar]
- Zhu, C.; Corson, M.S. An Evolutionary-TDMA Scheduling Protocol (E-TDMA) for Mobile Ad hoc Networks. In Proceedings of the Advanced Telecommunications and Information Distributed Research Program, College Park, MD, USA, 28–29 January 1998. [Google Scholar]
- David Young, C. A Unifying Dynamic Distributed Multichannel TDMA Slot Assignment Protocol (USAP). In Proceedings of the Military Communications Conference, San Diego, CA, USA, 21–24 October 1996; pp. 235–239. [Google Scholar]
- Chen, Z.X.; Han, D.S.; Qiu, L.J. Performance study of indoor wireless and power line dual-medium cooperative communication systems. Proc. CSEE 2017, 37, 2589–2599. [Google Scholar]
- Hao, S.; Zhang, H. Theoretical modeling for performance analysis of IEEE 1901 power-line communication networks in the multi-hop environment. J. Supercomput. 2020, 76, 2715–2747. [Google Scholar] [CrossRef]
Disclaimer/Publisher’s Note: The statements, opinions and data contained in all publications are solely those of the individual author(s) and contributor(s) and not of MDPI and/or the editor(s). MDPI and/or the editor(s) disclaim responsibility for any injury to people or property resulting from any ideas, methods, instructions or products referred to in the content. |
© 2025 by the authors. Licensee MDPI, Basel, Switzerland. This article is an open access article distributed under the terms and conditions of the Creative Commons Attribution (CC BY) license (https://creativecommons.org/licenses/by/4.0/).