Abstract
Landslides are among the most common geological hazards in mountainous regions, posing significant threats to resident safety and infrastructure stability. Due to the complexity of terrain and the difficulty of field surveys, landslide samples in these areas often suffer from class imbalance, which undermines the accuracy of susceptibility models. To address this issue, this study constructed a multi-factor landslide database and employed a Tabular Variational Autoencoder (TVAE) to generate synthetic samples. A Quality–Diversity (QD) screening strategy was further integrated to enhance the representativeness and diversity of the augmented data. Experimental results demonstrate that the proposed TVAE–QD method improves model performance, with generated samples showing distributions closer to real data. Compared with the Synthetic Minority Over-sampling Technique (SMOTE) and unfiltered TVAE, the TVAE–QD method achieved higher predictive accuracy and exhibited greater robustness under progressive data augmentation. In the Random Forest (RF) model, the TVAE–QD achieved its best performance at a scale of 350, with an Area Under the Curve (AUC) of 0.923 and a Precision–Recall AUC (PR–AUC) of 0.907, outperforming TVAE and SMOTE. In the Light Gradient Boosting Machine (LightGBM) model, the AUC peaked at 0.911 at a scale of 450, while the PR–AUC reached its maximum of 0.896 at a scale of 200. Shapley Additive Explanations (SHAP) analysis confirmed that data augmentation preserved interpretability: dominant factors such as elevation, rainfall, and the Normalized Difference Vegetation Index (NDVI) remained stable, with only minor adjustments among secondary variables. Overall, the TVAE–QD framework effectively mitigates class imbalance and offers a promising technical solution for landslide risk assessment in mountainous regions.
1. Introduction
Landslides rank among the most destructive geological hazards, frequently resulting in loss of life and property worldwide [1,2,3,4,5]. China is one of the most severely affected countries, particularly in mountainous regions where steep terrain and fractured geological structures create highly susceptible conditions for large-scale failures [6,7,8]. In addition to these inherent predisposing factors, recurrent earthquakes and episodes of intense rainfall further destabilize slopes, triggering widespread landslide disasters that repeatedly damage settlements, transportation corridors, and agricultural land. Therefore, producing high-resolution landslide susceptibility maps serves as an essential foundation for improving disaster risk management and promoting regional sustainable development. Such maps visually represent the spatial distribution of landslide risks across different areas, assisting planners and engineers in identifying high-risk zones, delineating rational land-use restrictions, and guiding the planning and design of infrastructure under safer conditions [9,10,11]. In landslide monitoring and early warning systems, susceptibility maps provide a crucial basis for determining sensor placement and observation priorities, ensuring that limited monitoring resources are concentrated in the areas most prone to instability. If these maps are inaccurate, the monitoring network may be misguided, leaving truly high-risk communities inadequately protected when disasters strike. Thus, a deeper understanding of the mechanisms driving landslide formation and improvements in risk assessment methods can lead to more effective regional risk management and offer valuable insights for disaster prevention efforts in multi-hazard regions [12,13,14,15,16].
In recent years, machine learning techniques have been widely adopted to landslide susceptibility mapping due to their strong capacity to process complex datasets and capture nonlinear relationships [17,18,19]. Despite this potential, their predictive performance has been shown to depend heavily on the quality and distribution of training samples. When the distribution of positive and negative cases is relatively balanced, models can capture the intrinsic patterns of landslide data more effectively, thereby achieving higher predictive accuracy [20,21,22,23,24,25]. In real-world applications, however, such a balance is rarely achieved. Landslides are often concealed and sudden in nature, while many affected areas remain inaccessible for field surveys. As a result, numerous landslide events are not recorded, leading to pronounced class imbalance that introduces bias into the models and weakens the stability of their generalization performance.
Currently, three primary strategies are commonly employed to address the issue of imbalanced data in landslide studies: under-sampling, over-sampling, and class-weighted algorithms. Under-sampling reduces the number of majority-class samples to balance the dataset but this inevitably discards part of the original information, thereby weakening the representativeness of negative samples [26,27]. Over-sampling, by contrast, increases the number of minority-class samples. Random over-sampling (ROS) generates new samples by replicating existing ones [28], while the synthetic minority over-sampling technique (SMOTE) interpolates additional synthetic samples in the feature space [29,30,31,32,33].
In the field of landslide susceptibility mapping, over-sampling strategies have been widely adopted. Unlike simple sample duplication, synthetic over-sampling methods offer greater stability, an advantage that has been consistently confirmed by comparative studies [34,35]. For example, the SMOTE technique has been demonstrated to effectively enhance predictive performance [35,36]. More recently, it has been shown that combining the combination of Stochastic Gradient Boosting (SGB) with Support Vector Machine–based SMOTE (SVM-SMOTE) has been shown to achieve relatively high predictive accuracy” [37]. Beyond over-sampling and under-sampling approaches, class-weighted methods provide an alternative solution by assigning higher weights to minority-class samples in the loss function, thereby alleviating the bias introduced by class imbalance [38,39].
Although these approaches have been widely applied, they still suffer from inherent limitations. Under-sampling often leads to the loss of valuable information. Over-sampling also has drawbacks: interpolation-based methods such as SMOTE fail to accurately capture the complex relationships among features, whereas over-sampling by duplicating existing samples tends to cause overfitting. Class-weighted algorithms adjust the loss function to penalize misclassified minority samples, but they do not fundamentally enrich the distribution of the minority class. To overcome these shortcomings, generative models such as the Tabular Variational Autoencoder (TVAE) and the Conditional Tabular GAN (CTGAN) have recently been introduced, providing a promising avenue for synthesizing high-quality and diverse positive samples in landslide susceptibility modeling [40,41,42].
Among existing generative models, TVAE performs well in handling datasets containing both continuous and categorical variables, offering a closer approximation to the real data distribution [40,43]. Nevertheless, even advanced generative models may produce noisy or boundary samples, which, if directly used for training, can weaken model generalization. Post-generation filtering and optimization are therefore essential to remove low-quality samples, improve overall data quality, and enhance the stability and accuracy of downstream susceptibility modeling [44,45]. In addition, to ensure comparability with existing studies, SMOTE was used for comparison in the experiments.
Building on this idea, this study introduces a quality–diversity (QD) screening mechanism to refine candidate samples generated by TVAE. Compared to existing oversampling methods, this framework introduces a posterior screening step to balance sample quality and diversity, thereby enhancing the reliability of the synthetic data. The mechanism consists of two key components: first, kernel density estimation is applied to quantify the distribution characteristics of candidate samples, assessing their closeness to the real distribution; second, a nearest-neighbor method is employed to measure inter-sample differences, reflecting their diversity. These two criteria are balanced through a unified scoring function, and samples with the highest scores are iteratively selected, thereby maintaining diversity while ensuring quality. The proposed mechanism is used for landslide susceptibility assessment to address the issue of model reliability when data is limited. It also provides fresh insights for evaluating and managing geological disaster risks in mountainous areas. By improving the accuracy of the susceptibility maps, this study helps build a stronger scientific basis for land-use planning and increases the confidence in regional risk assessment.
2. Study Areas and Data Sources
2.1. Study Areas
Qingchuan County, located in northern Sichuan Province within Guangyuan City, lies in the transitional zone between the western Sichuan Plateau and the Sichuan Basin. The region exhibits distinct north–south geomorphological contrasts: low hills dominate the south, gradually rising to high mountains in the north, with elevations ranging from 506 m to 3816 m. The county spans 104°36′–105°38′ E and 32°12′–32°56′ N, covering an area of about 3216 km2. Geologically, it lies within the Longmenshan fault zone, where complex structures and dense fault systems have led to fractured rock masses and inherently unstable slopes, creating a landslide-prone environment. In addition to geological conditions, climatic factors also play a critical role. The county has a subtropical humid monsoon climate, with mean annual precipitation ranging from 838 to 1055 mm. Rainfall is highly uneven in space and time, being concentrated between May and September, when heavy rainfall events act as one of the primary triggers of landslides. Especially after the 2008 Wenchuan earthquake and its long-term aftereffects, slope stability was further weakened, and under the influence of intense rainfall, the risk of landslides significantly increased, making Qingchuan a typical landslide-prone mountainous area. Figure 1 illustrates the location of the study area and the distribution of landslides.
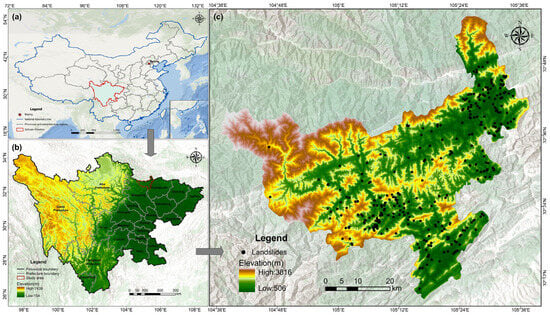
Figure 1.
Location and landslide distribution of the study area. (a) Location of Sichuan Province in China; (b) Topography and administrative divisions of Sichuan Province; (c) Elevation and landslide distribution in the study area.
2.2. Data Sources
Landslide occurrence is influenced by a variety of factors, including topography, geology, hydrology, meteorology, vegetation cover, and human activities. Based on regional characteristics and data availability, several evaluation factors were selected in this study. The selected evaluation factors, their data sources, and corresponding spatial distributions are shown in Figure 2. Topographic variables included elevation, slope, aspect, plan curvature, profile curvature, and curvature. Geological factors comprised lithology and distance to faults, while the hydrological factor was represented by distance to rivers. Climatic conditions were expressed by the five-year average precipitation (2019–2023), and vegetation cover was represented by the five-year average normalized difference vegetation index (NDVI) for the same period. Human disturbance was measured by distance to roads. In addition, a landslide inventory containing 327 mapped landslides was obtained from the Geographic Remote Sensing Ecological Network Platform (http://www.gisrs.cn, accessed on 15 June 2025). Following multicollinearity testing, the curvature variable was excluded, and 11 factors were finally retained for susceptibility modeling.
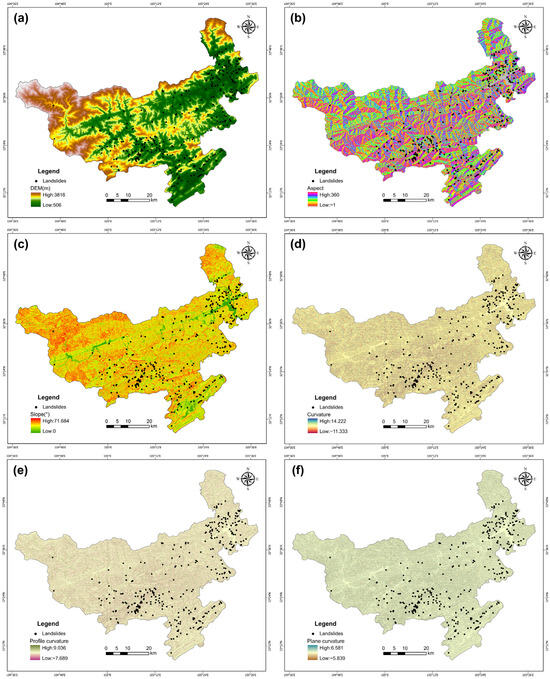
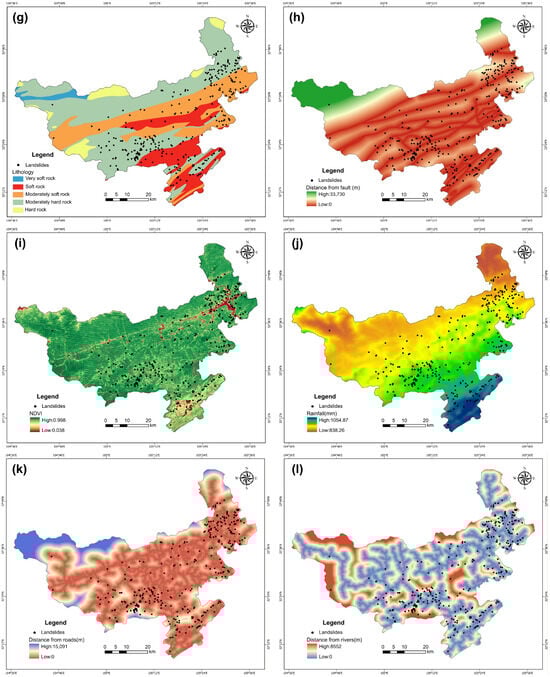
Figure 2.
Spatial distributions of the conditioning factors used in this study: (a) elevation, (b) aspect, (c) slope, (d) curvature, (e) profile curvature, and (f) plan curvature (all derived from the 30 m SRTM DEM, available at https://earthexplorer.usgs.gov, accessed on 15 June 2025); (g) lithology and (h) distance to faults (compiled from the Geographic Remote Sensing Ecological Network Platform, http://www.gisrs.cn, accessed on 15 June 2025); (i) NDVI (calculated from Landsat 8 imagery via Google Earth Engine); (j) mean annual rainfall (data from the National Tibetan Plateau Data Center, http://data.tpdc.ac.cn, accessed on 15 June 2025); (k) distance to rivers and (l) distance to roads (extracted from the OpenStreetMap database, https://www.openstreetmap.org, accessed on 15 June 2025).
All spatial datasets were preprocessed to ensure consistency before analysis. First, all data were projected into a common coordinate system to minimize overlay bias. Then, continuous variables (e.g., elevation, precipitation, NDVI) were resampled using bilinear interpolation, whereas categorical variables (e.g., lithology) were resampled using the nearest neighbor method to preserve class boundaries. Finally, all datasets were standardized to a 30 m × 30 m spatial resolution, which was adopted as the fundamental unit for subsequent landslide susceptibility assessment.
3. Methodology
The workflow of this study is illustrated in Figure 3, which is divided into three phases: (1) construction of a landslide susceptibility assessment dataset, (2) landslide data augmentation and validation, and (3) discussion and analysis of results.
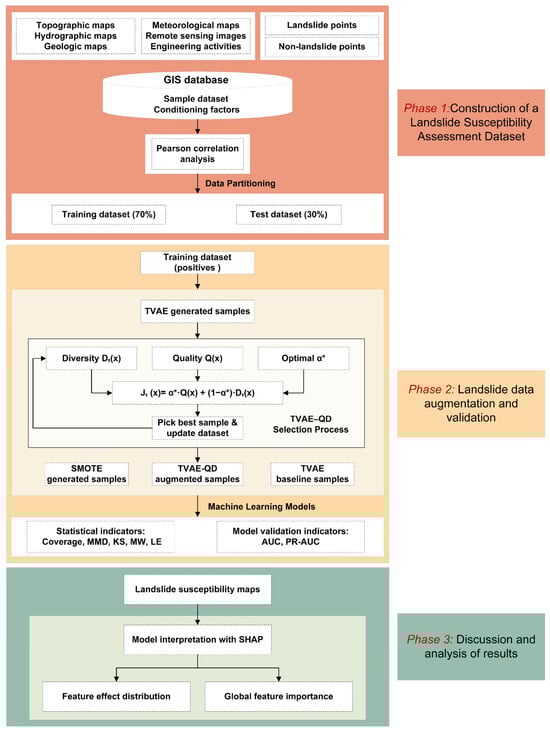
Figure 3.
Workflow of the study.
Phase 1: Dataset Construction
Multiple data sources, including topographic, geological, hydrological, meteorological, remote-sensing, and engineering activity data, as well as landslide and non-landslide points, were first integrated into a unified GIS database with consistent spatial resolution and coordinate reference. Based on this database, the dataset was randomly divided into a training set (70%) and a test set (30%). Subsequently, Pearson correlation analysis was performed on the training samples (including both landslide and non-landslide points) to identify highly correlated conditioning factors and reduce multicollinearity. This preprocessing step helped reduce redundancy among conditioning factors and improve the stability of the subsequent model development and validation.
Phase 2: Data Augmentation and Validation
The TVAE model was trained using only the positive (landslide) samples from the training set to generate additional synthetic landslide data for sample augmentation. These candidates were subsequently filtered using the QD strategy to construct high-quality and diverse augmented datasets. As illustrated in Figure 3, this procedure corresponds to the TVAE–QD selection process, which is described in detail in Section 3.3. Throughout this process, the test set remained completely isolated to ensure independent and unbiased validation, which served as the foundation for subsequent evaluation. To assess these augmented datasets and their impact on downstream models, both distributional consistency metrics (Coverage, MMD, KS, MW, LE) and model performance metrics (AUC, PR-AUC) were employed. In addition, stepwise augmentation experiments were performed using the unfiltered TVAE outputs (TVAE baseline) and synthetic samples generated by SMOTE, which were included as comparative baselines to highlight the role of the QD strategy in data augmentation.
Phase 3: Discussion and analysis of results
At this stage, a landslide susceptibility map of Qingchuan County was constructed, and spatial statistics were performed across different susceptibility levels to quantify their distributional characteristics. Model interpretability was further enhanced using SHAP analysis, which revealed the varying contributions of conditioning factors at the local level for individual samples and assessed their overall importance at the global level. This multi-scale interpretation enabled the identification of dominant controlling factors and improved the transparency and reliability of model outcomes.
3.1. Synthetic Minority Over-Sampling Technique (SMOTE)
The Synthetic Minority Over-sampling Technique (SMOTE) is a classical and widely adopted algorithm for handling class imbalance in datasets [31,32]. Unlike random over-sampling, which relies on mere replication of minority samples, SMOTE generates new instances by interpolating between each minority instance and its nearest neighbors in the feature space. This procedure increases the representation of the minority class while enhancing distributional diversity, thereby reducing the likelihood of overfitting when training models on imbalanced data.
3.2. Tabular Variational Autoencoder (TVAE)
The Tabular Variational Autoencoder (TVAE) is a generative model adapted from the variational autoencoder framework, specifically designed for structured tabular datasets [40]. The model uses a multilayer perceptron (MLP) architecture with a symmetrical encoder–decoder structure. It is trained by minimizing the standard variational inference objective, which combines a reconstruction term and a Kullback–Leibler (KL) divergence term. Unlike interpolation-based methods such as SMOTE, which generate synthetic samples through linear combinations of neighboring data points, TVAE uses variational inference to learn the full probability distribution of the variables. It then generates new, synthetic samples by sampling from the latent space. This process allows TVAE to identify and capture complex, non-linear relationships among the factors. Because landslide susceptibility datasets usually contain both continuous and categorical data, TVAE is especially good at creating realistic and varied synthetic samples, making it highly effective at solving the class imbalance problem in susceptibility modeling.
3.3. TVAE with Quality–Diversity Selection (TVAE–QD)
Previous studies have indicated that appropriate post-processing can significantly improve data characteristics and improve model performance [44,45]. Building on this insight, this study introduces a quality–diversity (QD) filtering strategy as a post-processing step for samples generated by the TVAE, forming the TVAE–QD framework to simultaneously ensure authenticity and representativeness. The framework employs kernel density estimation (KDE) to assess the proximity of candidate samples to the empirical distribution, which reflects their quality. In parallel, the diversity of each candidate is quantified based on its distance to the selected set, preventing over-concentration in high-density regions and enhancing spatial coverage. Through the combined scoring criterion, samples with both high quality and sufficient diversity are preferentially retained, providing a more informative training set for subsequent landslide susceptibility modeling.
3.3.1. Quality Scoring Based on Mixed Kernel Density Estimation
A common and effective criterion for evaluating the authenticity of candidate samples is whether their distribution is statistically consistent with the empirical distribution of observed landslides. Kernel density estimation (KDE) provides a flexible non-parametric tool for such distributional comparisons [46]. However, conventional KDE are primarily designed for continuous variables and have offers limited capacity to model categorical data. Since landslide susceptibility analysis typically involves both continuous and categorical predictors, a density estimation method capable of handling mixed variables is required.
To this end, we adopt a mixed kernel density estimation approach: Gaussian kernels are applied to continuous variables, whereas Aitchison-Aitken kernels are used for categorical variables. These components are combined within a product-kernel framework to construct a unified probability density model for mixed-type data [47,48]. This formulation preserves the distributional properties of continuous features while capturing the structural characteristics of categorical attributes, thereby providing a solid statistical basis for subsequent quality scoring. The general form is:
where is the sample size; and denote the index sets of continuous and categorical variables, respectively; is the Gaussian kernel with bandwidth for continuous variables; and is the Aitchison-Aitken kernel for categorical variables, with controlling the smoothing assigned to non-matching categories. The bandwidth parameters and are determined using the cross-validation maximum likelihood (CV-ML) method to balance bias and variance.
Finally, the estimated density values are normalized to the interval to obtain the quality score , which serves as the basis for subsequent joint scoring.
3.3.2. Diversity Scoring Based on Nearest Neighbor Distance
KDE-based quality scoring can align the overall distribution of candidate samples with the empirical distribution of observed landslides. However, since KDE scores directly rely on probability density values, their ranking tends to favor high-density regions, which may ignore samples located at distributional boundaries or in sparse regions. To mitigate this bias, this study introduces a diversity score based on the nearest neighbor distance, which evaluates how distinct a candidate is relative to the already selected subset.
For a candidate , the diversity score is defined as the distance to its nearest neighbor within the selected subset :
Here, denotes the set of samples that have been selected up to iteration .
Candidates closer to existing selections receive lower diversity scores, whereas those located in relatively sparse regions receive higher scores. This mechanism helps prevent excessive concentration of samples in high-density regions and thereby improves the diversity of the augmented dataset.
In practice, the quality score derived from KDE is computed once after candidate generation, while the diversity score is obtained by normalizing from Equation (2), denoted as . Since depends on the evolving selected set , it is recalculated at each iteration. This dynamic update ensures that diversity is maintained throughout the selection process.
3.3.3. Joint Scoring Function
Relying exclusively on either quality or diversity is insufficient to ensure comprehensive sample selection: emphasizing quality tends to concentrate candidates in high-density regions, while relying solely on diversity may introduce outliers deviating from the true distribution. To balance the two, we adopt a joint scoring function that integrates them in a weighted form.
As defined in Section 3.3.1 and Section 3.3.2, both the quality score and the diversity score are normalized to the interval . Based on this, the joint score is expressed as:
where is a weighting parameter that regulates the relative contribution of quality and diversity. A larger emphasizes consistency with the empirical distribution, while a smaller enhances dataset coverage. The distributional similarity is quantified as
The final weighting parameter is chosen as
To determine the best value for the parameter, we carried out a calibration experiment. In this experiment, we tested values ranging from 0.0 to 1.0, using a step size of 0.1. For each potential value, we ran the full TVAE-QD selection procedure to create an augmented dataset. We then calculated the Coverage and metrics of this new data, comparing them to the original samples. The geometric mean (G-mean) of these two metrics was computed for every value.
Ultimately, the value that maximized the G-mean was chosen as the optimal parameter . In this study, is 0.8, as detailed in Section 4.2. This value achieves a good balance between the fidelity and diversity of the generated data. A higher Coverage value means the generated samples better represent the real data, indicating improved representativeness. Similarly, a higher value which corresponds to a lower MMD distance suggests the generated samples have stronger consistency with the overall distribution of the real data. Therefore, by using G-mean as the optimization goal, we ensure the chosen parameter strikes a stable balance between sample accuracy and distributional diversity.
Since the balance between representativeness and diversity depends on the underlying data distribution, the optimal is sensitive to the unique characteristics of the original dataset. Specifically, under different distribution types, controls how generated samples are spread across dense and sparse regions, thereby influencing the consistency and coverage of the new data compared to the original. Therefore, to guarantee stable and reliable generation results, must be recalibrated for every different dataset.
3.4. Evaluation Metrics
In landslide susceptibility evaluation, non-landslide samples usually far outnumber landslide samples, which may bias model training toward the majority class. To mitigate this imbalance and ensure fair comparison across augmentation strategies, balanced datasets with a 1:1 ratio of positive and negative samples were used for both training and testing.
In model evaluation, AUC and PR-AUC were used to assess classification performance [33,49]. AUC reflects the overall discriminative ability of a model across all possible thresholds, while PR-AUC focuses on the trade-off between precision and recall, making it more informative for evaluating the model’s sensitivity to positive samples. Since both the training and testing datasets were balanced at a 1:1 ratio, the bias of evaluation metrics toward the majority class was substantially reduced. Under such balanced conditions, the inflation of AUC values commonly observed in imbalanced scenarios is effectively mitigated, allowing AUC to provide a reliable and comprehensive measure of model discrimination. Therefore, AUC was selected as the primary metric for model selection, whereas PR-AUC served as a complementary indicator to evaluate model sensitivity and stability. In the subsequent stepwise augmentation experiments, the model achieving the highest AUC value was regarded as the optimal configuration for susceptibility mapping.
To further evaluate distributional fidelity, we adopted a set of statistical metrics:
Coverage (↑): proportion of real data covered by synthetic samples; higher values indicate more representative coverage.
Maximum Mean Discrepancy (MMD, ↓): quantifies the distance between real and synthetic distributions; lower values imply greater similarity.
Kolmogorov–Smirnov (KS, ↑): a non-parametric test that compares the empirical cumulative distribution functions of two samples; higher p-values indicate that the distributions are statistically indistinguishable.
Mann–Whitney U (MW, ↑): a rank-based test assessing whether two samples come from populations with the same median; higher p-values suggest stronger agreement in central tendency.
Levene (LE, ↑): a test for the equality of variances across groups; higher p-values indicate that the variance structure of synthetic data is more consistent with that of real data.
For the statistical tests (KS, MW, LE), larger mean p-values suggest higher agreement between synthetic and real data in the corresponding property. Together with Coverage and MMD, these measures provide a systematic assessment of representativeness and distributional consistency, serving as a complementary perspective to classification-oriented metrics such as AUC and PR–AUC.
3.5. SHAP
To ensure interpretability of model results, this study employed Shapley Additive Explanations (SHAP) [50]. SHAP is based on the Shapley values from cooperative game theory, where the marginal contribution of a feature is averaged over all possible feature subsets, providing a stable and model-agnostic attribution framework. For a given model output , the SHAP value of feature is defined as:
where denotes the contribution of feature is the model prediction given subset , is the size of the subset, and is the total number of features.
In this study, SHAP was applied to the machine learning model to reveal the mechanisms by which conditioning factors influence landslide prediction. At the local level, SHAP values describe each factor’s influence on the prediction; at the global level, mean absolute SHAP values rank feature importance, thereby identifying the primary controls on landslides in the study area.
4. Results
4.1. Multicollinearity Assessment of the Contributing Indicators
To examine potential linear dependencies among conditioning factors, we applied Pearson’s correlation coefficient (r). Figure 4 displays the correlation matrix, with the color scale representing both the direction and strength of associations. Elevation shows strong positive correlations with distance to roads (r = 0.72), distance to faults (r = 0.65), and distance to rivers (r = 0.52). This pattern suggests that major roads and rivers are primarily distributed in low-elevation valleys, which are often associated with fault zones. Consequently, as elevation increases, the distance to these geomorphic features correspondingly becomes larger.
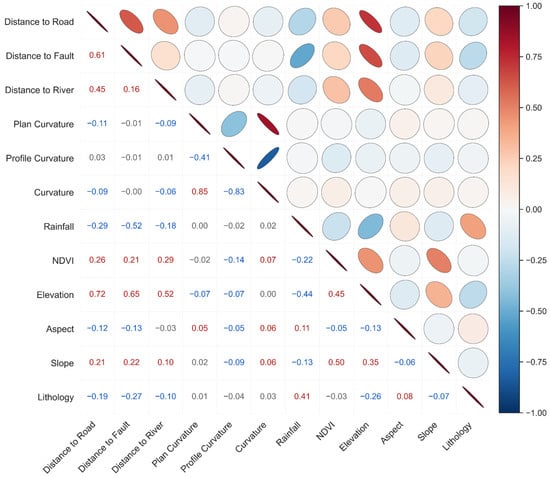
Figure 4.
Pearson correlation matrix of the 12 indicators.
Aspect exhibits negligible correlations with all other variables, with |r| not exceeding 0.13, and can therefore be treated as an independent factor. In line with commonly adopted thresholds in previous studies, variables with |r| ≥ 0.80 are regarded as highly correlated and should be excluded to mitigate multicollinearity [11,51]. In this study, general curvature was removed because of their strong collinearity with plan curvature (r = 0.85) and profile curvature (r = −0.83). After this adjustment, the remaining factors fall within an acceptable correlation range, forming a stable predictor set for subsequent modeling and data augmentation.
4.2. Effect of the Parameter on Screening Performance
Figure 5a shows the relationship between and G-mean. As α increases, G-mean steadily improves, reaching a peak of 0.893 at , and then slightly decreases. This trend demonstrates that relying solely on quality (Q) or diversity (D) is suboptimal; instead, balancing the two ensures both sufficient coverage and strong distributional alignment.
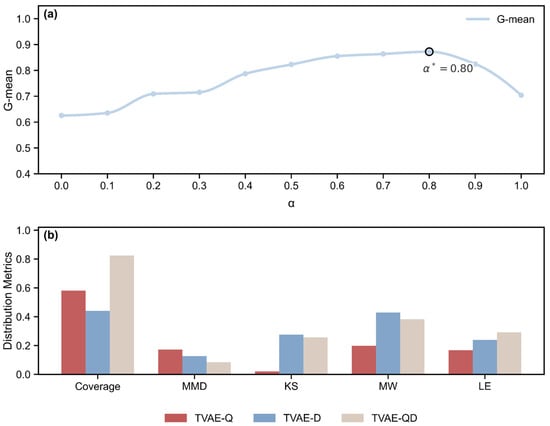
Figure 5.
Effect of the α parameter on performance metrics: (a) G-mean variation; (b) distribution metrics (Coverage, MMD, KS, MW, LE) for TVAE-Q, TVAE-D, and TVAE-QD.
Figure 5b compares representative results at different values. When , the generated data are highly dispersed with poor local coverage (Coverage = 0.441, MMD = 0.127), suggesting improved diversity but a noticeable deviation from the real distribution. At , the data become overly concentrated: Coverage rises to 0.581, but MMD increases to 0.172, indicating reduced global alignment, while marginal consistency also deteriorates (KS = 0.021, MW = 0.198, LE = 0.167). In contrast, achieves the best trade-off: Coverage increases to 0.825, MMD decreases to its minimum value of 0.085, and marginal consistency (KS = 0.257, MW = 0.382, LE = 0.291) remains at a reasonable level. These findings suggest that overemphasizing either diversity or quality introduces drawbacks, whereas preserving both coverage and distributional alignment.
The selection of in this study was primarily based on Coverage and MMD, as they capture complementary aspects of distributional fidelity. Coverage evaluates whether the positive samples from the training set can be represented within the neighborhood of synthetic data, thereby ensuring that local patterns are retained. MMD, by contrast, quantifies differences in global distributions, with smaller values indicating stronger alignment of statistical properties. Coverage thus prevents important real samples from being missed, while MMD avoids systematic shifts at the distribution level. Considering both provides a more reliable criterion, whereas KS, MW, and LE serve as supplementary validation.
In summary, the QD strategy substantially enhances both the coverage and consistency of synthetic data, with providing the optimal balance under the tested conditions.
4.3. Effects of the QD Strategy on Model Performance and Distribution Consistency
As shown in Figure 6, the ROC-AUC values of the TVAE–QD framework under the RF and LightGBM models are 0.903 and 0.897, respectively, both higher than those of TVAE (0.897 and 0.882) and SMOTE (0.884 and 0.875). On the PR curves, the PR-AUC values of TVAE–QD are 0.888 (RF) and 0.876 (LightGBM), also outperforming TVAE (0.882 and 0.854) and SMOTE (0.877 and 0.851). These results indicate that, compared with TVAE and SMOTE, the TVAE–QD framework achieves superior overall classification performance.
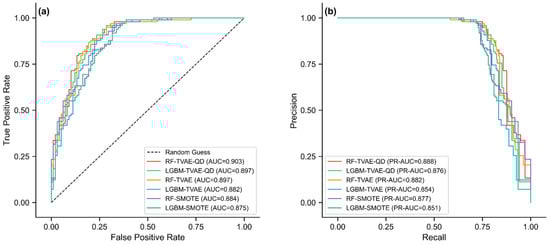
Figure 6.
Comparative performance of SMOTE, TVAE, and TVAE–QD: (a) ROC curves and AUC values; (b) PR curves and PR–AUC values.
Table 1 compares the distribution consistency metrics. The Coverage value of TVAE–QD is 0.830, which is significantly higher than that of SMOTE (0.776) and TVAE (0.651), suggesting that the synthetic samples generated by TVAE–QD cover a broader portion of the real data space. The MMD value is 0.087, lower than that of TVAE (0.096) but slightly higher than that of SMOTE (0.065). Regarding univariate statistical indicators, TVAE–QD also outperforms TVAE, with KS, MW, and LE values of 0.258, 0.393, and 0.283, respectively, compared to 0.229, 0.355, and 0.145 for TVAE. SMOTE shows the highest KS (0.589) and MW (0.656) values but a lower LE value (0.228) than TVAE–QD. This indicates that TVAE–QD is capable of maintaining reasonable local variations while preserving global distributional consistency, thereby improving the quality and diversity of the generated samples.

Table 1.
Distribution Consistency Comparison among SMOTE, TVAE, and TVAE–QD.
Overall, these improvements can be attributed to the introduction of the quality–diversity (QD) strategy, which effectively balances sample quality and diversity, reducing both excessive clustering and distributional drift.
4.4. Visualization and Comparative Analysis of Synthetic and Real Data Distributions
To compare the distribution differences between the generated data and the real data, this study employs UMAP (Uniform Manifold Approximation and Projection) for dimensionality reduction and visualization, mapping high-dimensional data into a two-dimensional space to intuitively display their distribution characteristics. To ensure comparability, all three methods (SMOTE, TVAE, and TVAE-QD) share the same set of UMAP coordinates, with consistent sample sizes, point sizes, and transparency levels, so that the observed differences in the plots reflect only the intrinsic characteristics of each method rather than variations in visualization settings.
Figure 7 illustrates the distribution of synthetic samples generated by different oversampling methods within the feature space. As shown in Figure 7a, SMOTE primarily generates new samples in high-density regions of the minority class, forming locally concentrated clusters around the original samples. This mechanism partially alleviates the class imbalance problem and helps the model capture key features. However, since SMOTE relies on linear interpolation, it struggles to represent the complex nonlinear relationships among landslide samples, which limits further improvement in the model’s discriminative performance. In contrast, TVAE provides a more comprehensive expansion of the original sample space. The generated samples are more dispersed, and the feature diversity is significantly enhanced. Nevertheless, some regions still exhibit local over-clustering, indicating insufficient uniformity in the overall distribution. Building upon this, as shown in Figure 7c, the TVAE–QD approach further improves the representativeness and balance of the synthetic samples. The generated data align more closely with the overall distribution of the real dataset, achieving a more balanced coverage between dense and sparse regions. This more accurate alignment of distributions allows the generated data to better reflect the intrinsic characteristics of the real samples, leading to more stable and consistent model performance during training.
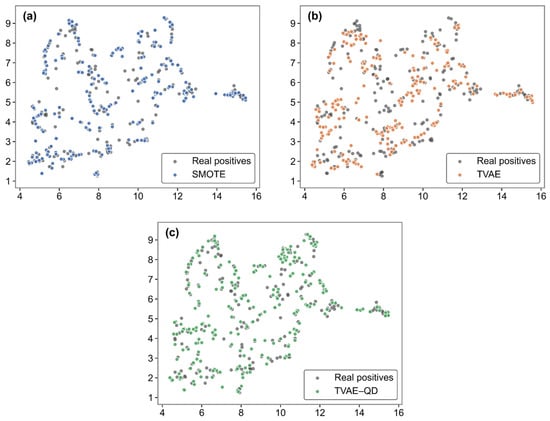
Figure 7.
Two-dimensional UMAP visualization of real positive samples and synthetic samples generated by three different methods: (a) SMOTE, (b) TVAE, and (c) TVAE-QD.
4.5. Evaluation of Different Positive Sample Augmentation Strategies
Figure 8 illustrates the performance of TVAE–QD, TVAE, and SMOTE under different augmentation scales. In the Random Forest model, the AUC and PR–AUC of TVAE–QD gradually increase with the augmentation scale, reaching 0.923 and 0.907 at scale 350.
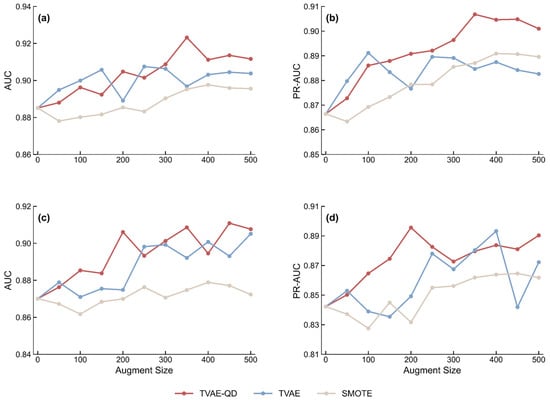
Figure 8.
Performance of different data augmentation methods under varying augmentation sizes for Random Forest and LightGBM: (a) AUC–RF; (b) PR–AUC–RF; (c) AUC–LGBM; (d) PR–AUC–LGBM. Methods compared: TVAE-QD, TVAE, and SMOTE.
For the LightGBM model, the AUC of TVAE–QD increases steadily with scale and peaks at 0.911 at scale 450, while the PR–AUC reaches its maximum of 0.896 at scale 200 before showing some degree of fluctuation.
Compared with TVAE and SMOTE, TVAE–QD demonstrates consistent advantages: while TVAE can occasionally approach its performance at certain scales, the curves fluctuate more sharply; SMOTE produces smoother trends but with limited improvement. These differences indicate that TVAE–QD not only achieves higher accuracy but also maintains greater stability. In summary, TVAE–QD shows a more stable upward trend across different models and augmentation scales, maintaining clear advantages in PR–AUC over most intervals, which highlights its stronger robustness and generalization potential. The observed improvements can be attributed to the QD strategy: by reducing noisy samples and preferentially retaining representative samples near the decision boundary, the strategy ensures distributional consistency of the generated data while enhancing the detection of minority (landslide) samples. Consequently, TVAE–QD outperforms TVAE in terms of stability and overall performance and surpasses SMOTE in most scenarios.
The different performance results seen at various data augmentation scales come from three main factors: data diversity, model sensitivity, and the complex way augmentation methods interact.
In the early stages of augmentation, the variety of new samples helps the model generalize better. This happens because the data covers the feature space more broadly. However, as the augmentation scale grows, too many redundant samples and minor noise can accumulate. This can cause small changes in the AUC and PR–AUC scores.
These score changes relate not only to the data itself but also to how sensitive the model is to changes in data distribution. Because the RF model is an ensemble method, it can partly smooth out the effect of noise. In contrast, LightGBM uses a sequential boosting method, making it more sensitive to shifts in the data distribution. Therefore, when a large amount of augmented data is added, LightGBM usually shows larger performance changes, while RF remains more stable.
At the same time, different augmentation methods change the data distribution in unique ways. SMOTE creates new samples by linearly interpolating between minority class examples. While this helps fix class imbalance, its linear assumption cannot capture nonlinear feature relationships. Also, because most interpolated samples appear in high-density areas, the resulting distribution lacks sufficient diversity, limiting the model’s ability to learn from a wider range of samples.
TVAE, on the other hand, can expand the original sample space more fully and boost feature diversity. However, as the number of augmented samples increases, the local density of generated samples may build up, leading to over-clustering and reduced model stability. To solve this, the TVAE–QD framework adds a quality discrimination mechanism. This mechanism effectively reduces clustering and keeps the overall distribution balanced and stable. This leads to smoother performance trends in most cases.
In summary, the link between augmentation scale and model performance is not linear. Within a moderate range, increasing data diversity improves generalization. However, too much augmentation can change the data distribution and harm model stability. It is therefore critical to find a balance between increasing diversity and keeping the distribution consistent when choosing the scale for data augmentation.
4.6. Landslide Susceptibility Mapping Results
In constructing the landslide susceptibility maps, the TVAE–QD models with the highest AUC values under Random Forest and LightGBM were selected as the mapping basis. The landslide susceptibility maps were constructed in two steps. First, all conditioning factors were rasterized and input into the trained models, generating a susceptibility index for each pixel of the study area. Second, the indices were reclassified into five susceptibility levels—very low, low, moderate, high, and very high—by applying a cumulative proportion segmentation of historical landslide occurrences [52]. In this approach, thresholds corresponding to 5%, 10%, 15%, 20%, and 50% of the total landslide events were adopted to delineate the susceptibility intervals, ensuring that the classification reflects the spatial distribution characteristics of past landslides and provides a rational basis for regional risk assessment (Figure 9a,b).
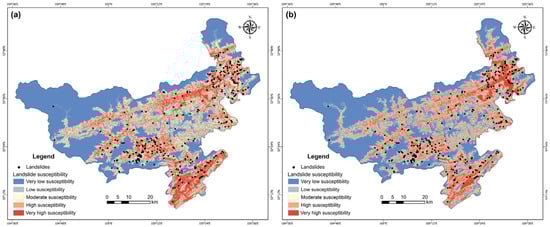
Figure 9.
Comparison of landslide susceptibility results: (a) RF and (b) LightGBM.
Figure 10 further summarizes the area proportions of the five susceptibility classes for both models. For RF, the percentages were 42.51% (very low), 14.62% (low), 16.14% (moderate), 12.28% (high), and 14.45% (very high). For LGBM, the corresponding values were 45.85%, 13.16%, 10.46%, 19.47%, and 11.06%. Both models consistently indicated that the majority of the study area falls within the very low to moderate classes. High and very high susceptibility zones are mainly distributed in the central–southern mountainous and hilly regions, aligning with the dense occurrence of historical landslides. In contrast, the northwestern sector, characterized by gentler relief and stronger lithology, is dominated by very low susceptibility with only scattered moderate–high patches.
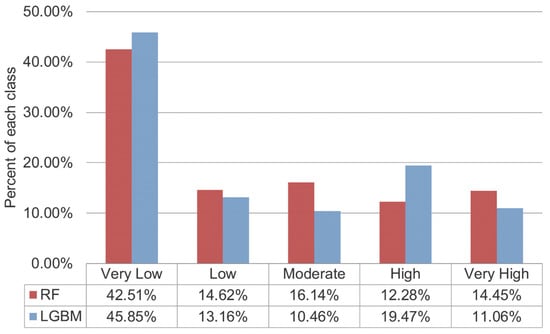
Figure 10.
Histogram of landslide susceptibility classes.
Overall, the susceptibility maps and area statistics are spatially coherent, without abrupt class transitions, and credibly reflect the geomorphological structure of the study area. These findings provide a solid basis for hazard zoning and risk management.
4.7. SHAP Analysis of Feature Contributions
Figure 11a presents the SHAP value distributions of the RF model trained with the optimally augmented subset of 350 samples. Elevation and rainfall exhibit the largest variation and highest SHAP values, confirming their roles as dominant controlling factors. NDVI shows a negative association, suggesting that higher vegetation coverage reduces landslide susceptibility. Distance to roads, distance to faults, and slope show moderate influence, while factors such as aspect, distance to rivers, lithology, and curvature indices have relatively weaker influence.
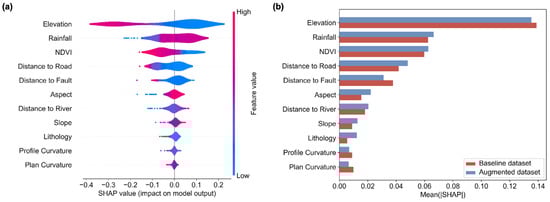
Figure 11.
SHAP feature importance: (a) distribution of feature impacts; (b) comparison of mean SHAP values between baseline and augmented datasets.
Figure 11b compares the global feature importance between the model trained on the baseline dataset and the model trained on the augmented dataset. The augmented model assigns greater weights to the dominant factors, particularly elevation and rainfall, while the overall ranking of variables remains largely unchanged, with only minor shifts among secondary factors. This indicates that QD-based augmentation slightly adjusts feature importance without disrupting the underlying contribution logic, thereby ensuring the stability and interpretability of the model results.
5. Discussion
In this study, we propose the TVAE–QD framework, which integrates the TVAE model with a Quality–Diversity (QD) screening mechanism to improve the effectiveness of data augmentation in landslide susceptibility modeling. While the TVAE model captures the joint probability distribution among the influencing factors, the QD mechanism is applied after sample generation to ensure that the selected samples are both representative and diverse. This design effectively minimizes local clustering, thereby enhancing the reliability of the augmented data and its consistency with the real-world distribution.
5.1. Model and Data Interpretability
The model’s interpretability was confirmed by the SHAP analysis (Figure 8). Elevation and rainfall were consistently identified as the most important factors. Their large SHAP value clearly showed their primary role in predicting landslide susceptibility. The NDVI showed a negative correlation. This means that more vegetation cover leads to lower landslide susceptibility. Distance to roads, distance to faults, and slope had a moderate impact. Aspect, lithology, and curvature had a relatively minor influence.
A comparison between the original and augmented datasets showed that the QD strategy boosted the importance of the primary factors. It only caused minor changes in the ranking of some secondary variables. Overall, the contribution pattern of all factors remained stable. This suggests that data augmentation improved feature representation without disrupting the model’s core logic, thereby increasing its stability and clarity.
In addition to analyzing feature importance, we further validated the QD-augmented samples using statistical and visual methods. Comparative results across multiple metrics (KS, MW, LE, Coverage, and MMD) suggest that the augmented data are generally consistent with the original dataset in both feature distribution and overall structure. The two-dimensional visualization confirms that both datasets have similar distribution patterns in the feature space without any obvious shifts. This indicates that the data augmentation process did not introduce systematic bias. These findings further support the model’s stability and interpretability when using augmented data.
5.2. Spatial Analysis of Landslide Susceptibility Mapping
The landslide susceptibility prediction results for Qingchuan County, as shown in Figure 9, are generally consistent with the spatial distribution of historical landslides. Based on the land use map in Figure 12, which illustrates rivers, land use types, and the recorded landslide locations, it can be observed that high-susceptibility zones are mainly distributed along rivers and their tributaries, concentrated in the transitional areas between hills and low mountains. These regions are characterized by rugged terrain, deeply incised valleys, and abundant but unevenly distributed rainfall, where intense rainfall events easily trigger slope instability. Roads and villages are mostly located along river valleys, making these areas particularly prone to frequent landslides. Overall, topography and rainfall conditions are the primary controlling factors for the spatial distribution of landslides, while human activities in geomorphologically and climatically sensitive regions further amplify the landslide risk.
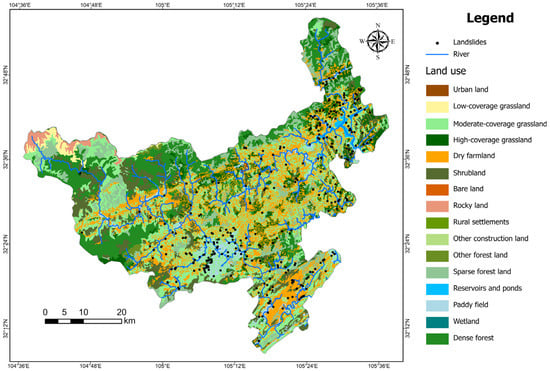
Figure 12.
Land Use Map of Qingchuan County (Data source: https://www.resdc.cn, accessed on 28 October 2025).
In the central and southern parts of the county, landslides predominantly occur on terraces and gentle slopes along river valleys, where the influence of rainfall is especially significant. Intense or prolonged rainfall increases the water content within slopes, raises pore water pressure, and weakens the strength of rock and soil masses, ultimately leading to slope failure. Meanwhile, human activities such as road excavation, toe dumping, and surface runoff concentration disrupt slope stability and increase the likelihood of landslide occurrence.
Although the northeastern region lies at lower elevations, its terrain is highly fragmented and human activity is frequent. Rainfall runoff tends to concentrate and flow over slopes covered by loose deposits, easily triggering shallow landslides. Landslides in this area primarily occur on dry farmland and grassland where vegetation is sparse. The surface materials are loosened by cultivation or grazing, which increases permeability. During intense rainfall, rapid infiltration elevates pore-water pressure. This action reduces effective stress and shear strength, thereby increasing the likelihood of failure. In summary, rainfall combined with land-use and vegetation conditions significantly influences the spatial pattern of landslides.
Some areas with relatively gentle terrain also exhibit high landslide susceptibility, primarily due to the combined effects of human disturbance and rainfall. In these regions, long-term agricultural cultivation and road construction have altered the original slope structure and drainage patterns, resulting in accelerated rainwater infiltration and a rise in groundwater levels. During periods of intense or sustained rainfall, the rapid increase in pore water pressure within the slopes weakens soil cohesion and frictional resistance, ultimately leading to landslides. In the northeastern part of the region, landslides are mainly distributed in dry farmland and grassland areas, while in the central and southern regions they are concentrated in paddy fields, dry farmlands, and grasslands. These land types are characterized by sparse vegetation, easily erodible surfaces, and strong runoff effects during rainfall. Overall, the high landslide susceptibility in these regions reflects the combined influence of topography, rainfall, human activity, and vegetation degradation, rather than being determined by topography alone.
Similar patterns have been observed in other mountainous regions of China. Studies conducted in the Three Gorges Reservoir area and the southwestern mountains have shown that road construction and agricultural expansion often accelerate surface erosion and weaken slope stability, while intense rainfall events further trigger landslides [53,54,55]. The combined effects of human disturbance and rainfall significantly increase the frequency and intensity of landslide occurrences. In contrast, vegetation restoration can effectively improve surface conditions, enhance soil resistance to erosion, and reduce the risk of slope failure [56,57,58]. These findings are consistent with the analysis results of landslide distribution and susceptibility in Qingchuan County. This further indicates that the interactions among topography, rainfall, and human activities are widely present in different mountainous regions and play an important role in controlling the spatial distribution of landslides.
Overall, the spatial pattern of landslides in Qingchuan County results from the combined influence of topographic conditions, rainfall processes, and human activities. River incision and terrain relief provide the geomorphic foundation for landslide development, while rainfall acts as both a triggering and amplifying factor. Meanwhile, land-use changes and vegetation degradation locally intensify this geomorphic response, leading to significantly higher landslide susceptibility in specific areas.
5.3. Model Limitations and Future Directions
Although the proposed TVAE–QD framework shows strong performance in landslide susceptibility modeling, it may still face challenges under specific conditions. In areas with small sample sizes, adding synthetic data can partly relieve the data shortage. However, if the available samples in a new study area are too sparse, the model’s ability to generalize may be weaker, which impacts the stability of prediction results. This challenge partly exists because TVAE, as a deep generative model, heavily depends on enough data to learn the underlying distribution. When the training samples are insufficient, the model might not fully capture the complex relationships between geological and environmental factors. Furthermore, the VAE module requires significant computing power because it involves many iterative optimizations in a high-dimensional latent space. Future studies should explore more efficient regularization methods, targeted data augmentation strategies, and simpler network architectures to better balance performance and computational efficiency.
Meanwhile, the transferability of the framework also needs thorough evaluation. Current experiments are mainly conducted in specific, limited study areas, meaning they have not yet covered a wide range of geological and environmental conditions. When applied to regions with different soil types, water features, or rainfall patterns, the relationships between the influencing factors and landslide occurrence may change. If the target area lacks sufficient samples, these differences could be amplified, reducing the model’s reliability and stability. Therefore, future research must systematically assess the framework’s robustness and generalization across various geological and climate settings to confirm its applicability in broader environments.
At the same time, integrating the TVAE–QD framework with deep learning models like Convolutional Neural Networks (CNNs) or Graph Neural Networks (GNNs) shows great promise. As a data augmentation method, TVAE–QD can generate synthetic samples that match the real data distribution, giving deep learning models richer training sets. This improves the models’ ability to learn complex feature patterns and increases their stability in difficult terrain.
More importantly, the probability distributions from models trained on TVAE–QD-augmented data can be used to identify potential high-risk landslide zones and perform spatial classification of landslide susceptibility. These results provide quantitative backing for early warning systems, helping decision-makers optimize the placement of monitoring sites and the allocation of prevention resources. By turning model predictions into practical tools for risk management, the TVAE–QD framework not only boosts interpretability and stability scientifically but also shows practical value in engineering.
6. Conclusions
This study proposes a QD-based screening strategy to improve landslide susceptibility modeling under class-imbalanced conditions. Systematic analysis shows that the α parameter plays a critical role in balancing screening performance and distributional consistency. Compared with the baseline TVAE and the conventional SMOTE method, the QD strategy generally achieved higher ROC–AUC and PR–AUC results in both Random Forest and LightGBM models, and demonstrated stability across different augmentation scales. This indicates that QD can effectively select synthetic samples with more consistent distributions, thereby mitigating the discrepancy between real and augmented data. Results of distributional consistency metrics further validate the role of this strategy in improving data quality.
Beyond predictive performance, the integration of SHAP analysis enhanced the interpretability of the models, highlighting the relative importance of conditioning factors such as elevation, slope, lithology, and rainfall, thereby linking the modeling outcomes with their geophysical significance. By improving model accuracy while ensuring that synthetic data respects underlying geological patterns, the proposed framework offers a valuable tool for landslide susceptibility assessment and risk management.
Future studies are needed to validate this strategy in diverse geographic settings, explore its integration with advanced deep learning architectures, and assess its potential for real-time application in early-warning systems. Overall, the proposed framework improves landslide susceptibility prediction under imbalanced data and offers valuable support for disaster risk assessment and mitigation.
Author Contributions
Conceptualization, Z.X. and S.W.; methodology, Z.X.; software, Z.X.; validation, Z.X., M.Y. and X.Z.; formal analysis, Z.X.; investigation, Z.X.; resources, M.Y.; data curation, Z.X., Z.L. and S.Y.; writing—original draft preparation, Z.X.; writing—review and editing, S.W., M.Y. and J.H.; visualization, Z.X.; supervision, S.W. and M.Y.; project administration, S.W. and M.Y.; funding acquisition, S.W. and M.Y. All authors have read and agreed to the published version of the manuscript.
Funding
This research was funded by the National Natural Science Foundation of China (NSFC), grant number 42474057, and the Guangxi Key Laboratory of Spatial Information and Surveying, grant number 19-050-11–27.
Institutional Review Board Statement
Not applicable.
Informed Consent Statement
Not applicable.
Data Availability Statement
The data that support the findings of this study are available from the corresponding author upon reasonable request.
Acknowledgments
The authors are thankful to Xu Liu and Xinwei Jiang for their support and suggestions.
Conflicts of Interest
The authors declare no conflicts of interest.
References
- Lu, Z.-Y.; Liu, G.-Y.; Zhao, X.-D.; Sun, K.; Chen, Y.-S.; Song, Z.-H.; Xue, K.; Yang, M.-S. Landslide susceptibility assessment based on an interpretable coupled FR-RF model: A case study of Longyan City, Fujian Province, Southeast China. China Geol. 2025, 8, 281–294. [Google Scholar] [CrossRef]
- Pande, P.; Raut, J.; Bhagat, R.; Dhengare, S. Integrating social vulnerability to improve landslide susceptibility assessment quality: A hybrid machine learning approach. Discov. Appl. Sci. 2025, 7, 1109. [Google Scholar] [CrossRef]
- Taşkanat, T.; Karkınlı, A.E.; Kesikoğlu, A.; Beşdok, E. Evolutionary optimization of neural network for landslide susceptibility assessment. Stoch. Environ. Res. Risk Assess. 2025. [Google Scholar] [CrossRef]
- Wang, P.; Deng, H. The impact of different sampling strategies on landslide susceptibility assessment: An explainable hybrid BO-XGBoost model. Earth Sci. Inform. 2025, 18, 440. [Google Scholar] [CrossRef]
- Xu, S.; Wang, Z.; Liu, J.; Ma, X.; Zhou, T.; Tang, Q. Landslide susceptibility assessment using lightweight dense residual network with emphasis on deep spatial features. Sci. Rep. 2025, 15, 12552. [Google Scholar] [CrossRef]
- Yang, S.; Li, D.; Sun, Y.; She, X. Effect of landslide spatial representation and raster resolution on the landslide susceptibility assessment. Environ. Earth Sci. 2024, 83, 132. [Google Scholar] [CrossRef]
- He, Z.; Zhang, W.; Cai, J.; Fan, J.; Xu, H.; Feng, H.; Luo, X.; Wu, Z. Assessment of Landslide Susceptibility in the Moxi Tableland of China by Using a Combination of Deep-Learning and Factor-Refinement Methods. Appl. Sci. 2024, 14, 5042. [Google Scholar] [CrossRef]
- Su, L.; Gui, Y.; Xu, L.; Ming, D. Rain-Induced Landslide Hazard Assessment Using Inception Model and Interpretability Method—A Case Study of Zayu County, Tibet. Appl. Sci. 2024, 14, 5324. [Google Scholar] [CrossRef]
- Ning, Z.; Tie, Y. Sampling Method Based on Fuzzy Membership for Computing Negative Sample Credibility and Its Applications. Appl. Sci. 2025, 15, 7646. [Google Scholar] [CrossRef]
- Orefice, S.; Innocenti, C. Regional assessment of coastal landslide susceptibility in Liguria, Northern Italy, using MaxEnt. Nat. Hazards 2024, 121, 2613–2639. [Google Scholar] [CrossRef]
- Ding, D.; Wu, Y.; Wu, T.; Gong, C. Landslide susceptibility assessment in Tongguan District Anhui China using information value and certainty factor models. Sci. Rep. 2025, 15, 12275. [Google Scholar] [CrossRef]
- Wang, X.; Ma, X.; Guo, D.; Yuan, G.; Huang, Z. Construction and Optimization of Landslide Susceptibility Assessment Model Based on Machine Learning. Appl. Sci. 2024, 14, 6040. [Google Scholar] [CrossRef]
- Shao, X.; Yan, W.; Yan, C.; Zhao, W.; Wang, Y.; Shi, X.; Dong, H.; Li, T.; Yu, J.; Zuo, P.; et al. Explainable Machine Learning for Mapping Rainfall-Induced Landslide Thresholds in Italy. Appl. Sci. 2025, 15, 7937. [Google Scholar] [CrossRef]
- Zhao, Y.; Qin, S.; Zhang, C.; Yao, J.; Xing, Z.; Cao, J.; Zhang, R. Landslide susceptibility assessment based on frequency ratio and semi-supervised heterogeneous ensemble learning model. Environ. Sci. Pollut. Res. Int. 2024, 31, 32043–32059. [Google Scholar] [CrossRef] [PubMed]
- Yong, C.; Jinlong, D.; Fei, G.; Bin, T.; Tao, Z.; Hao, F.; Li, W.; Qinghua, Z. Review of landslide susceptibility assessment based on knowledge mapping. Stoch. Environ. Res. Risk Assess. 2022, 36, 2399–2417. [Google Scholar] [CrossRef]
- Zhao, P.; Wang, Y.; Xie, Y.; Uddin, M.G.; Xu, Z.; Chang, X.; Zhang, Y. Landslide susceptibility assessment using information quantity and machine learning integrated models: A case study of Sichuan province, southwestern China. Earth Sci. Inform. 2025, 18, 190. [Google Scholar] [CrossRef]
- Chen, Y. Spatial prediction and mapping of landslide susceptibility using machine learning models. Nat. Hazards 2025, 121, 8367–8385. [Google Scholar] [CrossRef]
- Ado, M.; Amitab, K. Hyper-parameter optimization for enhanced machine learning-based landslide susceptibility mapping. Environ. Sci. Pollut. Res. Int. 2025, 32, 15746–15771. [Google Scholar] [CrossRef]
- Chen, W.; Wang, C.; Zhao, X.; Bai, L.; He, Q.; Chen, X.; Zhao, Q.; Zhao, R.; Li, T.; Tsangaratos, P.; et al. Optimizing landslide susceptibility mapping using integrated forest by penalizing attributes model with ensemble algorithms. Earth Sci. Inform. 2025, 18, 225. [Google Scholar] [CrossRef]
- Qian, L.; Ou, L.; Li, G.; Chen, Y.; Qian, B. Optimizing the application of machine learning models in predicting landslide susceptibility using the information value model in Junlian County of Sichuan Basin. Adv. Space Res. 2025, 76, 699–717. [Google Scholar] [CrossRef]
- Jiang, Y.; Wang, W.; Zou, L.; Cao, Y.; Xie, W.-C. Investigating landslide data balancing for susceptibility mapping using generative and machine learning models. Landslides 2024, 22, 189–204. [Google Scholar] [CrossRef]
- Gupta, S.K.; Shukla, D.P. Handling data imbalance in machine learning based landslide susceptibility mapping: A case study of Mandakini River Basin, North-Western Himalayas. Landslides 2022, 20, 933–949. [Google Scholar] [CrossRef]
- Wu, B.; Shi, Z.; Zheng, H.; Peng, M.; Meng, S. Impact of sampling for landslide susceptibility assessment using interpretable machine learning models. Bull. Eng. Geol. Environ. 2024, 83, 461. [Google Scholar] [CrossRef]
- Gao, H.; Fam, P.S.; Tay, L.T.; Low, H.C. Three oversampling methods applied in a comparative landslide spatial research in Penang Island, Malaysia. SN Appl. Sci. 2020, 2, 1512. [Google Scholar] [CrossRef]
- Zhang, S.; Wang, Y.; Wu, G. Earthquake-Induced Landslide Susceptibility Assessment Using a Novel Model Based on Gradient Boosting Machine Learning and Class Balancing Methods. Remote Sens. 2022, 14, 5945. [Google Scholar] [CrossRef]
- Song, Y.; Yang, D.; Wu, W.; Zhang, X.; Zhou, J.; Tian, Z.; Wang, C.; Song, Y. Evaluating Landslide Susceptibility Using Sampling Methodology and Multiple Machine Learning Models. ISPRS Int. J. Geo-Inf. 2023, 12, 197. [Google Scholar] [CrossRef]
- Zhao, L.; Wu, X.; Niu, R.; Wang, Y.; Zhang, K. Using the rotation and random forest models of ensemble learning to predict landslide susceptibility. Geomat. Nat. Hazards Risk 2020, 11, 1542–1564. [Google Scholar] [CrossRef]
- Agrawal, K.; Baweja, Y.; Dwivedi, D.; Saha, R.; Prasad, P.; Agrawal, S.; Kapoor, S.; Chaturvedi, P.; Mali, N.; Kala, V.U.; et al. A Comparison of Class Imbalance Techniques for Real-World Landslide Predictions. In Proceedings of the 2017 International Conference on Machine Learning and Data Science (MLDS), Noida, India, 4–15 December 2017; pp. 1–8. [Google Scholar]
- Min, D.-H.; Kim, Y.; Kim, S.; Yoon, H.-K. Strategy of oversampling geotechnical parameters through geostatistical, SMOTE, and CTGAN methods for assessing susceptibility of landslide. Landslides 2023, 21, 291–307. [Google Scholar] [CrossRef]
- Ali, M. Classification of imbalanced travel mode choice dataset with SMOTE and prediction using interpretable machine learning. Sustain. Futures 2025, 10, 101119. [Google Scholar] [CrossRef]
- Wang, Y.; Wu, X.; Chen, Z.; Ren, F.; Feng, L.; Du, Q. Optimizing the Predictive Ability of Machine Learning Methods for Landslide Susceptibility Mapping Using SMOTE for Lishui City in Zhejiang Province, China. Int. J. Environ. Res. Public Health 2019, 16, 368. [Google Scholar] [CrossRef] [PubMed]
- Chawla, N.V.; Bowyer, K.W.; Hall, L.O.; Kegelmeyer, W.P. SMOTE: Synthetic minority over-sampling technique. J. Artif. Intell. Res. 2002, 16, 321–357. [Google Scholar] [CrossRef]
- Feng, Z.-y.; Zhou, J.-w.; Yang, X.-g.; Tan, L.-j.; Liao, H.-m. Prediction of landslide dam stability and influencing factors analysis. Eng. Geol. 2025, 350, 108021. [Google Scholar] [CrossRef]
- DemİR, S.; ŞAhİN, E.K. Evaluation of Oversampling Methods (OVER, SMOTE, and ROSE) in Classifying Soil Liquefaction Dataset based on SVM, RF, and Naïve Bayes. Eur. J. Sci. Technol. 2022. [Google Scholar] [CrossRef]
- Khan, A.A.; Chaudhari, O.; Chandra, R. A review of ensemble learning and data augmentation models for class imbalanced problems: Combination, implementation and evaluation. Expert Syst. Appl. 2024, 244, 122778. [Google Scholar] [CrossRef]
- Kim, S.; Yoon, H.-K. Application of classification coupled with PCA and SMOTE, for obtaining safety factor of landslide based on HRA. Bull. Eng. Geol. Environ. 2023, 82, 381. [Google Scholar] [CrossRef]
- Pham, Q.B.; Ekmekcioğlu, Ö.; Ali, S.A.; Koc, K.; Parvin, F. Examining the role of class imbalance handling strategies in predicting earthquake-induced landslide-prone regions. Appl. Soft Comput. 2023, 143, 110429. [Google Scholar] [CrossRef]
- Zhang, H.; Song, Y.; Xu, S.; He, Y.; Li, Z.; Yu, X.; Liang, Y.; Wu, W.; Wang, Y. Combining a class-weighted algorithm and machine learning models in landslide susceptibility mapping: A case study of Wanzhou section of the Three Gorges Reservoir, China. Comput. Geosci. 2022, 158, 104966. [Google Scholar] [CrossRef]
- Song, Y.; Niu, R.; Xu, S.; Ye, R.; Peng, L.; Guo, T.; Li, S.; Chen, T. Landslide Susceptibility Mapping Based on Weighted Gradient Boosting Decision Tree in Wanzhou Section of the Three Gorges Reservoir Area (China). ISPRS Int. J. Geo-Inf. 2018, 8, 4. [Google Scholar] [CrossRef]
- Xu, L.; Skoularidou, M.; Cuesta-Infante, A.; Veeramachaneni, K. Modeling tabular data using conditional GAN. arXiv 2019, arXiv:1907.00503. [Google Scholar] [CrossRef]
- Miletic, M.; Sariyar, M. Challenges of Using Synthetic Data Generation Methods for Tabular Microdata. Appl. Sci. 2024, 14, 5975. [Google Scholar] [CrossRef]
- Quang Tran, V.; Byeon, H. Explainable hybrid tabular Variational Autoencoder and feature Tokenizer Transformer for depression prediction. Expert Syst. Appl. 2025, 265, 126084. [Google Scholar] [CrossRef]
- Chundawat, V.S.; Tarun, A.K.; Mandal, M.; Lahoti, M.; Narang, P. A Universal Metric for Robust Evaluation of Synthetic Tabular Data. IEEE Trans. Artif. Intell. 2024, 5, 300–309. [Google Scholar] [CrossRef]
- Lu, M.; Tay, L.T.; Mohamad-Saleh, J. Landslide susceptibility analysis using random forest model with SMOTE-ENN resampling algorithm. Geomat. Nat. Hazards Risk 2024, 15, 2314565. [Google Scholar] [CrossRef]
- Wang, A.X.; Chukova, S.S.; Simpson, C.R.; Nguyen, B.P. Challenges and opportunities of generative models on tabular data. Appl. Soft Comput. 2024, 166, 112223. [Google Scholar] [CrossRef]
- Silverman, B.W. Density Estimation for Statistics and Data Analysis; Routledge: London, UK, 2018. [Google Scholar]
- Aitchison, J.; Aitken, C.G. Multivariate binary discrimination by the kernel method. Biometrika 1976, 63, 413–420. [Google Scholar] [CrossRef]
- Li, Q.; Racine, J. Nonparametric estimation of distributions with categorical and continuous data. J. Multivar. Anal. 2003, 86, 266–292. [Google Scholar] [CrossRef]
- Rihan, M.; Talukdar, S.; Naikoo, M.W.; Ahmed, R.; Shahfahad; Rahman, A. Improving Landslide Susceptibility Prediction in Uttarakhand through Hyper-Tuned Artificial Intelligence and Global Sensitivity Analysis. Earth Syst. Environ. 2024. [Google Scholar] [CrossRef]
- Lundberg, S.M.; Lee, S.-I. A unified approach to interpreting model predictions. Adv. Neural Inf. Process. Syst. 2017, 30. Available online: https://proceedings.neurips.cc/paper/2017/hash/8a20a8621978632d76c43dfd28b67767-Abstract.html (accessed on 3 October 2025).
- Zhang, J.; Zhu, C.; Xie, L.; Wu, S.; Cao, C.; Wang, M.; Cui, S. Comparative study on landslide susceptibility assessment of different models: A case study of alpine mountainous region in Xinjiang. Bull. Eng. Geol. Environ. 2025, 84, 95. [Google Scholar] [CrossRef]
- Xu, L.; Ju, N.; Deng, M.; Xie, M.; Zhou, F.; Li, C.; Tang, Y. Comparative analysis of landslide susceptibility assessment accuracy in different evaluation units. J. Eng. Geol. 2024, 32, 1640–1653. [Google Scholar]
- Li, M.; Ao, Y.; Peng, P.; Zhao, J. Susceptibility assessment and driving factor analysis of geological hazards in complex landform areas: Insights from Sichuan, China. Bull. Eng. Geol. Environ. 2025, 84, 481. [Google Scholar] [CrossRef]
- Chen, Z.; Song, D.; Dong, L. An innovative method for landslide susceptibility mapping supported by fractal theory, GeoDetector, and random forest: A case study in Sichuan Province, SW China. Nat. Hazards 2023, 118, 2543–2568. [Google Scholar] [CrossRef]
- Li, Y.; Wang, X.; Mao, H. Influence of human activity on landslide susceptibility development in the Three Gorges area. Nat. Hazards 2020, 104, 2115–2151. [Google Scholar] [CrossRef]
- Schmaltz, E.M.; Steger, S.; Glade, T. The influence of forest cover on landslide occurrence explored with spatio-temporal information. Geomorphology 2017, 290, 250–264. [Google Scholar] [CrossRef]
- Sato, T.; Shuin, Y. Variation in the frequency and characteristics of landslides in response to changes in forest cover and rainfall in Japan over the last century: A literature review. Catena 2025, 249, 108639. [Google Scholar] [CrossRef]
- Aksoy, H. Determination of landslide susceptibility with Analytic Hierarchy Process (AHP) and the role of forest ecosystem services on landslide susceptibility. Env. Monit Assess 2023, 195, 1525. [Google Scholar] [CrossRef]
Disclaimer/Publisher’s Note: The statements, opinions and data contained in all publications are solely those of the individual author(s) and contributor(s) and not of MDPI and/or the editor(s). MDPI and/or the editor(s) disclaim responsibility for any injury to people or property resulting from any ideas, methods, instructions or products referred to in the content. |
© 2025 by the authors. Licensee MDPI, Basel, Switzerland. This article is an open access article distributed under the terms and conditions of the Creative Commons Attribution (CC BY) license (https://creativecommons.org/licenses/by/4.0/).