Abstract
Hot dry rock (HDR) is a promising renewable energy resource whose vast reserves and wide distribution have attracted extensive attention in recent years. However, exploiting HDR resources requires hydraulic stimulation, which is typically accompanied by substantial microseismic activity, posing significant risks to project safety and public acceptance. Current understanding of microseismic mechanisms, particularly the role of fracture geometry under varying injection schemes, remains inadequate. This study employs a three-dimensional block-based discrete element method to construct a fluid–mechanics coupled model founded on a discrete fracture network, aimed at investigating the mechanical behavior of fractures and the spatial distribution of microseismicity during hydraulic stimulation. Our results quantitatively demonstrate that fractures oriented at 45° to the maximum principal stress are most susceptible to shear reactivation and microseismic clustering, with event magnitudes strongly correlated to both fracture orientation and intra-fracture fluid pressure. Consequently, preventing critically high fluid pressures in natural fractures near the injection well, particularly those at approximately 45° to the maximum principal stress direction, is essential for risk mitigation. Cyclic injection can shear more fractures and slightly reduce magnitudes via staged pressure relaxation, but its effectiveness in controlling microseismic magnitude is limited. Therefore, it is recommended to implement measures to control the entry of fracturing fluid into these high-risk fissures, such as segmented fracturing or temporary plugging techniques. This strategy is expected to enhance seismic risk mitigation, thereby contributing to the safe and efficient exploitation of deep geothermal resources.
1. Introduction
Geothermal energy is a clean, stable, and renewable energy source that originates from the heat of Earth. The calorific value reserves within 3–10 km depth of the earth’s crust are about 42.7 × 10⁶ EJ, of which 80% come from hot dry rock (HDR) in enhanced geothermal system (EGS) []. At a conservative estimate, the energy contained in HDR (3–10 km) is equivalent to 30 times the energy contained in oil, natural gas, and coal worldwide [,,]. Predictably, the development of HDR will make a significant contribution to global energy conservation, emission reduction, and a new round of energy structure adjustment in the future [,,].
Hydraulic fracturing (HF) stimulation has become a well-established method for enhancing geothermal heat extraction from HDR by creating high-density fractures [,]. In HDR geothermal reservoirs, the extremely low permeability of rocks makes a successful fracturing operation largely dependent on reactivation of pre-existing natural fractures [,]. However, hydraulic stimulation aimed at reactivating fractures and creating a commercial reservoir induces a series of microseisms. Particularly in crystalline granite, these stimulation treatments are often accompanied by a large amount of seismic activity and have caused extensive discussion and concerns [,,,]. For example, a microseismic event (M = 3.4) triggered by the hydraulic stimulation of Basel in Switzerland led to the termination of the project []. In Soultz in France and Cooper in Australia, hydraulic fracturing also induced a series of seismic events, with the highest magnitudes reaching M = 2.9 and M = 3.7, respectively [,,,]. In addition, studies have shown that the M = 5.5 seismic activity in Pohang, South Korea is related to the development of nearby EGS projects [,].
Since then, efforts have been made to study the response mechanisms of microseisms triggered by fluid injections []. The investigation concluded that the generation of induced seismicity is related to the rock mechanical properties of the reservoir, original stress state, and the spatial distribution of natural fractures [,]. In general, brittle rocks fail suddenly and undergo tensile fracture under the induction of a large fluid pressure. With a small amplitude of inelastic deformation, brittle rocks exhibited a large degree of stress drop. However, it is difficult for this mechanism to form a strong moment magnitude because the moment displacement formed when the crack ruptures is extremely small []. Therefore, some scholars believe that seismicity induced by hydraulic fracturing is mainly related to shear slip rather than tensile failure [,,,]. The fluid pressure along a natural fracture can increase immediately during fracturing. If the injection pressure exceeds a critical value, shear slip occurs along the natural fracture, thereby inducing seismicity []. At this time, the difference in the friction coefficient and stress state in the reservoir can result in induced microseismic events of different magnitude [,,]. This knowledge aids in understanding the mechanism of seismic activity and plays a guiding role in formulating an optimal hydraulic injection scheme.
On the basis of these theoretical foundations, a series of stimulation methods have been developed. These methods were designed to create necessary heat exchange networks while potentially mitigating the risk of inducing high-magnitude seismic events [,,,]. Observations in the field indicate that controlling the injection rate may be a promising method for mitigating the occurrence of induced microseisms []. For example, wells with low injection rates are much less likely to be associated with earthquakes than high-injection rate wells, and the critical rate above the induced seismicity may depend on the rock properties of the HDR reservoir []. In addition, the time variation of the injection rate is typically related to the frequency of microseismic occurrences. Previous results indicated that a sudden increase in the injection rate tends to occur shortly before the occurrence of a larger microseismic event [,,]. Therefore, the cyclic/alternating injection scheme, by adjusting the injection schedule to control the fracture net pressure to achieve stress relaxation, has become a new choice for hydraulic fracturing in HDR reservoirs [,,].
Nevertheless, existing studies have demonstrated that even when hydraulic fracturing injection schedules are optimized to mitigate induced seismicity, substantial microseismic events can still be triggered []. It is probable that some fractures with specific occurrences are responsible for inducing large microseisms. Regardless of the injection method, as long as the fluid injection reaches a certain volume, fractures that are prone to inducing large microseismic events can form a large fluid pressure, thereby triggering substantial microseismic activity. Therefore, studying the mechanism of hydro-induced microseismic events in HDR, determining the fractures that are prone to induce large microseismic events, and taking corresponding measures to reduce earthquakes are of great significance for the development of HDR geothermal resources [].
At present, the complex interactions between hydraulic fractures and natural fractures, and the fundamental mechanisms of induced microseismicity in fractured reservoirs, remain to be fully understood [,,]. However, previous studies have largely overlooked the microseismic response mechanisms of fractured reservoirs under different fluid injection conditions, as well as the determination of the coupled relationships among fluid variation, fracture reactivation, and microseismic induction [,]. There have been relatively few studies on the distribution of microseismic events generated during injection and their relationship with fracture distribution; moreover, analyses of how injection patterns influence microseismic behavior are also lacking.
In this study, we first modeled the Discrete Fracture Network (DFN) based on the published investigation data of the FORGE site. On this basis, considering the need for further discrete fracture models (DFM) and numerical simulations of hydraulic stimulation processes, the connectivity of DFN was analyzed, and the DFN was simplified based on the spatial geometric relationship between connectivity and fractures. Based on the simplified DFN, a Discrete Fracture Model for the FORGE site was established, and a fluid-solid coupling model and microseismic analysis model for the hydraulic stimulation were further developed. This model can analyze the occurrence and distribution of microseismicity in the site while analyzing the process of hydraulic stimulation injection. We conducted reservoir stimulation analysis under different injection modes (continuous, cyclic, and stepped) using the DFM, and the impact of injection modes on the number, magnitude, and distribution of microseismic events also been analyzed.
This study employs a DFN-based discrete fracture model to analyze reservoir microseismicity and its evolution during fracturing injection, and establishes the relationship between these phenomena and reservoir fracture behavior and spatial fracture distribution. On this basis, the effects of different injection regimes on fracture rupture behavior and microseismic activity are examined, and recommendations for mitigating fracturing-induced microseismicity are provided. Unlike previous studies, this work not only examines the magnitudes of microseismic events and the spatial distribution of microseismic clouds, but also analyzes the relationship between the spatial distribution of microseismic events and fracture distribution and fracture behavior; furthermore, it investigates the specific effects of different injection patterns on microseismic event characteristics and fracture mechanics. This dual focus on microseismic event distribution and fracture mechanics offers new insights for optimizing hydraulic stimulation techniques to minimize seismic risk, and will inform efforts to reduce microseismic occurrence and to evaluate fracturing outcomes based on microseismic observations.
2. Numerical Methods
The hydromechanical coupling processes in fractured reservoirs are very complex. To study the microseismic behavior caused by water injection in the fractured reservoir, the behavior of fractures must be precisely characterized in the model. The discrete element method based on block systems is particularly advantageous for analyzing the fracture behavior. In this study, a reservoir model was constructed and analyzed using the 3DEC software (Version 5.2), which was founded on the discrete element model.
2.1. Governing Equations for Hydraulic Stimulation
2.1.1. Hydromechanical Coupled Model
- (1)
- Fracture Fluid Flow
Owing to the low permeability of the HDR rock matrix, it is assumed that the fracturing fluid in the fracturing process only migrates through fractures []. In other words, the block in the model was impermeable, and the fluid flow was confined to the fractures within the blocks. The flow velocity can be determined using Darcy’s law and Cubic Law.
where K is the coefficient of permeability; P is the pressure of fluid in the fracture; ρ is the density of fluid; g is the acceleration of gravity; μ is the viscosity of the fluid; b is the fracture aperture, which can change during the injection process.
- (2)
- Fracture Deformation
The hydraulic fracturing process differs from that of the general geotechnical mechanics. Owing to the injection of high-pressure fluid, the intra-fracture fluid pressure is not always less than the stress on the fracture. Therefore, it is necessary to calculate the fracture displacement according to the relative size of the intra-fracture fluid pressure and stress on the fracture (caused by in situ stress). When considering the fracture stress state, the stress on the fracture surface can be characterized by its normal stress component of the fracture surface.
The fracture was closed when the pressure on it was less than the internal fluid pressure. At this time, the upper and lower surfaces of the fracture are in contact with each other, and friction must be overcome for the shear deformation of the fracture. Here, we used to define the effective shear stress, which can be used to calculate the shear deformation.
where is the effective shear stress on the fracture surface when the fluid pressure is less than the normal stress; is the shear stress on the fracture surface; is the normal stress on the fracture surface, is the intra-fracture fluid pressure, is the friction coefficient on the fracture surface. When the effective shear stress is greater than the shear strength, fracture slides and shear deformation can occur, which can be calculated from the shear stiffness, as follows.
where is the shear displacement of the fracture surface; is the shear modulus of the fracture surface under compressed state.
Similarly, the aperture variation of the fracture can be calculated from the compressive stiffness, as follows.
where is the variation of fracture aperture; is the compressive stiffness in the compressed state.
Fracture opening occurs when the fluid pressure exceeds the normal stress acting on the fracture surface. Under these conditions, the fracture can be considered to be in a tensile state, with the fracture surfaces separated from each other. Consequently, no frictional resistance was observed during shear deformation. Therefore, the effective shear stress under these conditions is:
In other words, under the condition that the fluid pressure is higher than the normal stress on the fracture surface, the only force causing the shear displacement of the fracture is the shear stress on the fracture surface.
Thus, shear displacement can be calculated as follows.
The calculation method is the same as that used in Equation (3), but it should be noted that due to the change in the stress state of the fracture, the shear stiffness of the fracture surface also changes. At this time, is the shear stiffness in the fracture tension state, and the change in fracture aperture can be calculated as:
where is the tensile stiffness in the fracture tension state.
2.1.2. Microseismic Analysis Model
To calculate microseisms during hydraulic fracturing, our model adopts the moment tensor theory proposed by McGarr et al. []. This method is widely used in numerical simulation to analyze the induced microseismic events and has achieved satisfactory results []. Based on this, the scalar of the seismic moment of each microseismic event can be defined as
where d is the shear displacement of the fracture surface; τ is the shear stress on the fracture surface; and A is the fracture surface area. In numerical analysis, the area of fracture elements can be used to represent the fracture area .
According to Das et al. [], microseismic magnitudes can be calculated based on seismic moment (Equation (9)). Compared with the commonly used moment magnitude (Mw), magnitudes obtained by this method provide more accurate results for the analysis of very small-magnitude earthquakes.
This study adopts the Mwg scale because it provides a more reliable estimation of microseismic magnitudes, particularly for small- and medium-magnitude events. Traditional magnitude scales such as Mw have known limitations. In particular, the Mw scale has a mathematical inconsistency when applied below Ms 7.5, which is only valid for the range 5.0 ≤ Ms ≤ 7.0 []. The Mw scale was developed and validated mainly for Southern California for magnitudes above 3.0. The Mw scale has been globally validated for magnitudes above 7.5 and performs reliably primarily for large, shallow earthquakes worldwide. It tends to yield inaccurate estimates for intermediate- and deep-focus events and often overestimates the energy release for smaller earthquakes. Furthermore, it assumes a constant energy-to-moment ratio (E/ Mo = 5 × 10⁻⁵), which oversimplifies the complex energy radiation process and neglects regional variations. In contrast, the Mwg scale, derived from globally distributed data, provides statistically improved and energy-consistent results, making it more suitable for analyzing microseismic activity in this study.
Thus, the moment magnitude of the induced microseismic events could be calculated from the displacement of the fracture surface. However, it should be noted that this method will lead to large-magnitude microseismic events, particularly for sparser meshing. Therefore, we considered that the calculated microseismic magnitude as the result of the average energy release within each numerical grid. In essence, within a given spatial domain, the cumulative density of numerous low-magnitude microseismic events is equal to that of a single larger event, contingent on the local discretization resolution. However, the relationship between the microseismic magnitude and energy release is exponential, and the energy density variation caused by unit density is only related to the size of the area. This means that the difference in the microseismic magnitude caused by the discretization resolution will not significantly affect the main part of the modeled microseismic magnitude. That is to say, the size of the grid will only have a slight impact on the magnitude, and will not have any effect on the spatial distribution of microseismic events. But the density of the grid is not only controlled by the calculation process of microseismic, but mechanical and fluid calculations also have certain requirements for grid density. If the grid is too sparse, it will make it difficult to solve mechanical and fluid calculations, and this requirement for grid accuracy directly determines that the influence of grid density in microseismic calculations is minimal. Under the condition that the grid density meets the requirements of mechanics and fluid calculations, the influence of grid density on subsequent analysis can be considered negligible.
2.1.3. Numerical Implementation of Microseismic Model
In the numerical simulation, a discrete fracture model was generated using a pre-generated discrete fracture network that included discrete blocks and fractures between blocks. During the meshing process, the fracture network and blocks must be meshed separately to form fracture meshes (2D) and block meshes (3D). Based on this, the 3DEC can perform a numerical simulation for hydraulic stimulation.
During the model calculation, fracture elements area , normal stress , shear stress and fluid pressure are calculated at each time step. After convergence, these results can be used to calculate the magnitude and location of microseismic events at each time step. Functions for calculating microseismic events can be written using the built-in FISH language in 3DEC and called by the simulation event manager after each time step calculation is completed. Previous studies have validated the effectiveness of the above model using experimental data [].
2.2. Site Natural Fractures Distribution and DFN Construction
The 58-32 well at the Milford site in Utah, USA, was used as the research object for this study. This site belongs to the FORGE project, a famous HDR development project in the United States. This project aims to establish a replicable EGS engineering development model with commercial viability, ultimately providing replicable technical solutions and industrialization pathways for the geothermal sector [].
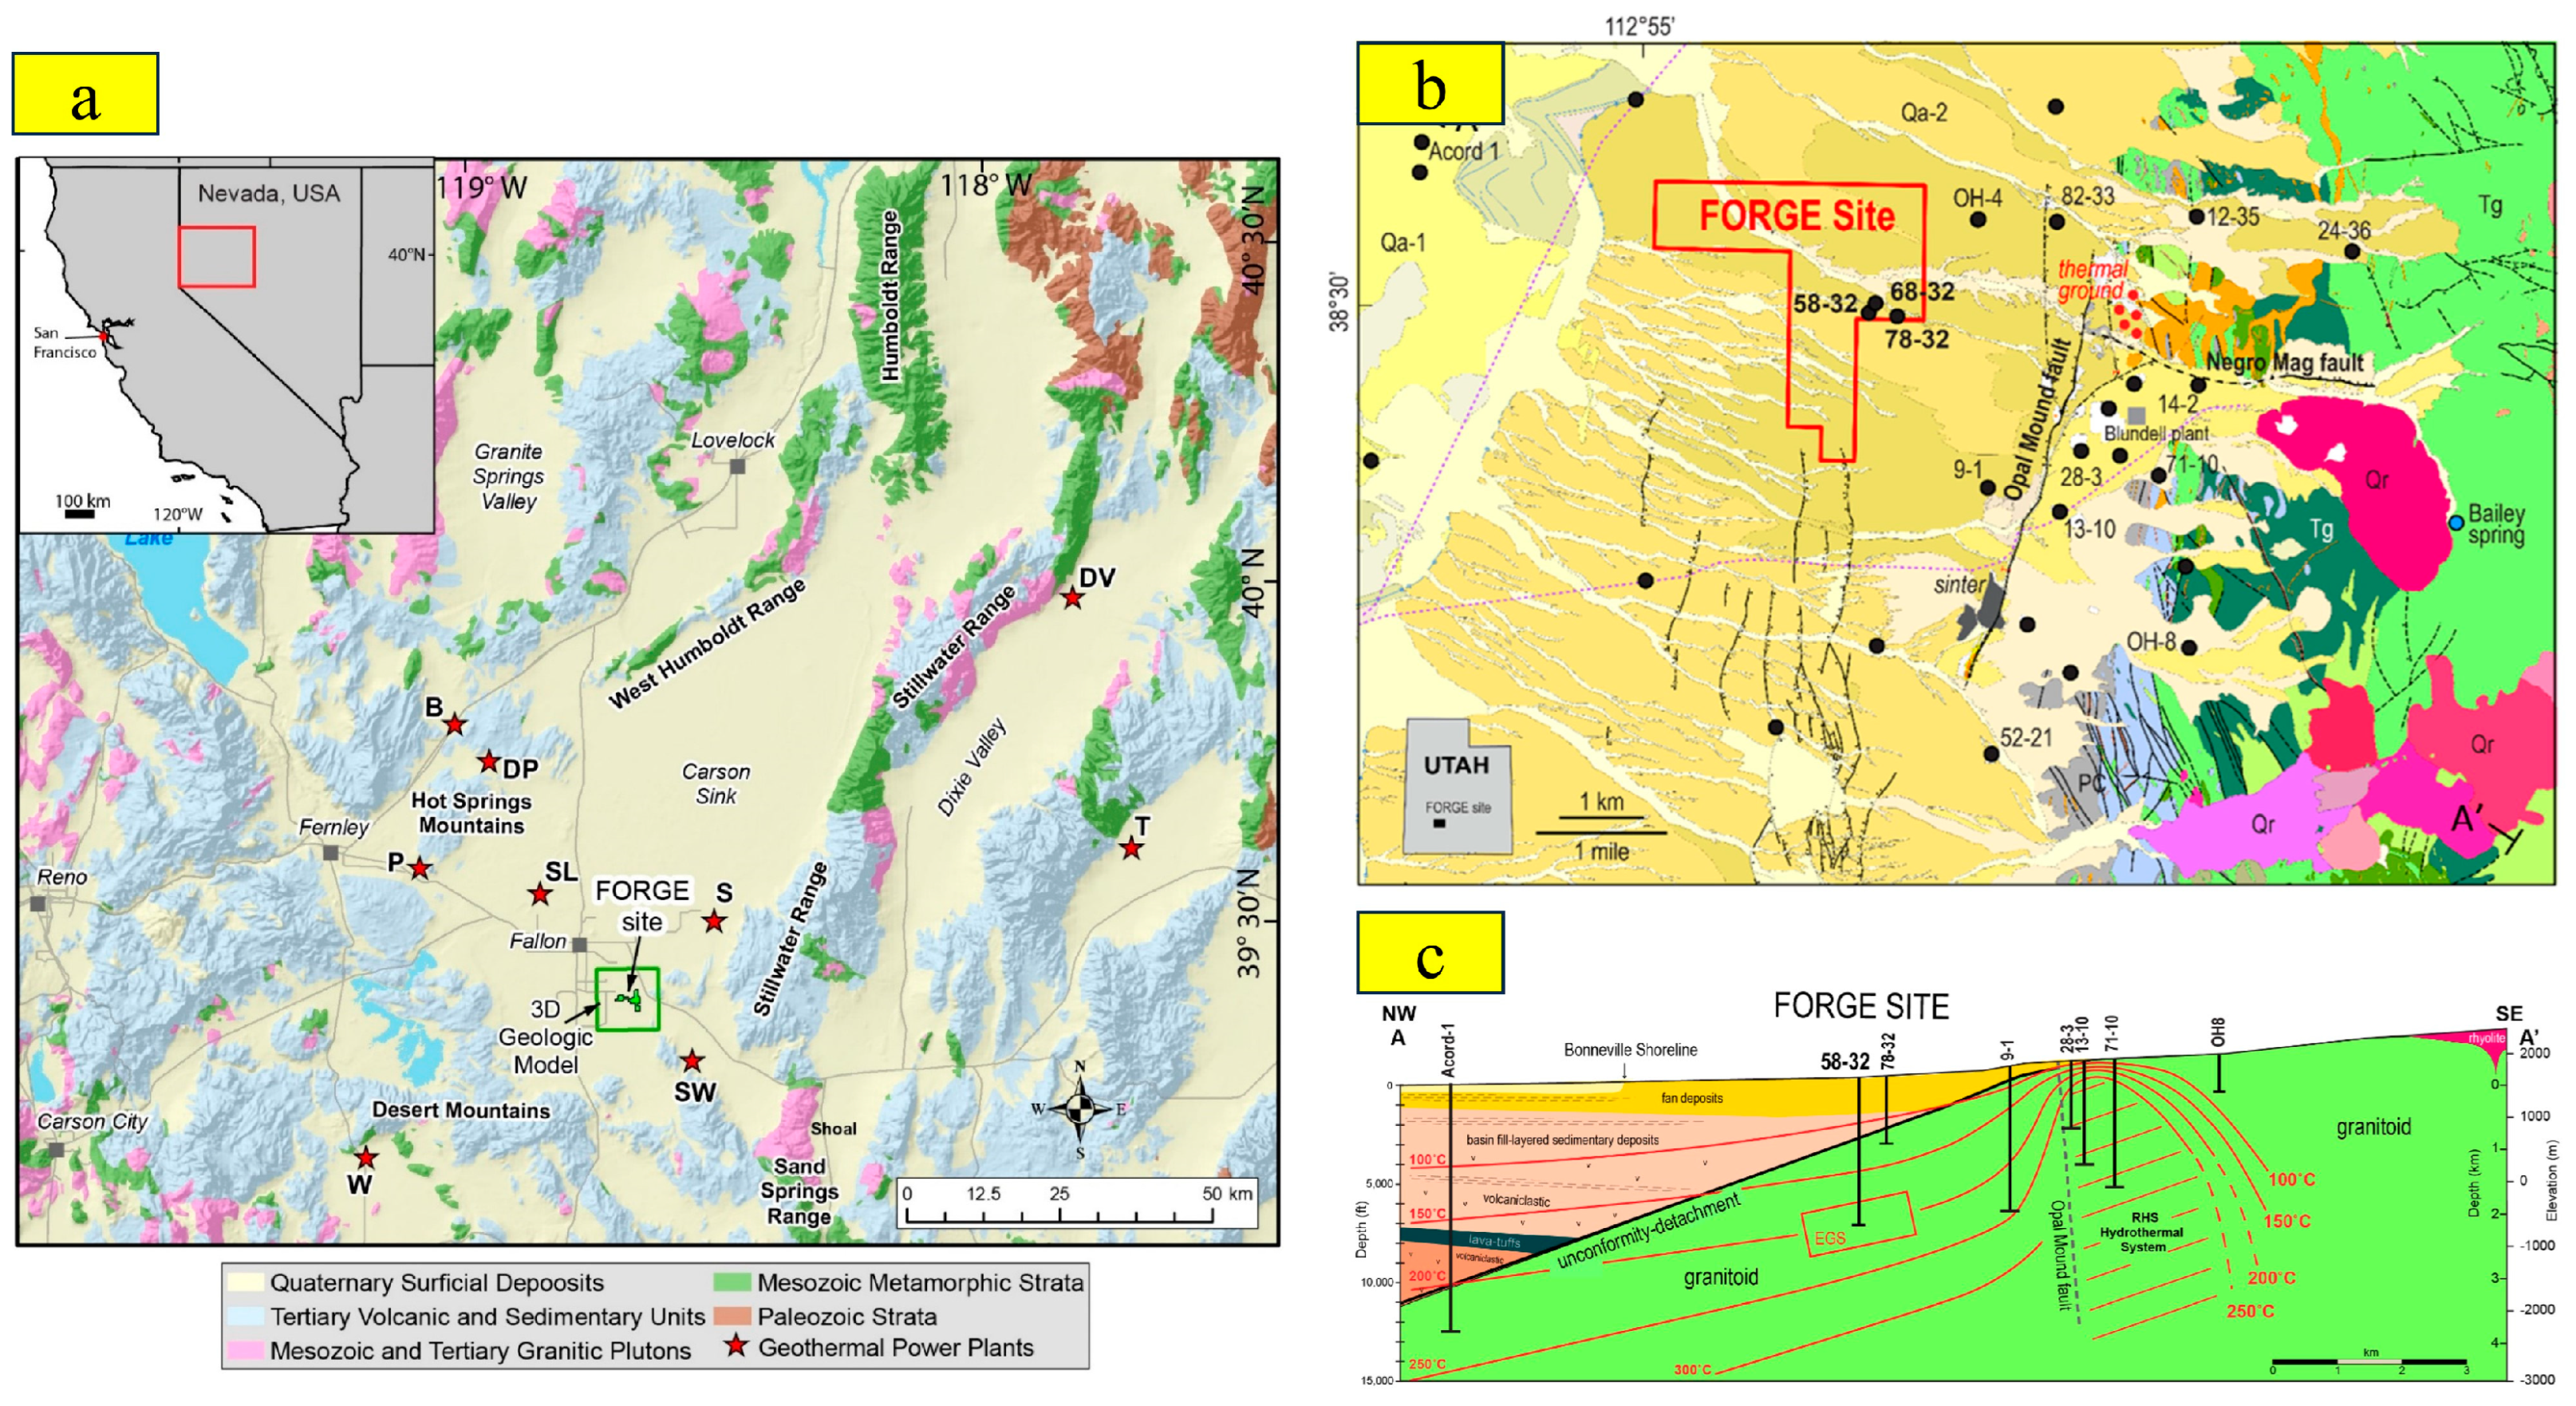
The Milford site is located in South Central Utah, 350 km from Salt Lake City and 16 km from Milford. Gravity, magneto-telluric sounding, and drilling indicate that the potential HDR reservoir is located in Mesozoic basement granite []. The HDR, which has a depth of less than 4000 m and a temperature above 175 °C, has an area of more than 1000 km2 and a volume of more than 100 km3 (Figure 1).
Figure 1.
Geological map and cross section for the Utah FORGE site based on the compilation of new field observations and well data: (a) Regional geologic map of the Carson Sink Region, showing the location of the FORGE site, (b) geological map, and (c) cross section for the FORGE Utah site.
In phase 2 of the FORGE project, drilling of well 58-32 was completed on-site. This well is one of the most important explorations on site, primarily aimed at investigating HDR reservoirs, including the detection of reservoir temperature, lithology, reservoir permeability, stress, and fracture-related conditions. The total depth of well 58-32 is 2297 m, with approximately 1300 m drilled into the granite layer. The section from 2248 to 2294 m (46 m from the well bottom) was set as the open-hole interval, while the casing was installed at other depths after completion, with perforations conducted at two intervals of 2001–2004 m and 2123–2126 m, respectively []. According to the temperature measurement results obtained after drilling, the temperature at the bottom of the well (at a depth of 2297 m) was 199 °C. Based on the Formation Micro-Imager (FMI) test results of the fractures in the wellbore, the horizontal maximum principal stress direction of the site was inferred to be NE 30°. Combined with stress tests conducted in other nearby wells, the maximum horizontal principal stress azimuth at FORGE site may be NE 25–30° [].
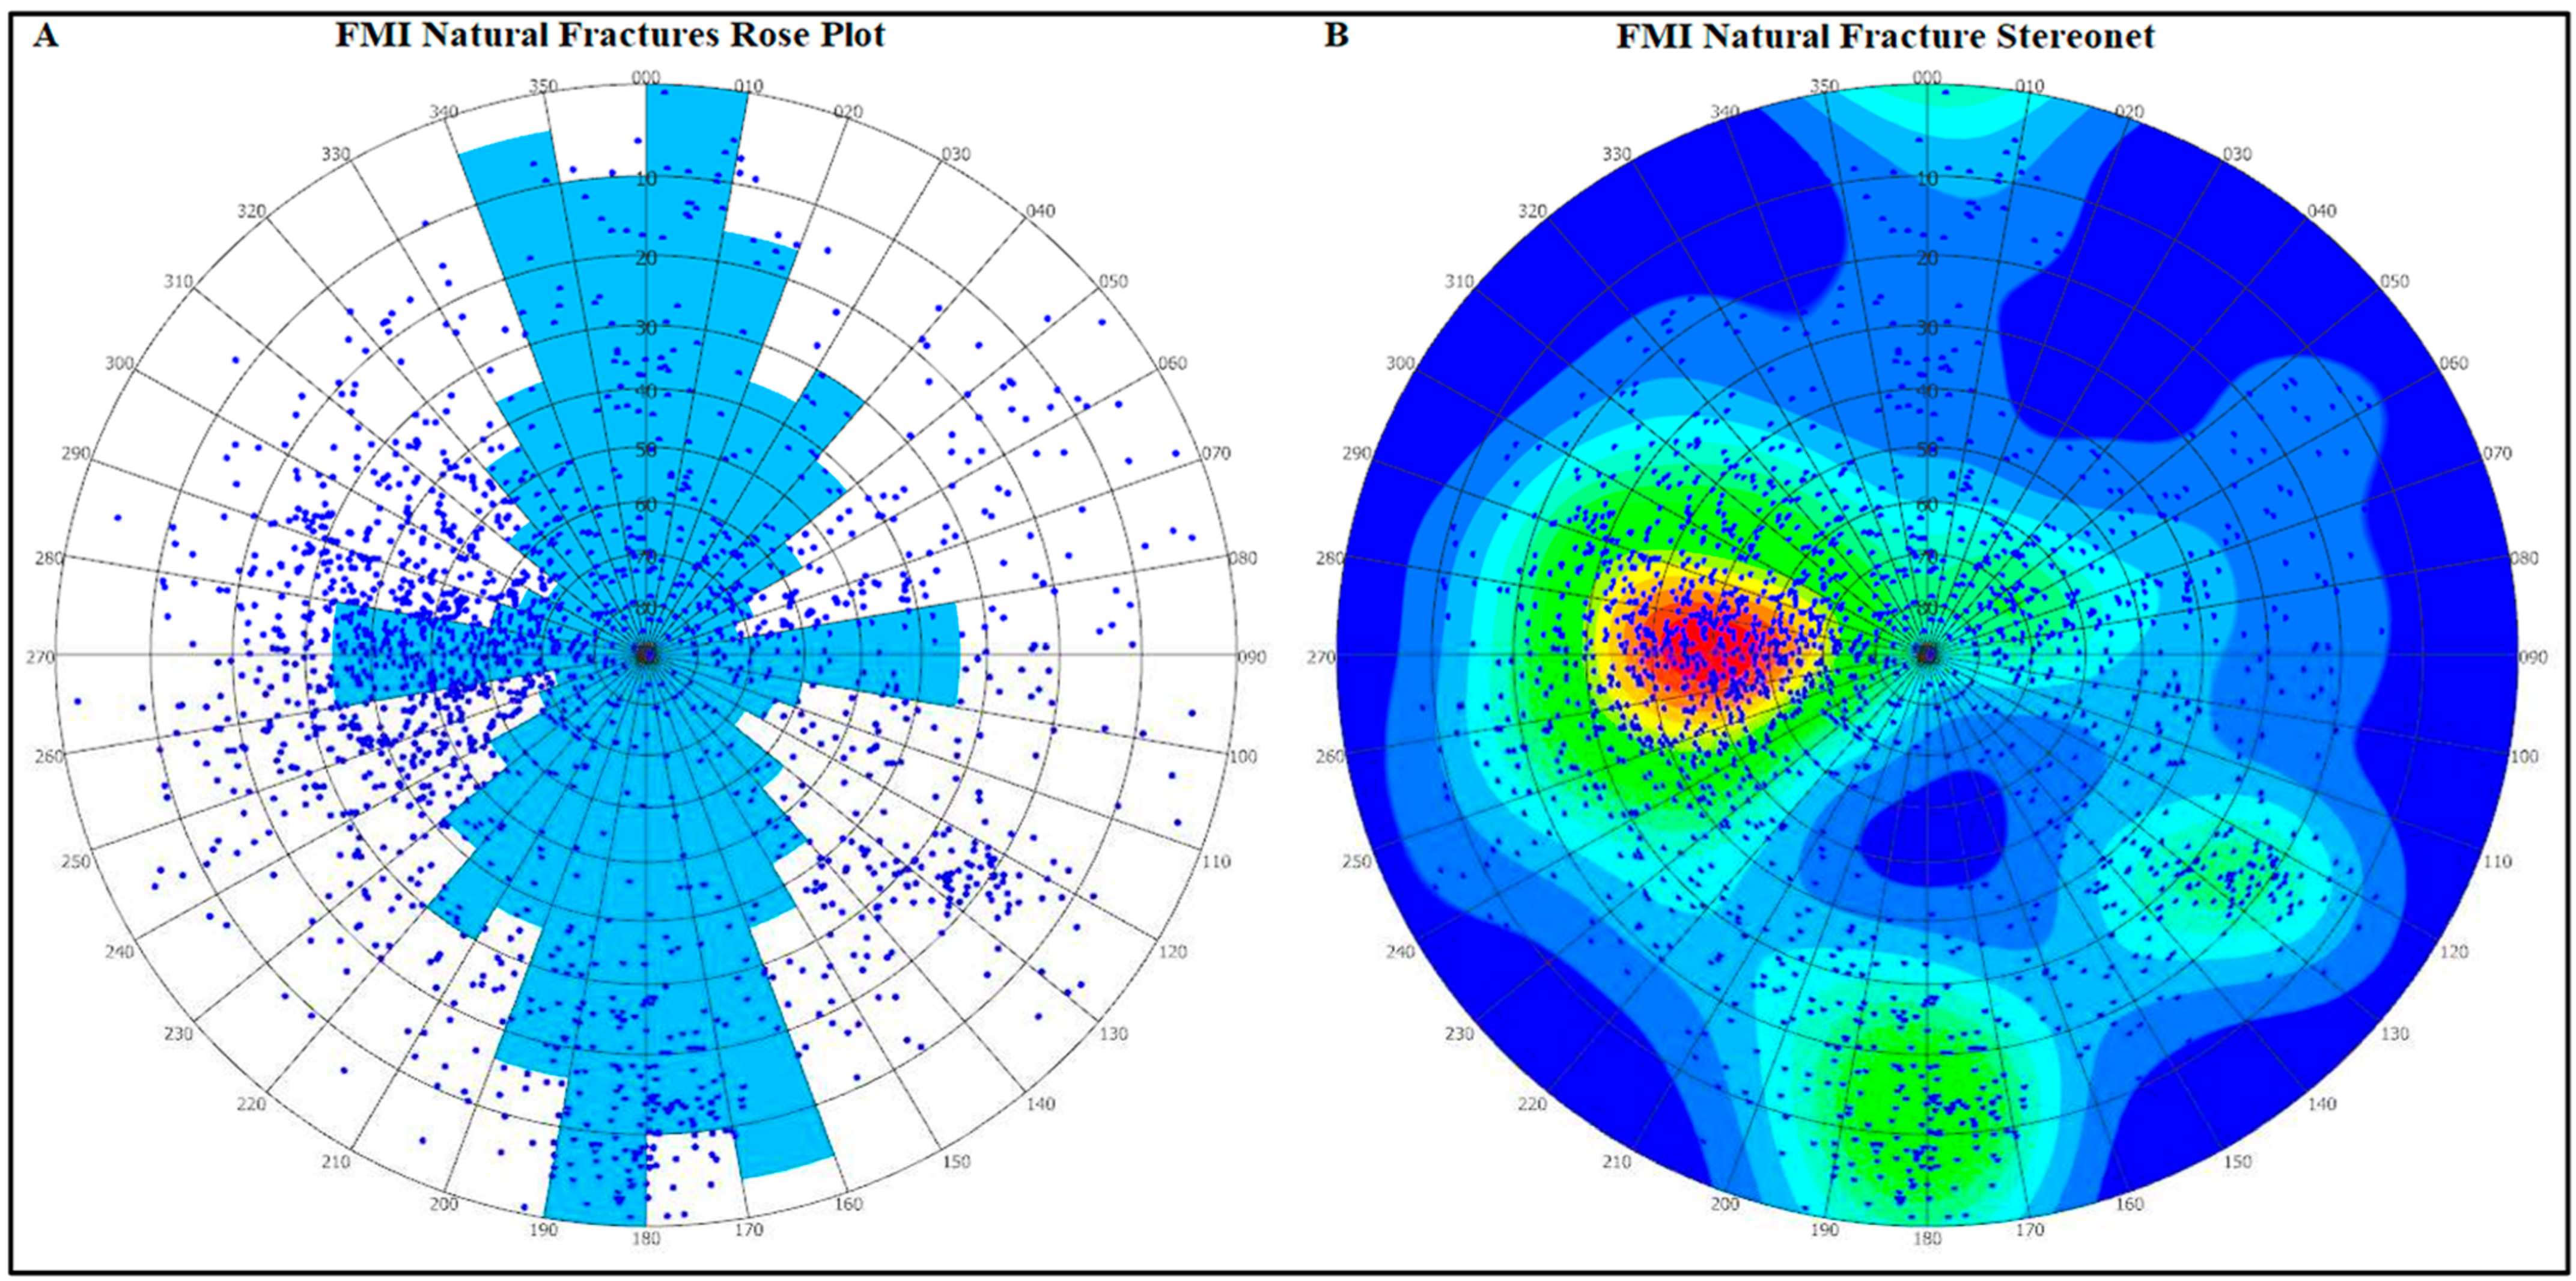
The establishment of the DFN model is the basis for fractured reservoir analysis []. In Phase 2B of the Utah FORGE Project, the FMI survey was conducted, and the fracture survey data in the 58-32 well was obtained. The survey results showed that approximately 2000 fractures were located in the wellbore, excluding fractures induced by drilling. The statistical results of fracture occurrence showed that fractures could be divided into three groups (Figure 2): N/S, E/W, and NE/SW [,]. However, in the construction of the DFN, we do not directly use the fracture data obtained from field surveys, because these results can only indicate the distribution of fractures near the geothermal wells and cannot directly determine the specific sizes of fractures within the reservoir. For the construction of the reservoir DFN, it is also necessary to supplement it with other auxiliary data.
Figure 2.
FMI survey results of Well 58-32, (a) the rose plot indicates the major dip angle and dip of the fractures; (b) three-group fractures, including N/S, E/W, and NE/SW.
In addition, fractures in the Salt Cove, Bailey Springs, Negro Mag North, and Blundell SE areas near the Milford site were investigated. The results show that the occurrence distribution of the fracture is similar to that of the FMI survey results, which also confirms the accuracy of the fracture results in the 58-32 well. The parameter fitting of the fracture occurrence data was performed. Previous studies have shown that fracture orientations at the site conform to a Fisher distribution, while fracture sizes follow a Log Normal Distribution; detailed distribution parameters are given in Table 1 []. These findings indicate that fracture networks generated using these distributions can satisfy the fracture network requirements for site fracturing analysis and ensure the accuracy [,,].
Table 1.
Fracture set generation parameters and their distributions [].
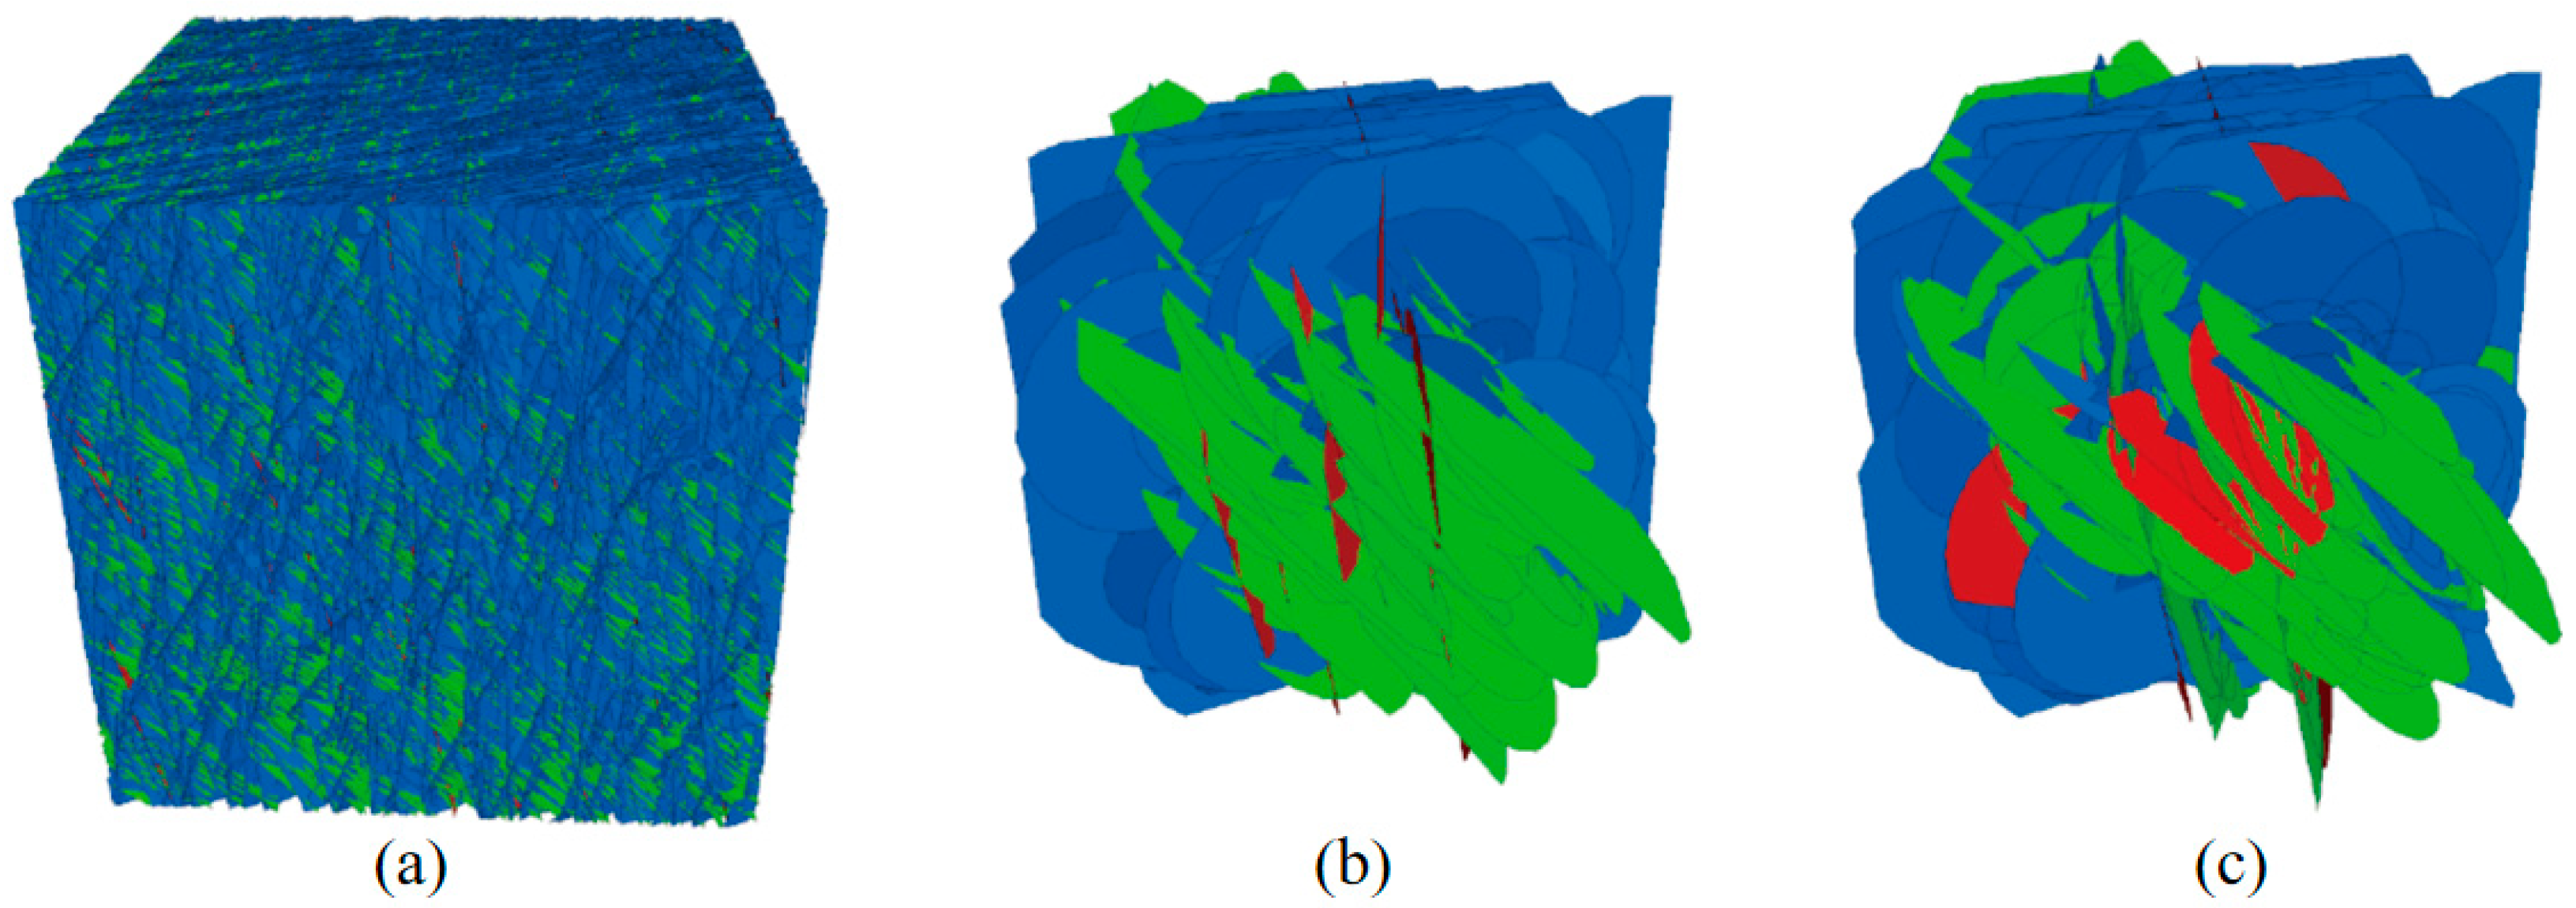
Based on the results of on-site fracture investigation and fracture statistical model, an initial DFN model was first established using Itasca 3DEC (Figure 3a). The fracture orientation follows the Fisher distribution, and the angle is randomly generated according to statistical rules; The radius distribution of the fracture conforms to the Log normal distribution, and the upper limit of the generated fracture is controlled to be the density of the three sets of fracture; In the initial DFN model, approximately 1.2 × 10⁷ fractures were created. Obviously, fractures of this order of magnitude are too numerous to build a discrete fracture media model. Therefore, the DFN model was simplified. The detailed simplification process is described in detail in Hu et al. [], and this DFN has been compared with field measured data and is feasible. This simplification operation mainly includes the analysis of fracture connectivity, removed independent fractures that are not connected to others (Figure 3b). In addition, the merging and removal of fractures with similar occurrences to ensure the feasibility of the numerical simulation calculations (Figure 3c) [].
Figure 3.
Establishment process of DFN model: (a) original DFN model generated with survey data, (b) DFN model after removing disconnect fractures, and (c) DFN model after merging fractures with similar orientations; The different colors represent cracks of different groups, with red representing NE/SW, green representing N/S, and blue representing E/W.
The simplification of fractures is based on the simplification of physical processes, and deleted fractures are those that do not affect the simulation results. This simplification is currently the most common method in DFN random generation and simulation, and it is the recommended generation method for DFN generation and application in the official 3DEC cases. After simplification, the DFN model had approximately 82,000 fractures. The establishment process of the DFN model is shown in Figure 3.
2.3. Reservoir Model Setup
Figure 4 shows the reservoir model that consists of blocks separated by fractures. The geological model is placed in a depth range of 1550 m to 3050 m below the surface. Based on the DFN, the block model of site size can be cut to form a discrete fracture media model (DFM model). The DFM model can be divided into two layers, the outer block area is 2400 × 2400 × 1500 m, and the inner layer is 600 × 600 × 500 m. Considering the setting of boundary conditions and eliminating their influence, the exterior is connected to the interior DFM region as a complete block with discontinuous displacement boundary conditions.
Figure 4.
FORGE reservoir-scale model: (a) conceptual model, (b) 3DEC model with DFN for all regions, and (c) 3DEC model for the DFN region.
The block and fracture were divided into triangular meshes with a maximum length of 15 m. The local software will automatically encrypt the grid with the minimum length 1.0 m. The discretization yields approximately 1.03 million elements, comprising 575,000 block elements and 460,000 fracture elements. The X and Y directions of the block model correspond to the maximum horizontal principal stress and minimum horizontal principal stress, respectively. The advantage of this setup is that it allows the horizontal stress field to be directly applied to the model boundaries using normal stresses, reducing the convergence issues caused by shear stresses arising from the misalignment between the stress and model directions. However, after the model was rotated, the orientation of the network also required adjustment. Under the condition that the horizontal direction of the model is set along the horizontal Max./Min. in situ stress direction, the orientation of the fracture network needs to remain due South/North. Therefore, relative to the block model, the fracture network must be rotated 60° counterclockwise before cutting the block model.
2.4. Model Parameters
The rock in the reservoir was granite with well-developed fractures, and the relevant physical parameters are listed in Table 2. Most of mechanical parameters are mainly derived from direct measurements, for example density, Young’s modulus, Poisson’s ratio. However, most of fracture properties are derived from inferred results. For the initial condition, the vertical principal stress at the top of the model was 39.5 MPa, and the following was calculated according to the gradient of 22.54 kPa/m. The maximum horizontal principal stress coefficient was 0.667 and the minimum horizontal principal stress coefficient was 0.529. The pore pressure was set according to the hydrostatic pressure. The top pressure was 15.3 MPa, and the vertical pressure gradient was 9.8 kPa/m. For the boundary conditions of the mechanical model, the periphery and bottom of the model were set as zero displacement boundaries, and the top was a fixed horizontal displacement, allowing displacement in the vertical direction.
Table 2.
Mechanical parameters, geometry, and in situ stress in the reservoir model [,,].
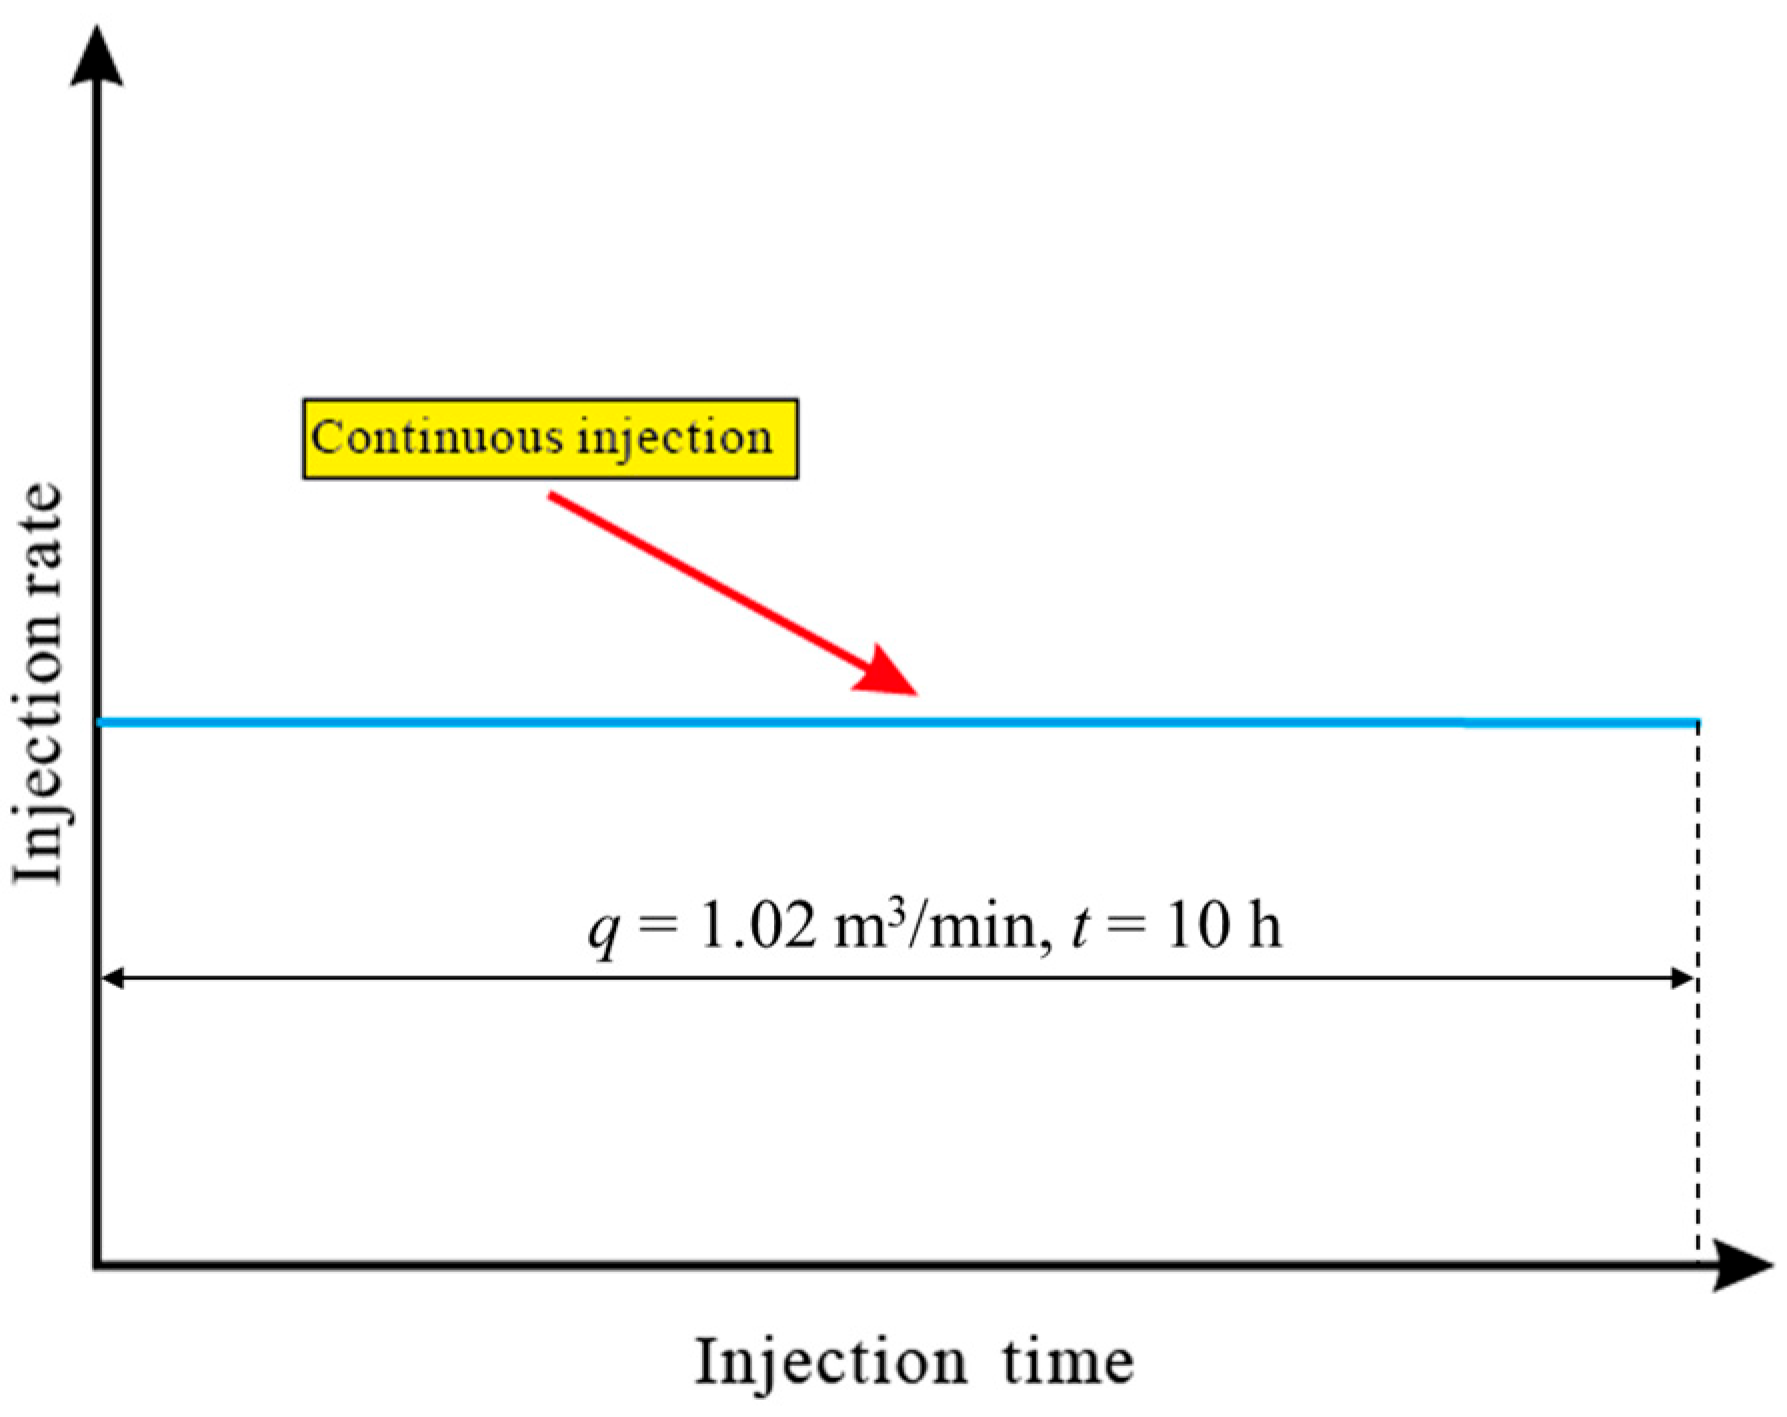
For the base case, the water was injected into the fractured reservoir with a constant injection rate (q) at 1.02 m3/min (Figure 5). The injection time (t) lasts for 10 h, resulting in a cumulative injection volume of 612 m3.
Figure 5.
The continuous injection method for the base case.
3. Simulation Results
3.1. Spatial Distribution of Microseismic Events
3.1.1. The Relationship Between Fluid Migration and Fracture Opening
In our model, fracture failures can be divided into two types. In the first case, the fluid pressure was less than the in situ stress on the fracture surface. The greater the intra-fracture fluid pressure, the smaller the friction force on the fracture and the greater the shear displacement and effective shear stress. Under these conditions, the reactivation of the fracture was dominated by shear failure. In contrast, when the fluid pressure is greater than the in situ stress on the fracture surface, the reactivation of the fracture is dominated by tensile failure, and there is no friction on the fracture surface. The fluid pressure had no effect on the effective shear stress on the fracture surface.
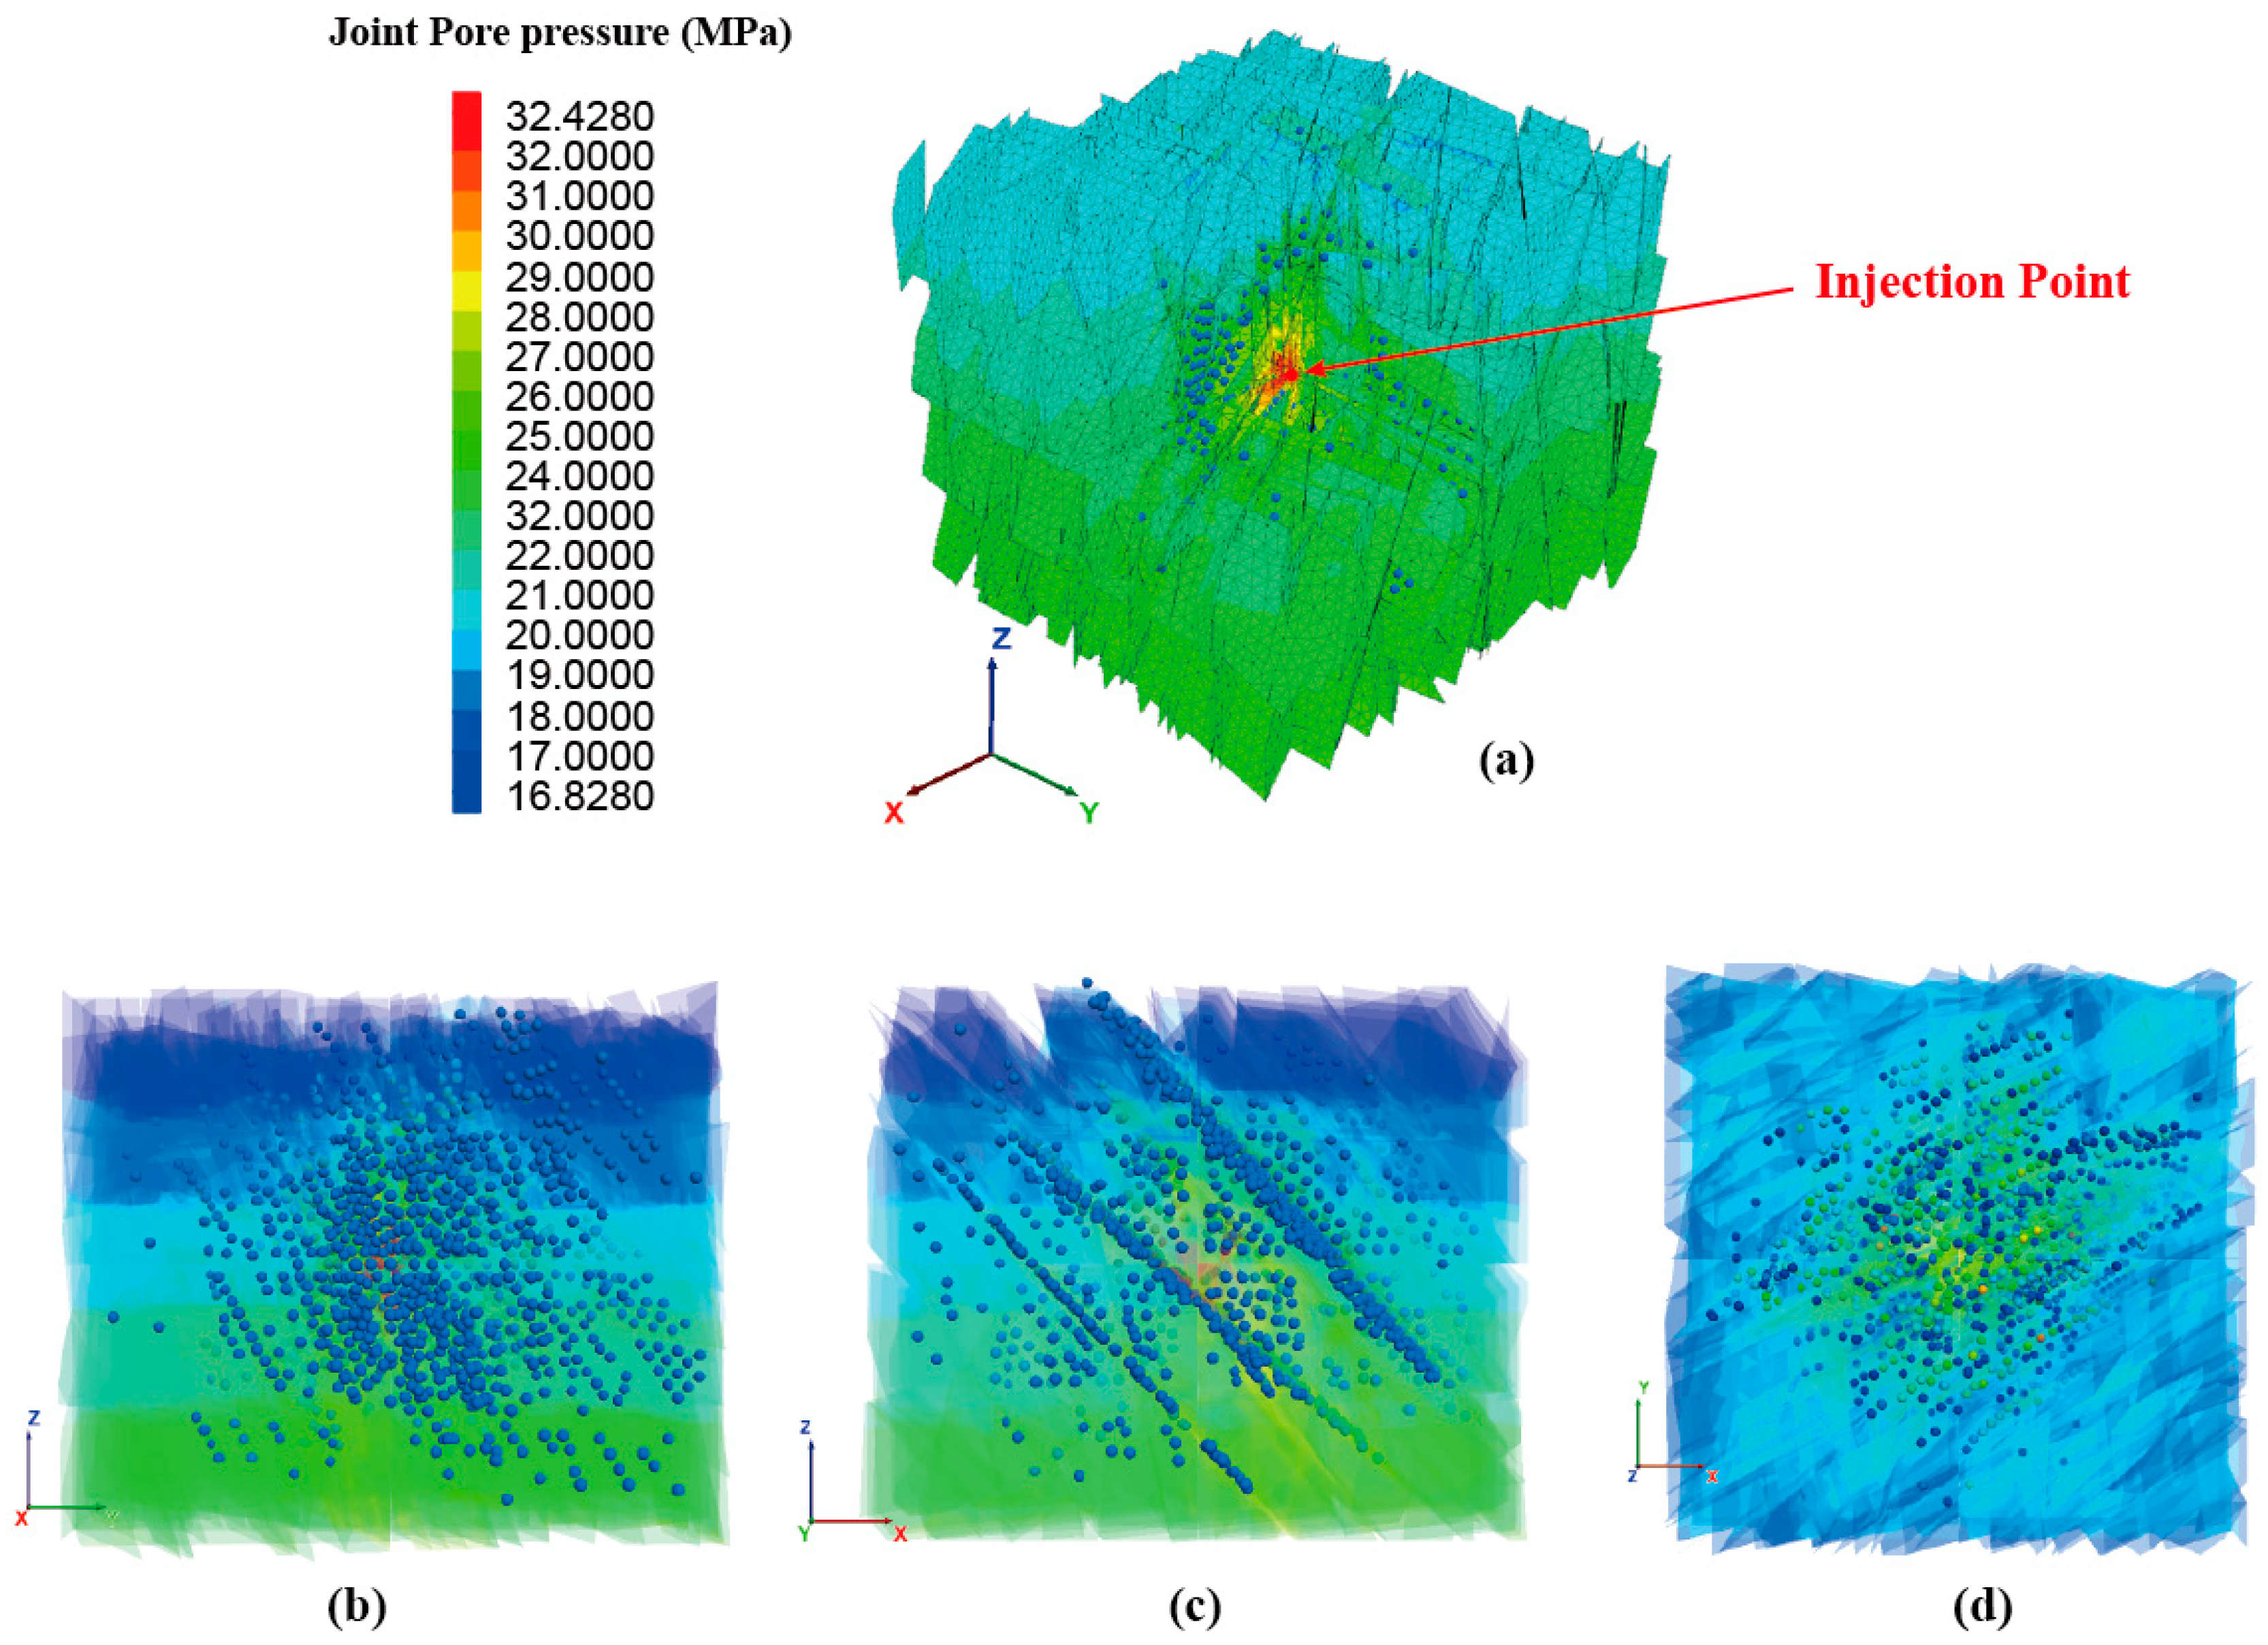
Figure 6 shows the relationship between microseismic events and fracture pore pressure. Near the injection point, the reservoir exhibits fractures, where the in situ stress acting on the fracture surface is lower than the fluid pressure. Under these conditions, fracture reactivation was dominated by tensile failure mechanisms. Consequently, the fluid pressure did not influence the effective shear stress on the fracture surface, resulting in no observable concentration of microseismic events.
Figure 6.
Relationship between microseismic events and fracture pore pressure after continuous injection for 10 h. (a) Three-dimensional distribution of microseismic events, (b) 2D section in the Y-Z direction, (c) 2D section in the X-Z direction, and (d) 2D section in the X-Y direction.
In contrast, fractures within the distal regions of the reservoir exhibited a pronounced correlation between the microseismic event density and fluid pressure distribution. At these distances, the fluid pressure remains insufficient to overcome the fracture closure stress and eliminate the frictional resistance along the fracture surfaces. Consequently, elevated fluid pressure directly increases the effective shear stress and promotes shear failure. This mechanism results in a positive relationship, where higher fluid pressures correlate with increased shear stress magnitude and a greater spatial concentration of microseismic events.
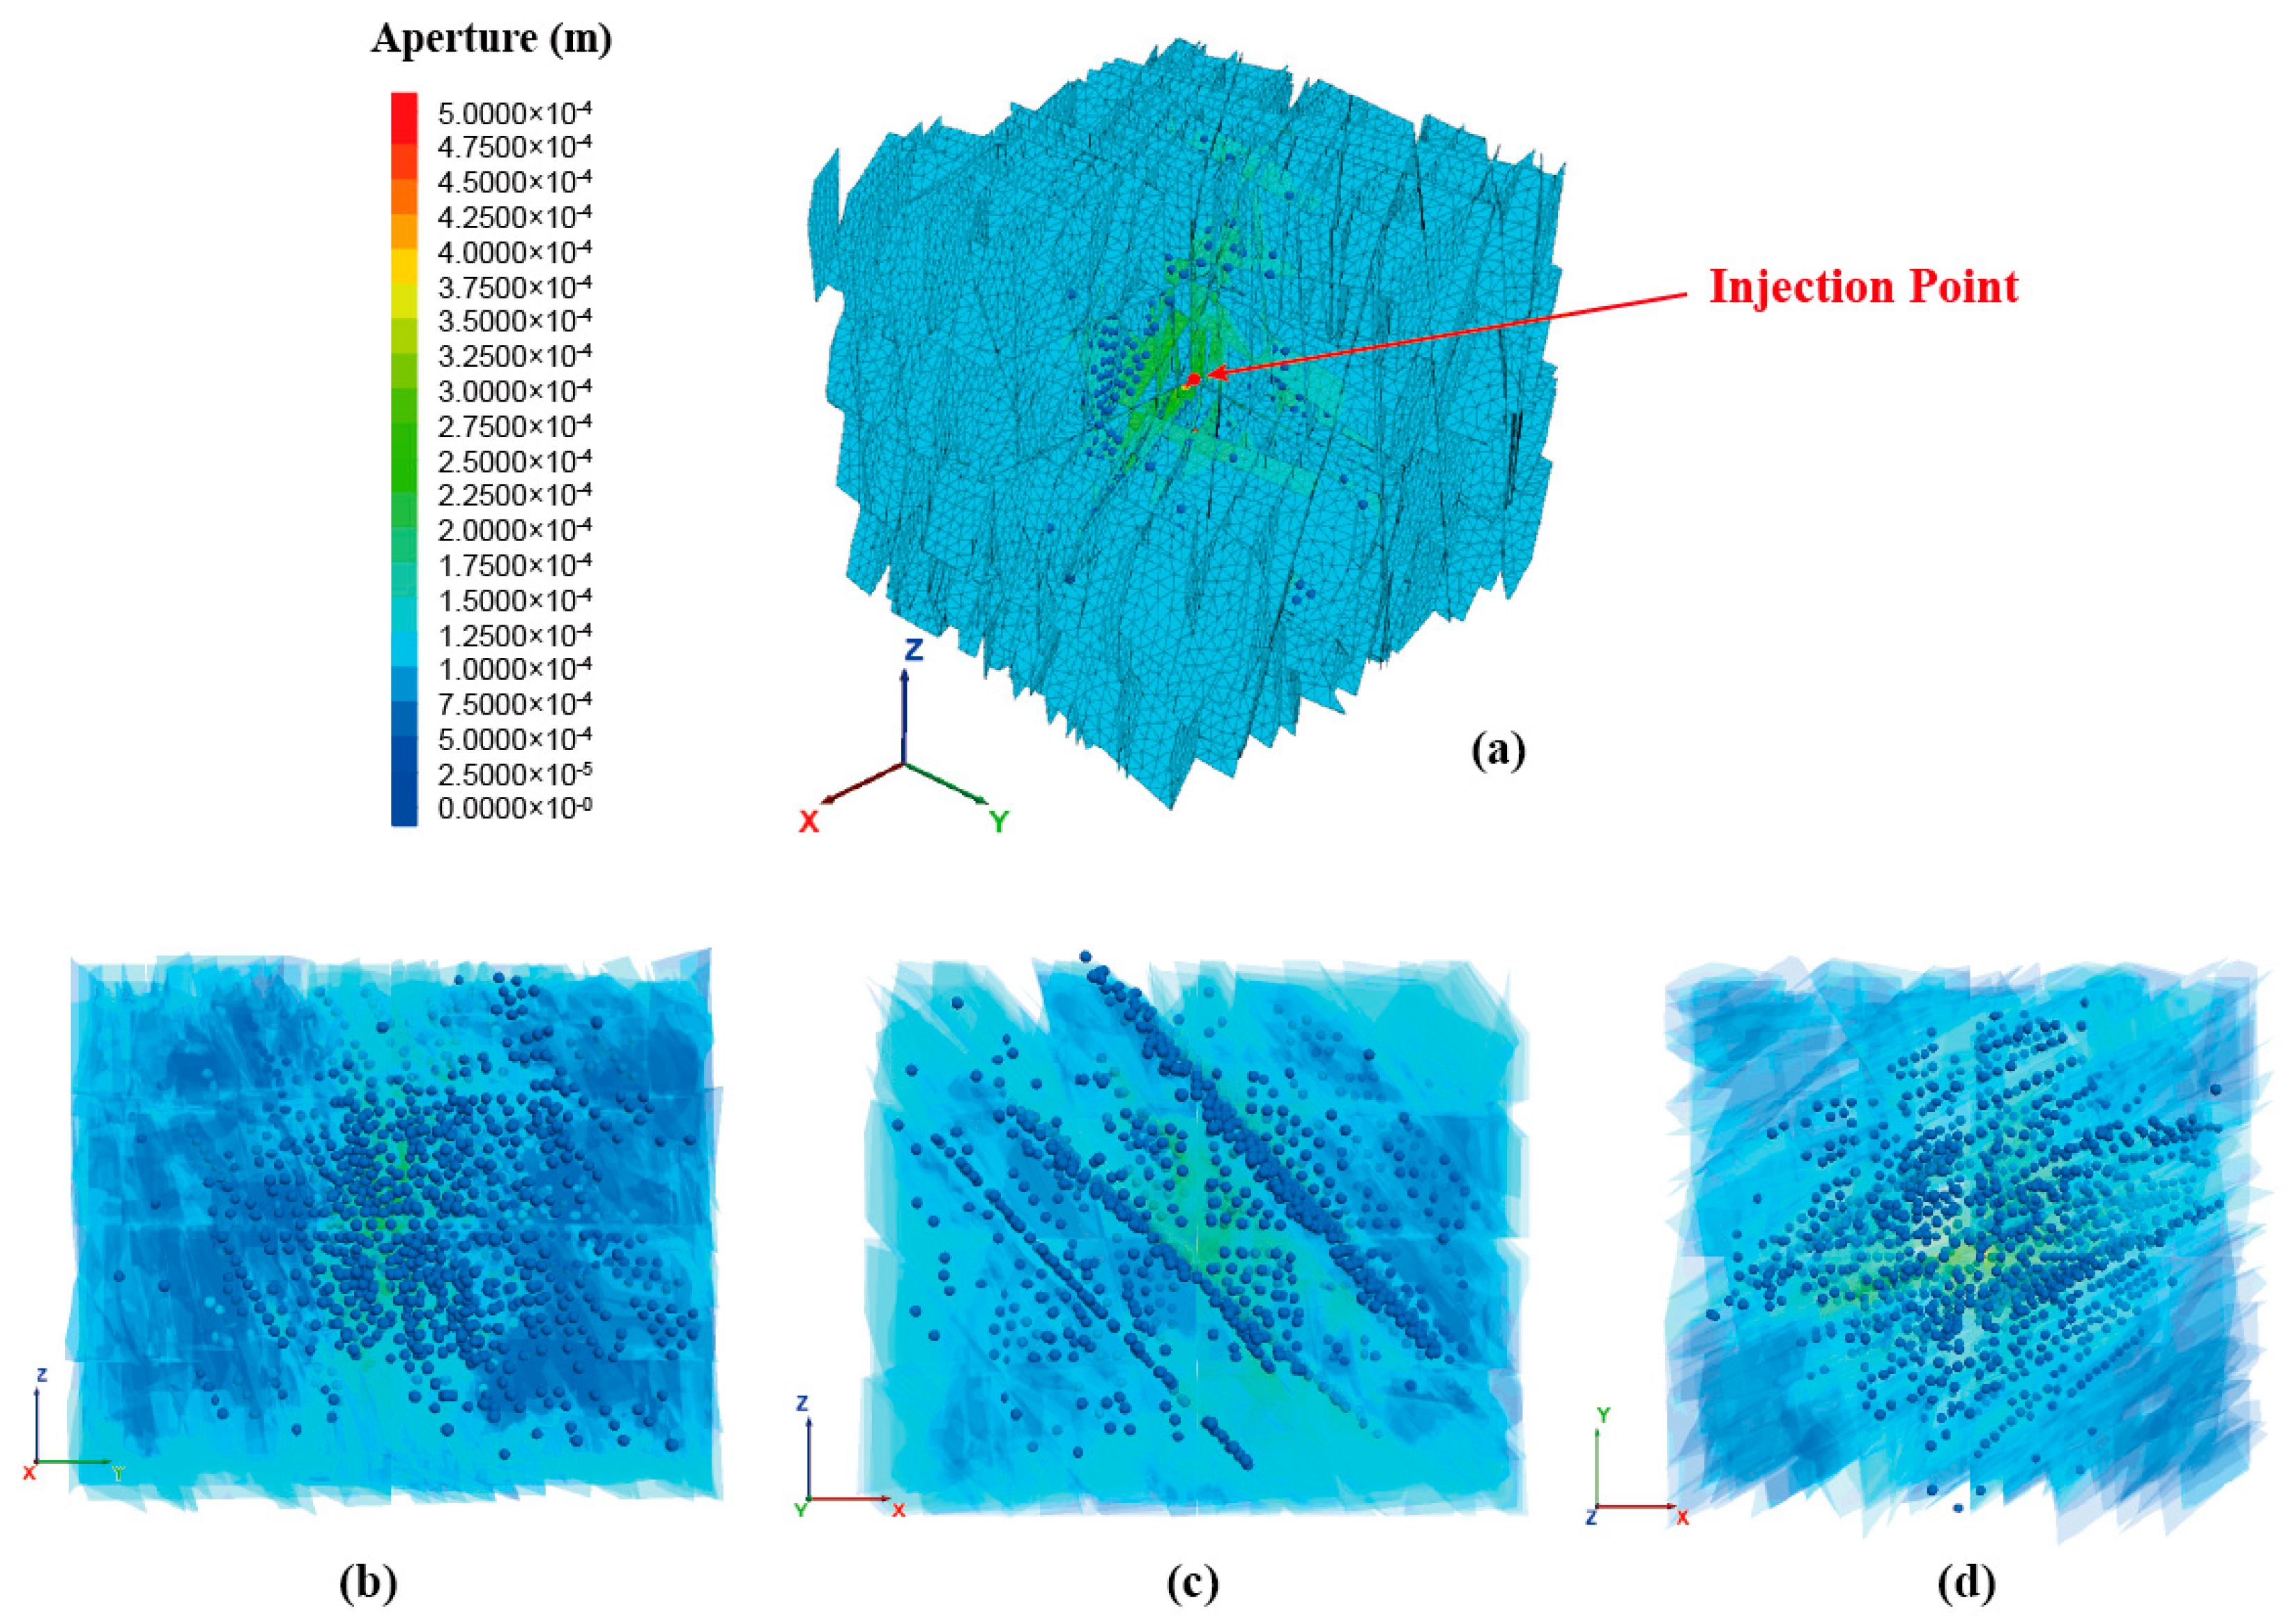
Analysis of the fracture aperture distribution revealed a negligible correlation with the microseismic event locations (Figure 7). Proximal to the injection point, where the in situ stress acting on the fracture surfaces is lower than the fluid pressure, the aperture changes are predominantly governed by tensile failure mechanisms. This failure mode minimally perturbs the effective shear stress on fractures, resulting in a poor spatial correspondence with microseismic activity. Conversely, in distal regions, aperture alterations were primarily attributed to shear failure in regions far away from the injection point. Within these zones, microseismic events exhibited a strong spatial correlation with regions of significant aperture changes (Figure 7).
Figure 7.
Relationship between microseismic events and fracture aperture after continuous injection for 10 h. (a) Three-dimensional distribution of microseismic events, (b) 2D section in the Y-Z direction, (c) 2D section in the X-Z direction, and (d) 2D section in the X-Y direction.
3.1.2. The Relationship with the Azimuth of Natural Fractures
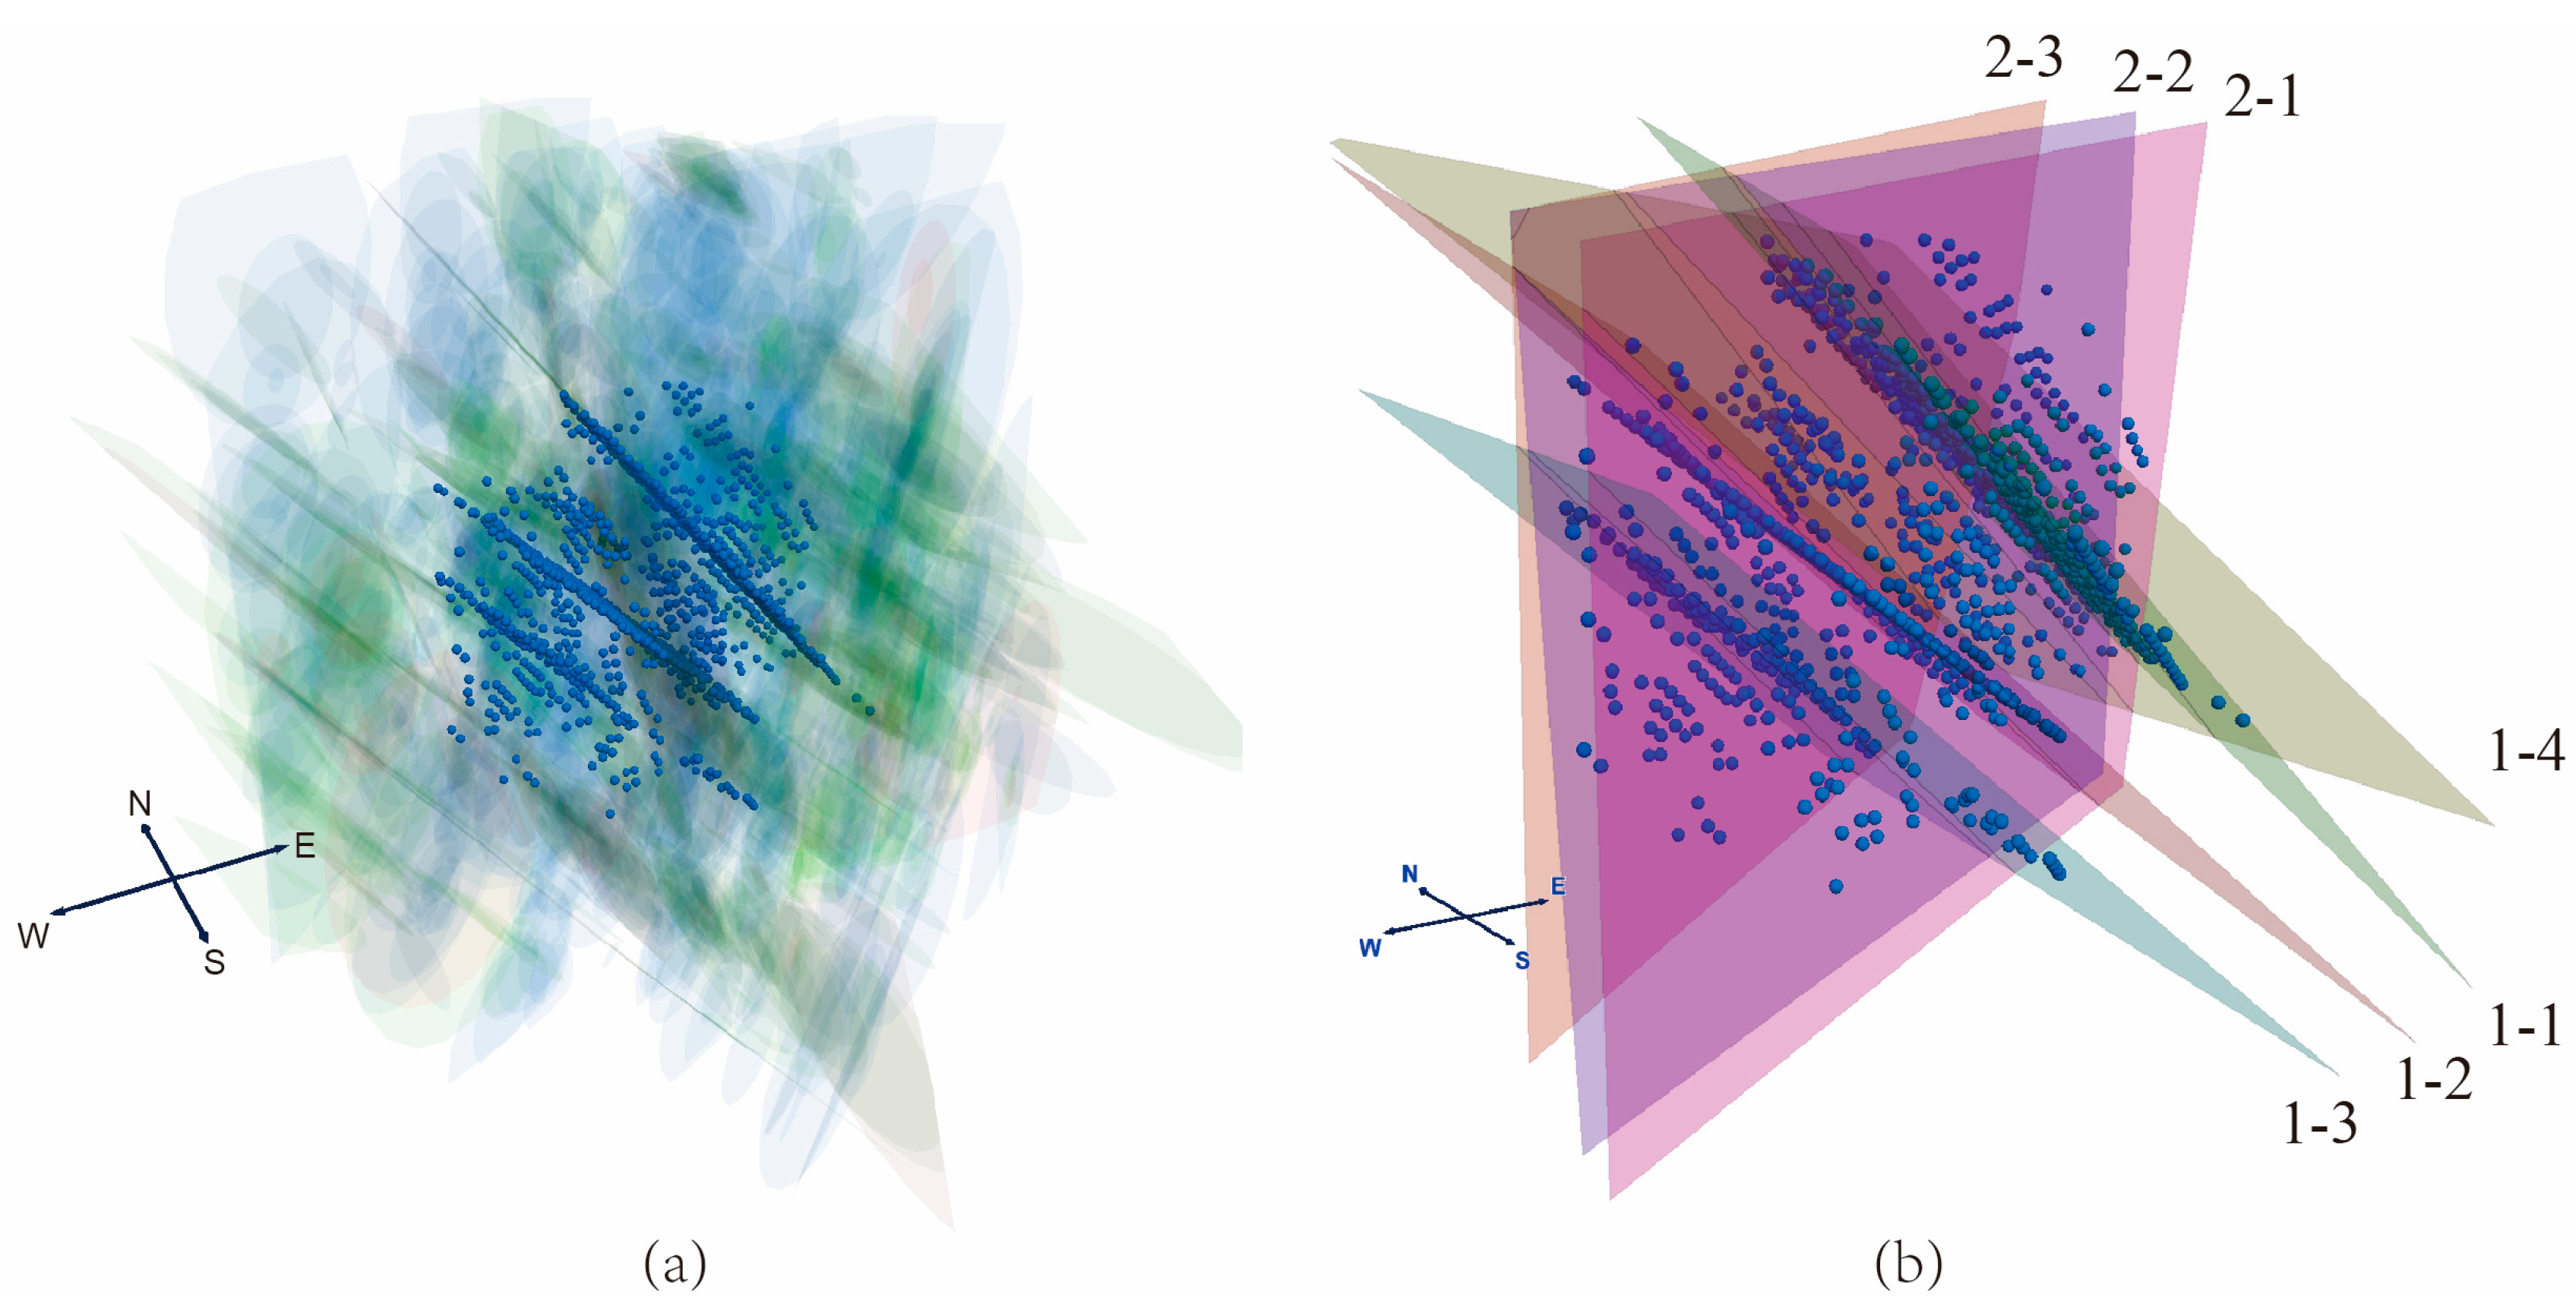
To capture the spatial distribution of microseismic events further, the spatial distribution of all microseismic events induced by fracturing was fitted by planarization (Figure 8). The related information of microseismic plane (MP) is given in Table 3.
Figure 8.
The spatial distribution of microseismic events (10 h): (a) the microseismic event after the fracturing (background is the DFN fracture), (b) diagram of the 7 planes obtained by planarization.
Table 3.
Spatial distribution of microseismic events by planarization.
The distribution of microseismic events was not gradually generated in the fractures in any direction along the injection point. Conversely, it is concentrated on certain fractures, which are mainly distributed on seven planes (Figure 8). The seven planes can be divided into two groups according to the occurrence characteristics of the microseismic events. Group 1 had four planes, and Group 2 included three planes. The dip angles of group 1 are all approximately 45°, and the distribution of the dip angle is relatively scattered, ranging from 70° to 102°. The dip angles of Group 2 were mainly concentrated from 81° to 89°, and the dip angle was mainly distributed near −20° (approximately −60° with the maximum horizontal principal stress) (Table 3).
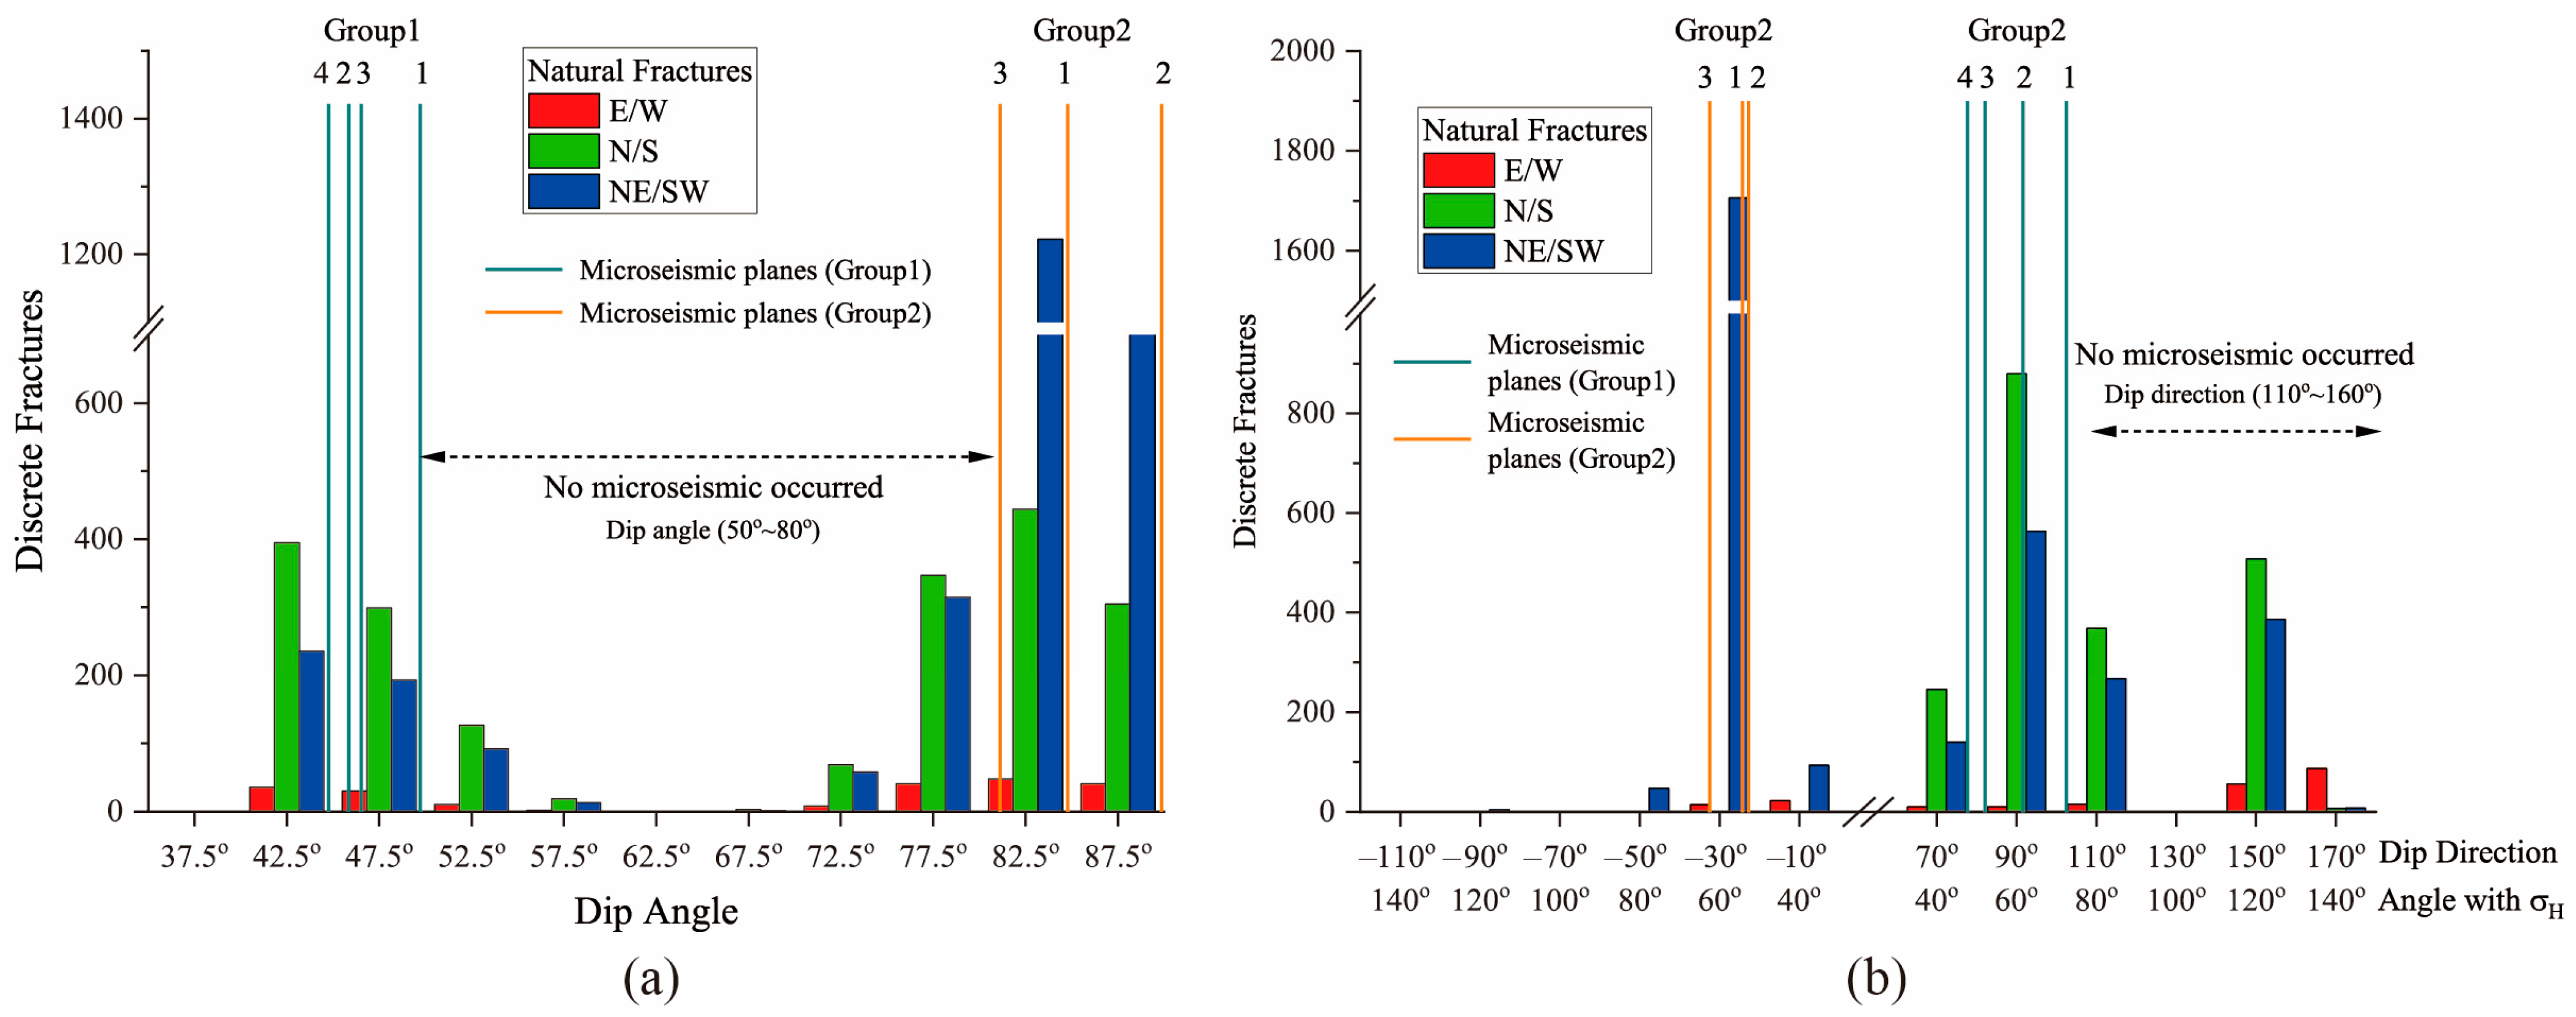
The distributions of the dip angles and direction of all fractures in DFN and the positions of 7 planes are shown in Figure 9. It can be found that no microseismic event occurred in the dense fracture group with a dip angle of 70–80° and a dip angle of 140–160° in the DFN. Alternatively, the relatively low-density fracture group with a dip angle of 45–50° concentrated all microseismic events in the first group. This implies that the concentration of microseismic events does not completely depend on the density of fractures, which is mainly affected by the occurrence of natural fractures.
Figure 9.
The distribution of (a) dip angles and (b) dip angle of all fractures in the DFN and lead lines show the positions of the seven planes; The numbers in the Natural Fracture Group represent the index corresponding to the microseismic planes in Table 3.
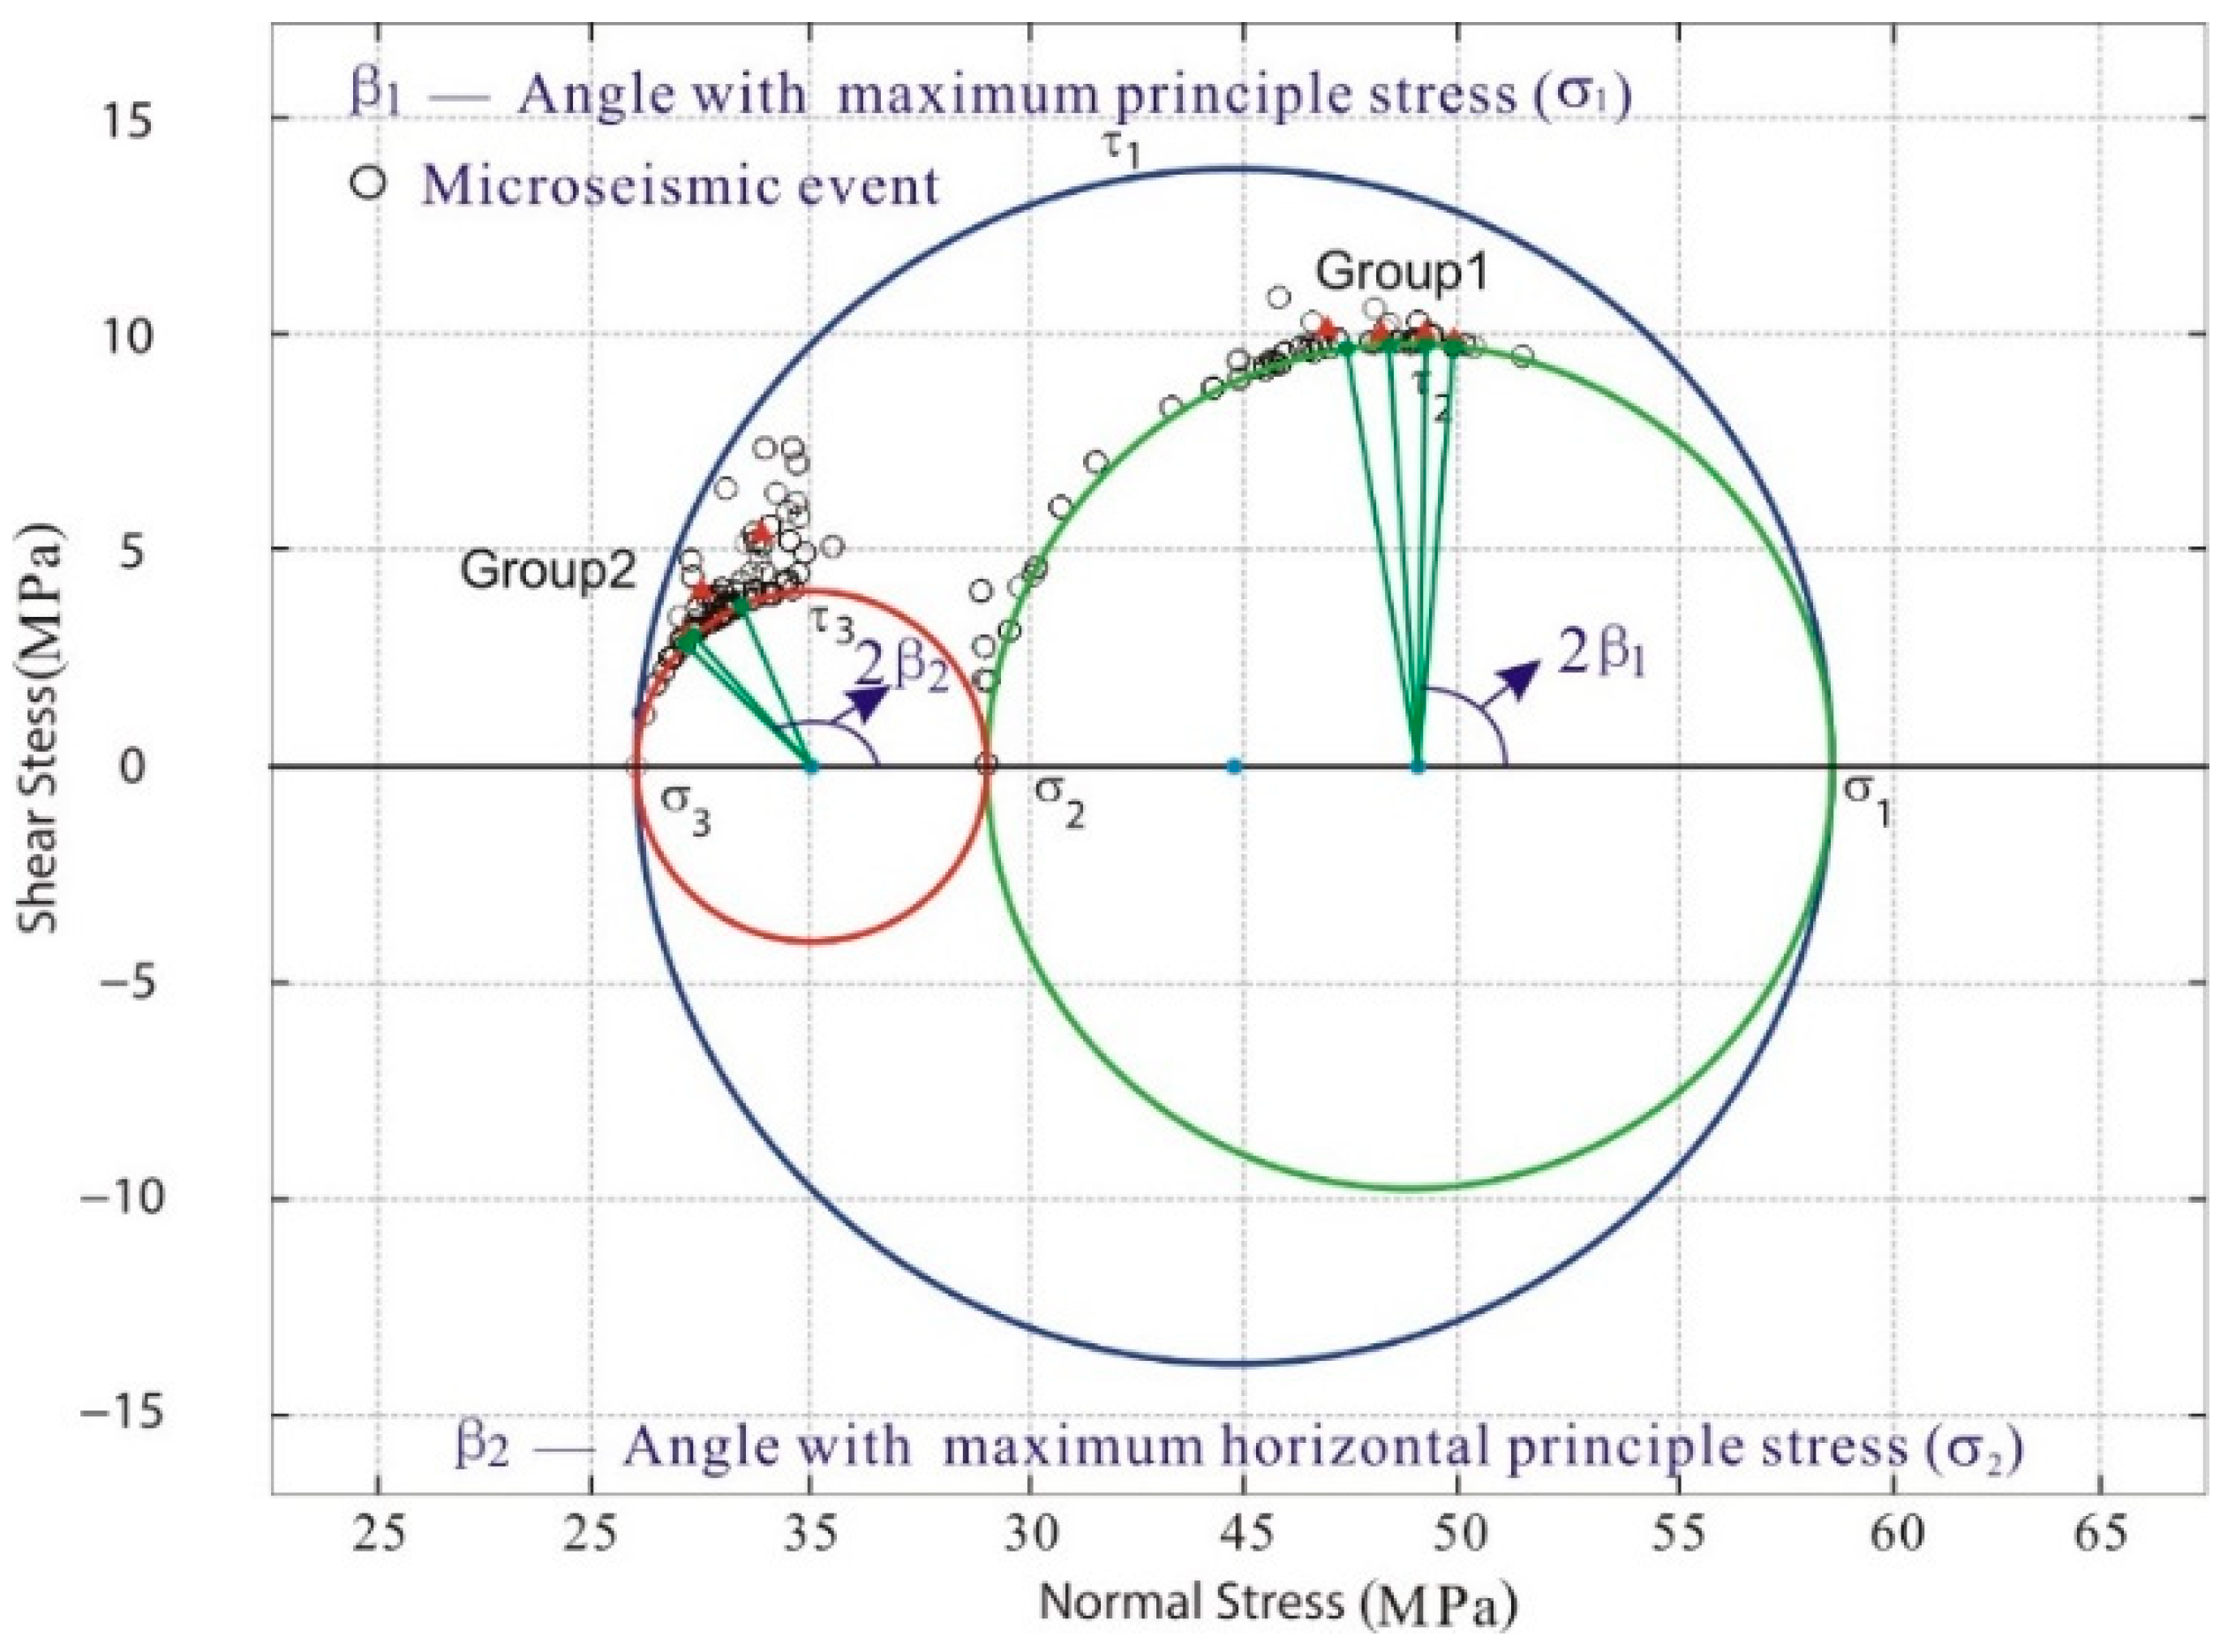
Considering that both the stratum and fractures are in a three-dimensional (3D) stress state, the 3D Mohr circle was applied to further analyze the relationship between the stress on the fractures and the induced microseisms (Figure 10). The 3D Mohr circle is used to analyze the spatial stress state under three-dimensional stress conditions, and can be combined with the Mohr-Coulomb criterion to analyze whether materials will fail under the current stress state (the combination of normal stress and shear stress on the fracture surface). If the stress state is close to the boundary of three circles at a point in the diagram, then this point tends to fail. The stress analysis diagram shows that the fractures that induce microseismic accumulation can be roughly divided into two groups: the fractures at an angle of 45° to the direction of the maximum principal stress (σ1) (Group 1); the other is the group of the fractures with an angle close to 60° with the maximum horizontal principal stress (σ2) (Group 2). These results are consistent with the analysis of the microseismic plane by planarization (Figure 8).
Figure 10.
Relationship between stress on fracture and induced microseisms based on 3D Mohr circle.
Stress analysis indicated that the microseismic plane distribution was primarily controlled by fracture orientation. According to the principles of solid mechanics, fractures oriented approximately 45° to the maximum principal stress experience elevated shear stress under high differential stress conditions. Given that microseismic events predominantly result from shear failure along fractures, planes subjected to higher shear stresses exhibit both an increased event frequency and magnitude. Consequently, a distinct cluster of microseismic planes (Group 1) developed near the 45° dip angle orientation relative to the maximum principal stress (Figure 10), which was consistent with the Coulomb failure criteria.
The microseismic planes designated as Group 2 predominantly align with NE/SW-striking fractures (30° dip angle). A plane with an angle close to 45° with the principal stress is subjected to high shear stress. Therefore, in the orientation close to 45°, the NE/SW group (60° with the maximum horizontal principal stress) was prone to large microseisms (Figure 10). In addition, rather than being evenly distributed on all the fractures, the fractures that were distributed at 45° from the direction of the maximum principal stress, or at 45° from the principal stress, were more likely to produce a concentration of microseismic events.
3.2. Evolution of Microseismic Events with Time
3.2.1. Microseismic Magnitude
Analysis of the microseismic event frequency and maximum magnitude (Figure 11) revealed a progressive increase in the relative proportion of higher magnitude events as fracturing advanced. Concurrently, the power-law distribution of event magnitudes became increasingly pronounced (Figure 11a). The simulation results indicate a maximum magnitude of approximately Mw 0.27 (Mwg −0.57), which is consistent with the field-measured result (~Mw 0.3) [], demonstrating that the model developed in this study corresponds to the actual site conditions. Furthermore, the maximum magnitude of the microseismic events progressively increased during the fracture propagation (Figure 11b). This is mainly because the fluid pressure in a certain group of fractures that tends to induce microseismic events gradually increases with the progress of the fracturing injection. Elevated pressure enhances the effective shear stress along these fractures, amplifying the shear failure energy, and consequently generating higher-magnitude events.
Figure 11.
Results of microseismic magnitude: (a) Magnitude frequency distribution histogram and (b) maximum magnitude statistical results of microseismic events after fracturing for 1 h, 5 h and 10 h.
To test this hypothesis, we analyzed the spatial distributions of peak-magnitude events. Table 4 demonstrates that maximum-magnitude seismicity during both the 2–5 h and 6–10 h injection intervals occurred at persistent spatial locations. Furthermore, the event magnitudes at these locations progressively increased with injection duration. These findings collectively demonstrate that maximum-magnitude seismicity only occurs in specific fractures, and its magnitude gradually increases with an increase in fluid pressure.
Table 4.
Statistical results of the location of microseismic event with the largest magnitude, and the location of injection point is (0, 0, 0).
3.2.2. Microseismic Distribution
Figure 12 shows the evolution of microseismic events on each plane during the fracturing process over time. In the early stage, a large number of microseismic events occurred only in the fracture group near the injection point (planes 1-2). Subsequently, as the fluid gradually migrated outward, microseismic events began to be gradually generated in the other fracture zones. These results demonstrate that the spatial evolution of microseismic events on the identified failure planes was predominantly controlled by fluid migration pathways. Specifically, planes receiving an active fluid influx exhibited substantially higher microseismic event densities.
Figure 12.
Evolution of spatial distribution of microseismic events over time. (The upper and lower rows of the same column are the data at the same time, but the angles of observation are different).
It is worth noting that the microseismic events are only concentrated on the natural fractures where the hydraulic shear failure occurs, but the microseismic events contributed by the hydraulic tension failure are not obvious. Consequently, estimating stimulated fracture networks solely from microseismic spatial distributions systematically underestimates total fracture activation. This approach may overlook substantial fluid-conductive pathways, potentially compromising reservoir development strategies through inadequate characterization of the created fracture system.
3.3. Distribution of Microseismic Events Magnitude
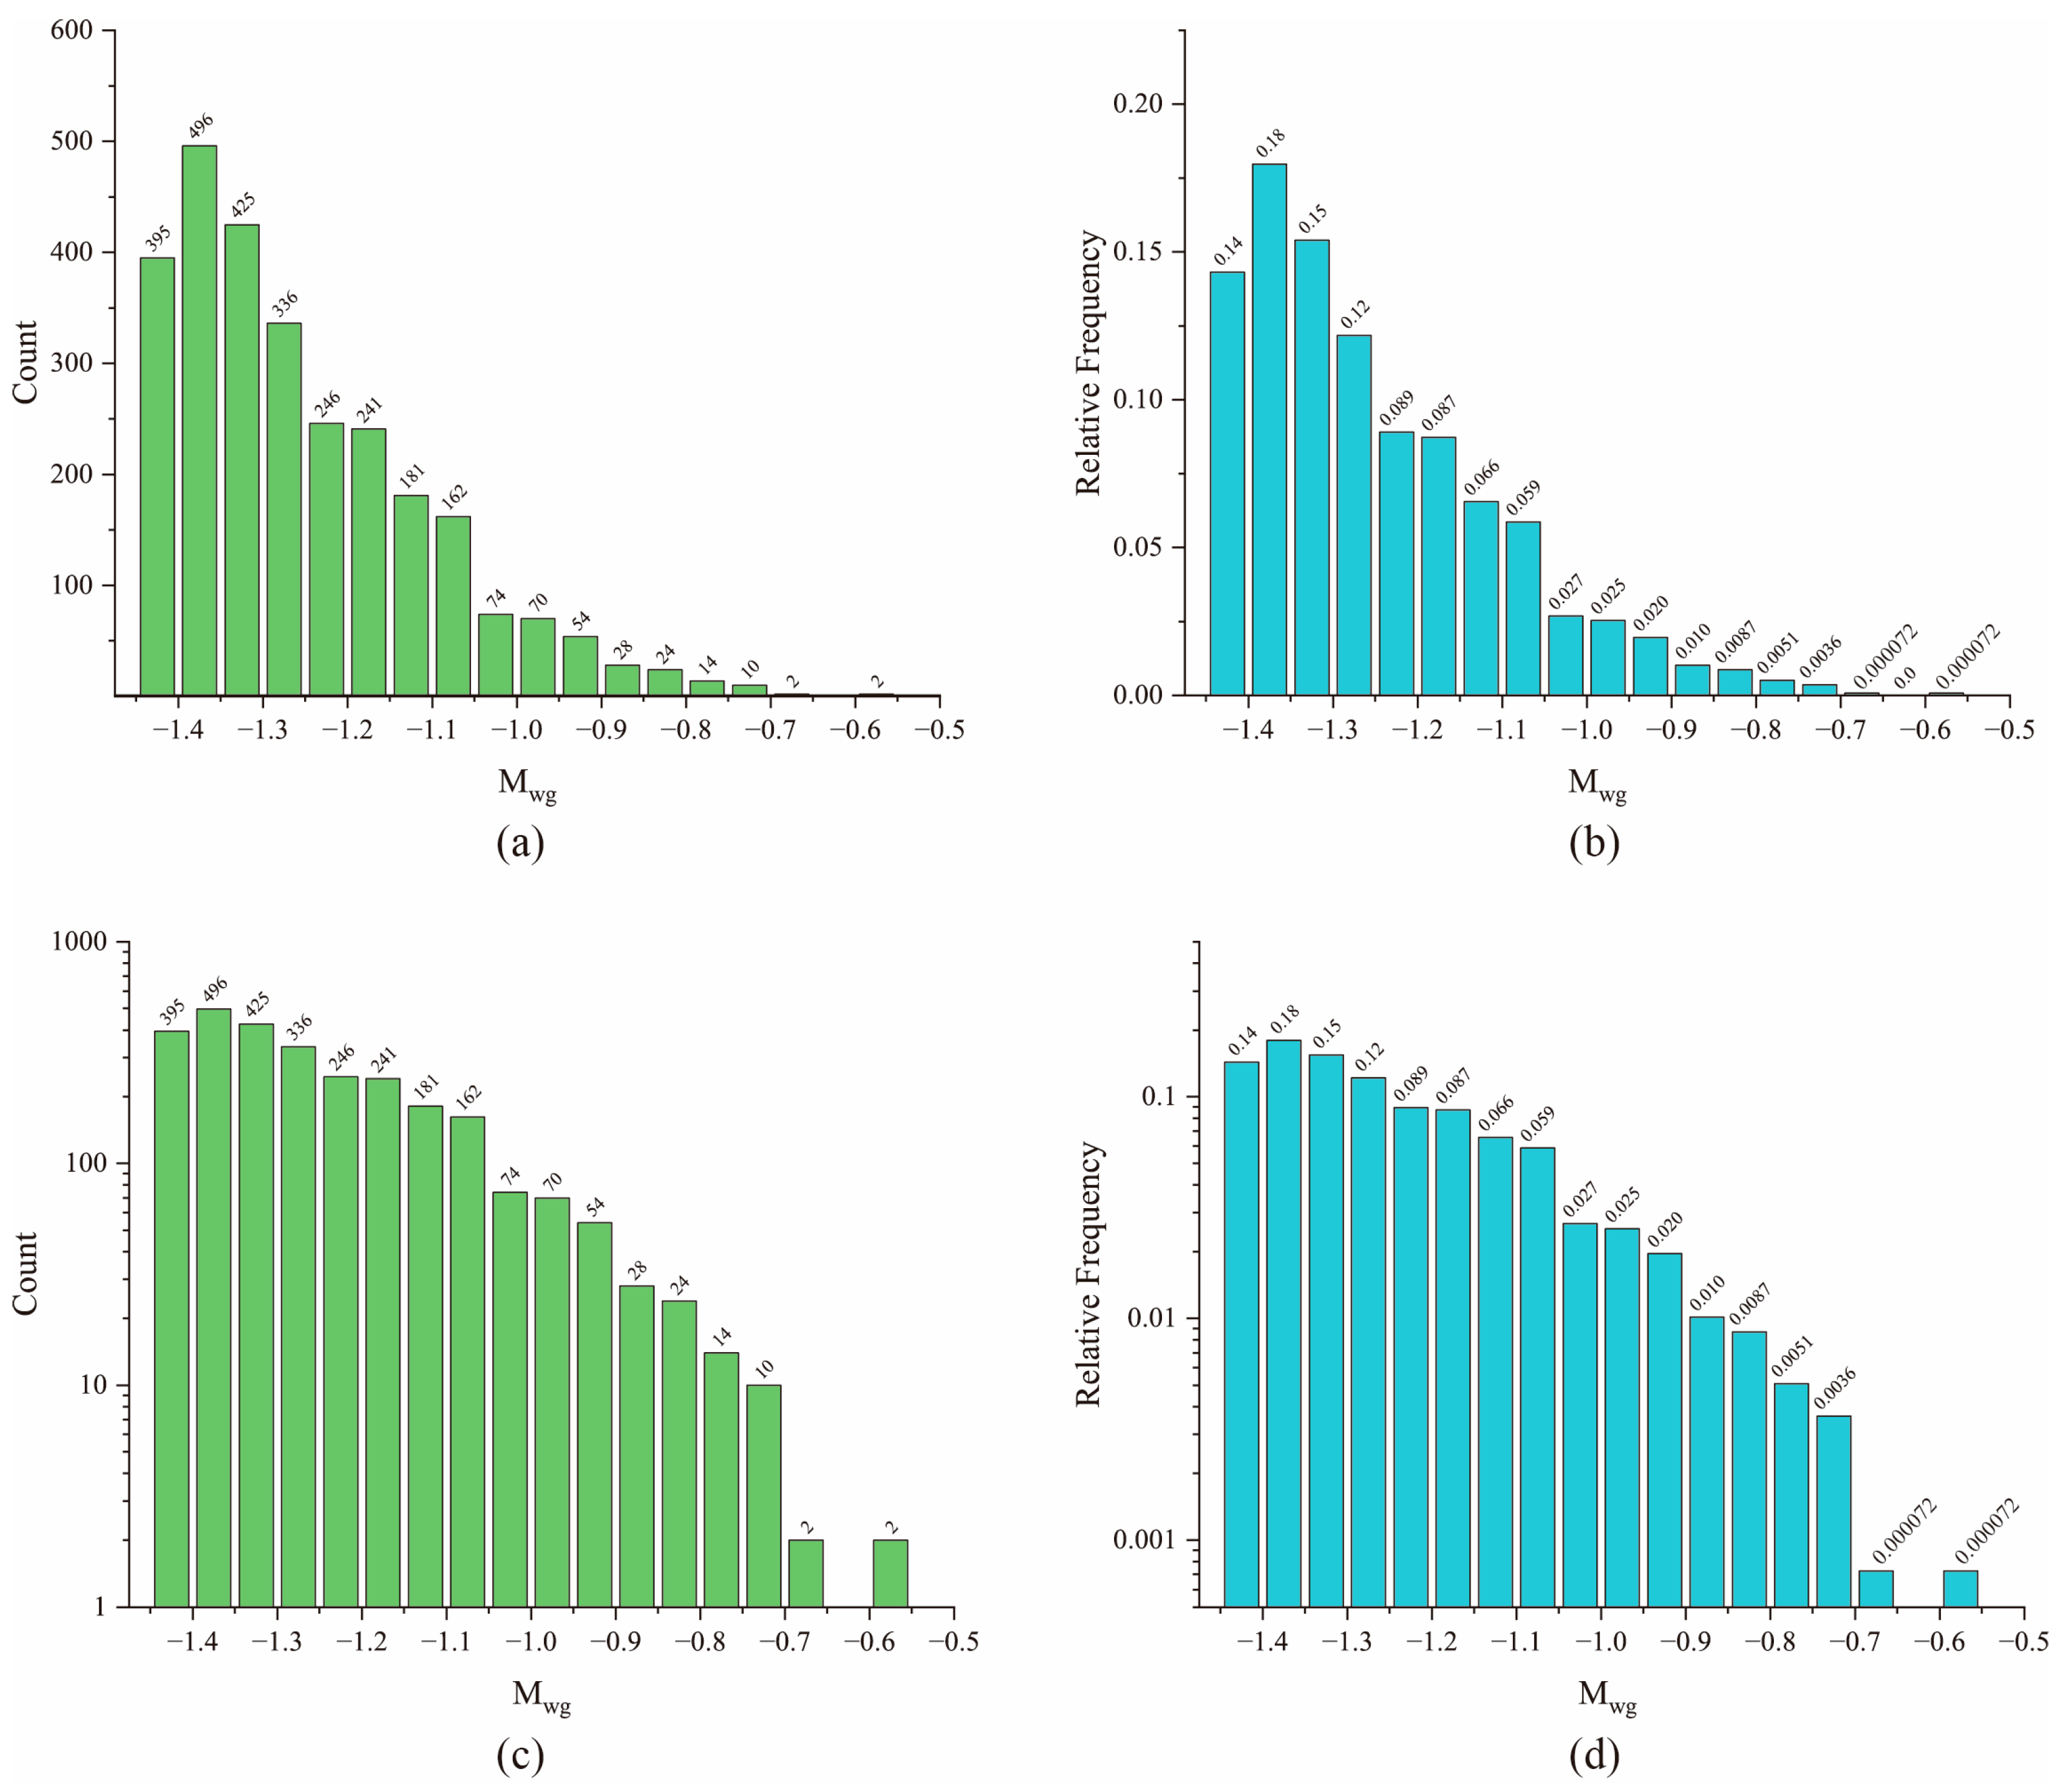
Figure 13 shows the statistical results of the magnitude of the microseismic events. The magnitude distribution after 10 h obeyed the power-law distribution. The number of microseismic events was significantly reduced as the magnitude increased. Therefore, the number of high-magnitude microseismic events caused by shearing is generally small, which has also been verified by microseismic monitoring at actual sites [].
Figure 13.
Statistical analysis results of microseismic event magnitude: (a) Histogram of magnitude distribution of microseismic events and (b) frequency distribution histogram; (c,d) represent the magnitude distribution and frequency distribution in logarithmic coordinates.
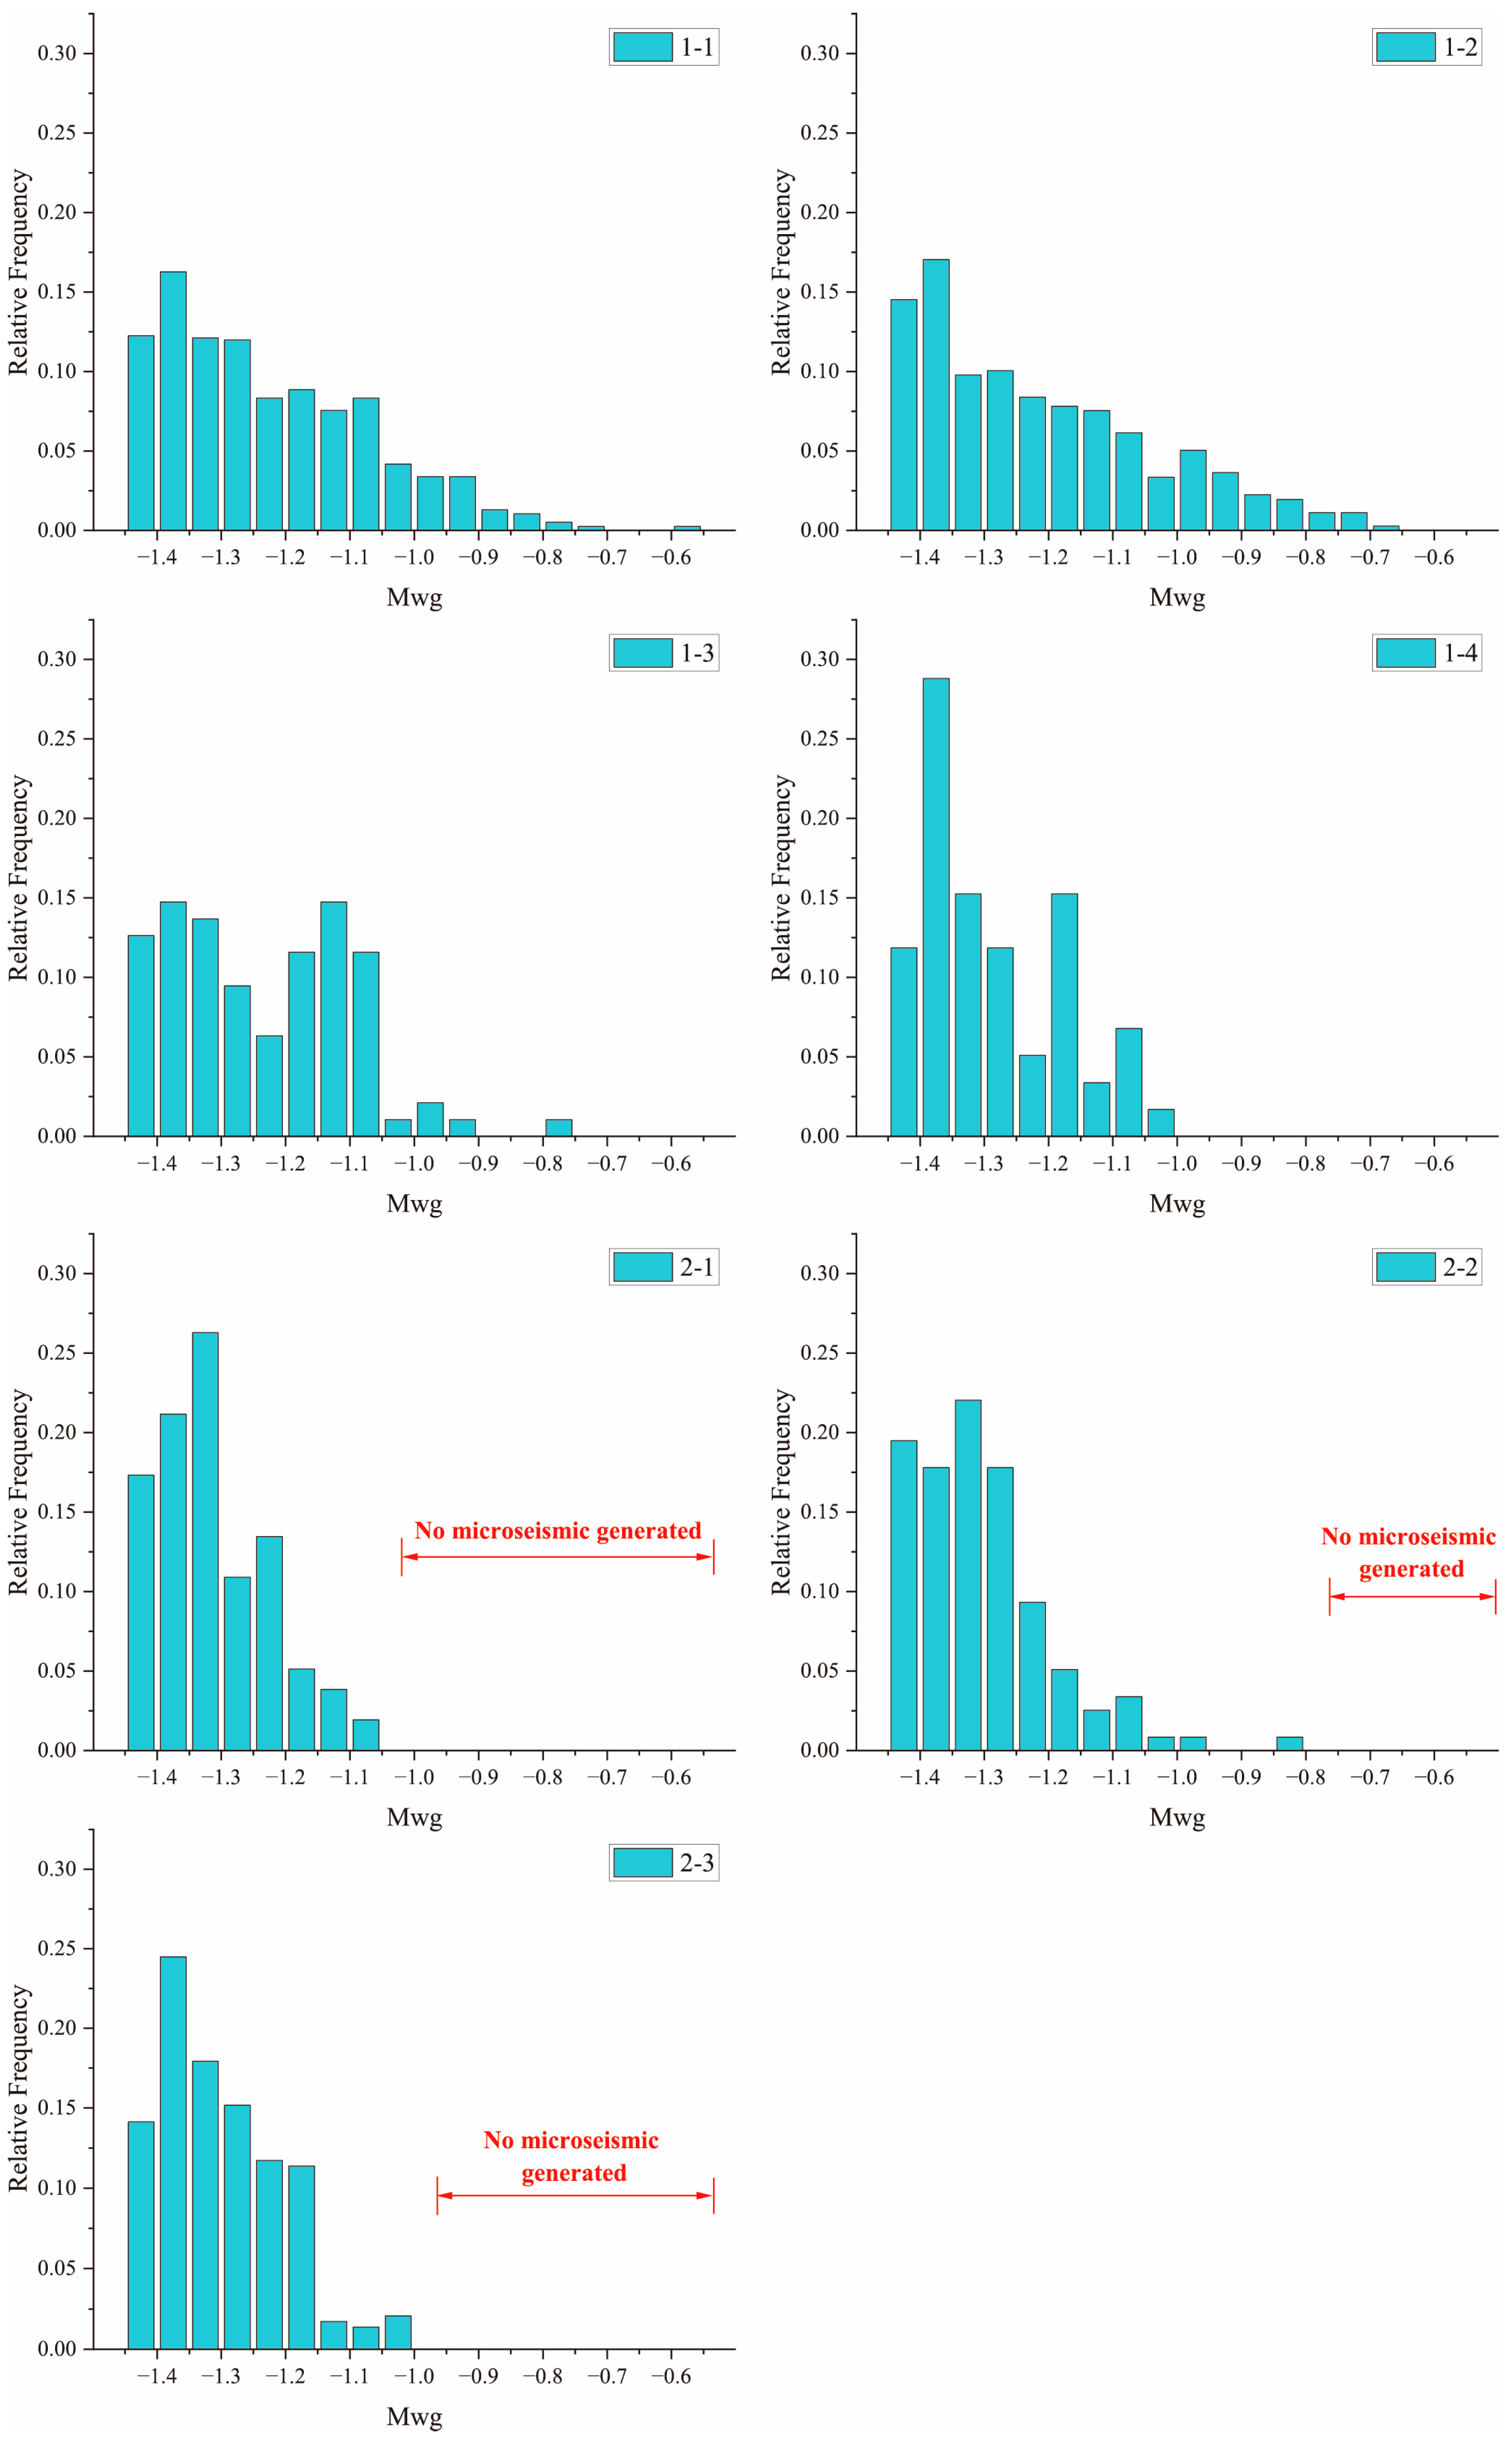
Our analysis revealed a heterogeneous distribution of seismic moment magnitudes across microseismic planes. High-magnitude events predominantly localized to Group 1 fractures, whereas Group 2 planes exhibited negligible occurrence of significant seismicity (Figure 14). This was mainly because the planes of Group 1 were 45° to the maximum principal stress, and the shear stress on the fracture surface was large, which facilitated the formation of large microseismic events. However, the planes of Group2 are parallel to the maximum principal stress and are easily activated by shearing, thus causing more microseismic events. However, owing to the small shear stress, the magnitude of the induced microseismic event is generally small, which is not harmful to hydraulic stimulation projects.
Figure 14.
Histogram of microseismic event distribution on each microseismic plane.
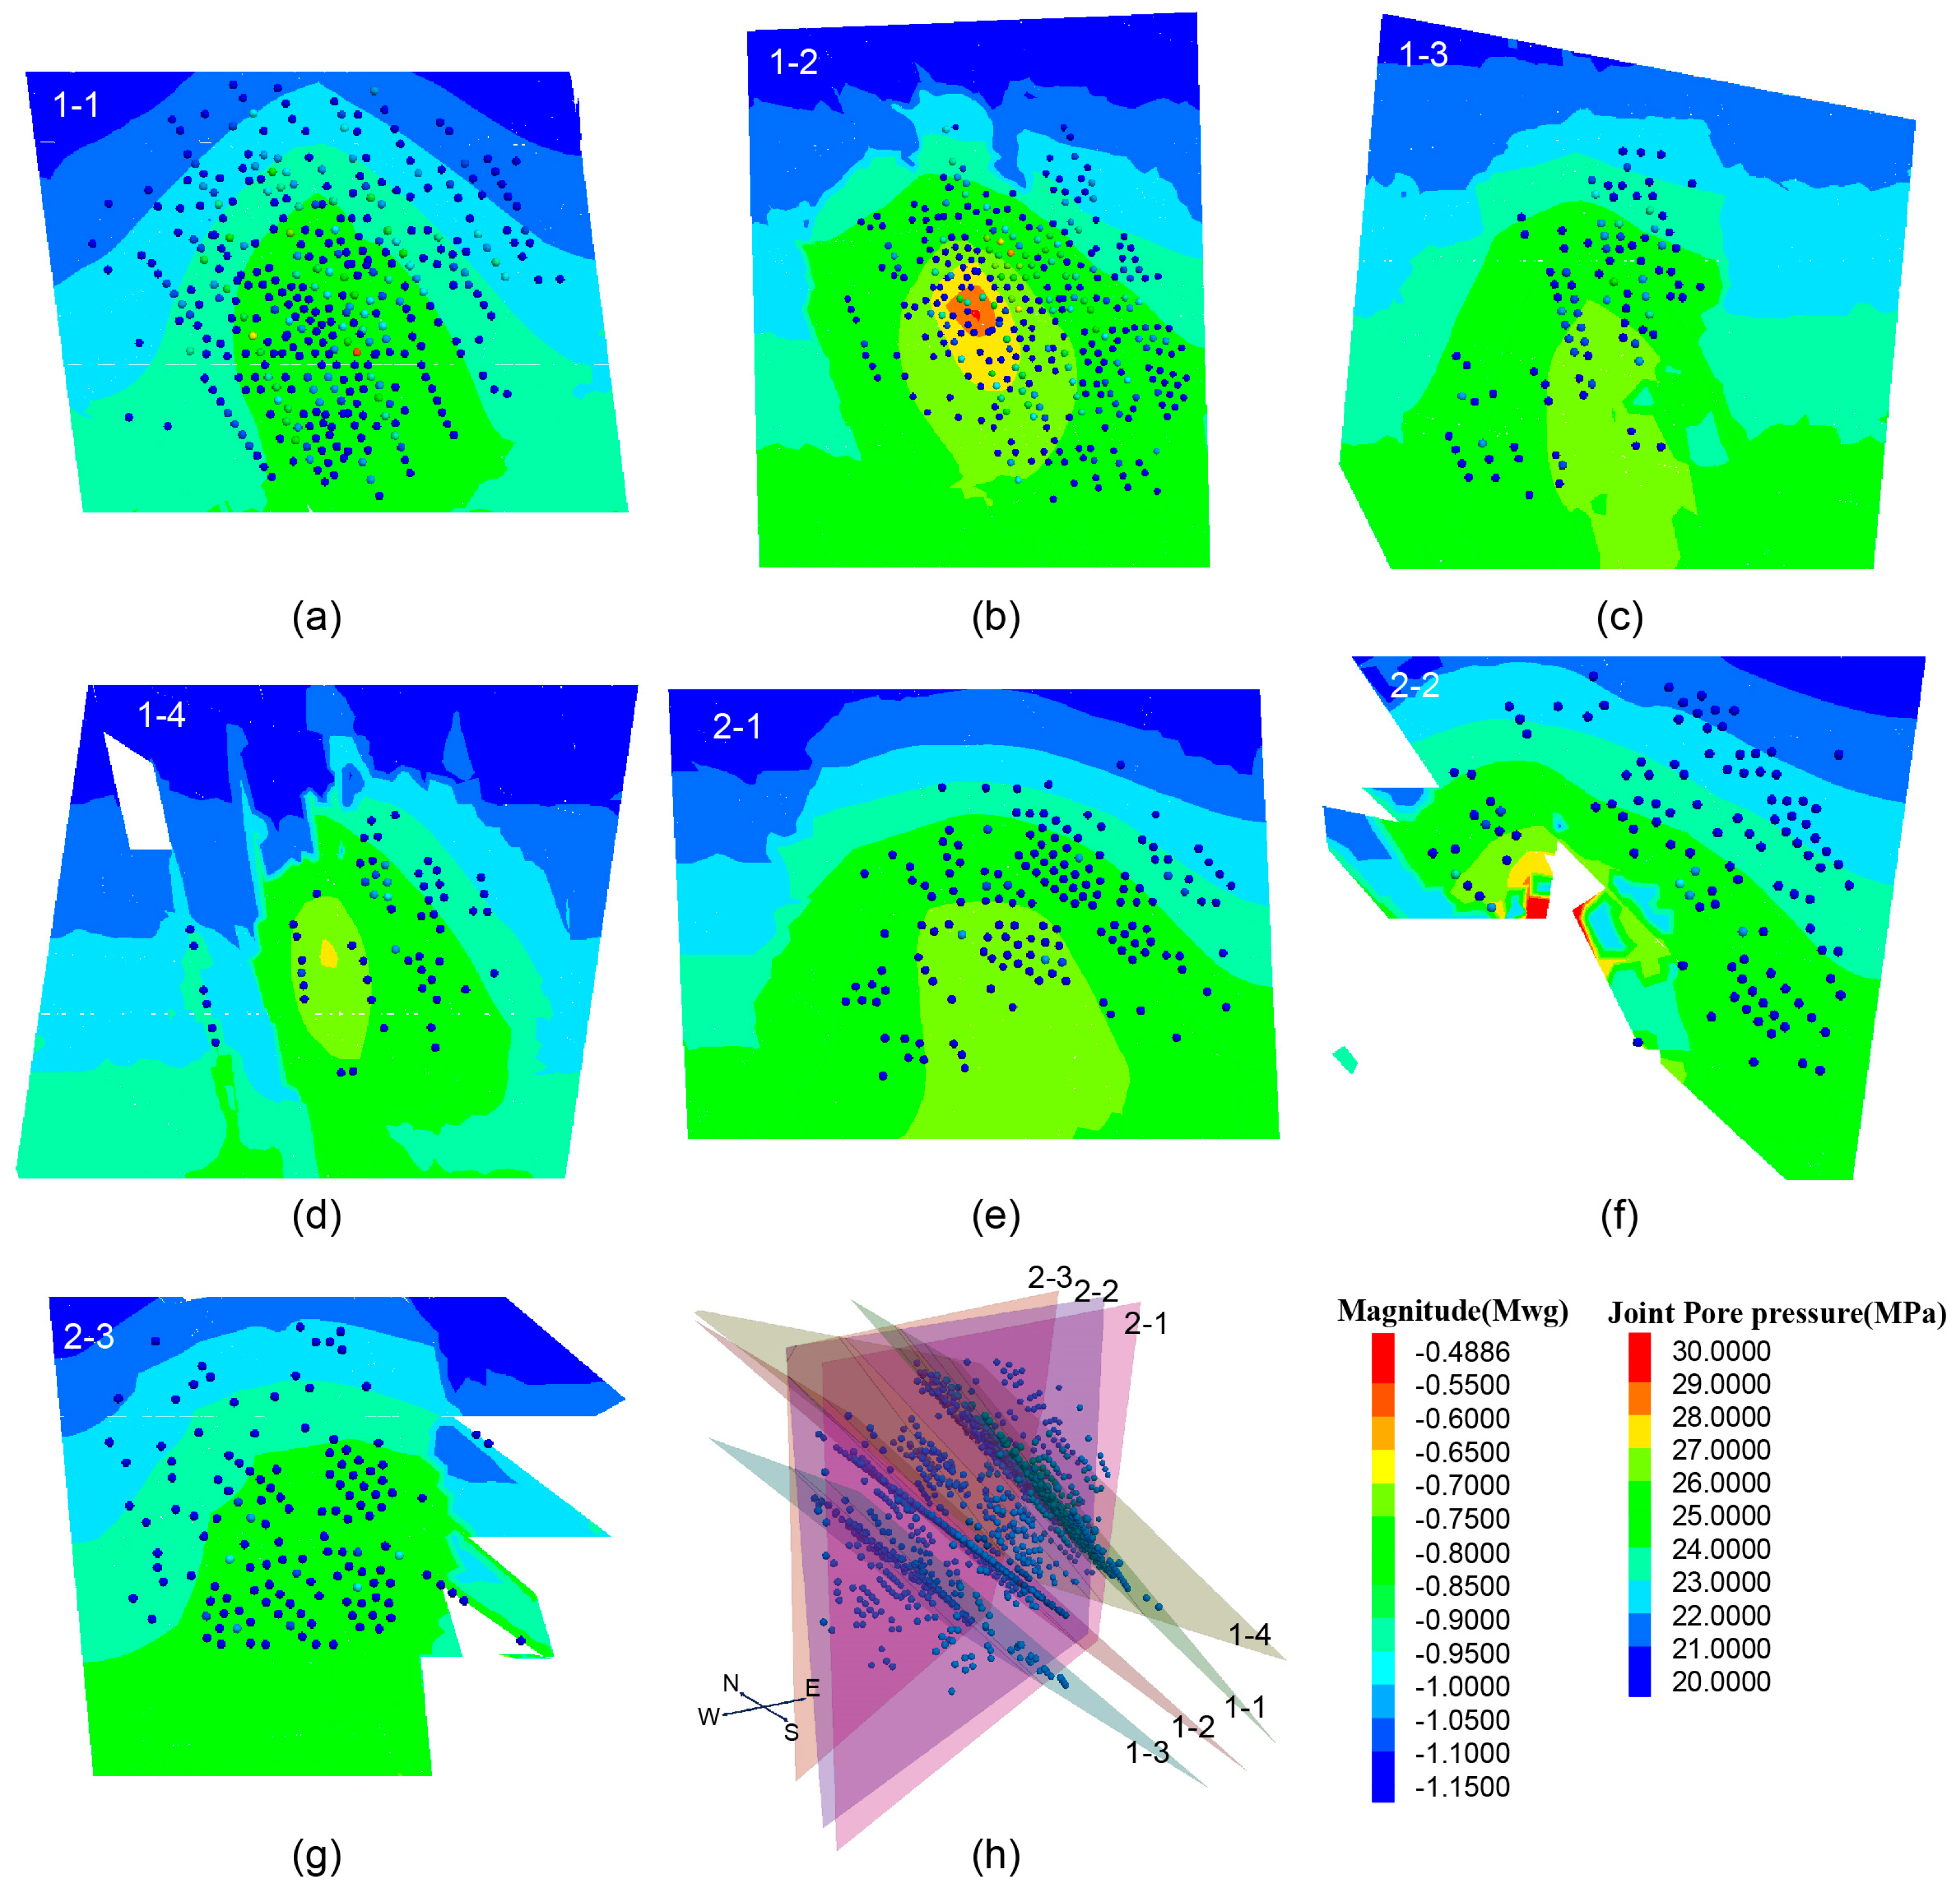
In addition, by comparing the four planes in group 1, it was found that although the four planes had similar occurrences, almost all microseismic events with large moment magnitudes were concentrated in plane 1-1 and plane 1-2 (Figure 15). This is because, compared to planes 1-3 and 1-4, planes 1-1 and 1-2 are relatively close to the injection point; thus, a large amount of fluid can enter these fracture planes. Consequently, the fluid pressure in these fractures is high, causing the effective shear stress in the fracture to increase, resulting in a greater magnitude of microseismic events. The modeling results demonstrate that fractures in proximity to the injection point and optimally oriented at ~45° exhibit an elevated propensity for generating higher-magnitude microseismic events owing to enhanced shear stress concentrations.
Figure 15.
Distribution of microseismic events, magnitudes, and pore pressures on each microseismic plane. (a–g) shows the simulation result on seven planes, (h) is the schematic diagram of the microseismic plane, and the number on the plane corresponds to the number in the upper left corner of (a–g).
Microseismic activity signifies the shear activation of natural fractures, with the spatial extent correlating positively with the stimulated fracture network size. Although maximizing microseismic zone coverage is desirable for enhanced reservoir connectivity, the mitigation of high-magnitude seismicity remains critical for operational safety. Consequently, when natural fractures with high seismic susceptibility are identified, proactive fluid pressure management should be implemented to suppress the excessive magnitude development. For example, directional control of fluid injection can be achieved through techniques such as directional perforation or segmented sealing. In addition, there are currently some temporary plugging techniques that can achieve this goal []. Although these technologies are still in the experimental stage, considering the practical need to reduce microseismicity and the urgent need for this technology in other fields, it can be determined that a comprehensive technology for directional fluid injection and temporary sealing of fractures will be established in the future.
4. Discussion
In situ stresses and natural fractures constitute inherent geological constraints beyond operational control. Consequently, optimization of fracture network complexity and suppression of induced seismicity must be achieved through engineered stimulation parameters, particularly fluid injection methods. Thus, in addition to the continuous injection method, two additional injection methods (e.g., cyclic injection and stepped injection) were considered (Figure 16). For the cyclic injection, each injection lasts for 100 s, with an interval of 20 s between injections. A total of 60 cyclic injections were performed, resulting in a cumulative injection volume of 612 m3 (Figure 16a). For the stepped injection, five consecutive stages of stepwise-increasing injection last for 10 h (e.g., q = 0.1, 0.5, 1.0, 1.5 and 2.0 m3/min). At the end of 10 h, the maximum injection rate was 2.0 m3/min, and the total injection volume was also 612 m3 (Figure 16b). On this basis, we analyzed the spatiotemporal evolution of microseismic events during different hydraulic fracturing treatments to establish seismicity mitigation strategies for EGS development.
Figure 16.
The cyclic injection (a) and stepped injection (b) schemes.
4.1. Effects of Injection Method on Spatial Distribution
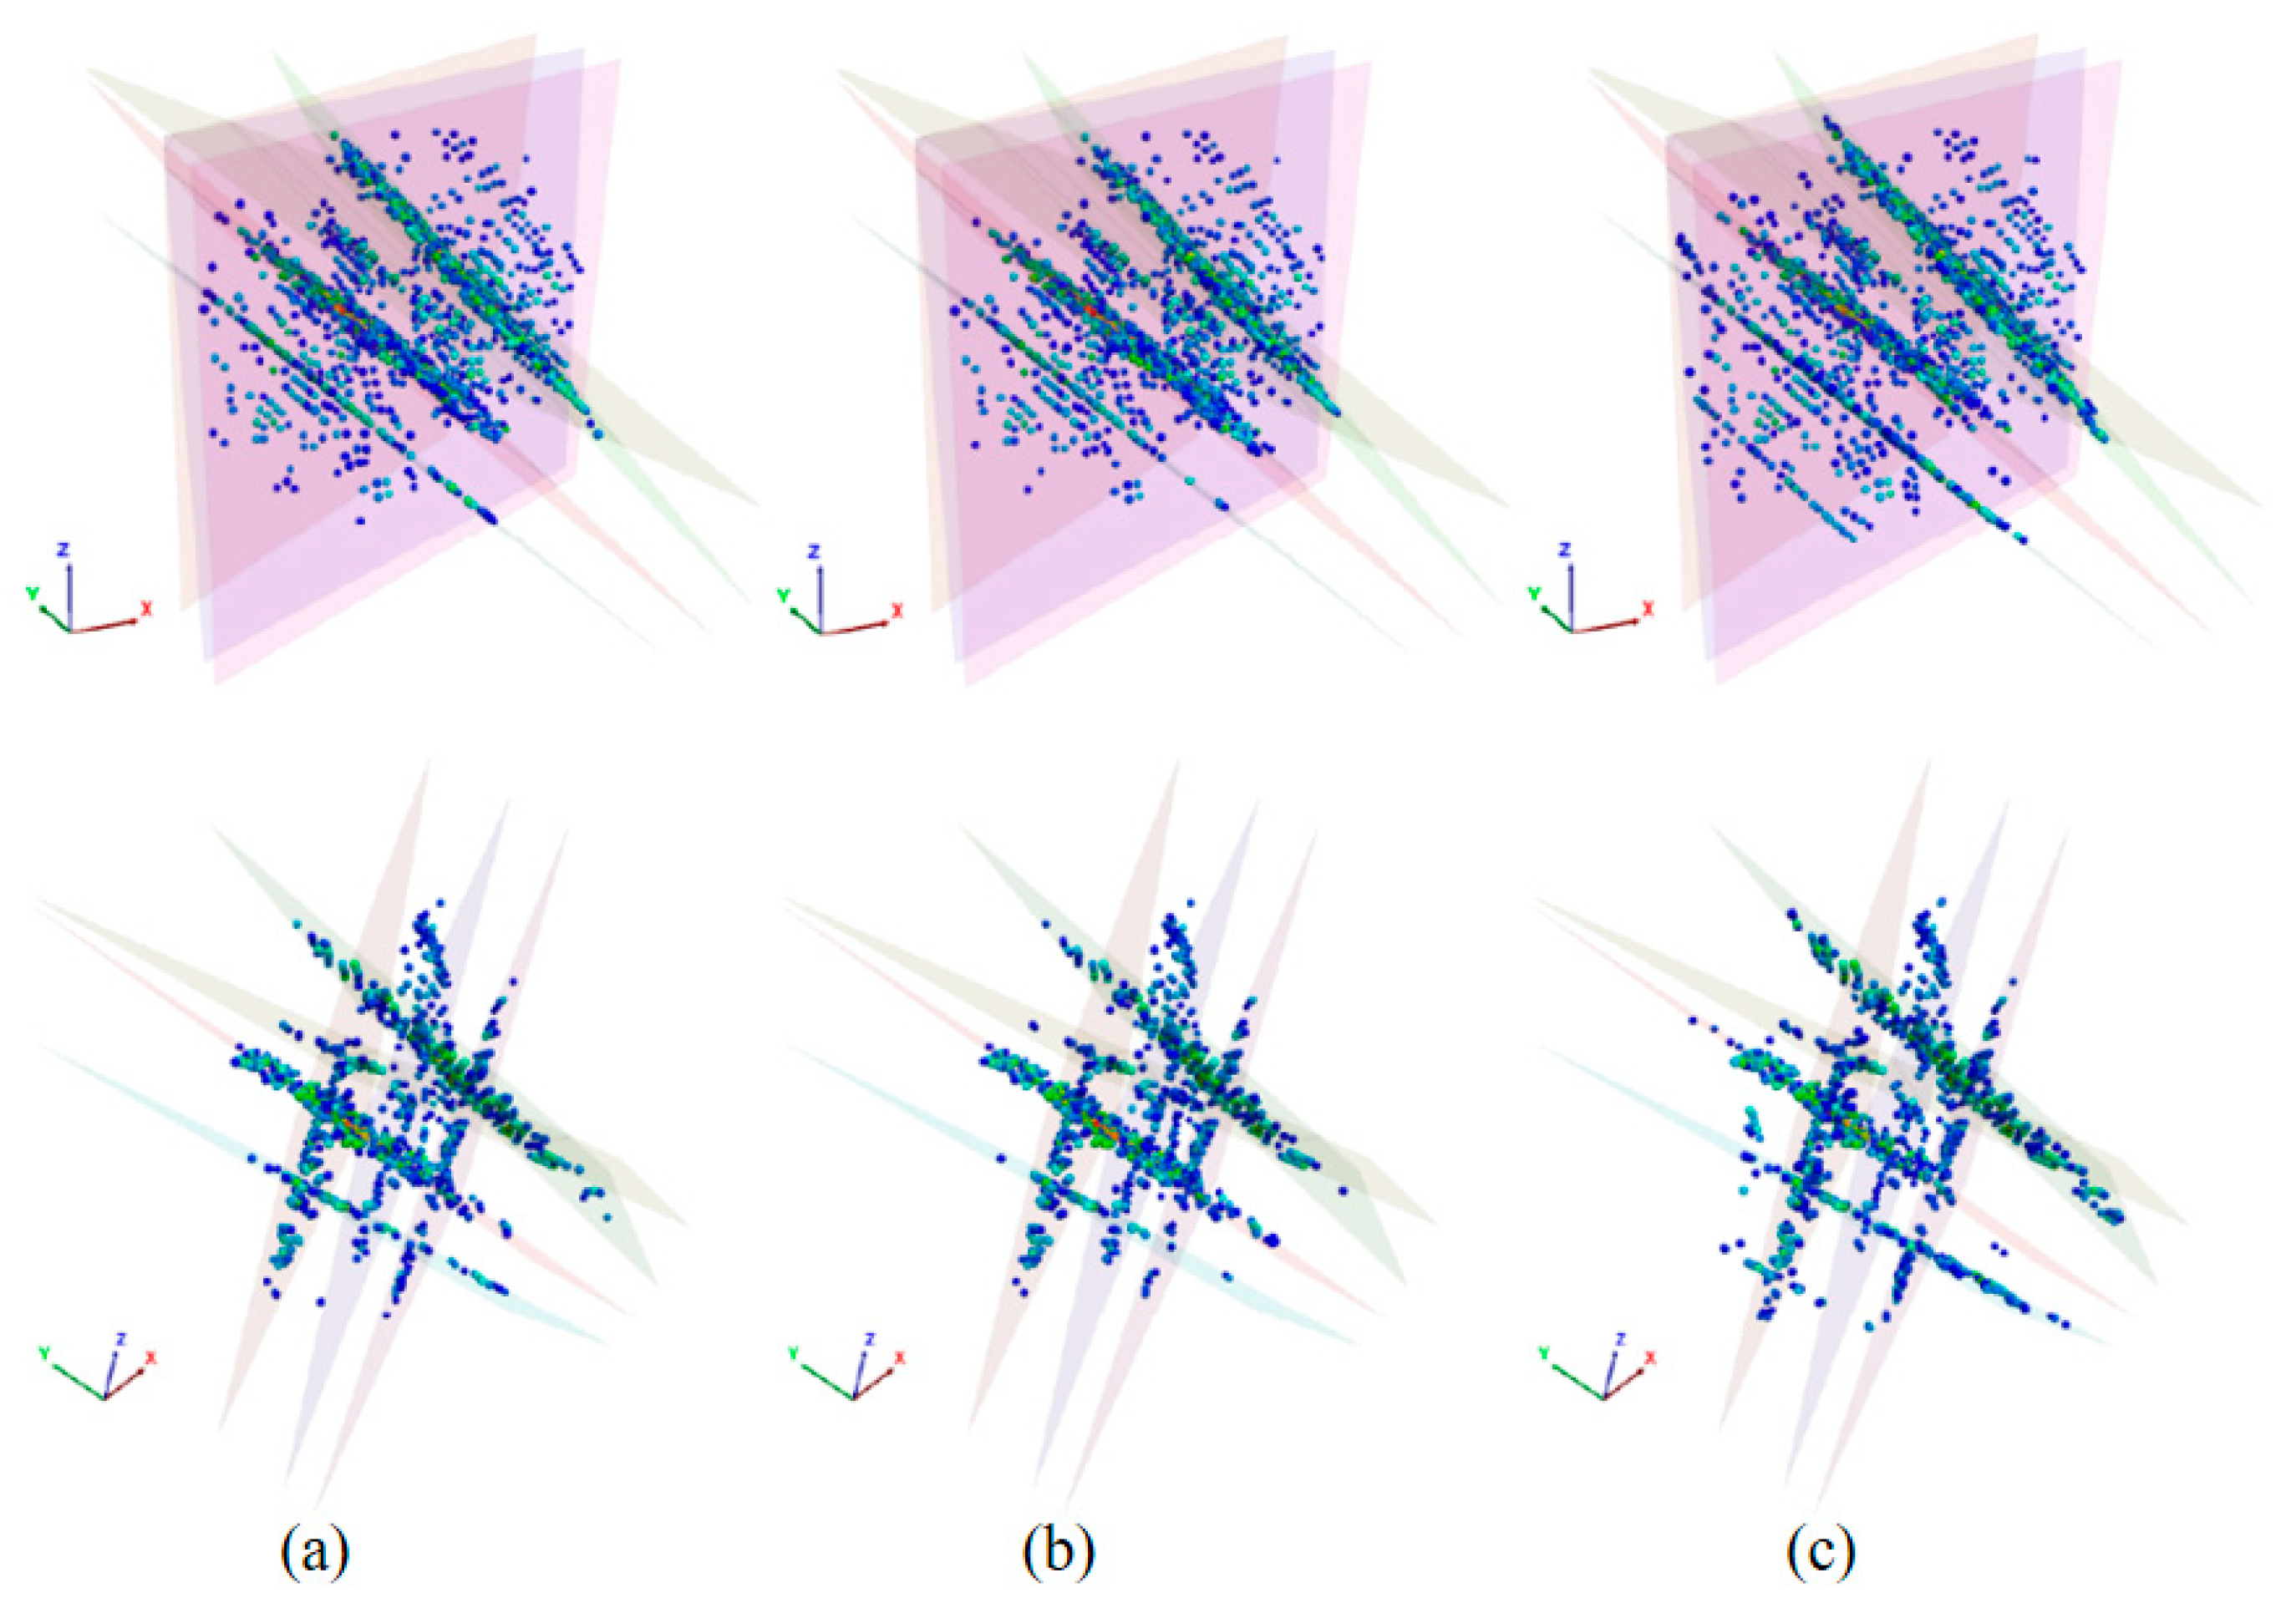
Figure 17 compares the microseismic event distributions after 10 h of continuous, stepped, and cyclic injection protocols. The spatial distributions exhibited negligible variation between continuous and stepped injection treatments. Given that event spatial patterns are primarily governed by natural fracture networks and the extent of fluid propagation, the effect of stepped injection on the spatial distribution of microseismic events is small. Its predominant influence manifests in altered magnitude distributions, particularly through enhanced clustering of higher-magnitude events.
Figure 17.
Comparison of microseismic event distributions after 10 h for (a) continuous, (b) step, and (c) cyclic injection.
Compared to stepped injection and cyclic injection, the number of microseismic events induced by cyclic injection is obviously larger than that of continuous injection and stepped injection. This is because the fluid migration range of the cyclic injection is larger than that of the continuous injection and stepped injection by periodic stimulation. Thus, cyclic injection can activate more shear fractures and form a larger fracture network in HDR.
4.2. Effects of Injection Method on Frequency and Magnitude
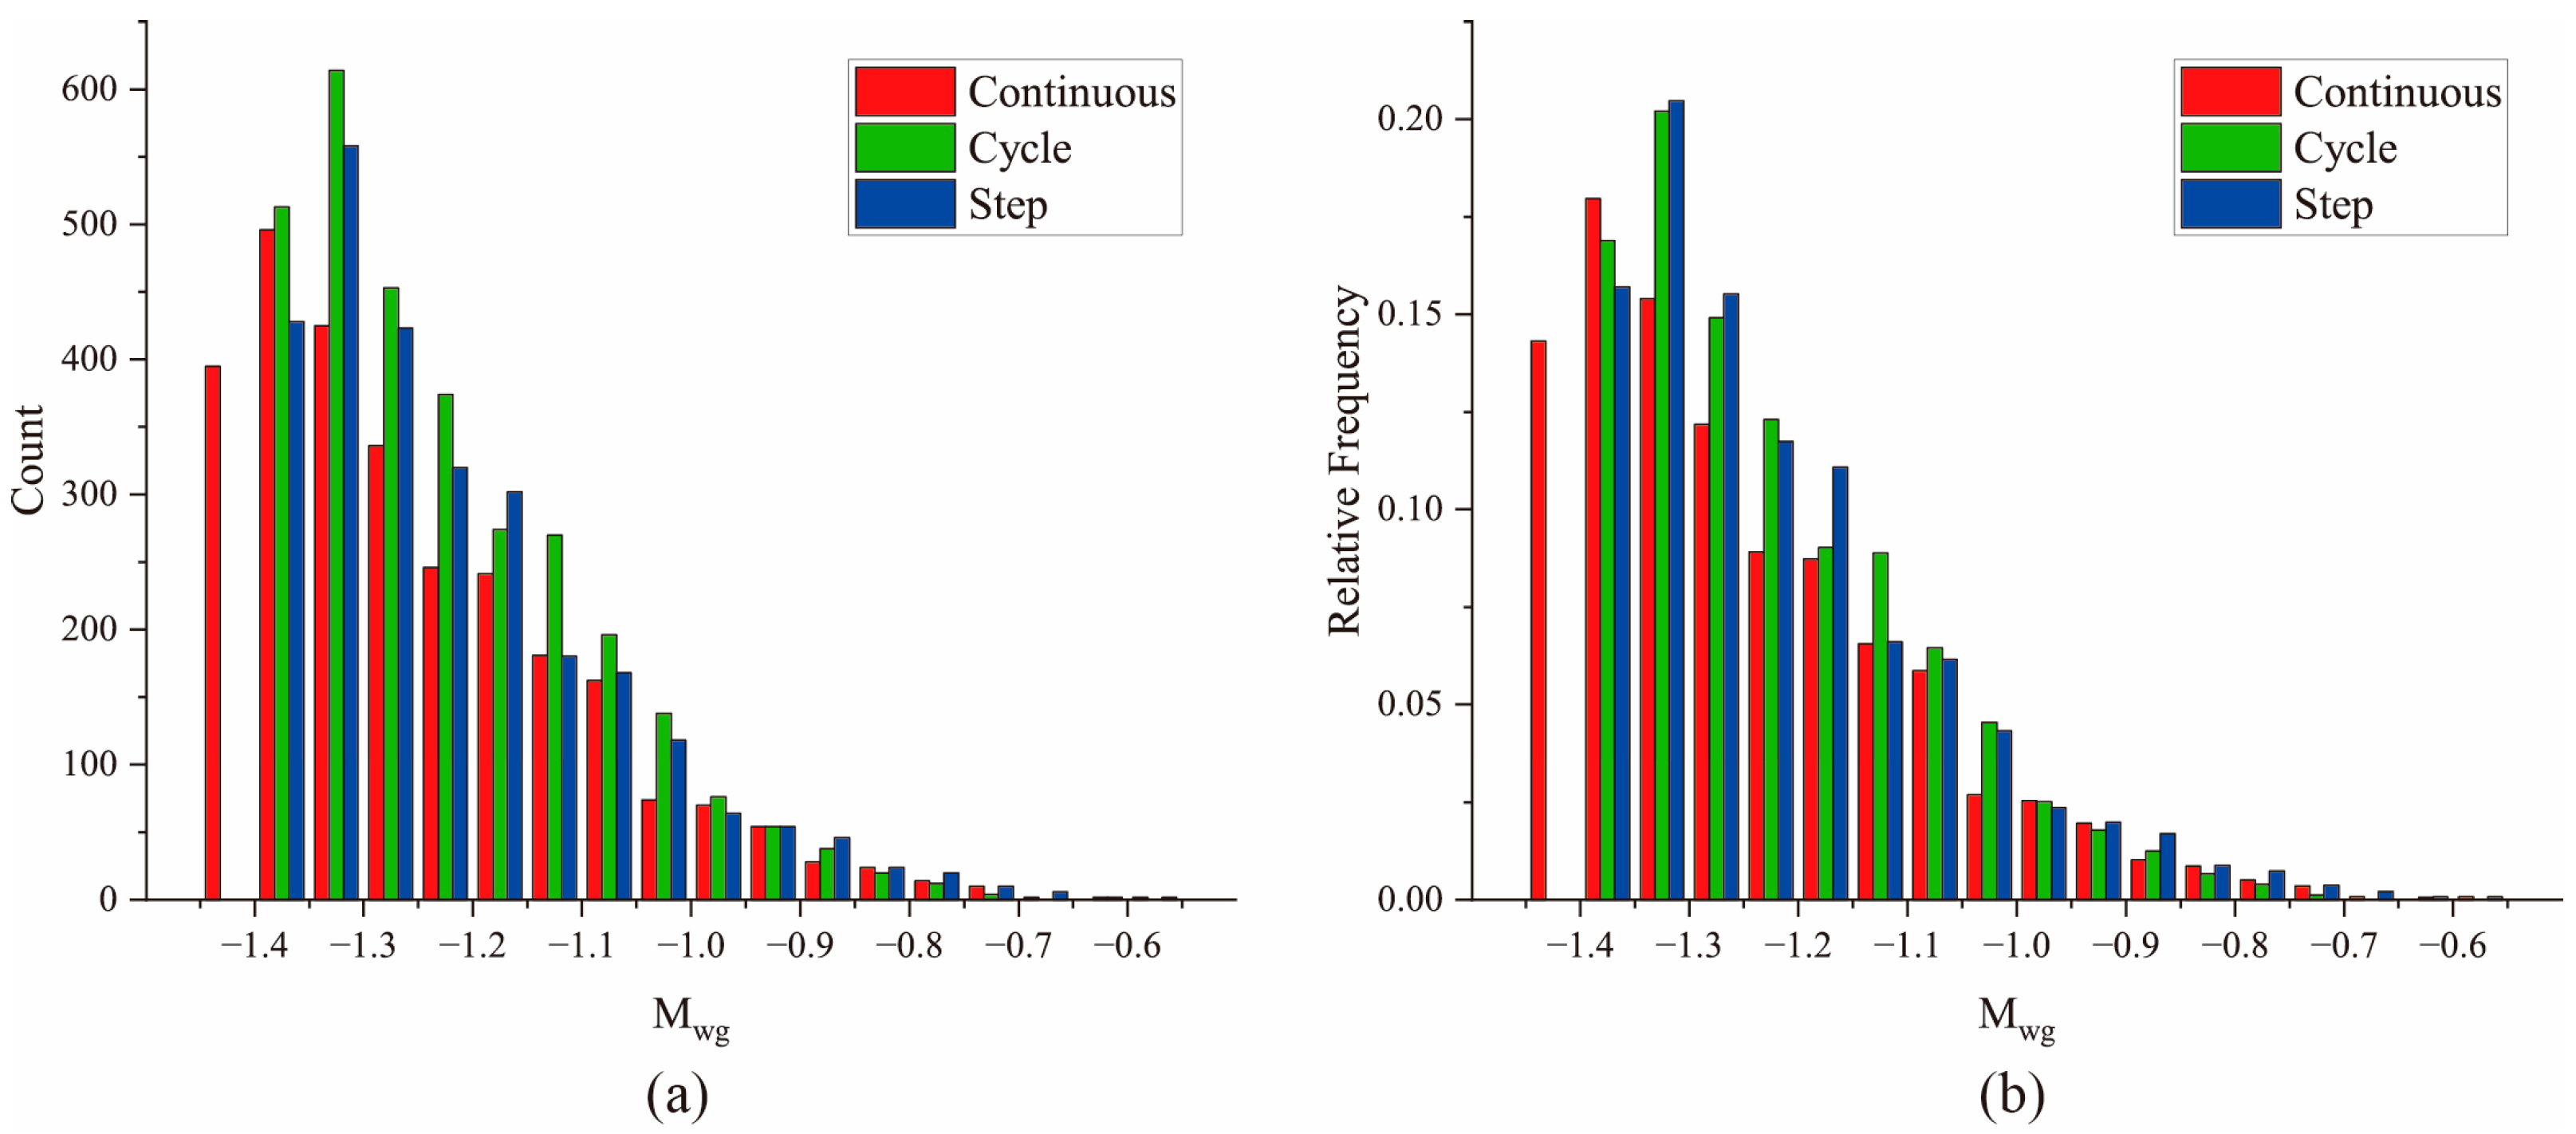
Figure 18 presents the magnitude and frequency distributions following 10 h continuous, stepped, and cyclic injection treatments. All three regimes exhibit power-law distributions that are consistent with characteristic fracturing processes. Cyclic injection elevates lower-magnitude event density while suppressing higher-magnitude occurrences. Conversely, stepped injection induces fewer total events, but exhibits systematically elevated magnitudes relative to the other methods.
Figure 18.
Histograms of magnitude and frequency distribution after 10 h of continuous, step, and cyclic injection: (a) Count statistical and (b) Relative Frequency statistical results.
Unlike stepped injection, cyclic injection is a periodic stimulation in which fluid injection is often interrupted at low intervals. This operational mode facilitates progressive pressure dissipation during shut-in intervals, yielding lower peak fracture pressures, but broader spatial fluid propagation. Consequently, cyclic protocols exhibit a differential magnitude spectrum: they elevate frequency density of low-magnitude microseismicity while suppressing high-magnitude events relative to alternative injection methods.
Stepped injection exhibited lower peak magnitudes during stimulation compared to the other protocols (Figure 19a), while achieving a near-identical post-stimulation maximum magnitude of Mwg −0.601 (Mw 0.275) for continuous injection (Figure 19b). This temporal evolution arises from the initial low injection rates limiting early fracture pressurization, followed by progressive magnitude escalation as the injection rates increase. Cyclic injection yields a terminal maximum magnitude of Mwg −0.64 (Mw 0.241) (Figure 19b), which is statistically comparable to the values from continuous injection and stepped injection. These observations demonstrated the marginal effectiveness of cyclic injection for maximum-magnitude attenuation.
Figure 19.
Comparison of number and maximum magnitude of microseisms between different injection methods: (a) Count statistical and (b) maximum magnitude statistical results.
Although cyclic injection is advocated over continuous and stepped methods for enhanced natural fracture activation and stress relaxation through periodic pressure reduction, its effectiveness in seismic hazard mitigation is limited. Although cyclic protocols can improve the overall reservoir permeability with reduced seismicity risk, suboptimal magnitude attenuation persists. According to the simulation results, cyclic injection can reduce the maximum magnitude of microseismic events, but this can also lead to more microseismic occurrences. However, considering that the main focus during site development is still on the magnitude of microseismic events, this injection method is helpful to some extent. Field data from HDR reservoirs demonstrate that injection scheduling adjustments fail to prevent significant microseismic events when the critical volumetric thresholds are exceeded. This is consistent with the understanding of our model. Fundamentally, all injection methods induce large-magnitude seismicity when a sufficient fluid volume generates critical pressures in optimally oriented fractures (e.g., near-wellbore natural fractures at an angle of 45° to the maximum principal stress). To address this, we propose supplementing cyclic stimulation with a targeted fluid injection into high-risk fracture networks. This engineered approach restricts the pressure buildup in critically stressed fractures while maintaining enhanced permeability gains.
5. Conclusions
This study employed a hydromechanically coupled 3D distinct element model implemented in 3DEC to simulate fracture reactivation dynamics and associated microseismicity during hydraulic stimulation. The intrinsic relationship between the distribution of injection-induced microseismic events and the spatial distribution and fracturing behavior of fractures was qualitatively analyzed using numerical simulation methods. Through spatiotemporal analysis of the induced seismicity, we identified critically stressed fracture networks prone to large-magnitude events and proposed targeted mitigation strategies. Key findings include:
- (1)
- The microseismic event distribution exhibited an incomplete correlation with the fluid pressure fields. Proximal to the injection point, where the fluid pressure exceeds the stress on the fracture plane, tensile fracturing dominates, with negligible microseismicity. Conversely, in distal regions, where the fluid pressure remains insufficient to overcome fracture closure stress and significantly reduce frictional resistance, the shear failure potential increases proportionally with the fluid pressure elevation. This produces a strong spatial correlation between the fluid pressure distribution and concentrated microseismic activity because elevated fluid pressure directly enhances the effective shear stress along critically oriented fractures.
- (2)
- Hydraulic fracturing induced microseismicity localizes preferentially to discrete fracture subsets rather than being distributed uniformly across all fractures. The fractures that were distributed at 45° from the direction of the maximum principal stress or at 45° from the principal stress were more likely to produce a concentration of microseismic events. The closer the fractures are to such features, the more likely a large number of microseismic events will occur during the hydraulic fracturing.
- (3)
- The maximum magnitude of the induced seismicity occurs only on specific fractures. The magnitude of the induced seismicity depends mainly on the fracture orientation and intra-fracture fluid pressure. When the angle between the fracture and maximum principal stress was 45°, the shear stress on the fracture was larger, and the induced microseismic events were stronger. Additionally, fractures near the injection point usually have a higher fluid pressure, which can also induce stronger microseismic events. Consequently, mitigation strategies should focus on preventing the development of critically high fluid pressures within the natural fractures near the injection well, particularly those oriented near 45° to the maximum principal stress. This necessitates the maintenance of fluid pressures below the local normal stress acting on the fracture plane.
- (4)
- Cyclic injection promotes shearing across a greater population of natural fractures while potentially reducing induced microseismic magnitudes through pressure relaxation during each injection hiatus. However, regardless of the specific injection protocol employed, surpassing a critical volumetric threshold may enable the development of critically elevated fluid pressures within fractures susceptible to large seismic events. Consequently, such pressures can trigger high-magnitude seismicity. Therefore, for cyclic hydraulic fracturing operations to enhance earthquake risk mitigation, it is recommended to implement measures within these susceptible fractures to prevent fracturing fluid from flowing into high-risk fractures (such as using packers, segmented fracturing, and temporary plugging techniques).
In this study, the discrete element model established using DFN includes some assumptions, such as the simplification of DFN, the assumption that the bulk matrix is impermeable, and the assumption of bulk elasticity. In addition, as discussed earlier, the calculation of microseismic magnitude by the model will be affected to some extent by the grid size (but will not affect the final results), which will lead to some differences between the model in this study and reality. However, the primary aim of this study is to analyze the associations between microseismic activity, fracture behavior, and fracture distribution; the conclusions drawn are qualitative conditions applicable to general site conditions and do not provide quantitatively precise predictive results. Therefore, the existing discrepancies of DFN do not fundamentally affect the conclusions. Nevertheless, due to the lack of field-measured microseismic data, future research should still develop more refined site-specific fracture models based on measured microseismic and fracture behavior data, and further conduct in-depth analyses of the relationships between fracture behavior and microseismic activity.
Author Contributions
Conceptualization, Y.Y. and Z.H.; Software, Z.H.; Validation, Y.Y.; Formal analysis, J.T.; Investigation, W.W. and J.T.; Resources, J.T.; Data curation, W.W.; Writing—original draft, Y.Y. and Z.H.; Writing—review and editing, Y.Y. and Z.H. All authors have read and agreed to the published version of the manuscript.
Funding
This work was jointly supported by the Open Fund of State Key Laboratory of Water Resource Protection and Utilization in Coal Mining (Grant No. GJNY-21-41-13), the National Natural Science Foundation of China (Grant No. 42372283), and Scientific Research Project of Jilin Provincial Department of Education (Grant No. JJKH20240157KJ).
Institutional Review Board Statement
Not applicable.
Informed Consent Statement
Not applicable.
Data Availability Statement
The original contributions presented in this study are included in the article. Further inquiries can be directed to the corresponding author.
Acknowledgments
Our deepest gratitude goes to the anonymous reviewers for their careful work and thoughtful suggestions that have helped improve this paper substantially.
Conflicts of Interest
Author Wei Wang was employed by the Sichuan Institute of Geological Engineering Investigation Group Co., Ltd. The remaining authors declare that the research was conducted in the absence of any commercial or financial relationships that could be construed as a potential conflict of interest.
Nomenclatures
| DFM | Discrete Fracture Model |
| DFN | Discrete Fracture Network |
| EGS | Enhanced Geothermal System |
| FMI | Formation Micro-Imager |
| HDR | Hot Dry Rock |
| HF | Hydraulic Fracturing |
| MP | Microseismic Plane |
References
- Xie, L.; Min, K.-B.; Song, Y. Observations of hydraulic stimulations in seven enhanced geothermal system projects. Renew. Energy 2015, 79, 56–65. [Google Scholar] [CrossRef]
- Ma, W.; Wang, Y.; Wu, X.; Liu, G. Hot dry rock (HDR) hydraulic fracturing propagation and impact factors assessment via sensitivity indicator. Renew. Energy 2020, 146, 2716–2723. [Google Scholar] [CrossRef]
- Zhang, Y.; Ma, Y.; Hu, Z.; Lei, H.; Bai, L.; Lei, Z.; Zhang, Q. An experimental investigation into the characteristics of hydraulic fracturing and fracture permeability after hydraulic fracturing in granite. Renew. Energy 2019, 140, 615–624. [Google Scholar] [CrossRef]
- Zhou, Z.; Jin, Y.; Zeng, Y.; Zhang, X.; Zhou, J.; Zhuang, L.; Xin, S. Investigation on fracture creation in hot dry rock geothermal formations of China during hydraulic fracturing. Renew. Energy 2020, 153, 301–313. [Google Scholar] [CrossRef]
- Hu, Y.; Cheng, H.; Tao, S. Opportunity and challenges in large-scale geothermal energy exploitation in China. Crit. Rev. Environ. Sci. Technol. 2022, 52, 3813–3834. [Google Scholar] [CrossRef]
- Shu, B.; Zhu, R.; Zhang, S.; Dick, J. A qualitative prediction method of new crack-initiation direction during hydraulic fracturing of pre-cracks based on hyperbolic failure envelope. Appl. Energy 2019, 248, 185–195. [Google Scholar] [CrossRef]
- Song, X.; Shi, Y.; Li, G.; Yang, R.; Wang, G.; Zheng, R.; Li, J.; Lyu, Z. Numerical simulation of heat extraction performance in enhanced geothermal system with multilateral wells. Appl. Energy 2018, 218, 325–337. [Google Scholar] [CrossRef]
- Moska, R.; Labus, K.; Kasza, P. Hydraulic Fracturing in Enhanced Geothermal Systems—Field, Tectonic and Rock Mechanics Conditions—A Review. Energies 2021, 14, 5725. [Google Scholar] [CrossRef]
- Zheng, Y.; Liu, J.; Lei, Y. The Propagation Behavior of Hydraulic Fracture in Rock Mass with Cemented Joints. Geofluids 2019, 1, 5406870. [Google Scholar] [CrossRef]
- Li, N.; Xie, H.; Gao, Z.; Li, C. Study on the Hydraulic Fracturing Failure Behaviour of Granite and Its Comparison with Gas Fracturing. Sustainability 2022, 14, 14593. [Google Scholar] [CrossRef]
- Li, S.; Wang, S.; Tang, H. Stimulation mechanism and design of enhanced geothermal systems: A comprehensive review. Renew. Sustain. Energy Rev. 2022, 155, 111914. [Google Scholar] [CrossRef]
- Liu, K.; Taleghani, A.D.; Gao, D. Calculation of hydraulic fracture induced stress and corresponding fault slippage in shale formation. Fuel 2019, 254, 115525. [Google Scholar] [CrossRef]
- McClure, M.W.; Horne, R.N. An investigation of stimulation mechanisms in Enhanced Geothermal Systems. Int. J. Rock Mech. Min. Sci. 2014, 72, 242–260. [Google Scholar] [CrossRef]
- Zang, A.; Oye, V.; Jousset, P.; Deichmann, N.; Gritto, R.; McGarr, A.; Majer, E.; Bruhn, D. Analysis of induced seismicity in geothermal reservoirs—An overview. Geothermics 2014, 52, 6–21. [Google Scholar] [CrossRef]
- Haering, M.O.; Schanz, U.; Ladner, F.; Dyer, B.C. Characterisation of the Basel 1 enhanced geothermal system. Geothermics 2008, 37, 469–495. [Google Scholar] [CrossRef]
- Baisch, S.; Voeroes, R.; Weidler, R.; Wyborn, D. Investigation of Fault Mechanisms during Geothermal Reservoir Stimulation Experiments in the Cooper Basin, Australia. Bull. Seismol. Soc. Am. 2009, 99, 148–158. [Google Scholar] [CrossRef]
- Baisch, S.; Voeroes, R.; Rothert, E.; Stang, H.; Jung, R.; Schellschmidt, R. A numerical model for fluid injection induced seismicity at Soultz-sous-Forets. Int. J. Rock Mech. Min. Sci. 2010, 47, 405–413. [Google Scholar] [CrossRef]
- Calo, M.; Dorbath, C.; Frogneux, M. Injection tests at the EGS reservoir of Soultz-sous-Forets. Seismic response of the GPK4 stimulations. Geothermics 2014, 52, 50–58. [Google Scholar] [CrossRef]
- Dorbath, L.; Evans, K.; Cuenot, N.; Valley, B.; Charlety, J.; Frogneux, M. The stress field at Soultz-sous-Forets from focal mechanisms of induced seismic events: Cases of the wells GPK2 and GPK3. Comptes Rendus Geosci. 2010, 342, 600–606. [Google Scholar] [CrossRef]
- Ellsworth, W.L.; Giardini, D.; Townend, J.; Ge, S.; Shimamoto, T. Triggering of the Pohang, Korea, Earthquake (Mw 5.5) by Enhanced Geothermal System Stimulation. Seismol. Res. Lett. 2019, 90, 1844–1858. [Google Scholar] [CrossRef]
- Kim, K.-H.; Ree, J.-H.; Kim, Y.; Kim, S.; Kang, S.Y.; Seo, W. Assessing whether the 2017 Mw 5.4 Pohang earthquake in South Korea was an induced event. Science 2018, 360, 1007–1009. [Google Scholar] [CrossRef]
- Lyakhovsky, V.; Shalev, E. Runaway Versus Stable Fracturing During Hydraulic Stimulation: Insights from the Damage Rheology Modeling. Rock Mech. Rock Eng. 2021, 54, 5449–5464. [Google Scholar] [CrossRef]
- Schwartzkopff, A.K.; Sainoki, A.; Elsworth, D. Numerical Simulation of An In-situ Fluid Injection Experiment into a Fault Using Coupled X-FEM Analysis. Rock Mech. Rock Eng. 2021, 54, 1027–1053. [Google Scholar] [CrossRef]
- Das, R.; Sharma, M.L.; Wason, H.R.; Choudhury, D.; Gonzalez, G. A Seismic Moment Magnitude Scale. Bull. Seismol. Soc. Am. 2019, 109, 1542–1555. [Google Scholar] [CrossRef]
- Izadi, G.; Elsworth, D. Reservoir stimulation and induced seismicity: Roles of fluid pressure and thermal transients on reactivated fractured networks. Geothermics 2014, 51, 368–379. [Google Scholar] [CrossRef]
- Yaghoubi, A.; Dusseault, M.B.; Leonenko, Y. Injection-induced fault slip assessment in Montney Formation in Western Canada. Sci. Rep. 2022, 12, 11551. [Google Scholar] [CrossRef]
- Zoback, M.D.; Gorelick, S.M. Earthquake triggering and large-scale geologic storage of carbon dioxide. Proc. Natl. Acad. Sci. USA 2012, 109, 10164–10168. [Google Scholar] [CrossRef]
- Chong, Z.; Yao, Q.; Li, X.; Liu, J. Investigations of seismicity induced by hydraulic fracturing in naturally fractured reservoirs based on moment tensors. J. Nat. Gas Sci. Eng. 2020, 81, 103448. [Google Scholar] [CrossRef]
- Alghannam, M.; Juanes, R. Understanding rate effects in injection-induced earthquakes. Nat. Commun. 2020, 11, 3053. [Google Scholar] [CrossRef] [PubMed]
- Izadi, G.; Elsworth, D. The effects of thermal stress and fluid pressure on induced seismicity during stimulation to production within fractured reservoirs. Terra Nova 2013, 25, 374–380. [Google Scholar] [CrossRef]
- Park, S.; Kim, K.-I.; Yoo, H.; Yim, J.; Min, K.-B. Comprehensive in-situ stress estimation in a fractured geothermal reservoir in Pohang, South Korea using drilling data, hydraulic stimulations, and induced seismicity. Int. J. Rock Mech. Min. Sci. 2025, 186, 105978. [Google Scholar] [CrossRef]
- Diaz, M.B.; Kim, K.Y.; Jung, S.G. Effect of frequency during cyclic hydraulic fracturing and the process of fracture development in laboratory experiments. Int. J. Rock Mech. Min. Sci. 2020, 134, 105978. [Google Scholar] [CrossRef]
- Hui, G.; Chen, S.; Chen, Z.; Gu, F. An integrated approach to characterize hydraulic fracturing-induced seismicity in shale reservoirs. J. Pet. Sci. Eng. 2021, 196, 107624. [Google Scholar] [CrossRef]
- Zang, A.; Zimmermann, G.; Hofmann, H.; Stephansson, O.; Min, K.-B.; Kim, K.Y. How to Reduce Fluid-Injection-Induced Seismicity. Rock Mech. Rock Eng. 2019, 52, 475–493. [Google Scholar] [CrossRef]
- Zhou, W.; Lanza, F.; Grigoratos, I.; Schultz, R.; Cousse, J.; Trutnevyte, E.; Muntendam-Bos, A.; Wiemer, S. Managing Induced Seismicity Risks from Enhanced Geothermal Systems: A Good Practice Guideline. Rev. Geophys. 2024, 62, 2024RG000849. [Google Scholar] [CrossRef]
- Kwiatek, G.; Saarno, T.; Ader, T.; Bluemle, F.; Bohnhoff, M.; Chendorain, M.; Dresen, G.; Heikkinen, P.; Kukkonen, I.; Leary, P.; et al. Controlling fluid-induced seismicity during a 6.1-km-deep geothermal stimulation in Finland. Sci. Adv. 2019, 5, eaav7224. [Google Scholar] [CrossRef]
- Majer, E.L.; Baria, R.; Stark, M.; Oates, S.; Bommer, J.; Smith, B.; Asanuma, H. Induced seismicity associated with enhanced geothermal systems. Geothermics 2007, 36, 185–222. [Google Scholar] [CrossRef]
- Cheng, Y.; Xu, T.; Zhang, Y.; Shangguan, S.; Feng, B. An laboratorial investigation of induced seismicity characteristics in EGS hydraulic fracturing. Geothermics 2022, 105, 102482. [Google Scholar] [CrossRef]
- Liu, Y.; Xu, T.; Yuan, Y.; Feng, B.; Tang, X.; Liu, X.; Cui, Z. A laboratory study on fracture initiation and propagation of granite under cyclic-injection hydraulic fracturing. J. Pet. Sci. Eng. 2022, 212, 110278. [Google Scholar] [CrossRef]
- Walsh, F.R., III; Zoback, M.D. Oklahoma’s recent earthquakes and saltwater disposal. Sci. Adv. 2015, 1, e1500195. [Google Scholar] [CrossRef]
- Kolawole, F.; Johnston, C.S.; Morgan, C.B.; Chang, J.C.; Marfurt, K.J.; Lockner, D.A.; Reches, Z.; Carpenter, B.M. The susceptibility of Oklahoma’s basement to seismic reactivation. Nat. Geosci. 2019, 12, 839–844. [Google Scholar] [CrossRef]
- Kivi, I.R.; Vilarrasa, V.; Kim, K.-I.; Yoo, H.; Min, K.-B. On the role of poroelastic stressing and pore pressure diffusion in discrete fracture and fault system in triggering post-injection seismicity in enhanced geothermal systems. Int. J. Rock Mech. Min. Sci. 2024, 175, 105673. [Google Scholar] [CrossRef]
- Rathnaweera, T.D.; Wu, W.; Ji, Y.; Gamage, R.P. Understanding injection-induced seismicity in enhanced geothermal systems: From the coupled thermo-hydro-mechanical-chemical process to anthropogenic earthquake prediction. Earth-Sci. Rev. 2020, 205, 103182. [Google Scholar] [CrossRef]
- Liu, Y.; Hu, Z.; Xu, T.; Feng, B.; Yuan, Y.; Xing, P. Discrete element modeling for the multistage hydraulic stimulation of a horizontal well in hot dry rock. Comput. Geotech. 2023, 156, 105274. [Google Scholar] [CrossRef]
- McGarr, A. Seismic moments and volume changes. J. Geophys. Res. 1976, 81, 1487–1494. [Google Scholar] [CrossRef]
- Nadimi, S.; Forbes, B.; Moore, J.; McLennan, J.D. Effect of natural fractures on determining closure pressure. J. Pet. Explor. Prod. Technol. 2020, 10, 711–728. [Google Scholar] [CrossRef]
- Xing, P.; McLennan, J.; Moore, J. In-Situ Stress Measurements at the Utah Frontier Observatory for Research in Geothermal Energy (FORGE) Site. Energies 2020, 13, 5842. [Google Scholar] [CrossRef]
- Hu, Z.; Xu, T.; Moore, J.; Feng, B.; Liu, Y.; McLennan, J.; Yang, Y. Investigation of the effect of different injection schemes on fracture network patterns in hot dry rocks—A numerical case study of the FORGE EGS site in Utah. J. Nat. Gas Sci. Eng. 2022, 97, 104346. [Google Scholar] [CrossRef]
- Riahi, A.; Pettitt, W.; Damjanac, B.; Varun; Blanksma, D. Numerical Modeling of Discrete Fractures in a Field-Scale FORGE EGS Reservoir. Rock Mech. Rock Eng. 2019, 52, 5245–5258. [Google Scholar] [CrossRef]
- Niemz, P.; McLennan, J.; Pankow, K.L.; Rutledge, J.; England, K. Circulation experiments at Utah FORGE: Near-surface seismic monitoring reveals fracture growth after shut-in. Geothermics 2024, 119, 102947. [Google Scholar] [CrossRef]
- Li, Z.; Yang, Z.; Wu, Y.; Yu, B.; Wang, D.; Wang, Y. Study on the migration characteristics of temporary plugging agents in hot dry rock fractures considering ambient temperature field variations. Phys. Fluids 2024, 36, 093320. [Google Scholar] [CrossRef]
Disclaimer/Publisher’s Note: The statements, opinions and data contained in all publications are solely those of the individual author(s) and contributor(s) and not of MDPI and/or the editor(s). MDPI and/or the editor(s) disclaim responsibility for any injury to people or property resulting from any ideas, methods, instructions or products referred to in the content. |
© 2025 by the authors. Licensee MDPI, Basel, Switzerland. This article is an open access article distributed under the terms and conditions of the Creative Commons Attribution (CC BY) license (https://creativecommons.org/licenses/by/4.0/).