Abstract
The dual-pulse heterodyne demodulation distributed acoustic sensing (HD-DAS) system has superior performance but is fundamentally limited by the short sensing range, which poses a significant obstacle to its application in long-distance monitoring. This paper proposes and experimentally demonstrates a novel binary-tree structure DAS (BTS-DAS) aimed at overcoming this critical limitation. By physically decoupling the long-distance transmission fiber from the final sensing part, this structure effectively expands the system’s remote sensing capability without compromising the high pulse repetition rate for high-performance measurement. We identified modulation instability (MI), rather than stimulated Brillouin scattering (SBS), as the dominant nonlinear noise source in the extended fiber chain. Through careful power management, we established an optimal launch power window. The practical feasibility of the system was verified during on-site testing, where vibrations were successfully detected over a 10 km transmission link with sensing occurring in the 250 m sensing fiber segment, achieving a low background noise of −59.79 dB ref rad/. This work presents a robust and scalable solution for long-range, high-performance acoustic sensing.
1. Introduction
Distributed acoustic sensing (DAS) technology has been developed as a powerful tool for continuously monitoring acoustic and vibration signals along an optical fiber. Its unique distributed monitoring capabilities have led to extensive research and applications in recent years. A key advantage of DAS systems is their simple structure, utilizing an optical cable as the sensing unit, which significantly reduces system costs and simplifies installation.
DAS technology is currently widely used in the energy industry and geophysical exploration. In the energy industry, its applications include hydraulic fracturing monitoring [1], vertical seismic profiling exploration [2], oil well integrity assessment [3], down-hole fluid monitoring [4], and pipeline intrusion monitoring [5]. Within geophysical exploration, DAS is used for monitoring ocean-solid earth interactions [6], and for detecting earthquake and volcanic events [7,8]. Additionally, DAS has found utility in near-surface characterization, using urban road vehicles as sound sources [9].
The fundamental principle of DAS is to use an optical fiber, typically several kilometers long, as a distributed sensor. This fiber is laid along the structure to be monitored, and acoustic or vibration signals, such as those generated by intruders or earthquakes, induce small longitudinal length changes in the fiber. These longitudinal strains are detected by analyzing Rayleigh back-scattered light when highly coherent pulsed lights are injected into the fiber. Phase variations of the injected light at different fiber positions can be retrieved using various demodulation approaches, including unbalanced interferometry with a 3 × 3 coupler [10], phase-generated carrier algorithms [11], quadrature detection [12], and time-gated digital optical frequency domain reflectometry [13]. The retrieved phase signal is directly proportional to the strain induced by the external acoustic field.
Recently, we proposed a dual-pulse heterodyne demodulation DAS (HD-DAS) system in which two pulses, offset in both time and frequency domains, functioning similarly as the sensing and reference arms of an interferometer. This configuration allows each position on the fiber to be regarded as an independent sensor [14]. As these two pulses propagate along the same fiber, environmental noises are self-referenced, leading to a low noise floor and a high signal-to-noise ratio (SNR) [15]. However, to achieve this high signal quality, HD-DAS systems typically require a high sample frequency, which inherently limits the sensing length. To avoid signal aliasing, the repetition rate of the pulse and the fiber length must satisfy the relationship
where c is the speed of light in vacuum, and n is the mode index of the fiber. In typical HD-DAS system, a heterodyne frequency of 10 kHz and a pulse repetition rate of 40 kHz are used for good signal quality, restricting the maximum sensing fiber length to 2500 m. This inherent limitation severely limits the use of HD-DAS in applications that require both high-performance and long-distance coverage, such as deep-well seismic monitoring, long-haul pipeline security, and large-scale seismological research.
To overcome this distance limitation, researchers have explored several advanced techniques. Chen et al. adopted a scheme based on time-gated digital optical frequency domain reflectometry combined with bidirectional distributed Raman amplification to extend the sensing distance to 108 km. In order to suppress crosstalk, the scheme also pre-distorted the shape of the light pulse to a standard Hanning window, providing a theoretical peak-side lobe ratio of 46 dB [16]. Xiong et al. combined positive and negative frequency multiplexing together with frequency division multiplexing to break the inherent trade-off between sensing distance and scan rate. As a result, a scan rate of 21.6 kHz was experimentally achieved on a 103 km fiber [17]. Corera et al. achieved long-distance sensing by using optimized settings that include pulse compression, enabling the measurement of vehicle passage events using dark fiber in a telecommunication fiber cable running in buried conduit along 40 km of a road open to traffic [18]. Wang et al. used complex pulse compression and coding techniques to break the inherent trade-off between spatial resolution and sensing distance, and achieved ultra-high side-lobe suppression ratio through multi-phase coding modulation to effectively suppress Rayleigh side-lobe noise, achieving a spatial resolution of 2 m over an ultra-long distance of 204.3 km [19].
Different from the aforementioned technologies that rely on distributed optical amplification, complex pulse coding, or advanced digital compensation algorithms, this paper proposes and experimentally demonstrates a novel binary-tree structure DAS (BTS-DAS). By physically decoupling the long-distance transmission fiber from the sensing fiber, this structure allows probe pulses to travel over extended distances to a remote sensing location without violating Equation (1), thereby breaking the conventional trade-off between performance and sensing range.
In this paper, we present the principle of the BTS-DAS. We conducted a systematic study on the performance of the system in extending fiber chain, identifying and mitigating the impact of nonlinear noise, particularly modulation instability (MI). Finally, we demonstrated the practical feasibility of the optimized system through an on-site test and successfully achieved high-performance vibration sensing over a 10 km fiber chain. This study provides a robust and scalable approach for deploying high-performance DAS across a wide geographic area.
2. Materials and Methods
2.1. Principle of the BTS-DAS
The proposed BTS-DAS is designed to overcome the range-performance trade-off defined in Equation (1). The principle of this structure is to physically separate the long-distance pulse transmission path from the sensing path. As schematically illustrated in Figure 1, the system is composed of an interrogator unit connected to a series of daisy-chained optical fiber cables (OFCs). Within this chain, optical circulators (CIRs) in the cable connectors (CCs) are used to create nodes. A long-distance “trunk” optical fiber (e.g., within ) serves as a transmission path, delivering the probe pulses to a remote location. A circulator () then directs these pulses into a designated “branch” fiber, which acts as the sensing fiber (e.g., within ). The Rayleigh back-scattered light, which carries the acoustic information from the sensing fiber, is then collected by the same circulator and routed back to the interrogator through a separate return fiber (). This design allows the probe pulses to travel over an extended distance to the sensing region without the round-trip time exceeding the pulse interval (), thus enabling long-range sensing without sacrificing the high pulse repetition rate required for HD-DAS.
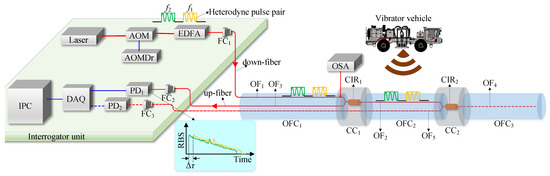
Figure 1.
Schematic diagram of the BTS-DAS. AOM, acousto-optic modulator; AOMDr, AOM driver; EDFA, Erbium doped fiber amplifier; OSA, optical spectrum analyzer; FC, fiber connector; Cir, circulator; OF, optical fiber; OFC, optical fiber cable; CC, cable connector; PD, photo-detector; DAQ, data acquisition card; IPC, industrial personal computer; RBS, Rayleigh back-scattered light. Red lines represent optical fibers and blue lines represent electrical wires. The dashed lines represent the extensible parts.
As shown in Figure 1, the sensing chain forms a binary-tree structure, with circulators as nodes and optical fibers as branches. By adding nodes and branches, the sensing chain can be further expanded, as the dashed lines in Figure 1 show. In this situation, severs both as transmission and sensing fiber. directs the light pulses into a new “branch” fiber, , which acts as the sensing fiber. The Rayleigh back-scattered light is then routed back to the interrogator through a new return fiber ().
2.2. Experimental Setup and Procedures
The experimental system, schematically illustrated in Figure 1, consists of an interrogator unit and a sensing chain. Within the interrogator unit, a narrow line-width continuous wave (CW) laser (NKT Koheras MIKRO E15, Birkerød, Denmark) serves as the light source. The light beam is modulated by an acousto-optic modulator (AOM) (China Electronics Technology Group Corporation 26th Research Institute, Chongqing, China), driven by an AOM driver (AOMDr) (self-developed), to generate a heterodyne pulse pair (as shown by the orange and green pulses in the figure). These two pulses are offset in both the time and frequency domains. Specifically, the pulses have a time-domain width of = 30 ns with a time delay of = 50 ns. The frequency shift of the two pulses is = 100 MHz and = 100.01 MHz, resulting in a heterodyne frequency of = 10 kHz, and the pulse pair is generated at a repetition rate () of 40 kHz. The pulse pair is amplified by an Erbium doped fiber amplifier (EDFA) (Xiamen Beogold Technology Co., Ltd., Xiamen, China) before being injected into the optical fiber through a fiber connector (). The heterodyne pulse pair will cause Rayleigh scattering during transmission in , and the Rayleigh back-scattered light from is directed to the photo-detector () via , and a fiber connector () (SEIKOH GIKEN Co., Ltd., Matsudo, Japan). As the insert figure in Figure 1 shows, the Rayleigh back-scattered light (RBS) from pulse 1 (orange curve) and pulse 2 (green curve) will superimpose and interfere at , forming a heterodyne interference signal. The collected signal is sampled by a high-speed data acquisition card (DAQ) at a sampling rate of = 100 MS/s and subsequently transmitted to an industrial personal computer (IPC) for signal processing.
Two sets of experiments, thus two sensing chains, were conducted to characterize and validate the proposed system.
2.2.1. System Noise Optimization
In this experiment, bare single mode fibers (G.652) were used. As shown in Figure 1, the sensing chain consisted of , , , and . The pulse pair generated by the interrogator was injected into (labeled as down-fiber) via . was connected at the end of to guide the light into . The Rayleigh back-scattered light from was then directed through (labeled as up-fiber) to the interrogator via . This configuration means and function as transmission fibers, while acts as sensing fiber.
To determine the optimal optical power for balancing SNR and nonlinear effects, a laboratory experiment was performed. A 350 m length of fiber was used as the sensing fiber (). The length of the transmission fibers ( and ) were varied among three configurations: 2 km (actual length 2.026 km), 4 km (actual length 3.986 km), and 6 km (actual length 6.012 km). For each configuration, the pump current of the EDFA was incrementally increased from 50 mA to 100 mA. At each step, the output optical power of EDFA and was measured using an optical power meter, while the output spectrum of is measured using an optical spectrum analyzer (OSA), and the noise floor of the demodulated phase signal was calculated from the power spectral density (PSD).
2.2.2. On-Site Test Validation
To demonstrate the system’s performance in a practical scenario, an on-site test was conducted. In this experiment, two steel wire armored optical cables were used. As shown in Figure 1, the sensing chain consisted of (contains and ) and (contains ), and (contains ) was used to connect the two cables. The pulse pair generated by the interrogator was injected into (labeled as down-fiber) via . was connected at the end of to guide the light into . The Rayleigh back-scattered light from was then directed through (labeled as up-fiber) to the interrogator via .
The setup utilized a length of 10 km (actual length of the fiber is 9.960 km) transmission cable () and a 250 m (actual length of the fiber is 250 m) sensing cable (). The sensing cable () was directly placed on the ground and a controlled vibration source (a vibrator vehicle) was operated near the sensing cable to generate acoustic signals. The system recorded the vibration data to evaluate its real-world detection capability and performance over an extended range.
3. Results and Discussion
3.1. System Optimization and Noise Characterization
3.1.1. Impact of Pump Power on System Noise
Due to the inherently low intensity of Rayleigh scattering, the primary challenge in extending the range of a DAS system is delivering sufficient optical power to the remote sensing fiber. However, excessively strong light can lead to undesirable nonlinear effects, such as stimulated Brillouin scattering (SBS) and MI, which can degrade the quality of the optical signal. Fiber length is an important parameter for the occurrence of nonlinear effects, therefore, a primary objective was to determine the optimal optical signal settings for the system.
The relationship between the EDFA pump current and system noise was first investigated and Figure 2 shows the output power of the EDFA and at different fiber lengths as the pump current increases. As can be seen, the output power increases with the pump current. The threshold of the EDFA was about 58 mA. Notably, when the length of the transmission fiber was 6 km, a more significant decrease in output power was observed, indicating the generation of nonlinear optical phenomena. From Figure 2, the relationship between the pump current () and the output power () of the EDFA can be expressed as:
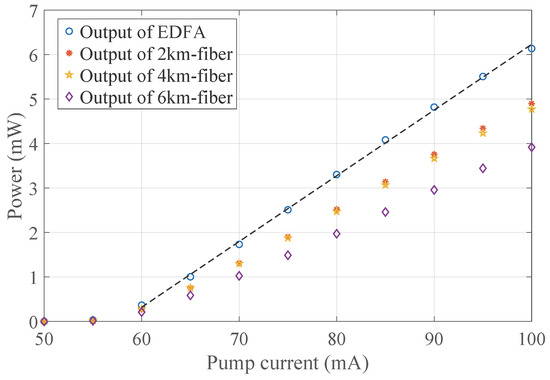
Figure 2.
The output power of the EDFA and with different length when the pump current of the EDFA increase.
The demodulated phase noise of the system was measured while the 350 m sensing fiber () was kept in a quiet, vibration-isolated state. Figure 3 shows the waterfall plot of the phase noise for a 4 km transmission fiber as the EDFA pump current was varied. Obvious signals in Figure 3 thus represent noise. A distinct, non-monotonic relationship between pump power and noise is evident. At a low pump current of 60 mA, the system exhibits a high noise floor. As the current increases into the 70–75 mA range, the noise level is significantly suppressed, resulting in a much cleaner output. However, as the pump current is further increased beyond 90 mA, the noise began to significantly increase, indicating the emergence of power-dependent noise mechanism.
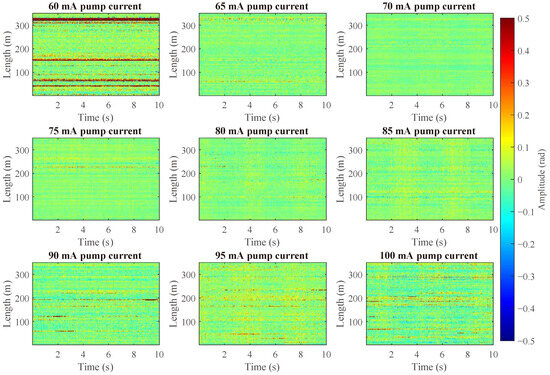
Figure 3.
The waterfall plots of the demodulated phase noise when the pump current of the EDFA changes. Warmer color (red) and cooler color (blue) indicate higher noise, while green color indicates lower noise.
To quantify this behavior, the power spectral density (PSD) of the phase noise was calculated for each pump current setting. Figure 4a–c show the averaged PSD for transmission fibers of 2 km, 4 km, and 6 km, respectively. The low-frequency peaks (e.g., 26.6 Hz and its harmonics) in these figures typically originate from ambient low-frequency vibrations (e.g., vibrations generated by air conditioning operation), which are independent of the optical nonlinear effects. The noise floor, averaged over the 100 Hz to 1000 Hz frequency band, is plotted as a function of pump current in Figure 4d and summarized in Table 1.
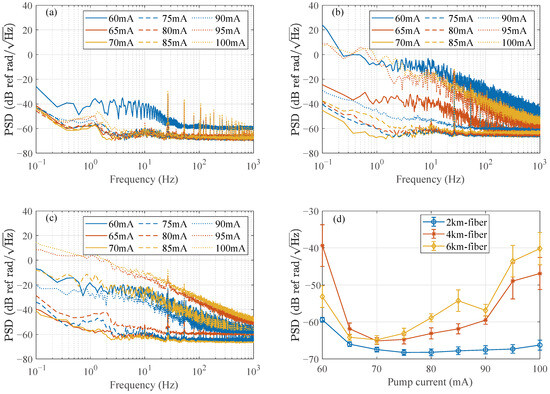
Figure 4.
The power spectrum density (PSD) of the demodulated phase noise with different fiber length. (a–c) show the PSD of the demodulated phase noise under different pump current when are 2 km, 4 km, and 6 km, respectively. (d) The noise floor of different fiber length when the pump current changes. The error bar is obtained by calculating the standard deviation of the PSD over the 100 Hz to 1000 Hz frequency band. The unit of the Y-axis in the figure is dB ref rad/, which means 1 rad/ corresponds to 0 dB.

Table 1.
The noise floor of different fiber length when the pump current changes.
These results demonstrate an optimal operating window for the pump current. At low power levels (<65 mA), the noise is high because weak Rayleigh back-scattered light is difficult to overcome the electronic noise of photo-detector and the amplified spontaneous emission (ASE) noise of EDFA, resulting in a low SNR. On the contrary, at high power levels (>90 mA), the noise floor deteriorates rapidly. This high-power noise is a characteristic of nonlinear optical effects in long transmission fiber.
3.1.2. Identification of the Dominant Nonlinear Effect
To identify the source of the high-power noise, we first analyzed the optical spectrum of the light after propagating through the transmission fiber (). As shown in Figure 5a–c, significant spectral broadening is observed as the pump current increases. The common nonlinear effects in optical fibers are stimulated Brillouin scattering (SBS) and modulation instability (MI), which can lead to severe power loss and excessive phase noise.
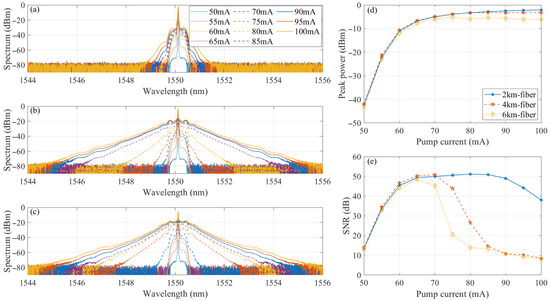
Figure 5.
Optical spectrum of the output light of with different lengths versus the pump current. (a) The length of was 2 km. (b) The length of was 4 km. (c) The length of was 6 km. (d) Peak power of the spectrum under different pump current. (e) SNR of the spectrum under different pump current.
The SBS threshold power () can be expressed as [20,21]:
where m/W is the Brillouin gain coefficient, is the effective mode field area, and is the effective length with = 0.2 dB/km being the fiber loss. and are the linewidths of pump light and Stokes light, respectively. is usually in the MHz range, while the linewidth of the narrow linewidth laser is below the kHz range. Therefore, the last term in Equation (3) can be approximated as 1. Table 2 shows the SBS threshold power of different fiber length L. The power used in the experiment is lower than this threshold, so there is no stimulated Brillouin scattering.
Table 2.
The SBS threshold power and effective length of different fiber length L.
Another nonlinear effect in optical fiber that significantly affects sensing performance is MI. When weak periodic disturbances grow exponentially at the cost of strong carriers, MI occurs. This leads to the generation of temporal periodic patterns and the formation of spectral symmetric sidebands on both sides of the carrier frequency, ultimately resulting in the splitting of the original wave itself [22]. When a strong pump wave propagates alone in an optical fiber, MI is induced by ASE noise within the MI gain bandwidth, which is called spontaneous MI. The occurrence of spontaneous MI can lead to severe power depletion of the center frequency light and the generation of symmetrical sidebands, thereby reducing the SNR. The inherent incoherent and fluctuating nature of ASE noise makes the spontaneous MI sidebands essentially incoherent and unstable. As a result, the transmitted light becomes incoherent and is severely affected by fluctuations, which brings serious noise to the fiber optic sensing system [23].
As shown in Figure 5a–c, significant spectral broadening is observed as the pump current increases, which is a classic signature of MI. Figure 5d,e calculates the peak power and SNR of the spectrum shown in Figure 5a–c. This SNR definition is used to quantitatively analyze the spectral degradation caused by MI in the transmission fiber. Since the input optical pulse has an extremely narrow linewidth, its power should be concentrated around the center wavelength. MI is characterized by the transfer of power from the carrier (signal) to symmetrical sidebands (noise). Therefore, in the process of calculating the SNR, a bandwidth of 1.2 nm around the center wavelength (1550.12 nm) is used as the signal while the rest is as the noise, to quantitatively measure the degree of optical power transfer from the primary carrier to the incoherent noise sidebands due to MI. It can be seen that as the pump current increases, the peak power of the output light tends to a constant value, indicating that the MI effect causes the carrier power to gradually shift towards the sideband. It can also be seen from the SNR that the highest SNR can be obtained at a pump current of 65–70 mA. As the pump current and transmission fiber length increase, the SNR rapidly decreases, which is caused by the MI effect.
The optimization process is a matter of finding the “sweet spot”: a pump power high enough to ensure a strong signal well above the electronic and ASE noise floor, but low enough to avoid triggering significant MI. From Figure 4d and Figure 5e, the optimal pump current for the system was found to be 70 mA.
3.2. On-Site Demonstration of Extended-Range Vibration Sensing
To validate the performance of the optimized system in a real-world application, a field test was conducted. The system was configured with a 9.960 km transmission fiber link leading to a 250 m armored sensing cable placed on the ground (as depicted in Figure 1). Figure 4d shows that as the length of the transmission fiber increases, the optimal pump current approaches 70 mA. For example, for a transmission fiber of 6 km, the minimum noise floor is −64.81 dB when the pump current is 70 mA. Therefore, the choice of 70 mA was made to provide a robust margin for the 9.960 km length. Although the MI threshold for the 9.960 km transmission fiber will be slightly lower than that for 6 km, the laboratory findings indicate that setting the EDFA pump current to 70 mA is a conservative and robust setting that maintains sufficient SNR while successfully avoiding the severe performance degradation caused by MI.
First, we measured the background noise of the system in the on-site environment. Figure 6a shows the waterfall plot of the demodulated phase noise, which is stable and uniform across the sensing cable. The PSD of this phase noise, shown in Figure 6b, reveals a low noise floor of approximately −59.79 dB ref rad/. This low noise level, achieved over a long transmission distance, confirms the effectiveness of our power optimization strategy.
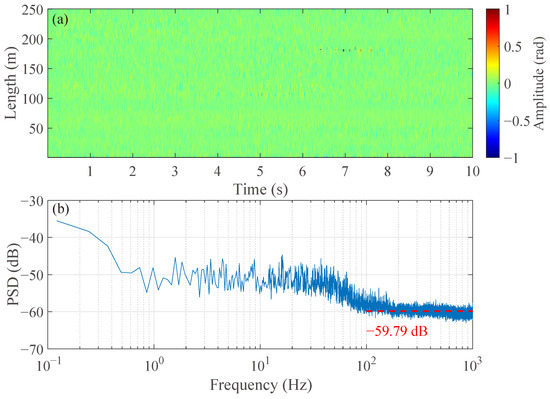
Figure 6.
Background noise of the system in the on-site environment. (a) The waterfall plot of the demodulated phase noise. (b) The PSD of the demodulated phase noise.
Next, a vibrator vehicle was driven near the sensing cable to generate a controlled acoustic signal (frequency increasing from 10 Hz to 80 Hz within 10 s). The system successfully detected the resulting ground vibrations, as shown in Figure 7. The waterfall plot (Figure 7a) clearly shows the acoustic event propagating in time and space along the cable. A time-domain signal from a single trace of 230 m (Figure 7b) displays a clear and coherent waveform. The corresponding synchrosqueezed wavelet transform [24] of this signal (Figure 7c) shows distinct frequency peaks related to the vibrator’s engine, demonstrating the system’s ability to capture the spectral characteristics of the acoustic source. While only one vibrator test analysis is shown (Figure 7), this test is sufficient to demonstrate the system’s basic functionality and high fidelity at the 9.960 km far-end (clear waterfall plot, coherent time-domain waveform, and accurate frequency identification). During on-site deployment, careful management of connectors and splices is required to reduce the impact of long-distance cable connection losses on the optical power budget.
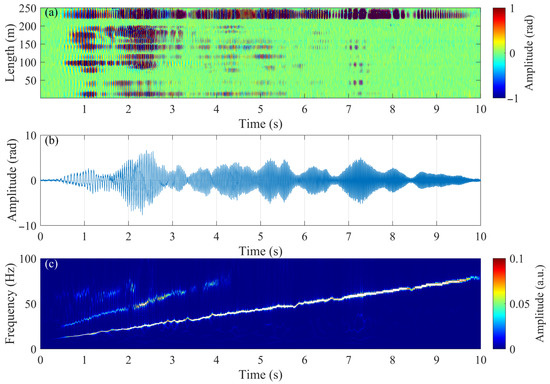
Figure 7.
The on-site test result. (a) The waterfall plot of the demodulated vibration signal. (b) The time-domain signal of one trace (230 m). (c) The synchrosqueezed wavelet transform of (b).
These field results conclusively demonstrate that the proposed binary-tree structure, when properly optimized, can successfully perform high-fidelity distributed acoustic sensing over distances far exceeding the limits of conventional HD-DAS systems.
4. Conclusions
In this work, we have successfully addressed the critical range limitation inherent in HD-DAS systems. Conventional HD-DAS faces an inevitable trade-off between high performance (requiring a high pulse repetition rate) and long sensing range. To resolve this, we proposed and experimentally validated a novel BTS-DAS. This innovative design decouples the long-distance transmission fiber from the sensing fiber, enabling the extension of the sensing range without compromising the system’s high repetition rate.
A key contribution of this study was the systematic investigation and optimization of the system’s optical power. We demonstrated that for extended fiber chains, the primary performance-limiting factor at high power levels is MI, rather than the more commonly considered SBS. Through detailed experimental analysis, we identified an optimal EDFA pump power operating window that successfully balances the need for a strong signal against the occurrence of MI-induced noise.
The practical viability of the proposed system was demonstrated through an on-site test. Utilizing a 9.960 km transmission fiber, the system successfully detected and characterized vibrations from a vibrator vehicle with a low background noise floor of −59.79 dB ref rad/. This result confirms that our BTS-DAS maintains high fidelity in a real-world environment.
It should be emphasized that the 250 m sensing fiber used in the field test was selected to represent a local monitoring section, and the longest length of the sensing section can be 2500 m. As shown in Figure 1, the advantage of the BTS structure is its potential to use optical circulators to achieve multi-node sensing. The focus of this experiment is to verify the range extension capability and nonlinear noise management under a single node. In future research, we will investigate multi-node integration.
In summary, the proposed binary-tree structure, combined with a rigorous power optimization methodology, provides an effective and robust solution for long-range, high-performance distributed acoustic sensing. This work paves the way for the application of HD-DAS technology in fields requiring both high resolution and extensive coverage, such as deep-well seismic monitoring, long-haul pipeline security, and large-scale seismological research.
Author Contributions
Conceptualization, X.H. and Z.C.; methodology, X.H.; validation, X.H. and Z.C.; investigation, X.H. and M.Z.; data curation, X.H.; writing—original draft preparation, X.H.; writing—review and editing, Z.C. and M.Z.; visualization, X.H.; supervision, H.L.; funding acquisition, H.L. All authors have read and agreed to the published version of the manuscript.
Funding
This research was funded by the financial support from China Geological Survey grant number DD20221703.
Data Availability Statement
The raw data supporting the conclusions of this article will be made available by the authors on request.
Conflicts of Interest
Author Zhi Cao was employed by the company CNPC Offshore Engineering Company Limited. The remaining authors declare that the research was conducted in the absence of any commercial or financial relationships that could be construed as a potential conflict of interest.
References
- Ichikawa, M.; Uchida, S.; Katou, M.; Kurosawa, I.; Tamura, K.; Kato, A.; Ito, Y.; de Groot, M.; Hara, S. Case study of hydraulic fracture monitoring using multiwell integrated analysis based on low-frequency DAS data. Lead. Edge 2020, 39, 794–800. [Google Scholar] [CrossRef]
- Titov, A.; Jin, G.; Binder, G.; Tura, A. Distributed acoustic sensing time-lapse vertical seismic profiling during zipper-fracturing operations: Observations, modeling, and interpretation. Geophysics 2022, 87, B329–B336. [Google Scholar] [CrossRef]
- Vasco, D.W.; Daley, T.M.; Tribaldos, V.R.; Marchesini, P.; Hoversten, G.M.; Mali, G.; Bevc, D.; Korneev, V. Seismic monitoring of well integrity. Lead. Edge 2022, 41, 134–139. [Google Scholar] [CrossRef]
- Weber, G.H.; dos Santos, E.N.; Gomes, D.F.; Santana, A.L.B.; da Silva, J.C.C.; Martelli, C.; Pipa, D.R.; Morales, R.E.M.; de Camargo Júnior, S.T.; da Silva Junior, M.F.; et al. Measurement of Gas-Phase Velocities in Two-Phase Flow Using Distributed Acoustic Sensing. IEEE Sens. J. 2023, 23, 3597–3608. [Google Scholar] [CrossRef]
- Peng, Z.; Jian, J.; Wen, H.; Gribok, A.; Wang, M.; Liu, H.; Huang, S.; Mao, Z.H.; Chen, K.P.; Chen, K.P. Distributed fiber sensor and machine learning data analytics for pipeline protection against extrinsic intrusions and intrinsic corrosions. Opt. Express 2020, 28, 27277–27292. [Google Scholar] [CrossRef]
- Lindsey, N.J.; Dawe, T.C.; Ajo-Franklin, J.B. Illuminating seafloor faults and ocean dynamics with dark fiber distributed acoustic sensing. Science 2019, 366, 1103–1107. [Google Scholar] [CrossRef]
- Lior, I.; Rivet, D.; Ampuero, J.P.; Sladen, A.; Barrientos, S.; Sánchez-Olavarría, R.; Opazo, G.A.V.; Prado, J.A.B. Magnitude estimation and ground motion prediction to harness fiber optic distributed acoustic sensing for earthquake early warning. Sci. Rep. 2023, 13, 424. [Google Scholar] [CrossRef]
- Jousset, P.; Currenti, G.; Schwarz, B.; Chalari, A.; Tilmann, F.; Reinsch, T.; Zuccarello, L.; Privitera, E.; Krawczyk, C.M. Fibre optic distributed acoustic sensing of volcanic events. Nat. Commun. 2022, 13, 1753. [Google Scholar] [CrossRef] [PubMed]
- Yuan, S.; Lellouch, A.; Clapp, R.G.; Biondi, B. Near-surface characterization using a roadside distributed acoustic sensing array. Lead. Edge 2020, 39, 646–653. [Google Scholar] [CrossRef]
- Masoudi, A.; Newson, T.P. High spatial resolution distributed optical fiber dynamic strain sensor with enhanced frequency and strain resolution. Opt. Lett. 2017, 42, 290–293. [Google Scholar] [CrossRef]
- Fang, G.; Xu, T.; Feng, S.; Li, F. Phase-Sensitive Optical Time Domain Reflectometer Based on Phase-Generated Carrier Algorithm. J. Light. Technol. 2015, 33, 2811–2816. [Google Scholar] [CrossRef]
- Gabai, H.; Botsev, Y.; Hahami, M.; Eyal, A. Optical frequency domain reflectometry at maximum update rate using I/Q detection. Opt. Lett. 2015, 40, 1725–1728. [Google Scholar] [CrossRef]
- Chen, D.; Liu, Q.; He, Z. Phase-detection distributed fiber-optic vibration sensor without fading-noise based on time-gated digital OFDR. Opt. Express 2017, 25, 8315–8325. [Google Scholar] [CrossRef]
- He, X.; Xie, S.; Liu, F.; Cao, S.; Gu, L.; Zheng, X.; Zhang, M. Multi-event waveform-retrieved distributed optical fiber acoustic sensor using dual-pulse heterodyne phase-sensitive OTDR. Opt. Lett. 2017, 42, 442–445. [Google Scholar] [CrossRef]
- He, X.; Wu, X.; Wang, L.; Liang, Q.; Gu, L.; Liu, F.; Lu, H.; Zhang, Y.; Zhang, M. Distributed optical fiber acoustic sensor for in situ monitoring of marine natural gas hydrate production for the first time in the Shenhu area, China. China Geol. 2022, 5, 322–329. [Google Scholar] [CrossRef]
- Chen, D.; Liu, Q.; He, Z. 108-km Distributed Acoustic Sensor with 220-p/ Strain Resolution and 5-m Spatial Resolution. J. Light. Technol. 2019, 37, 4462–4468. [Google Scholar] [CrossRef]
- Xiong, J.; Wang, Z.; Wu, Y.; Wu, H.; Rao, Y. Long-distance distributed acoustic sensing utilizing negative frequency band. Opt. Express 2020, 28, 35844–35856. [Google Scholar] [CrossRef]
- Corera, I.; Piñeiro, E.; Navallas, J.; Sagues, M.; Loayssa, A. Long-Range Traffic Monitoring Based on Pulse-Compression Distributed Acoustic Sensing and Advanced Vehicle Tracking and Classification Algorithm. Sensors 2023, 23, 3127. [Google Scholar] [CrossRef]
- Wang, P.; Zhang, H.; Chen, J.; Guo, P.; Wang, Y.; Liu, X.; Jin, B. Ultra-Long Range Distributed Acoustic Sensor Using Poly-Phase Coding Approach. J. Light. Technol. 2024, 42, 2595–2603. [Google Scholar] [CrossRef]
- Mao, X.; Tkach, R.; Chraplyvy, A.; Jopson, R.; Derosier, R. Stimulated Brillouin threshold dependence on fiber type and uniformity. IEEE Photonics Technol. Lett. 1992, 4, 66–69. [Google Scholar] [CrossRef]
- He, X.; Xie, S.; Cao, S.; Liu, F.; Zheng, X.; Zhang, M.; Yan, H.; Chen, G. Influence of stimulated Brillouin scattering on positioning accuracy of long-range dual Mach-Zehnder interferometric vibration sensors. Opt. Eng. 2016, 55, 116111. [Google Scholar] [CrossRef]
- Perego, A.M. Complexity of modulation instability. Phys. Rev. Res. 2022, 4, L022057. [Google Scholar] [CrossRef]
- Hu, X.; Chen, W.; Lu, Y.; Chen, M.; Meng, Z. Suppression of spontaneous modulation instability and phase noise with a coherent seed in the interferometric fiber sensing systems. Opt. Lett. 2018, 43, 3642–3645. [Google Scholar] [CrossRef] [PubMed]
- Daubechies, I.; Lu, J.; Wu, H.T. Synchrosqueezed wavelet transforms: An empirical mode decomposition-like tool. Appl. Comput. Harmon. Anal. 2011, 30, 243–261. [Google Scholar] [CrossRef]
Disclaimer/Publisher’s Note: The statements, opinions and data contained in all publications are solely those of the individual author(s) and contributor(s) and not of MDPI and/or the editor(s). MDPI and/or the editor(s) disclaim responsibility for any injury to people or property resulting from any ideas, methods, instructions or products referred to in the content. |
© 2025 by the authors. Licensee MDPI, Basel, Switzerland. This article is an open access article distributed under the terms and conditions of the Creative Commons Attribution (CC BY) license (https://creativecommons.org/licenses/by/4.0/).