Abstract
This study uniquely integrates physiological and subjective data to predict comfort. To optimize lighting conditions in art galleries, this study investigates the interactive effects of painting tones (cool, medium, warm) and illuminance levels (50, 150, 300 lx) on visual comfort. Using decorative paintings as experimental stimuli, 30 participants were exposed to nine distinct lighting scenarios. Subjective questionnaires and eye-tracking data were collected to establish five predictive models. An additional cohort of 10 participants served as an external validation set. Results indicate that the interaction between tone and illuminance exerts a significant influence on comfort. The optimal combinations identified were cool tone + 50 lx, warm tone + 150 lx, and medium tone + 300 lx. Among the models, XGBoost demonstrated superior predictive performance (R2 = 0.928 in the test set; R2 = 0.884 in external validation). SHAP analysis revealed that the coefficient of variation in pupil diameter was the most critical predictor, followed by fixation count and related features. Both global and individual feature contributions to comfort were elucidated, offering a robust scientific foundation for the precise regulation of lighting environments in art galleries.
1. Introduction
In the contemporary era of flourishing cultural and artistic development, art museums, as central venues for artistic exhibition and cultural dissemination, rely heavily on the quality of their displayed works to shape the audience’s experience. The color tones of a painting encapsulate the artist’s emotional expression and creative intent, serving as the visual core through which artistic connotations are conveyed. Illuminance, as a fundamental parameter of the lighting environment, regulates visual perception [1], directly influencing the eye’s capacity to discern fine details and the degree of visual fatigue. Crucially, tone and illuminance do not function independently; their interaction shapes visual comfort through intertwined physiological and psychological pathways. Harmonious combinations of illuminance and tone allow viewers to immerse themselves more fully in the details and atmosphere of the artwork, whereas unsuitable pairings may induce visual fatigue, emotional strain, and even diminish the audience’s comprehension of the work’s meaning [2]. With the continual refinement of public aesthetic standards, audiences now demand not only visibility but also a comfortable, immersive viewing experience. At the same time, art galleries are advancing toward digitalization and diversification, and the innovation of exhibition formats further underscores the challenge of aligning the light environment with artistic presentation. In this context, reliance solely on experience-based lighting design is insufficient [3]. A rigorous analysis of the interaction mechanisms between painting tones and illuminance, coupled with the establishment of a scientific system for assessing visual comfort, has thus become pivotal in transforming lighting design in art museums from an experiential practice into a precise, evidence-based discipline [4]. We hypothesize that illuminance and tone jointly affect visual comfort, with specific combinations yielding optimal comfort.
1.1. The Influence of the Color Tones of Paintings on Visual Comfort
The color tone of a painting, as the fundamental language of visual art, directly influences the viewer’s visual comfort through the intertwined effects of emotion and physiology. From an emotional perspective, distinct tones evoke varying degrees of comfort [5]. Cool-toned works (such as blue and green) convey tranquility, suppress sympathetic nervous activity, alleviate visual tension, and facilitate sustained relaxation during observation. In contrast, warm-toned works (such as red and orange) immediately capture attention; however, their high saturation overstimulates the retinal cone cells, inducing visual fatigue and emotional arousal. Neutral-toned works (such as grayscale) mitigate strong chromatic contrasts and serve as effective mediums for detailed visual analysis [6,7]. From the standpoint of physiological adaptability, variations in brightness and saturation markedly influence the comfort threshold. Amithavikram [8] noted that the coordination between brightness and saturation enhances the efficiency of visual information processing, thereby defining the comfort boundary. Jaglarz [9] demonstrated that elderly individuals exhibit heightened sensitivity to extreme brightness and saturation, both of which can induce discomfort, whereas natural tones aligned with physiological norms help sustain visual comfort. Inappropriate color schemes in museums or hospitals [10,11] may cause glare or visual fatigue, reaffirming the profound dual impact of color tone on visual comfort.
1.2. The Mechanism of Illuminance on Visual Comfort
Illuminance serves as a fundamental metric for assessing the brightness of a lighting environment [12]. It directly influences visual comfort by modulating both the physiological functions of the human eye and the perception of ambient light. This mechanism can be analyzed across three dimensions: visual physiological regulation, detail recognition efficiency, and protection against light-induced damage. In terms of visual physiological regulation, illuminance governs light adaptation through image-forming pathways—such as pupil constriction or dilation, which regulate retinal light intake—and through non-image-forming systems involving circadian rhythm, melatonin secretion, and arousal levels [13]. Moreover, rod and cone cells exhibit distinct responses under varying illuminance levels, facilitating the dynamic transition between scotopic (dim) and photopic (bright) vision [14]. Regarding detail recognition efficiency, illuminance determines the contrast sensitivity and spatial resolution of the visual system. Insufficient illuminance diminishes contrast sensitivity and high spatial frequency response, impairing the perception of fine details and textures. Conversely, appropriately high illuminance sustains superior spatial resolution, enhancing the ability to distinguish subtle color gradients and material textures in artworks [15]. Empirical evidence further demonstrates that low illuminance markedly reduces the perception of complex patterns, as contrast sensitivity is closely correlated with background luminance [16]. Concerning protection against light-induced damage, excessive illuminance—particularly during prolonged exposure—accelerates the photodegradation and fading of paper, fibers, dyes, and pigments. Among these, blue-violet light is especially destructive to organic materials [17]. Consequently, the International Commission on Illumination (CIE) and museum conservation organizations advocate the use of low-illuminance standards for light-sensitive materials, combined with exposure time control and filtering technologies [18]. In accordance with these principles and the national standard GB/T 23863-2009 [19] Code for Lighting Design of Museums [20], material photosensitivity (see Table 1) should be carefully considered to minimize photoinduced damage. Based on these criteria, decorative paintings with lower light sensitivity and broad audience appeal were selected as experimental subjects, ensuring compliance with tone and illuminance control requirements under experimental conditions, while simultaneously meeting fundamental standards for preservation and exhibition safety.

Table 1.
Classification of light sensitivity of paintings.
1.3. Visual Comfort Assessment
Visual comfort is a multifaceted perception that integrates both subjective and objective dimensions. Its formation depends not only on the viewer’s intuitive experience of lighting conditions and color but is also objectively modulated by the visual physiological system [21]. To more comprehensively assess comfort under the interaction of painting tones and illuminance, research requires a multidimensional evaluation framework that combines subjective assessments with objective physiological indicators [22]. Subjective methods commonly employed include the Comfort Scale [23], the Semantic Differential Scale [24], and the Visual Fatigue Questionnaire [25]. While these instruments directly capture viewers’ experiences in varying lighting environments, their results are often influenced by individual differences and psychological factors. To address this limitation, scholars increasingly incorporate objective physiological indicators to enhance both the stability and the explanatory power of the findings.
Among objective indicators, pupil diameter and its variability are among the most widely employed measures, as they sensitively reflect visual load and fatigue [26]. Furthermore, cognitive pupillometry provides a standardized experimental paradigm and methodological guidelines for data processing in light environment research [27]. Eye-tracking parameters such as fixation duration, blink frequency, and scan paths reveal patterns of attention distribution and visual behavior under varying tonal and lighting conditions of paintings. Empirical studies have demonstrated their effectiveness in explaining differences in viewers’ focus and experiential responses within exhibition environments [28,29,30]. In recent years, efforts have increasingly sought to integrate subjective and objective indicators with machine learning techniques to enable automated prediction and classification of visual comfort. For example, Ma and Pan [31] selected four core features to construct multiple visual comfort models, including classification trees and random forests. The random forest model achieved the highest predictive performance (median AUC = 0.723) and was further embedded into a BIM plugin to assist in light source adjustment, balancing comfort with energy efficiency. Agar et al. [32], using a support vector machine (SVM) algorithm, developed a personalized prediction model of visual comfort based on environmental features (light, temperature, humidity) and physiological features (e.g., pupil size). The model achieved an accuracy of 82% with environmental data and 68% with physiological data, supporting personalized lighting adjustment. Similarly, Kang et al. [33] combined EEG signals (e.g., stress and concentration indices) with environmental data such as illuminance, employing a gated recurrent unit (GRU) deep learning network to predict real-time visual comfort. Their model achieved a mean squared error of only 0.0012 and could also generate optimal illuminance recommendations to guide environmental lighting adjustments. Collectively, these studies illustrate that integrating machine learning into visual comfort assessment significantly enhances predictive power and practical applicability by unifying subjective and objective indicators.
1.4. Summary of Relevant Research
Overall, the primary challenges in research on visual comfort in art museums under the interaction of tone and illuminance can be outlined as follows: (1) Insufficient integration of interdisciplinary theories and technologies. Although color psychology, visual physiology, and lighting engineering have each investigated visual perception within their respective domains, their systematic integration in the context of optimizing gallery lighting environments remains limited. (2) Gaps in modeling collaborative subjective–objective evaluation. While subjective assessments capture audience perceptions, they are highly susceptible to individual differences. Objective measures, by contrast, record physiological responses with greater stability. Yet, existing evaluation models often fail to fully integrate these two dimensions, overlooking their intrinsic interconnections and thus constraining the comprehensive assessment of gallery lighting environments. (3) Limited scenario validation and interpretability of prediction models. Current models largely rely on single algorithms whose performance across diverse exhibition contexts and artworks remains insufficiently validated, while their outputs often lack transparent interpretability. This weakens generalizability and diminishes practical applicability, hindering precise environmental control. To address these challenges, this study selected decorative paintings with low light sensitivity and examined the interactive effects of tone and illuminance. A regression prediction model was developed using eye-tracking data combined with subjective questionnaire results. Among the models tested, XGBoost achieved the strongest predictive performance while also offering interpretability and robust validation, thereby providing a rigorous scientific basis for the precise regulation of lighting environments in art museums.
This article is structured into five sections: Section 1 reviews the existing literature; Section 2 outlines the research context, data, and methodology; Section 3 presents and analyzes the principal findings; Section 4 discusses the results and addresses the study’s limitations; and Section 5 concludes the paper.
2. Materials and Methods
2.1. Painting Selection and Preparation
To minimize interference arising from the inherent light sensitivity of specific painting genres, this study employed warm-toned decorative paintings rendered on synthetic fiber canvas (polyester fabric) with an anti-UV coating as the experimental medium in the Art College (Figure 1c). Decorative paintings, as representative exhibits in modern galleries, possess low light sensitivity (in accordance with GB/T 23863-2009), making them suitable for illumination levels ranging from 50 lx to 300 lx and thus ensuring the universality of the results. Their resistance to photodegradation—unlike watercolor or oil paintings—preserves stable visual characteristics, enabling reliable and effective tent-illuminance interaction experiments [34]. Building on these warm-toned decorative paintings, which possess both optical stability and suitable visual qualities, tonal variations were precisely manipulated using Adobe Photoshop [35]. Photoshop adjustments were limited to hue and saturation, while contrast, sharpness, and local color distribution were kept constant. A preliminary test (n = 5) verified a perceived similarity score of 6.7 ± 0.4 on a 7-point scale, confirming that the perception of composition and detail remained consistent across stimuli, with tone being the only variable. During this process, non-tonal attributes—including image size, compositional details, and resolution (300 dpi)—were rigorously controlled, while only hue and saturation parameters were adjusted to alter tonal characteristics. The cool-toned version (Figure 1a) emphasized a blue-dominant palette, achieved by shifting the original colors into the blue range while maintaining equivalent saturation and brightness, thereby evoking a refreshing visual effect. The mid-toned version (Figure 1b) was generated by converting the painting into grayscale through saturation adjustment, producing a balanced neutral appearance. The warm-toned version (Figure 1c) preserved the original yellow–orange palette, thereby reinforcing a warm visual experience. Ultimately, three tonal variants—cool, intermediate, and warm—were obtained (Figure 1). These variants were identical in composition, detail, and resolution, differing solely in chromatic attributes. To ensure uniformity in visual scope and viewing distance, all paintings were standardized to dimensions of 400 mm × 500 mm.
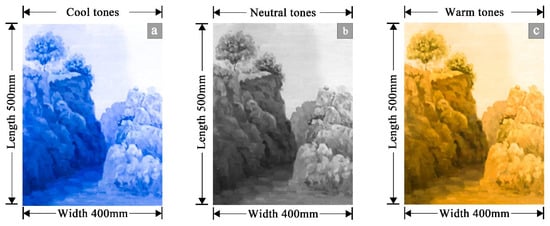
Figure 1.
Shows the color tone of the painting. (a) Cool tones, (b) intermediate tones, (c) warm tones.
Meanwhile, this study employed a 3 × 3 cross-experimental design, encompassing three illuminance levels (50 lx, 150 lx, 300 lx) and three color tones (cool, intermediate, warm), resulting in nine distinct lighting conditions. To ensure illuminance accuracy and uniformity, the SPIC-300 remote illuminance meter was used to calibrate the visual key areas of each lighting scene prior to the experiment via the central-point method, as illustrated in Figure 2b. This procedure ensured that the deviation of the average illuminance from the target values (50 lx, 150 lx, 300 lx) remained within ±5%, thereby satisfying the stringent illuminance requirements of optical experiments.
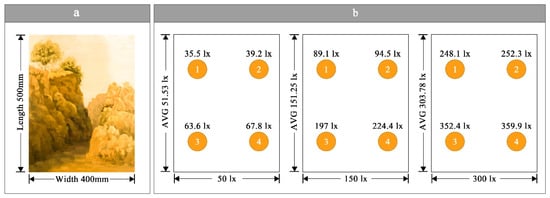
Figure 2.
Painting parameters. (a) Dimensions of the painting, (b) Average illuminance.
2.2. Participants
A total of 32 participants were recruited through a combination of online and offline channels. After screening, 30 valid participants were retained—excluding one individual with abnormal color vision and another with ocular disease, both verified using the Ishihara Color Blindness Test. An additional 10 participants were designated as an external validation group, independent of the main experiment to ensure data integrity. All main experimental participants possessed prior experience in lighting environment research to minimize expectation bias. Prior to testing, participants were instructed to maintain adequate sleep and wear dark-colored clothing to reduce reflective interference. Upon completion, each participant received a reward and was assigned a unique identification code. Both groups adhered to identical experimental settings, equipment, and procedures. The demographic and baseline characteristics of the participants are summarized in Table 2.

Table 2.
Demographic information of the participants.
2.3. Experimental Light Environment and Setup
2.3.1. Environmental Settings
The experiment was conducted in the Light Environment Evaluation Laboratory at the Institute of Photonics, Dalian Polytechnic University (4.9 m × 3.3 m × 2.8 m) (Figure 3a), and was partitioned into Experimental and Recording zones. The simulated office featured grayish-white walls with 62% reflectivity, a ceiling reflectivity of 78%, a dark brown floor with 29% reflectivity, and a beige desk with 48% reflectivity. Indoor lighting was provided via a full-lamp configuration, while north-facing windows were covered with blackout shutters to completely eliminate natural light interference. To precisely control experimental variables, LED spotlights (Sanxiong Jiguang, PAK413150, 25 W, Guangzhou, China) coupled with a DALI dimming system (LCU14041-S2 controller, Huizhou, China) were employed to achieve three illuminance levels (50 lx, 150 lx, 300 lx). The detailed parameters, photometric curves, and illuminance distributions of the LED spotlights are presented in Figure 3c. To replicate a realistic office environment, the room temperature was maintained at 24 ± 0.2 °C and relative humidity at 50 ± 5% via air conditioning [36], conforming to environmental comfort standards. Furthermore, the laboratory, located on the fourth floor and not facing the street, experienced minimal noise, primarily from the air conditioning system, with measured ambient noise levels maintained below 40 dB(A).
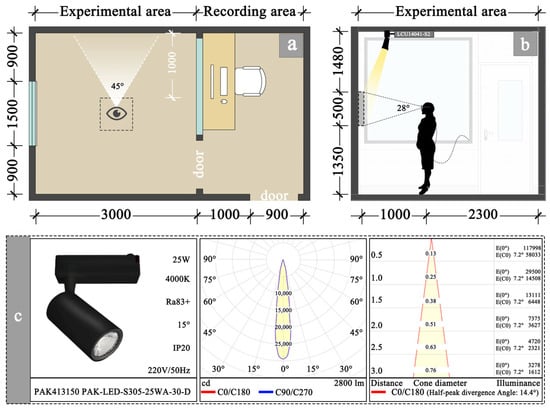
Figure 3.
Experimental site and lighting fixture configuration. (a) Floor plan layout, (b) elevation layout, (c) Types of lighting fixtures.
2.3.2. Light Source Spectral Characteristics
To ensure the scientific validity of the lighting conditions and address the critical influence of spectral characteristics on visual perception and artwork preservation, the spectral power distribution (SPD) of PAK413150 LED spotlights was measured at three illuminance levels—50 lx, 150 lx, and 300 lx—using an SPIC-300 spectral radiometer. The results are presented in Figure 4. The SPD curves exhibit consistent morphological characteristics across all light levels, with only the relative power amplitude demonstrating a linear variation. Based on the SPD data, several key spectral indicators were derived: the correlated color temperature (CCT) ranges from 4089 K at 50 lx to 4523 K at 300 lx, falling within the neutral white light spectrum that optimally balances color rendering and visual stimulation [37]. The general color rendering index (Ra) remains above 84.9, while the IES TM-30-18 color fidelity index (Rf) exceeds 88, ensuring faithful color reproduction of paintings and preventing color distortion that could bias subjective comfort evaluations [38]. The blue-light power ratio (400–500 nm) is maintained below 4.2%, minimizing the risk of visual fatigue caused by excessive blue light exposure and adhering to LED lighting safety guidelines for visual comfort studies [12]. Moreover, the spectral distribution demonstrates minimal emission in the blue-violet region (380–450 nm), which is known to accelerate photodegradation of organic materials [39]. Combined with the use of low-photosensitivity decorative paintings, this configuration ensures that the experimental lighting not only fulfills the requirements of visual comfort research but also conforms to the artwork protection standards outlined in the CIE guidelines.
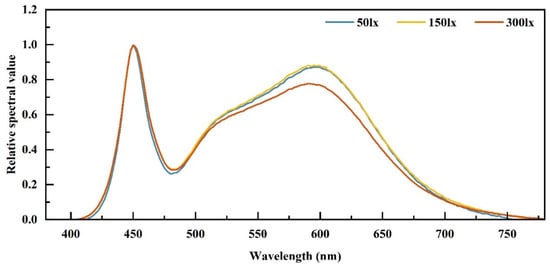
Figure 4.
The spectral power distribution (SPD) curve of the PAK413150 LED spotlight.
2.4. Experimental Procedure
The experimental procedure is illustrated in Figure 5. Prior to the experiment, participants were briefed on the procedure, fitted with the eye tracker, and the device was calibrated. A within-subjects design was employed, with all participants exposed to the nine lighting conditions in a randomized sequence. Each eye-tracking visual assessment lasted 90 s, during which participants were instructed to keep their heads as still as possible. The subjective questionnaire was completed within 30 s following each eye-tracking assessment. A 1 min intermission was provided between lighting conditions to restore visual and emotional baselines, minimizing residual effects and fatigue. Each participant completed all nine conditions, yielding a total of 360 valid data points (40 × 9). The study was approved by the Biological and Medical Ethics Committee of Dalian University of Technology (DuTSICE 250411-01).
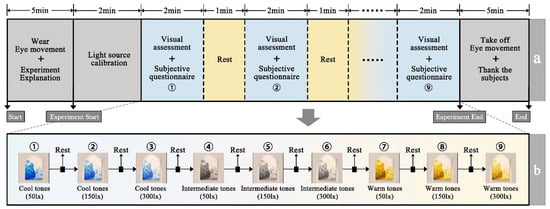
Figure 5.
Experimental flowchart. (a) The general process of the experiment, (b) Nine lighting conditions.
2.5. Subjective and Objective Data
2.5.1. Subjective Questionnaire
Visual comfort, defined as the subjective perception elicited by a specific environment, plays a crucial role in the context of art museum visits. When visitors experience visual comfort, they typically report satisfaction with the museum’s overall environment and atmosphere, accompanied by a state of physical and mental relaxation. Conversely, the presence of symptoms such as visual fatigue, emotional malaise, or difficulty concentrating indicates a state of discomfort. In the simulation of exhibition lighting in an art museum, a five-point Likert scale was employed to assess semantic differentials and overall preferences. Drawing on prior research and index selection [40,41], four dimensions—light source color satisfaction, atmosphere satisfaction, psychological pleasure, and overall lighting environment preference—were adopted as subjective evaluation metrics for the lighting environment, as detailed in Table 3. Responses were rated on an integer scale from 1 to 5, where 1 represents “very dissatisfied,” 2 “dissatisfied,” 3 “neutral,” 4 “satisfied,” and 5 “very satisfied.” [42].

Table 3.
Subjective Test Question Scale.
From the perspective of visual comfort, an individual’s comfort state arises from the interaction and cumulative effects of multiple indicator dimensions. The score of a single indicator reflects only a localized aspect of comfort, whereas the aggregated sum of these scores provides a more comprehensive representation of the individual’s overall visual comfort intensity and tendency, capturing the holistic characteristics of their state. To ensure the reliability of each assessment dimension, Cronbach’s α was calculated for all subscales: light source color satisfaction (α = 0.813), atmosphere satisfaction (α = 0.786), psychological pleasure (α = 0.835), and overall lighting environment preference (α = 0.762). All α values exceeded the 0.7 threshold, indicating strong internal consistency across dimensions. The specific calculation is presented in Equation (1):
Here, y denotes the target output for visual comfort, representing the aggregated total score derived from participants’ semantic differential ratings. xi corresponds to the numerical score assigned to the i-th sentiment descriptor, and n indicates the number of dimensions within the visual comfort indicators.
2.5.2. Eye Movement Feature Extraction
Visual fatigue refers to the state of ocular strain induced by specific visual stimuli, manifesting as symptoms such as reduced visual acuity, eye fatigue, and headaches. In this study, the Eyeso Glasses head-mounted eye tracker (Braincraft, Beijing, China) was employed to collect eye movement signals for the assessment of visual fatigue indicators. Following data acquisition, the raw eye-tracking data were processed using Pupil Player and Eyeeso Studio 6.23 (Braincraft, Beijing, China) to ensure data integrity and consistency. Blinking and Data Loss Processing in Pupil Player: Blinks were automatically detected by the eye tracker’s built-in eyelid closure algorithm (threshold: eyelid opening < 15% of baseline), and all data points recorded during blink events (duration: 100–400 ms) were identified and excluded. For data loss, segments containing consecutive invalid samples exceeding 500 ms were removed. In total, the proportion of rejected data accounted for 3.2% of the original dataset (participant range: 2.1–4.5%), remaining below the 5% threshold recommended in eye-tracking research, thereby confirming sufficient data integrity.
Data Segmentation and Analysis: Data segmentation was primarily performed in Pupil Player through several procedures, including blink removal, target area identification, and video cropping. The segmented data were then imported into Eyeeso Studio for advanced analysis, encompassing gaze statistics, region of interest (AOI) definition and refinement, generation of attention heatmaps, and visualization of eye movement trajectories. The AOI (Area of Interest) represents a predefined region within the experimental painting used to analyze gaze behavior and quantify the distribution of participants’ visual attention. The specific criteria for AOI definition are listed in Table 4.

Table 4.
The definition criteria of regions of interest (AOI).
The software extracted four specific signal parameters: total fixation duration within AOIs, first fixation time within AOIs, number of visits, and the coefficient of variation in pupil diameter, which were exported as CSV files. Among these, pupil diameter serves as a physiological indicator reflecting the functional state of the optic nervous system [41]; its size and fluctuations mirror the human response to visual stimuli. Research indicates that the coefficient of variation in pupil diameter, as an objective metric for evaluating visual fatigue, can be derived by continuous monitoring and data analysis to reflect fatigue levels. Specifically, an increase in pupil diameter variability corresponds to the onset of visual fatigue, indicating a fatigued optic nervous system and reduced reaction speed. The calculation of this index is presented in Formula (2):
Here, is the coefficient of variation in the pupil diameter, σ is the standard deviation of the pupil diameter, and is the average value of the pupil diameter.
2.6. Model Evaluation
After acquiring both subjective and objective data, the values were normalized using Formula (3), as presented below:
In this formula, the entire signal consists of individual values xi collected from the subject. The parameters μ and σ correspond to the mean and standard deviation of X, respectively.
To quantify the relationship between visual physiological data and comfort level, this study employed four independent variables—total fixation duration within AOIs, first fixation time within AOIs, number of visits, and coefficient of variation in pupil diameter—while visual comfort served as the dependent variable. Five predictive models—XGBoost, Decision Tree (DT), Support Vector Machine (SVM), Random Forest, and BP neural network—were implemented in MATLAB R2023b to evaluate the interactive effects of painting tones and illuminance across nine lighting conditions. To mitigate prediction bias across different comfort intervals, the Synthetic Minority Oversampling Technique (SMOTE) [43] was applied to balance the distribution of subjective comfort labels. To ensure the robustness and generalizability of the evaluation, a dataset partitioning strategy was adopted: the training set was used for model parameter learning, the validation set for hyperparameter tuning and intermediate performance assessment, and the test set as an independent dataset to evaluate final generalization performance. Model performance was assessed using the Coefficient of Determination (R2), Mean Squared Error (MSE), Root Mean Squared Error (RMSE), and Mean Absolute Error (MAE), with the corresponding formulas presented in Equations (4)–(7):
Among them, is the average value of the true values, is the predicted value, n is the sample size, and the value range of R2 is [0, 1]. The closer it is to 1, the better the model and the better the effect.
3. Results
3.1. Subjective Data
Visual comfort was analyzed using IBM SPSS Statistics 24. Reliability, variance, individual effects, and interaction effects were examined on the subjective questionnaire to investigate the influence of illuminance and hue on participants’ visual comfort. Reliability analysis yielded a Cronbach’ s alpha of 0.842, exceeding the 0.7 threshold, indicating that the questionnaire was sufficiently reliable for further analysis. To elucidate the effects of illuminance and the primary color tone of paintings on dimensions such as color satisfaction, atmosphere satisfaction, psychological pleasure, and overall preference, analysis of variance (ANOVA) was conducted to assess both main and interaction effects. The results, summarized in Table 5, indicate that illuminance exerts significant main effects on color satisfaction (F = 6.361, P ≤ 0.05), psychological pleasure (F = 16.358, P ≤ 0.05), and overall preference (F = 3.968, P ≤ 0.05). Regarding painting color tone, significant main effects were observed on psychological pleasure (F = 28.084, P ≤ 0.05) and overall preference (F = 3.829, P ≤ 0.05). Analysis of the interaction between illuminance and painting color tone revealed that, except for overall preference (F = 0.614, P ≥ 0.05), the interaction significantly influenced light source satisfaction (F = 2.622, P ≤ 0.05), atmosphere satisfaction (F = 4.405, P ≤ 0.05), and psychological pleasure (F = 2.277, P ≤ 0.05).

Table 5.
Analysis of Variance of Subjective Questionnaires.
3.1.1. Individual Effect Analysis
The analysis of subjective individual effects under varying illuminance levels is presented in Figure 6a. As shown in Table 4, both color satisfaction and overall preference increased progressively with higher illuminance. The 300 lx condition produced the highest ratings for color satisfaction (4.45 ± 0.32) and overall preference (4.04 ± 0.28), followed by 150 lx, while 50 lx yielded the lowest scores. This suggests that higher illuminance levels tend to enhance individuals’ acceptance of color quality and the overall lighting environment. In contrast, psychological pleasure exhibited a nonlinear relationship with illuminance: it was relatively high at 50 lx (4.20 ± 0.28), decreased at 150 lx (4.03 ± 0.29), and partially rebounded at 300 lx (4.20 ± 0.25), indicating that the effect of illuminance on psychological pleasure is complex and requires targeted lighting design strategies.
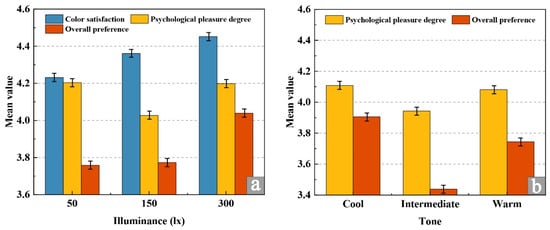
Figure 6.
Individual effect analysis of subjective data. (a) Subjective data under illuminance factor, (b) Subjective data under hue factor.
The analysis of subjective individual effects under different tone conditions is illustrated in Figure 6b. Both psychological pleasure and overall preference were significantly affected by tone type. Cool tones achieved the highest ratings for psychological pleasure (4.11 ± 0.26) and overall preference (3.91 ± 0.30), followed by warm tones (psychological pleasure: 4.08 ± 0.24; overall preference: 3.74 ± 0.32), while mid-tones received the lowest scores (psychological pleasure: 3.94 ± 0.27; overall preference: 3.44 ± 0.35). These results demonstrate that cool tones are most effective in enhancing psychological pleasure and overall preference, whereas mid-tones are comparatively less favorable.
3.1.2. Interaction Effect Analysis
To elucidate the interaction mechanism between illuminance and painting tone, a two-factor interaction analysis was conducted on three indicators—color satisfaction, atmosphere satisfaction, and psychological pleasure—based on the results of the analysis of variance. The findings are presented in Figure 7. For color satisfaction (Figure 7a), illuminance exerted a stronger overall effect than painting tone, and its influence was significantly modulated by tone type. At 50 lx, all tones received relatively low ratings; at 150 lx, intermediate tones achieved the highest score (4.32 ± 0.30), while at 300 lx, warm tones yielded the highest score (4.58 ± 0.27). Regarding atmosphere satisfaction (Figure 7b), the interaction pattern varied with illuminance. Warm tones performed best at 50 lx (4.25 ± 0.31), intermediate tones peaked at 150 lx (4.38 ± 0.29), and cool tones achieved the highest ratings at 300 lx (4.42 ± 0.26). Notably, intermediate tones maintained above-average scores across all illuminance levels, indicating a generally stable preference among participants. For psychological pleasure (Figure 7c), all tones received comparable ratings at 50 lx, whereas intermediate tones scored significantly lower at 150 lx. At 300 lx, cool tones produced the highest score (4.45 ± 0.23), significantly outperforming other tone types. Overall, the interaction analysis clarifies how illuminance and painting tone jointly shape subjective visual responses. Specifically, color satisfaction peaks under intermediate tones at 150 lx and warm tones at 300 lx; atmosphere satisfaction reaches its maximum at 50 lx with warm tones, 150 lx with intermediate tones, and 300 lx with cool tones. Furthermore, the combination of 300 lx and cool tones evokes the highest level of psychological pleasure.

Figure 7.
Analysis of Subjective data Interaction Effects. (a) Color satisfaction, (b) atmosphere satisfaction, (c) psychological pleasure.
Overall, overall subjective evaluation scores were generally low at 50 lx, indicating that low illuminance tends to induce visual and psychological discomfort. Under this low illumination, warm tones were most effective in enhancing color satisfaction and atmospheric perception, whereas intermediate tones consistently achieved above-average atmosphere satisfaction across varying illuminance levels. In contrast, at high illuminance (300 lx), cool tones proved most effective in maximizing psychological pleasure.
3.2. Eye Movement Analysis
3.2.1. Coefficient of Variation in Pupil Diameter
For the correlation analysis of the coefficient of variation in pupil diameter, normality tests and analysis of variance were first conducted. Given the small sample size of 30 participants, the Shapiro–Wilk (S-W) test was considered the primary criterion for assessing normality, with Kolmogorov–Smirnov (K-S) test results provided as Supplementary Information. An S-W significance greater than 0.05 indicates that the data follow a normal distribution, allowing for the use of analysis of variance for subsequent statistical comparisons. Test results are presented in Table 6, showing that the S-W significance values for the coefficient of variation in pupil diameter across all conditions exceed 0.05, confirming normality and justifying the application of repeated measures ANOVA. Subsequently, ANOVA was performed to examine whether lighting intensity and the primary color tone of the paintings exerted significant effects on the participants. As shown in Table 7, lighting intensity exhibited a significant main effect (F = 4.656, P ≤ 0.05), indicating that varying illuminance levels elicited differential responses. Painting color tones also produced a significant main effect (F = 3.011, P ≤ 0.05), demonstrating that tonal differences influenced participants’ responses. Moreover, the interaction between illuminance and painting color tone was significant (F = 29.446, P ≤ 0.05), confirming that their effects are interdependent and exhibit a clear interactive relationship.

Table 6.
Normality test of Pupil diameter Coefficient of variation.

Table 7.
Variance analysis of the coefficient of variation in Pupil diameter.
This study analyzed the effect of illuminance on the coefficient of variation in pupil diameter across three illuminance levels (50 lx, 150 lx, and 300 lx), with results shown in Figure 8a. The coefficient of variation in pupil diameter decreases significantly as illuminance increases, reaching its minimum at 300 lx, indicating the lowest level of visual fatigue under this lighting. Conversely, at 50 lx, the coefficient of variation is highest, reflecting the greatest visual fatigue. Differences between 50 lx and 150 lx are relatively small, but both are significantly higher than at 300 lx, suggesting that a 300 lx environment is visually softer and substantially enhances ocular comfort. As shown in Figure 8b, analysis of the individual effects of painting color tones indicates that cool-toned paintings elicit the lowest pupil diameter variability, thereby promoting greater visual comfort compared with warm- and mid-toned paintings. While warm- and mid-toned paintings exhibit relatively low variability, both are significantly higher than that of cool tones, suggesting an increased likelihood of visual fatigue. Among them, warm-toned paintings generate the strongest ocular stimulation, resulting in the highest degree of visual fatigue.

Figure 8.
Analysis of individual and interaction effects of objective data. (a) Separate analysis of illuminance factor, (b) separate analysis of painting tone factor, (c) interaction effect analysis of pupil data.
As illustrated in Figure 8c, the interaction between illuminance and painting color tone reveals distinct patterns in pupil diameter variability. For cool-toned paintings, the coefficient of variation is significantly higher at 150 lx than at 50 lx and 300 lx, with 50 lx minimizing ocular stimulation and representing the optimal illuminance for this tone. Warm-toned paintings exhibit relatively high pupil variability across all illuminance levels, with a relative reduction at 150 lx. Coupled with the glare reported by participants, this indicates that 150 lx is the most suitable illuminance for warm-toned paintings. For mid-toned paintings, variability is highest at 50 lx and decreases significantly at 300 lx, suggesting that 300 lx is more appropriate for these tones. Further subdivision within each illuminance level shows nuanced effects: at 50 lx, cool tones produce the lowest pupil variability, indicating maximum comfort, whereas intermediate tones induce the highest variability and greatest visual fatigue. At 150 lx, intermediate tones yield the lowest variability, reflecting greater comfort, while cool tones generate the highest variability and are most likely to cause fatigue. At 300 lx, pupil variability is relatively low for both intermediate and cool tones, whereas warm tones exhibit the highest variability, indicating that warm-toned paintings are most likely to induce visual fatigue under this illuminance.
In conclusion, the analysis of individual and interaction effects elucidates the specific mechanisms through which illuminance and painting tones jointly influence visual comfort. The optimal configurations minimizing visual fatigue are 50 lx for cool-toned paintings, 150 lx for warm-toned paintings, and 300 lx for mid-toned paintings. These findings provide a targeted visual physiological basis for designing illuminance and color tone combinations in museum exhibitions.
3.2.2. AOI Gaze Analysis
To investigate the distribution characteristics of visual attention under the combined influence of illuminance and painting tones, this study first calculated the average subjective visual comfort scores across three tones and three illuminance levels using Formula (1), as illustrated in Figure 9a. The results indicate that the cumulative average values are highest for cool tones, followed by intermediate and warm tones, in the order: cool tones (2.003) > intermediate tones (1.822) > warm tones (1.503). Based on this, Figure 9b presents a visual analysis of the region of interest (AOI) for a cool-toned painting under three illuminance levels: 50 lx, 150 lx, and 300 lx. The eye movement trajectory diagram (Figure 9c) reveals that at 150 lx, gaze paths are notably disordered, with fixation points frequently drifting outside the AOI, reflecting scattered visual attention. At 300 lx, gaze trajectories are relatively concentrated within the AOI, predominantly focused on the painting’s central region. At 50 lx, eye trajectories are most tightly clustered within the AOI, and the largest fixation point (indicating the longest dwell time) is located at the AOI center, suggesting the highest level of visual immersion under this illuminance. As a standard visualization tool in eye-tracking studies, the heatmap represents visual attention or dwell time using a color spectrum—red denotes areas with the highest fixation frequency or duration, while green indicates minimal attention, with intermediate colors reflecting transitional levels. The heatmaps in Figure 9d show multiple red areas at 150 lx and 300 lx, indicating that visual focus is drawn to multiple elements. In contrast, the 50 lx heatmap displays a single concentrated area of attention, demonstrating highly focused visual engagement with the painting itself.
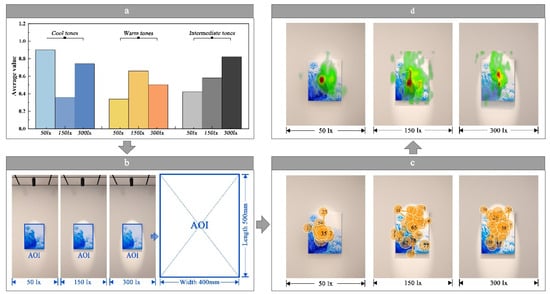
Figure 9.
AOI visual visualization analysis. (a) Comparison of the average values of subjective data, (b) division of AOI areas, (c) AOI eye movement trajectory map, (d) AOI eye movement hotspot map.
To examine the effect of illuminance on eye movement metrics within the region of interest (AOI), this study performed a one-way analysis of variance on three indicators: total fixation duration, first fixation duration, and number of visits. The results are presented in Table 8 and Figure 10. As shown in Table 8, across the three illuminance levels (50 lx, 150 lx, and 300 lx), significant differences were observed in total fixation duration (F = 11.505, P = 0.000), first fixation duration (F = 0.102, P = 0.019), and number of visits (F = 15.955, P = 0.000). Figure 10a illustrates that the total fixation duration at 50 lx was 82.06 s, accounting for 91.18% of the 90 s experimental period, indicating the highest level of viewer attention. At 150 lx, total fixation duration decreased to 67.40 s (74.89%), implying that viewers were not attending to the paintings for approximately 25.11% of the time, suggesting that 150 lx does not effectively sustain attention. At 300 lx, total fixation duration was 71.12 s (79.02%). Figure 10b shows that the first fixation duration at 50 lx was 1.97 s, significantly longer than at 150 lx (1.81 s) and 300 lx (1.85 s), indicating that viewers oriented their gaze to the AOI more quickly under 50 lx, reflecting higher initial visual attention efficiency. Figure 10c reveals no significant difference in the number of visits between 150 lx and 300 lx, suggesting a limited impact of illuminance within this range. However, the number of visits at 50 lx was significantly higher than at the other two levels, indicating increased viewer engagement with cool-toned paintings under low illumination. Collectively, cool-toned paintings paired with 50 lx illuminance elicited optimal eye movement responses, supporting this lighting configuration as suitable for exhibiting cool-toned artworks in galleries.

Table 8.
One-way Analysis of Variance for AOI Fixation Data.

Figure 10.
AOI visual index analysis. (a) Total fixation time of AOI, (b) first fixation time of AOI, (c) number of visits.
3.3. Modeling and Prediction
3.3.1. Feature Preprocessing
Prior to model training, all features were standardized and oversampled to eliminate dimensional discrepancies, mitigate prediction biases, and ensure comparability across participants. Standardization employed the z-score normalization method described in Section 2.6 (Formula (3)) to uniformly address the inconsistent scales of the four independent variables. The mean (μ) and standard deviation (σ) were calculated solely from the training set to prevent information leakage, ensuring that each feature contributes equally during model training regardless of scale differences. To address the imbalance in subjective visual comfort scores, the Synthetic Minority Over-sampling Technique (SMOTE) was applied. Specifically, for each minority class sample, five nearest neighbors (k = 5) were identified via 5-fold cross-validation within the training set, and synthetic samples were generated through linear interpolation between the minority samples and their neighbors. This approach preserves the statistical properties of the original data while balancing class distributions and reducing the model’s bias toward majority class samples.
3.3.2. Model Implementation and Performance Assessment
In this study, four indicators—total fixation duration of the AOI, first fixation duration of the AOI, number of visits, and coefficient of variation in pupil diameter—collected from 30 participants across nine simulated art museum lighting environments, were employed as independent variables, with the visual comfort score serving as the dependent variable. Using MATLAB R2023b (MathWorks, Natick, MA, USA), five predictive models of visual comfort were developed: XGBoost, Decision Tree (DT), Support Vector Machine (SVM), Random Forest, and BP neural network. Prior to training, all eye-tracking features were standardized and subjected to oversampling techniques to eliminate dimensional discrepancies, mitigate prediction bias, and ensure comparability across participants.
The dataset was randomly partitioned in a stratified manner into 80% training, 10% validation, and 10% testing subsets, ensuring that all nine observations from each participant were contained within the same subset. This design guarantees complete independence of subjects across subsets and effectively prevents information leakage. Standardization, oversampling, and preprocessing parameters for all features were derived from the training set and subsequently applied to the validation and test sets. For the BP neural network, the hidden layer comprised 10 nodes, the learning rate was set to 0.01, and the training algorithm employed was ‘trainlm’. A maximum of 1000 iterations was allowed, with early stopping based on the validation set (halting if error did not improve for six consecutive iterations) to prevent overfitting. XGBoost was configured with a learning rate of 0.1, a maximum tree depth of 6, a subsampling ratio of 0.8, L1 and L2 regularization parameters of 1, 1000 trees, a linear regression objective, and early stopping after six rounds, with overfitting monitored via validation error. Decision Trees employed the Gini index as the splitting criterion, with a maximum depth of 5, minimum samples per split of 2, and minimum samples per leaf of 1 to balance model complexity and generalization. Random Forests comprised 300 trees, a maximum depth of 8, three randomly selected features per tree, and a minimum leaf sample size of 5. SVM used an RBF kernel with a regularization parameter C of 1 and a kernel parameter γ of 0.5, ensuring robust performance across tasks such as visual comfort prediction.
The model evaluation employed the coefficient of determination (R2), mean absolute error (MAE), root mean squared error (RMSE), and mean squared error (MSE) as primary performance metrics. The quantitative comparison results are presented in Table 9 and Figure 11. Across the training, validation, and test sets (with XGBoost including an external validation set), the performance ranking of the five models is XGBoost > DT > SVM > RF > BP, with XGBoost demonstrating superior overall adaptability. Considering the combined assessment of error metrics and two-dimensional goodness-of-fit in Figure 11a, XGBoost (pink square) occupies the upper-right quadrant, achieving an MAE of approximately 0.078 and an R2 near 0.93. It is the sole model simultaneously attaining low error and high goodness-of-fit, exhibiting a marked advantage over the other models. The predicted versus true value fitting curves in Figure 11b indicate that XGBoost’s predicted curve aligns most closely with the true value trajectory (blue star line), displaying strong consistency in fluctuation trends. DT and SVM rank second, while RF and BP exhibit relatively greater deviations. Key metrics reveal that XGBoost achieves an R2 of 0.928 on the test set, exceeding DT (0.863) by 0.065, SVM (0.855) by 0.073, RF (0.816) by 0.112, and BP (0.755) by 0.173, with an average improvement of 0.106. On the validation set, its R2 reaches 0.925, representing an average gain of 0.129 over the other models, underscoring its superior explanatory power for data variance. Furthermore, across all subsets, the predicted versus actual values for XGBoost closely approximate the ideal diagonal (Figure 12), demonstrating markedly superior cross-scenario generalization and stability compared to the other models. The subsequent section provides a detailed analysis of the model’s construction logic.

Table 9.
Comparison of Five Subjective and Objective Regression Models.
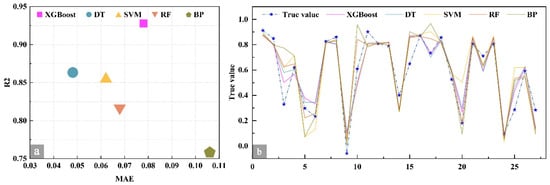
Figure 11.
Comparison of five models. (a) Two-dimensional evaluation of model performance, (b) Fitting curve between predicted values and true values.
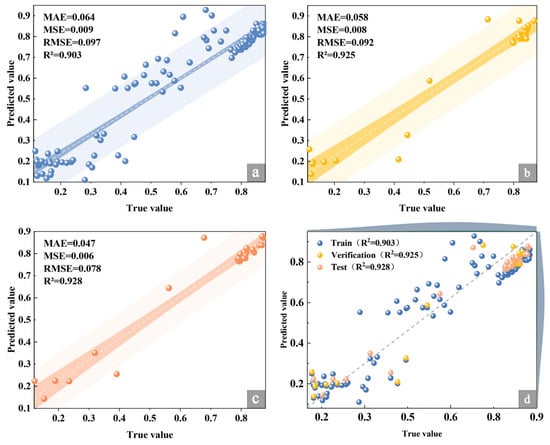
Figure 12.
Scatter plot of the XGBoost model. (a) Training set, (b) validation set, (c) test set, (d) model set graph.
To further elucidate the decision-making logic of the XGBoost model, interpretability analysis was conducted along two dimensions: the global importance of features and the contribution of individual features, as illustrated in Figure 13 and Figure 14. Features 1 through 4 correspond to the model’s independent variables: total fixation time of AOI, first fixation time of AOI, number of visits, and coefficient of variation in pupil diameter. From a global perspective, the SHapley Additive exPlanations (SHAP) feature importance map (Figure 13a) identifies the coefficient of variation in pupil diameter (Feature 4, 1.431) as the most influential factor, with a SHAP value of 1.4308, serving as the primary determinant of visual comfort. This is followed by the number of visits (Feature 3, 1.163), total fixation time of AOI (Feature 1, 0.896), and first fixation time of AOI (Feature 2, 0.889). Corresponding ALE curves (Figure 13b) reveal that the coefficient of variation in pupil diameter (Feature 4) maintains a stable and elevated cumulative local effect within the 0.1–0.8 range, whereas the number of visits (Feature 3) exhibits a fluctuating upward trend. Total fixation time of AOI (Feature 1) rises sharply beyond 0.6, while first fixation time of AOI (Feature 2) remains relatively stable, collectively illustrating the global influence patterns of each feature on the model’s predictions.
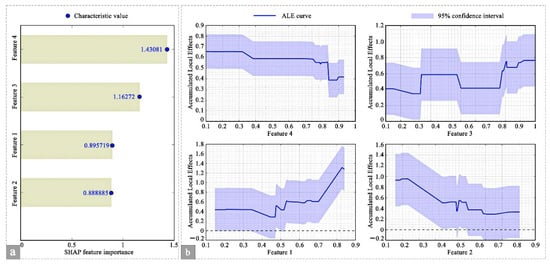
Figure 13.
Global Feature Importance. (a) SHAP feature importance map, (b) Cumulative local effects map.
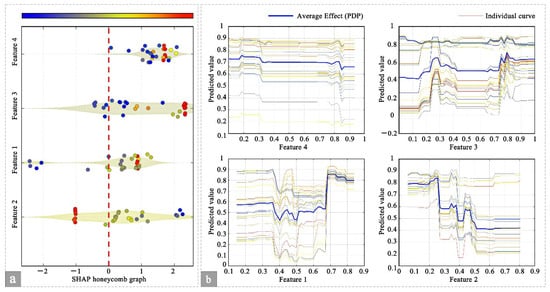
Figure 14.
Individual characteristic Contribution Graph. (a) SHAP honeycomb plot, (b) PDP and ICE plot.
From an individual perspective, Figure 14 illustrates the SHAP honeycomb plot (Figure 14a), which visually represents the contribution of each feature value to the prediction outcomes for individual samples. High-contribution values of the coefficient of variation in pupil diameter (Feature 4) and the number of visits (Feature 3) are concentrated within the range of 1 to 2, whereas the total fixation time of AOI (Feature 1) exerts a pronounced influence in the 0 to 1 range. The first fixation time of AOI (Feature 2) exhibits notable variation at extreme values. The PDP and ICE curves (Figure 14b) further reveal that the average effect of the coefficient of variation in pupil diameter (Feature 4, PDP curve) remains elevated, and the ICE curves display consistent trends across individual samples, indicating strong uniformity in its influence. In contrast, the PDP curve for the number of visits (Feature 3) shows substantial fluctuations, with individual ICE curves varying markedly, reflecting heterogeneity in feature impact across samples. The total fixation time of AOI (Feature 1) demonstrates a rapid increase in its average effect at higher values, with individual curves rising synchronously, highlighting its strong positive contribution within a specific range. The first fixation time of AOI (Feature 2) maintains relatively stable PDP and ICE curves, indicating a moderate and consistent influence on predictions. Collectively, the XGBoost model provides interpretable insights by hierarchically capturing core features such as Feature 4 and analyzing differentiated contributions at the individual sample level, effectively mitigating the black-box effect and offering clear guidance for optimizing visual comfort in art gallery environments.
Leveraging the strengths of XGBoost in modeling visual comfort within art galleries, this study predicts visual comfort across nine interaction scenarios. The corresponding scatter plots are presented in Figure 15a,b, with external validation results depicted in Figure 15c. For cold-toned paintings, the average predicted comfort at 50 lx is higher than at 150 lx and 300 lx, indicating a trend in which lower illuminance enhances comfort. In warm-toned paintings, the highest predicted comfort occurs at 150 lx, whereas 50 lx and 300 lx yield comparatively lower comfort levels. For intermediate tones, the predicted comfort peaks at 300 lx, substantially exceeding the values at 50 lx and 150 lx. These variations underscore the pronounced influence of the interaction between illuminance and tonal characteristics on perceived visual comfort.
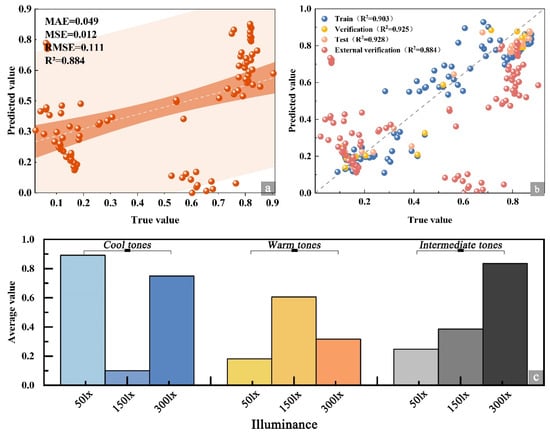
Figure 15.
External verification diagram. (a) External validation scatter plot, (b) model set plot, (c) prediction result plot.
4. Discussion
4.1. Systematic Integration of Interdisciplinary Theories and Technologies
In the domain of visual comfort research within art galleries, color psychology, visual physiology, and lighting engineering have traditionally been explored independently. This study, however, seeks to achieve a deep integration of these disciplines through experimental design and rigorous data analysis. For the perspective of color psychology and visual physiology, the interaction between illuminance and hue is analyzed: the emotional modulation of hue in color psychology is combined with the pupil’s light adaptation mechanism in visual physiology. Under low illuminance, cool tones alleviate visual tension by suppressing sympathetic nerve activity, aligning with the dilated state of the pupil. Warm tones under medium illuminance balance retinal pyramidal cell stimulation and the attraction of visual attention. Under high illuminance, intermediate tones reduce color contrast to accommodate visual detail recognition when the pupils contract [44]. Fro a lighting engineering standpoint, the study adheres strictly to museum lighting standards, employing LED spotlights and DALI dimming systems for precise illuminance control. Furthermore, illuminance parameters are integrated with machine learning, whereby the XGBoost model uses eye movement physiological indicators as independent variables and subjective comfort scores as the dependent variable, realizing a collaborative application of interdisciplinary technologies. Model interpretation and external validation confirm the scientific rigor and practical utility of this integrated approach.
4.2. Construction of the Subjective and Objective Collaborative Evaluation Model
In contemporary visual comfort assessment, subjective evaluations are often influenced by individual variability [45], while objective physiological indicators, despite their stability, fail to fully capture the nuances of subjective experience [46]. Assessing either in isolation lacks comprehensiveness. This study identified core associative characteristics through analysis of variance and interaction analysis, established a collaborative model integrating subjective and objective evaluations, and constructed a two-dimensional dataset encompassing both subjective experience and physiological responses [47]. During feature selection, variance analysis revealed that the interaction between illuminance and hue significantly influenced three subjective indicators—excluding overall preference (F = 2.622–4.405, P ≤ 0.05)—as well as the coefficient of variation in pupil diameter (F = 29.446, P ≤ 0.05), corroborating Raquel et al.’s findings [48] and clearly defining core correlation characteristics. In the model comparison phase, the XGBoost model demonstrated superior predictive performance through the weighted integration of subjective and objective features. Its test set R2 (0.928) exceeded that of the decision tree (0.863) and SVM (0.855) by 6.5% and 7.3%, respectively, and outperformed the prediction models for exhibition hall lighting by Zhao et al. and Li et al. by 4.2–7.8% [49,50]. SHAP value analysis further revealed that the coefficient of variation in pupil diameter (SHAP value 1.431) constitutes the primary determinant of visual comfort [51], followed by the number of visits (1.163) and the total fixation time of AOI (0.896). This hierarchy underscores the fundamental influence of objective physiological metrics while simultaneously enhancing the model’s capacity to elucidate corresponding subjective experiences.
4.3. Scene Verification and Explainability Improvement of Prediction Models
Most existing visual comfort prediction models rely on a single algorithm and lack validation across diverse exhibition contexts. Furthermore, their black-box nature renders model outputs difficult to interpret, limiting practical applicability. This study addresses these limitations through two approaches: scenario adaptability verification and interpretability analysis. Compared with the random forest model for general scenarios (median AUC = 0.723) reported by Ma & Pan [31], the XGBoost model developed in this study for the art gallery context, incorporating eye movement physiological indicators, advances the creation of specialized models for cultural spaces. Although the GRU model based on EEG proposed by Kang et al. [33] achieves high accuracy (MSE = 0.0012), the lightweight eye movement metrics employed here are better suited to natural exhibition viewing scenarios in art galleries and provide enhanced model interpretability. For scenario verification, the interaction of three painting tones and three illuminance levels in the art gallery was examined. The synthetic minority oversampling technique was employed to balance the distribution of subjective comfort labels, and a hierarchical random division strategy was applied to prevent information leakage. External validation confirmed that cold-toned paintings are optimal at 50 lx, warm-toned paintings at 150 lx, and mid-toned paintings at 300 lx, achieving an external prediction R2 of 0.884, thereby demonstrating the reliability and applicability of the collaborative subjective–objective model [52]. In terms of interpretability, at the global level, the XGBoost model, via ALE curves, indicates that the cumulative local effect of the coefficient of variation in pupil diameter remains stably high within the range of 0.1 to 0.8 [53], highlighting its dominant role in comfort. At the individual level, SHAP hive plots reveal that samples with coefficient of variation in pupil diameter and number of visits in the range of 1 to 2 exert the greatest influence [54], while the total fixation time of AOI in the range of 0 to 1 also significantly impacts predictions. This nuanced analysis transforms abstract model outputs into actionable regulatory strategies. Compared with the fluctuation curves of models such as Random Forest and BP neural networks, XGBoost exhibits the highest alignment with true values, and its PDP–ICE curves elucidate the heterogeneous influence of features across individual samples [55], providing a robust foundation for personalized lighting adjustments.
4.4. Research Limitations and Future Prospects
Although this study has advanced interdisciplinary integration and the collaborative modeling of subjective and objective indicators, several limitations remain. First, the experimental paintings were limited to decorative works with low light sensitivity and did not include light-sensitive types such as traditional Chinese paintings or oil paintings (illuminance standard ≤ 50–200 lx). Additionally, tone control was restricted to three broad categories—cold, medium, and warm—without considering finer distinctions such as high versus low saturation. Future research should expand both painting types and tonal dimensions, incorporating techniques such as micro-fading tests to determine optimal lighting parameters for artworks of diverse materials. Second, the participant pool was primarily aged 21 to 43 (mean age 24.51), excluding groups such as children and the elderly. Furthermore, this study did not include specific vision assessments for participants, which may introduce potential biases. For example, individuals with impaired vision could exhibit different sensitivities to illuminance variations, potentially affecting the generalizability of the comfort prediction model. Subsequent studies should include a wider age range to examine how demographic characteristics, including age and visual acuity, influence assessment outcomes. Finally, the experiment was conducted in a controlled laboratory environment. While temperature, humidity, and noise were regulated, real-world gallery variables—such as visitor density and spatial layout—were not simulated. Moreover, only static paintings were used, neglecting the potential impact of dynamic or interactive exhibitions.
Notably, the findings of this study hold practical significance for real-world applications: the XGBoost model can be integrated with the DALI dimming system employed in the experiment to create an adaptive lighting module capable of automatically adjusting illuminance (50–300 lx) according to the color tone of the artwork. This module can seamlessly interface with existing gallery lighting systems without requiring additional hardware investment, thereby balancing visual comfort with artwork preservation. Future research will explore the use of VR to simulate gallery environments, the development of multimodal experimental platforms, and the construction of multidimensional model databases to support precise and personalized lighting design in art museums. Additionally, incorporating spectral parameters as supplementary independent variables may further extend the current visual comfort prediction model [56], ultimately enhancing visitor experience and optimizing the effectiveness of art perception.
5. Conclusions
This study integrates subjective evaluations with objective eye-tracking data to address the challenge of precise lighting adjustment in art galleries. By analyzing the interaction effects of three color tones across three illuminance levels in nine experimental scenes, optimal pairings were identified: cool tones at 50 lx, warm tones at 150 lx, and medium tones at 300 lx. The XGBoost model demonstrated superior predictive performance compared with alternative models, while SHAP analysis revealed that the coefficient of variation in pupil diameter is the primary determinant of visual comfort. These findings advance gallery lighting design from an experience-driven approach to evidence-based, precision optimization.
Author Contributions
All authors contributed to the study conception and design. Formal analysis, investigation and writing—original draft were performed by X.Z.; methodology, material preparation and data collection analysis were performed by X.Z., T.Z. and R.L.; project administration, supervision, funding acquisition and writing-review and editing were performed by Z.W. and Z.G. All authors have read and agreed to the published version of the manuscript.
Funding
This research was funded by the Liaoning Provincial Science and Technology Program Project (Project No. 2025JH5/10400099).
Institutional Review Board Statement
This study was conducted in accordance with the Declaration of Helsinki, and approved by the Institutional Ethics Committee of Biology and Medicine in Dalian University of Technology (protocol code: DUTSICE250411-01, 11 April 2025).
Informed Consent Statement
Informed consent was obtained from all subjects involved in the study.
Data Availability Statement
The data that support the findings of this study are available from the corresponding author upon reasonable request. The data are not publicly available due to privacy.
Acknowledgments
We thank all the study participants in this study.
Conflicts of Interest
The authors declare no conflicts of interest.
Abbreviations
The following abbreviations are used in this manuscript:
| AOI | Area of Interest |
| SMOTE | Synthetic Minority Oversampling Technique |
| BP | Back Propagation |
| SVM | Support Vector Machine |
| XGBoost | eXtreme Gradient Boosting |
| RF | Random Forest |
| DT | Decision Tree |
| SHAP | SHapley Additive exPlanations |
References
- Carlucci, S.; Causone, F.; De Rosa, F.; Pagliano, L. A review of indices for assessing visual comfort with a view to their use in optimization processes to support building integrated design. Renew. Sustain. Energy Rev. 2015, 47, 1016–1033. [Google Scholar] [CrossRef]
- Cirrincione, L.; La Gennusa, M.; Peri, G.; Rizzo, G.; Scaccianoce, G. Indoor Parameters of Museum Buildings for Guaranteeing Artworks Preservation and People’s Comfort: Compatibilities, Constraints, and Suggestions. Energies 2024, 17, 1968. [Google Scholar] [CrossRef]
- Hassanizadeh, N.; Noorzai, E. Improving lighting efficiency in existing art museums: A case study. Facilities 2020, 39, 366–388. [Google Scholar] [CrossRef]
- Jeong, J.; Lee, K. The physical environment in museums and its effects on visitors’ satisfaction. Build. Environ. 2006, 41, 963–969. [Google Scholar] [CrossRef]
- Yao, C.; Tian, T.; Gao, C.; Zhao, S.; Liu, Q. Visual performance of painting colors based on psychological factors. Front. Psychol. 2022, 13, 966571. [Google Scholar] [CrossRef] [PubMed]
- Hu, X.; Tong, F. The Same of Beauty of Vision: The Common Research of Photography and Painting. SIASAT 2021, 6, 120–125. [Google Scholar] [CrossRef]
- Hosap, W.; Khundam, C.; Preeyawongsakul, P.; Vorachart, V.; Noël, F. The Influence of Light and Color in Digital Paintings of Environmental Issues on Emotions and Cognitions. Informatics 2023, 10, 26. [Google Scholar] [CrossRef]
- Hathibelagal, A.R. The impact of display saturation on visual search performance in congenital colour vision deficiency. PLoS ONE 2023, 18, e0290782. [Google Scholar] [CrossRef]
- Jaglarz, A. Color as a Key Factor in Creating Sustainable Living Spaces for Seniors. Sustainability 2024, 16, 10251. [Google Scholar] [CrossRef]
- Qian, L.; Zeng, X.; Liu, X.; Peng, L. The impact of varied correlated color temperatures on visual comfort in museum exhibitions: Integrating physiological and subjective assessments. J. Asian Archit. Build. Eng. 2025, 24, 1836–1850. [Google Scholar] [CrossRef]
- Dalke, H.; Little, J.; Niemann, E.; Camgoz, N.; Steadman, G.; Hill, S.; Stott, L. Colour and lighting in hospital design. Opt. Laser Technol. 2006, 38, 343–365. [Google Scholar] [CrossRef]
- Iacomussi, P.; Radis, M.; Rossi, G.; Rossi, L. Visual Comfort with LED Lighting. Energy Procedia 2015, 78, 729–734. [Google Scholar] [CrossRef]
- Wang, S.; Zhao, J. New prospectives on light adaptation of visual system research with the emerging knowledge on non-image-forming effect. Front. Built Environ. 2022, 8, 1019460. [Google Scholar] [CrossRef]
- Mathôt, S. Pupillometry: Psychology, Physiology, and Function. J. Cogn. 2018, 1, 16. [Google Scholar] [CrossRef] [PubMed]
- Loe, D.L. Light, vision and illumination: The interaction revisited. Lighting Res. Technol. 2016, 48, 176–189. [Google Scholar] [CrossRef]
- Johansson, R.C.G.; Kelber, P.; Ulrich, R. Speeded classification of visual events is sensitive to crossmodal intensity correspondence. J. Exp. Psychol. Hum. Percept. Perform. 2024, 50, 554–569. [Google Scholar] [CrossRef]
- Saeed, M.; Muneer, M.; Haq, A.U.; Akram, N. Photocatalysis: An effective tool for photodegradation of dyes—A review. Environ. Sci. Pollut. Res. 2022, 29, 293–311. [Google Scholar] [CrossRef]
- Harrison, J.; Lee, J.; Ormsby, B.; Payne, D.J. The influence of light and relative humidity on the formation of epsomite in cadmium yellow and French ultramarine modern oil paints. Herit. Sci. 2021, 9, 107. [Google Scholar] [CrossRef]
- GB/T 23863-2009; Museum Lighting Design Specification. China National Standardization Administration: Beijing, China, 2009.
- Dang, R.; Zhang, T.; Wang, J.; Tang, M.; Jiang, P.; Song, X.; Zhang, R.; Zhang, X. Lighting quantity indexes for lighting traditional Chinese paintings based on pigments protection and substrates protection in museums. Opt. Express 2021, 29, 22667. [Google Scholar] [CrossRef]
- Shi, L.; Li, Y.; Tao, L.; Zhang, Y.; Jiang, X.; Yang, Z.; Qi, X.; Qiu, J. Sporters’ visual comfort assessment in gymnasium based on subjective evaluation & objective physiological response. Build. Environ. 2022, 225, 109678. [Google Scholar] [CrossRef]
- Zhao, X.; Lin, L.; Guo, X.; Wang, Z.; Li, R. Evaluation of Rural Visual Landscape Quality Based on Multi-Source Affective Computing. Appl. Sci. 2025, 15, 4905. [Google Scholar] [CrossRef]
- Kong, Z.; Zhang, R.; Ni, J.; Ning, P.; Kong, X.; Wang, J. Towards an integration of visual comfort and lighting impression: A field study within higher educational buildings. Build. Environ. 2022, 216, 108989. [Google Scholar] [CrossRef]
- Houser, K.W.; Tiller, D.K. Measuring the subjective response to interior lighting: Paired comparisons and semantic differential scaling. Light. Res. Technol. 2003, 35, 183–195. [Google Scholar] [CrossRef]
- Zheng, F.; Hou, F.; Chen, R.; Mei, J.; Huang, P.; Chen, B.; Wang, Y. Investigation of the Relationship Between Subjective Symptoms of Visual Fatigue and Visual Functions. Front. Neurosci. 2021, 15, 686740. [Google Scholar] [CrossRef]
- Couret, D.; Boumaza, D.; Grisotto, C.; Triglia, T.; Pellegrini, L.; Ocquidant, P.; Bruder, N.J.; Velly, L.J. Reliability of standard pupillometry practice in neurocritical care: An observational, double-blinded study. Crit. Care 2016, 20, 99. [Google Scholar] [CrossRef]
- Steinhauer, S.R.; Bradley, M.M.; Siegle, G.J.; Roecklein, K.A.; Dix, A. Publication Guidelines and Recommendations for Pupillary Measurement in Psychophysiological Studies. Psychophysiology 2022, 59, e14035. [Google Scholar] [CrossRef]
- Massaro, D.; Savazzi, F.; Di Dio, C.; Freedberg, D.; Gallese, V.; Gilli, G.; Marchetti, A. When Art Moves the Eyes: A Behavioral and Eye-Tracking Study. PLoS ONE 2012, 7, e37285. [Google Scholar] [CrossRef]
- Reitstätter, L.; Brinkmann, H.; Santini, T.; Specker, E.; Dare, Z.; Bakondi, F.; Miscená, A.; Kasneci, E.; Leder, H.; Rosenberg, R. The display makes a difference: A mobile eye tracking study on the perception of art before and after a museum’s rearrangement. J. Eye Mov. Res. 2020, 13, 1–29. [Google Scholar] [CrossRef]
- Dai, Y.; Ren, Y.; Li, H.; Wang, M. Evaluating Art Exhibition Spaces Through Space Syntax and Multimodal Physiological Data. Buildings 2025, 15, 1776. [Google Scholar] [CrossRef]
- Ma, G.; Pan, X. Research on a Visual Comfort Model Based on Individual Preference in China through Machine Learning Algorithm. Sustainability 2021, 13, 7602. [Google Scholar] [CrossRef]
- Zagar, K.; Kurent, B.; Bohinc, U.; Legat, A.; Rebec, K.M. The Development of Personalized Visual Comfort Prediction Models Using Machine Learning Algorithms. In Proceedings of the 2024 IEEE Sustainable Smart Lighting World Conference & Expo (LS24), Eindhoven, The Netherlands, 12–14 November 2024; pp. 1–4. [Google Scholar]
- Kang, S.Y.; Cho, J.E.; Jun, H.J. EEG-Driven Personal Comfort Model for Cognitive Efficiency in Human-Centric Environments. Buildings 2025, 15, 3339. [Google Scholar] [CrossRef]
- Cannon-Brookes, S. Daylighting Museum Galleries: A Review of Performance Criteria. Light. Res. Technol. 2000, 32, 161–168. [Google Scholar] [CrossRef]
- Jianfeng, W.; Euitay, J. The Research on Carpet Design Development As a Homage to William Morris. J. Psychol. Res. 2024, 14, 223–236. [Google Scholar] [CrossRef]
- Kang, S.; Ou, D.; Mak, C.M. The impact of indoor environmental quality on work productivity in university open-plan research offices. Build. Environ. 2017, 124, 78–89. [Google Scholar] [CrossRef]
- Feltrin, F.; Leccese, F.; Hanselaer, P.; Smet, K.A.G. Impact of Illumination Correlated Color Temperature, Background Lightness, and Painting Color Content on Color Appearance and Appreciation of Paintings. Leukos J. Illum. Eng. Soc. N. Am. 2019, 16, 25–44. [Google Scholar] [CrossRef]
- Bellia, L.; Fragliasso, F.; Stefanizzi, E. Effects of Light Source Spectrum and Background Colour on the Perception of Paintings. Light. Res. Technol. 2020, 52, 147715351984725. [Google Scholar] [CrossRef]
- Mansfield, J.R.; Attas, M.; Majzels, C.; Cloutis, E.; Collins, C.; Mantsch, H.H. Near Infrared Spectroscopic Reflectance Imaging: A New Tool in Art Conservation. Vib. Spectrosc. 2002, 28, 59–66. [Google Scholar] [CrossRef]
- Li, Z.; Zhang, J.; Wang, H.; Dang, R. Indicators for lighting Chinese paintings in museums based on the protection standards and color preferences. Energy Build. 2023, 299, 113610. [Google Scholar] [CrossRef]
- Wu, F.; Zhao, Y.; Zhang, H. Ocular Autonomic Nervous System: An Update from Anatomy to Physiological Functions. Vision 2022, 6, 6. [Google Scholar] [CrossRef]
- Jebb, A.T.; Ng, V.; Tay, L. A Review of Key Likert Scale Development Advances: 1995–2019. Front. Psychol. 2021, 12, 637547. [Google Scholar] [CrossRef]
- Cordón, I.; García, S.; Fernández, A.; Herrera, F. Imbalance: Oversampling algorithms for imbalanced classification in R. Knowl. Based Syst. 2018, 161, 329–341. [Google Scholar] [CrossRef]
- Feng, Y.; Wang, Z.; Zhang, M.; Qin, X.; Liu, T. Exploring the Influence of the Illumination and Painting Tone of Art Galleries on Visual Comfort. Photonics 2022, 9, 981. [Google Scholar] [CrossRef]
- Rasouli Kahaki, Z.; Jahangiri, H.; Smith, A.P.; Kazemi, R. Subjective and objective survey of office lighting: Effects on alertness, comfort, satisfaction, and safety. La Med. Del Lav. 2022, 113, 2. [Google Scholar] [CrossRef]
- Talebi, S. Modeling Autonomic Pupillary Responses from External Stimuli Using Machine Learning. Biomed. J. Sci. Tech. Res. 2019, 20, 003446. [Google Scholar] [CrossRef]
- Bao, J.; Song, X.; Li, Y.; Bai, Y.; Zhou, Q. Effect of lighting illuminance and colour temperature on mental workload in an office setting. Sci. Rep. 2021, 11, 15284. [Google Scholar] [CrossRef] [PubMed]
- Arguelles-Prieto, R.; Madrid, J.A.; Rol, M.A.; Bonmati-Carrion, M.A. Correlated color temperature and light intensity: Complementary features in non-visual light field. PLoS ONE 2021, 16, e0254171. [Google Scholar] [CrossRef]
- Li, Z.; Wang, H.; Bai, Q.; Xiao, K.; Lu, Y.; Ma, L.; Dang, R. Color rendering evaluation model for lighting of traditional Chinese freehand brushwork paintings in museums. NPJ Herit. Sci. 2025, 13, 427. [Google Scholar] [CrossRef]
- Zhao, X.; Wang, Z.; Zhang, T.; Liu, T.; Yu, H.; Wang, H. Impact of Lighting Conditions on Emotional and Neural Responses of International Students in Cultural Exhibition Halls. Buildings 2025, 15, 2507. [Google Scholar] [CrossRef]
- Almustanyir, A.; Almutairi, M.S.; Aldrwish, A.; Hasrod, N.; Alqhtani, B.A.; Alqahtani, T.; Alanazi, M.; Alghamdi, M.; Almutleb, E.; Alabdulkader, B.; et al. The Effect of Pupil Size on Cone Contrast Sensitivity. Life 2025, 15, 801. [Google Scholar] [CrossRef]
- Li, R.; Yuizono, T.; Li, X. Affective computing of multi-type urban public spaces to analyze emotional quality using ensemble learning-based classification of multi-sensor data. PLoS ONE 2022, 17, e0269176. [Google Scholar] [CrossRef] [PubMed]
- Song, Y.; Wang, Q.; Zhang, X.; Dong, L.; Bai, S.; Zeng, D.; Zhang, Z.; Zhang, H.; Xi, Y. Interpretable machine learning for maximum corrosion depth and influence factor analysis. NPJ Mater. Degrad. 2023, 7, 9–15. [Google Scholar] [CrossRef]
- Li, Z. Extracting spatial effects from machine learning model using local interpretation method: An example of SHAP and XGBoost. Comput. Environ. Urban Syst. 2022, 96, 101845. [Google Scholar] [CrossRef]
- Mahmood, M.S.; Ali, T.; Inam, I.; Qureshi, M.Z.; Zaidi, S.S.A.; Alqurashi, M.; Ahmed, H.; Adnan, M.; Hotak, A.H. Machine learning prediction and explainability analysis of high strength glass powder concrete using SHAP PDP and ICE. Sci. Rep. 2025, 15, 22089. [Google Scholar] [CrossRef] [PubMed]
- Ramirez, C.A.M.; Greenop, M.; Ashton, L.; Rehman, I.U. Applications of Machine Learning in Spectroscopy. Appl. Spectrosc. Rev. 2021, 56, 733–763. [Google Scholar] [CrossRef]
Disclaimer/Publisher’s Note: The statements, opinions and data contained in all publications are solely those of the individual author(s) and contributor(s) and not of MDPI and/or the editor(s). MDPI and/or the editor(s) disclaim responsibility for any injury to people or property resulting from any ideas, methods, instructions or products referred to in the content. |
© 2025 by the authors. Licensee MDPI, Basel, Switzerland. This article is an open access article distributed under the terms and conditions of the Creative Commons Attribution (CC BY) license (https://creativecommons.org/licenses/by/4.0/).