Abstract
In recent years, metaheuristic optimization methods have been widely applied across various engineering disciplines, offering effective solutions to complex problems that require both efficiency and reliability. Within this context, this study has two primary objectives. The first is to apply the Dandelion Optimizer (DO), inspired by the three-stage flight of dandelion seeds, to the optimum design of spatial steel frames and to evaluate its performance as a structural optimization algorithm. The second is to investigate the influence of different soil types, as defined in the Turkish Building Earthquake Code (TBEC-2018), on the optimum design outcomes. For this purpose, three benchmark spatial steel frames consisting of 132, 428, and 720 members were optimized using DO. The algorithm was implemented in MATLAB R2017b and integrated with SAP2000 v19 via the Open Application Programming Interface (OAPI). The design process was performed in accordance with TBEC-2018 and the AISC-LRFD, with strength, stability, and serviceability constraints considered. The results indicate that deteriorating soil conditions from ZA to ZE lead to substantial increases in structural demands. In the three analyzed models, total weight increases within the range of 45–57%, whereas total seismic base shear shows a much sharper rise, ranging from 160% to 292% These findings demonstrate both the practical applicability of the DO in steel frame optimization and the critical impact of soil conditions on structural design, underlining the importance of incorporating geotechnical factors into optimization frameworks.
1. Introduction
There has been a growing tendency to employ metaheuristic search techniques in the optimization of real-world structural systems. Designing spatial steel structures optimally is challenging, since the models are complex and the design space is wide with many strength and serviceability constraints. In addition, seismic demands should be considered for calculating seismic loads on the structure. On the other hand, the seismic effects are related to soil conditions. The accurate determination of local soil conditions is significant in the safe and economical design of earthquake-resistant structures. Soil properties directly influence the velocity, amplitude, and frequency content of seismic waves, and thus strongly affect the dynamic response of structural systems. Soft and weak soils amplify ground motions, leading to larger seismic demands and more unfavorable structural responses compared with stiff soils. Within the scope of the Turkish Building Earthquake Code (TBEC-2018) [], soils are classified from ZA to ZE according to their bearing capacity and seismic behavior, where ZA represents the most favorable soil class and ZE the weakest. Therefore, seismic design approaches must explicitly include soil–structure interaction to provide structural solutions that are both dependable and efficient.
In structural optimization, numerous metaheuristic algorithms have been applied over the years. Classical metaheuristic methods such as Genetic Algorithm (GA) [], Particle Swarm Optimization (PSO) [], Ant Colony Optimization (ACO) [], Differential Evolution (DE) [], and Harmony Search (HS) [] were among the first to be adopted. Later, more sophisticated algorithms, including Teaching–Learning-Based Optimization (TLBO) [], Grey Wolf Optimizer (GWO) [], Ant Lion Optimizer (ALO) [], Crow Search Algorithm (CSA) [], Slime Mould Algorithm [], and Dandelion Optimizer (DO) [], were introduced.
Optimal design of spatial steel frames remains a challenging task due to the high-dimensional, nonlinear, and constraint-intensive nature of the problem. Numerous studies have adopted metaheuristic algorithms to address these complexities. Gheyratmand and Khanmohammady [] proposed PSO-based optimization of steel dual and moment frames while explicitly modeling soil–structure interaction (SSI) via a finite-element soil–foundation model. They showed practical implementation and highlighted that SSI is often neglected yet influential. Daloglu et al. [] studied optimum design of steel space frames including SSI, and employed a three-parameter elastic foundation with MATLAB–SAP2000 OAPI coupling. The study found SSI leads to heavier optimal frames and is feasible for practice. Artar [] used Harmony Search for minimum-weight steel space frames under Turkish Building Earthquake Code [] (TBEC)-2007 seismic effects with AISC-LRFD [] constraints. The MATLAB–SAP2000 OAPI framework proved robust across multiple seismic zones. Baradaran and Madhkan [] proposed an improved GA for plane frames with varying spans and subdivisions. Their findings showed the method produced lighter frame designs than standard GA. Hasançebi and Azad [] used Adaptive Dimensional Search (ADS) for discrete frame optimization. Their results matched those of contemporary heuristics, confirming ADS as a reliable method. van Woudenberg and van der Meer [] proposed a combinatorial search grouping method based on a fully stressed design for steel skeletal structures. The method improved grouping consistency, reduced computational cost, and achieved results comparable to cardinality-constrained optimization. Değertekin and Tutar [] introduced a hybrid learning-based Jaya algorithm and compared it with modified TLBO and Jaya. HL-Jaya achieved lighter designs and better convergence for planar and spatial frames. Liu et al. [] proposed a two-stage GA using a performance–price ratio after traditional optimization. Semi-rigid, second-order, imperfect, and plastic behaviors were considered, yielding more robust designs at slight increases in cost. Azizi and Talatahari [] addressed near-fault ground motion effects in steel building structures with nonlinear behavior by optimizing fuzzy controllers. They introduced an Improved Arithmetic Optimization Algorithm (IAOA), incorporating Levy flight to enhance parameter identification. Applied to large-scale structures, the IAOA outperformed standard AOA and other methods by reducing structural responses and damage under strong near-fault earthquakes. This study emphasizes the critical role of advanced optimization in seismic control design, particularly for regions exposed to near-fault motions where traditional fuzzy controllers may fail. Eser et al. [] applied the Capacity-Controlled Search for performance-based design optimization of steel moment frames. CCS required far fewer analyses and showed force-based designs can be heavier yet miss performance targets. Saka et al. [] reviewed optimization of steel skeletal structures from 1960 to present. They traced the shift from mathematical programming to soft-computing methods suited to discrete, code-constrained design. Üstüner and Doğan [] optimized outrigger-braced high-rise steel frames with SSI using the Honey Badger Algorithm, the Aquila Optimizer, and the Grey Wolf Optimizer in MATLAB–SAP2000. They showed outrigger configuration and SSI critically affect optimal weight, with methods suitable for practice. In addition to these developments, recent studies have emphasized the growing role of Artificial Intelligence (AI) in structural optimization. Soori and Jough [] reviewed applications of AI techniques for steel moment frames, highlighting the use of machine learning, neural networks, and AI-driven algorithms in design and seismic performance prediction [,,,].
This study applies the recently developed Dandelion Optimizer (DO), a metaheuristic inspired by the three-stage dispersal mechanism of dandelion seeds, to the optimum design of three spatial steel frames across various soil classes defined in TBEC-2018. The motivation for using DO lies in its successful applications to various engineering optimization problems [,,] and, more specifically, to planar steel frames [], which inspired us to extend its application to spatial steel frames under seismic loading. It should be noted that metaheuristic methods do not guarantee reaching the global optimum; thus, the solutions presented here represent near-optimal designs obtained through multiple independent runs. While only DO is examined in this study, the framework is general and could be extended to other metaheuristics or hybrid strategies, which remains an interesting direction for future research.
Three models include a 132-member frame, a 428-member frame, and a 720-member, 10-story frame. Structural design and optimization were carried out according to TBEC-2018 [] and the AISC-LRFD [], considering strength, stability, and story drift constraints. Structural analyses were performed using SAP2000 v19 [], with data transfer between MATLAB R2017b [] and SAP2000 enabled via the Open Application Programming Interface (OAPI). Each frame was analyzed under soil classes ZA to ZE, and the results were compared to assess the influence of soil conditions on optimal design.
The paper is organized as follows: Section 2 outlines the formulation of the optimum design problem for space frames. Section 3 describes the optimization procedure based on the DO. Section 4 presents the calculation of seismic loads and the classification of soil types in accordance with TBEC-2018. Section 5 demonstrates the implementation of DO for various steel frame models. Section 6 discusses the optimization results and provides a comparative evaluation across soil classes. Finally, the last section presents the conclusions of the paper.
2. Optimal Design Problem of Space Frame Structures
The optimum sizing problem of space steel frames is formulated based on the AISC-LRFD specification, with the objective of minimizing structural weight. The design variables are the discrete section types assigned to each member, selected from standard profiles such as IPE, HEA, and HEB. The mathematical explanation of the problem is as follows:
Let {X} denote the vector of design variables, represents the number of design variables, and S is the discrete set of available section types. The material density is denoted by , while and correspond to the cross-sectional area and length of i-th member, respectively. is the total number of members. are design constraints and number of design constraints, respectively. To account for constraint violations, a penalized objective function is employed as follows:
where is the penalized objective function of the steel frame structure, is the penalty factor, is the total violation of design constraints and represents the total load combinations.
For steel frame structures, strength and inter-story drift constraints are imposed according to provisions of AISC-LRFD requirements. These constraints are expressed briefly in the following:
where and are lateral displacements of successive stories, is the height of the story, is the inter-story drift of the i-th story, denotes the allowable value of the inter-story drift, and ns is the number of stories.
Strength constraints consider axial forces, bending moments, and shear forces. For calculation of the capacity strength of members:
where is the required axial strength in compression or tension, is the nominal axial strength in both tension or compression, is the resistance factor, and are the required flexural strengths about the x and y axes, respectively, and and are the nominal flexural strengths about the x and y axes, respectively. ϕb denotes the resistance factor for flexure. The detailed formulations for limit states, including nominal axial and flexural strengths, shear capacity, and plastic moment resistance, are provided in the AISC-LRFD specification and are therefore not repeated here for brevity.
3. Dandelion Optimizer (DO)
The Dandelion Optimizer (DO) is a nature-inspired metaheuristic method based on the three-phase flight behavior of dandelion seeds carried by the wind. The algorithm consists of ascending, descending, and landing phases, each represented by distinct mathematical models [].
3.1. Population Initialization in DO
Similar to other nature-inspired metaheuristics, the Dandelion Optimizer (DO) operates on an evolving population of candidate solutions. Each seed represents a solution vector within the search space. The population is initialized randomly between the predefined lower and upper bounds (LB, UB) as
Here, is a random number in [0, 1], while and denote the lower and upper bounds of the variables, respectively. Among the generated solutions, the one with the best fitness value is selected as the initial elite candidate, which serves as the starting reference point for the optimization process.
3.2. Ascent Phase
The ascent phase represents a critical step in the DO algorithm, where the balance between exploration and exploitation is established. Under clear weather conditions, the seed positions are updated using a lognormal distribution:
Here, denotes the current position, is a randomly selected position, represents the adaptive step size, and , are the vortex components. The term , which follows a lognormal distribution subject to μ = 0 and .
In rainy weather conditions, the ascent is restricted, and local search becomes dominant:
where is a parameter regulating the local search domain. As the number of iterations increases, gradually converges to 1, ensuring that the population steadily approaches the optimal search region.
3.3. Descent Phase
In the descent phase, dandelion seeds gradually return after reaching a certain height. Within DO, this process is modeled using Brownian motion, which introduces random perturbations following a normal distribution. This randomness enhances global exploration and helps individuals avoid local optima.
The update mechanism is expressed as
where represents Brownian motion [] and is the average population position at iteration t:
This formulation ensures that individuals are updated relative to the population’s mean, directing the search toward promising regions. The irregular Brownian trajectory promotes global exploration, reducing the risk of stagnation and facilitating convergence toward the global optimum.
3.4. Landing Phase
The third stage of the DO algorithm corresponds to the descent phase. At this stage, dandelion seeds, after rising motion, move toward randomly selected positions with the aim of approaching the global optimum. As the iterations progress, the algorithm is expected to converge toward better solutions in the search space. During this process, the knowledge of the elite solution is shared with other individuals in the population, thereby guiding the evolutionary process toward the global optimum.
Mathematically, the descent phase can be expressed as
Here, represents the best solution found in the current iteration, while denotes the Levy flight distribution [], which enables long jumps and exploration of distant regions in the search space. The parameter is a linearly increasing function of the iteration number, designed to regulate the step size of the individuals.
The incorporation of Levy flights increases the likelihood of escaping local optima by allowing search agents to explore both nearby and remote regions. This mechanism prevents premature convergence and ensures that the population maintains the capability for global exploration. Consequently, the descent stage balances exploration and exploitation, driving the algorithm toward a more reliable convergence to the global optimum.
The overall workflow of the Dandelion Optimizer, whose procedural steps were described above, is illustrated in the flowchart presented in Figure 1.
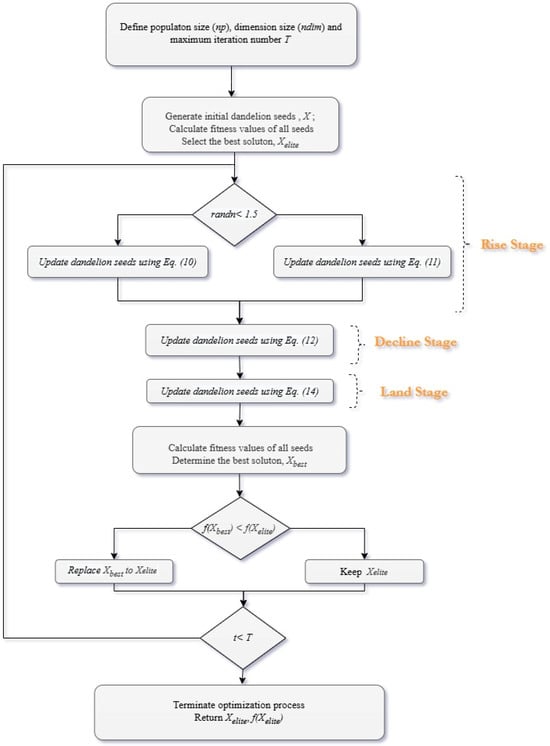
Figure 1.
DO flowchart.
4. Design Earthquake Parameters According to TBEC-2018
4.1. Soil Classifications
The interaction between seismic waves and soil types is a critical factor that directly influences the intensity of ground shaking experienced by structures. In bedrock, seismic waves travel rapidly with minimal amplification, while well-consolidated sediments also limit the effect to a moderate degree. In contrast, poorly consolidated soils significantly amplify wave amplitudes (Figure 2). Water-saturated soft soils are particularly hazardous, as they not only intensify seismic waves but also carry a high risk of liquefaction, leading to the most destructive consequences during earthquakes. This highlights the necessity of carefully accounting for site conditions in seismic design and earthquake engineering practice [].
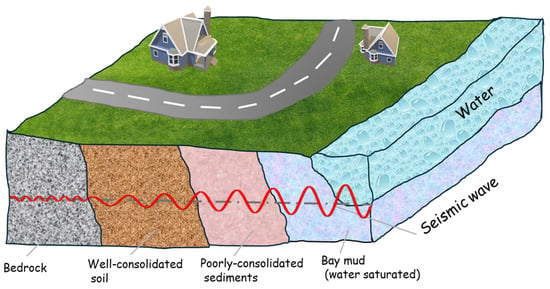
Figure 2.
Relationship between seismic wave amplitudes and soil types [].
TBEC-2018 classifies soils into five primary categories (ZA, ZB, ZC, ZD, and ZE) based on their bearing capacity and dynamic behavior, with an additional special category (ZF) defined for problematic soil conditions requiring site-specific studies. The classification is primarily determined by the average shear wave velocity (Vs30), representing the overall stiffness of the soil deposit; the standard penetration resistance (N60), which provides a measure of soil density and relative strength obtained from in-situ penetration tests; and the undrained shear strength (Cu), describing the short-term shear resistance of cohesive soils within the upper 30 m profile, as provided in Table 1 [].

Table 1.
TBDY-2018 soil classification.
Class ZA corresponds to competent rock formations with high stiffness and minimal deformation, whereas ZB and ZC represent stiff to medium-dense soils. In contrast, ZD and particularly ZE represent soft soils with low bearing capacity that tend to amplify seismic waves, leading to higher seismic demands on structures. A detailed classification is provided in Table 1, and soils requiring site-specific investigation are grouped under ZF, including liquefiable soils, organic clays, and thick, soft deposits.
4.2. Local Site Effect Coefficients
Once the soil class is determined, site amplification effects are incorporated through the short-period (FS) and 1-s period (F1) local site effect coefficients. These coefficients are essential for constructing the design response spectrum and directly influence the seismic demand considered in structural design. In TBEC-2018, the local site effect coefficients are defined based on the soil class and mapped spectral acceleration values, as presented in Table 2 and Table 3. Incorrect soil classification can result in either unsafe under-design or uneconomical over-design; thus, accurate geotechnical investigations are critical for both safety and sustainability.

Table 2.
Local side effect coefficients for short periods (Fs).

Table 3.
Local site effect coefficients for 1-s periods (F1).
4.3. Seismic Spectra Acceleration Coefficients
To define the seismic design forces, it is first necessary to establish the standard seismic ground motion spectra. Since the local site effect coefficients vary depending on the spectral values, these spectra must be determined in advance. For this purpose, the AFAD Seismic Hazard Map [], which offers an interactive web-based tool for determining seismic design data across the country, is utilized. This map provides the spectral parameters Sₛ, S1, and Peak Ground Acceleration (PGA) by requiring inputs such as the building location, site class, and selected ground motion level.
The AFAD Seismic Hazard Map provides spectral acceleration parameters such as PGA, Ss, and S1 for reference rock conditions (V = 760 m/s). However, since real soil conditions often deviate from reference rock, these values must be adjusted using TBDY-2018 soil classes and their corresponding coefficients given in Table 2 and Table 3.
The design spectral accelerations are obtained as
4.4. Seismic Ground Motion Levels
TBEC-2018 defines four earthquake ground motion levels: DD1, DD2, DD3, and DD4 based on different probabilities of exceedance within 50 years, reflecting rare to frequent seismic events. This classification forms the basis of performance-based design, allowing structures to be evaluated for both safety under rare events and serviceability under more frequent ones.
For newly constructed steel buildings, excluding high-rise ones, TBEC-2018 prescribes the use of the standard earthquake ground motion level DD2 in strength-based design. DD2 corresponds to the design earthquake, defined as an event with a 10% probability of exceedance in 50 years (return period of approximately 475 years), and forms the reference level for the seismic design of new steel buildings.
4.5. Elastic Design Spectrum
The elastic response spectrum Sae(T) represents the maximum expected acceleration demand for a single-degree-of-freedom system at period T with 5% damping. Since TA and TB are calculated from the parameters SDS and SD1, which themselves are functions of soil class and mapped spectral accelerations, it follows that the soil classification has a direct influence on the shape of the design spectrum. As illustrated in Figure 3, the elastic spectrum describes the variation of the elastic spectral acceleration with vibration period, forming the basis for seismic demand calculations in structural design.
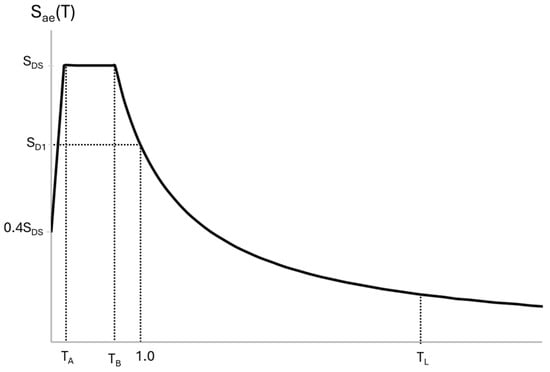
Figure 3.
Elastic design spectrum [].
4.6. Equivalent Seismic Lateral Force Calculation
The equivalent seismic lateral force method is a simplified procedure used to estimate earthquake-induced forces on structures. According to TBEC-2018, the design base shear is obtained from the elastic design spectrum and then distributed along the building height in proportion to the mass and dynamic characteristics of the structure. The total base shear force (Ve) acting on a structure is determined as follows:
where is the effective total mass of the structure, and is the seismic load reduction factor, whose values depend on the structural system type, ductility, and height class as specified in TBEC-2018 (see TBEC-2018, Table 4.1C). I is a coefficient increasing the design earthquake forces in proportion to the building’s importance, which is detailed in TBEC-2018, Table 3-1.
Once the total base shear is determined, it is distributed over the building height according to mass and elevation. The additional equivalent seismic load acting at the top story (N-th story) of the building is determined as follows:
The remaining portion of the total equivalent seismic load, excluding , shall be distributed to all stories of the building, including the N-th story, in accordance with Equation (23).
A comprehensive description of the calculation procedure, together with the underlying assumptions and limitations, is provided in the TBEC-2018.
5. Numerical Examples
In this section, three different space steel frames with various geometries and dimensions: 132-member frame, 428-member frame, and 720-member frame are considered for optimization under equivalent lateral seismic forces calculated in accordance with TBEC-2018 provisions. The optimization process was carried out using the Dandelion Optimizer (DO) algorithm, implemented in MATLAB and integrated with SAP2000 through the Open Application Programming Interface (OAPI), which enabled automated transfer of sectional properties and structural analysis results.
Although the benchmark frames consist of 132, 428, and 720 members respectively, the actual number of design variables is reduced by grouping members of the same type, with each group assigned a single cross-section type. The design constraints were defined in accordance with AISC-LRFD requirements, and inter-story drift limits were assigned based on the size of the structural system: 1/300 for the 132-member frames, and 1/400 for the 428- and 720-member frames. All frames were modeled with fixed supports at their bases. Beam members were assigned IPE sections, while column members were modeled using H-type profiles. The steel material properties were taken as an elastic modulus of 210 GPa and a yield strength of 275 MPa.
To evaluate the influence of soil conditions, five TBEC-2018 site categories (ZA, ZB, ZC, ZD, and ZE) were considered. For each soil class, five independent optimization runs were performed, leading to 25 runs for each structural model. The maximum number of iterations was set to 500, with a population size of 20. Consequently, 10,000 design alternatives were evaluated in each independent run to obtain the optimum-weighted space steel frame.
The performance of the DO was also evaluated through statistical measures, including the best, worst, mean, and standard deviation values obtained over five independent runs. Furthermore, the convergence behavior was examined and presented in figures, illustrating the variation of the optimum structural weight with respect to the iteration number. Finally, the optimization results were comparatively assessed across different soil classes in terms of structural weight, base shear forces, and natural periods, providing insights into the effect of local site conditions on the optimum design of space steel frames.
5.1. 132-Member Space Steel Frame
The first model is a four-story space steel frame consisting of 132 members and 70 nodes, previously investigated in Refs. [,] The three-dimensional configuration of the structure is presented in Figure 4, while its dimensional properties are illustrated in Figure 5.
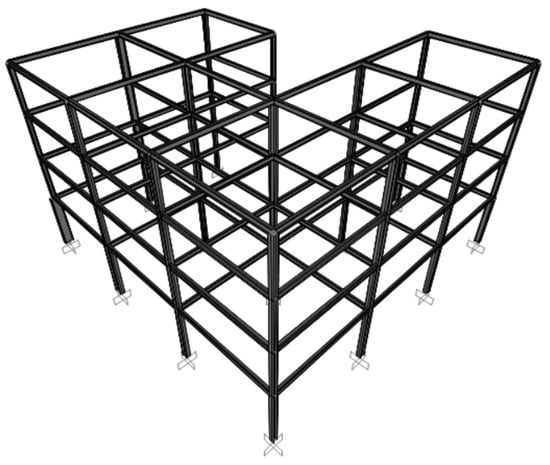
Figure 4.
Three-dimensional view of 132-member space steel frame.
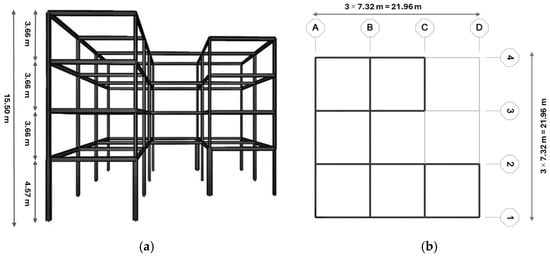
Figure 5.
Schematic of the 132-member frame (a) 3D perspective view (b) XY view.
The structure was subjected to ten different loading conditions. Dead loads were applied as uniformly distributed loads on the beams, with magnitudes of 21.49 kN/m for exterior beams and 25.29 kN/m for interior beams on the first three floors.
At the roof level, exterior beams carried 14.77 kN/m, while interior beams carried 17.42 kN/m. Seismic loads were computed in accordance with the Equivalent Seismic Load Method defined in the TBEC-2018. The seismic parameters used in the analysis are summarized in Table 4. The member grouping adopted for this example is presented in Table 5.

Table 4.
Seismic design parameters of the 132-member frame for different soil classes according to TBEC-2018.

Table 5.
Optimal results for a 132-member space steel frame.
The optimum structural weights obtained by the Dandelion Optimizer for different soil classes are summarized in Table 5. The values increase progressively from 48.519 t (ZA) to 81.730 t (ZE), reflecting the influence of soil class on seismic demand. This rising trend is consistent with the fact that softer soils amplify ground motions more significantly, which in turn requires larger cross-sectional capacities to meet both strength and drift limitations. A closer examination reveals that the results for ZA (48.519 t) and ZB (49.730 t) are very similar. This can be explained by the proximity of their design spectral parameters, SDS and SD1, which yield comparable equivalent seismic forces. In contrast, as the soil class transitions to softer categories, a more pronounced increase is observed: 57.165 t for ZC, 66.250 t for ZD, and 81.730 t for ZE. Overall, the results demonstrate a nearly 70% increase in optimum structural weight from stiff rock conditions (ZA) to very soft soil (ZE). For visualization, Figure 6 compares the best weight values obtained for each soil class, clearly illustrating the increasing trend from ZA to ZE.
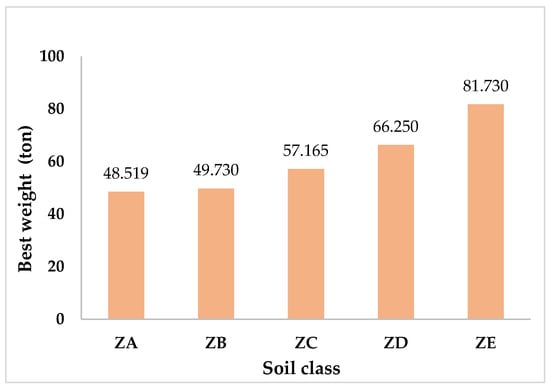
Figure 6.
Best structural weight values of the 132-member space steel frame obtained for different soil classes.
The reduction of the structural weight with respect to the iteration number is depicted in Figure 7. In all cases, the structural weight decreases rapidly within the first 50–100 iterations, after which the curves gradually stabilize, indicating that the algorithm quickly approaches near-optimal solutions.
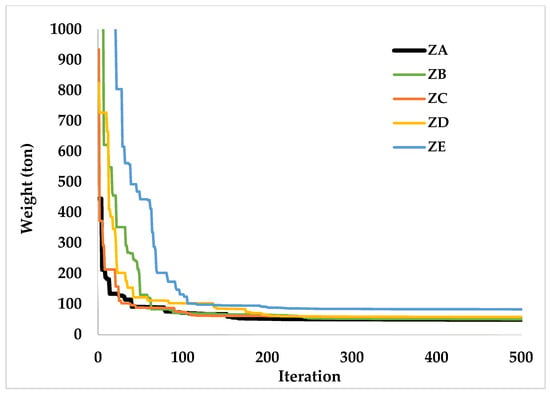
Figure 7.
Convergence behavior of the DO for the 132-member space steel frame under different soil classes.
Figure 8 illustrates the strength ratios of the structural members across different soil classes. All members satisfy the strength requirements, with demand-to-capacity ratios remaining below the allowable limit of 100%, depicted as a red line.
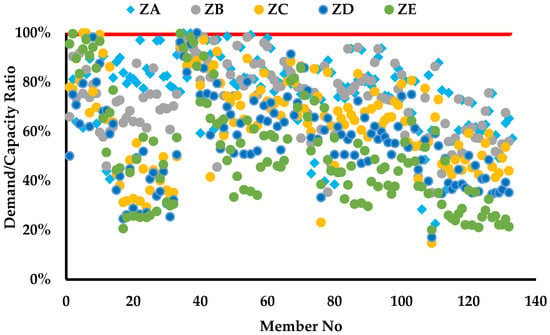
Figure 8.
Demand-to-capacity ratios of the members of the 132-member space steel frame under different soil classes.
An evaluation of the demand-to-capacity ratios reveals that the proportion of members operating at higher capacity levels decreases markedly as the soil class transitions from stiff to soft. In ZA, 61 members (46.2%) exceed 80% utilization, while in ZE, only 21 members (15.9%) reach this threshold. This trend can be explained by the fact that softer soils, although imposing higher seismic demands, require the adoption of larger cross-sections to control lateral drift. Consequently, the increased section capacities result in lower D/C ratios compared to stiffer soil cases, where smaller sections lead to higher utilization levels.
Figure 9 presents the inter-story drift ratios of the 132-member space frame optimized for different soils. All cases remain below the allowable drift limit (0.0033), as indicated by the vertical red line. Across all site classes, the 2nd story drifts cluster near the allowable limit, indicating that the second story governs the serviceability check for this model.
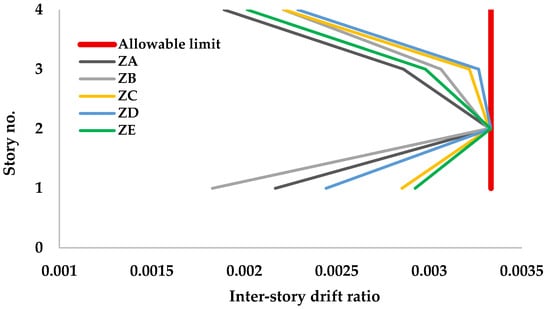
Figure 9.
Inter-story drift ratios of the 132-member space steel frame for different soil classes.
The dynamic characteristics of the 132-member space steel frame under different soil classes are summarized in Table 6. The results indicate a gradual reduction in the fundamental periods as the soil class changes from ZA to ZE. For example, the period in the x-direction decreases from 2.125 s (ZA) to 1.452 s (ZE), while in the y-direction, it reduces from 2.115 s (ZA) to 1.424 s (ZE). This trend is consistent with the heavier and stiffer sections required in softer soils, which increase global lateral stiffness and shorten the vibration periods.

Table 6.
Natural periods of the 132-member space steel frame under different soil classes.
The corresponding base shear forces obtained from TBEC-2018 are given in Table 7. The base shear forces increase significantly with soil softness, rising from 305 kN (ZA) to over 1092 kN (ZE) in both directions. This sharp increase reflects the amplification effect of local site conditions on the design spectral ordinates SDS and SD1, which directly govern the seismic demand.

Table 7.
Total base shear forces of 132-member frame calculated according to TBEC-2018 for different soil classes.
5.2. 428-Member Space Steel Frame
A four-story space steel frame comprising 256 beams and 172 columns, previously investigated in Refs. [,], is considered in this study. The members are divided into 20 groups, including inner and outer beams for each story, as well as corner, outer, and inner columns. The member grouping, vertical loading, and geometric configuration (Figure 10 and Figure 11) are consistent with those in the literature; however, the seismic loading and load combinations have been updated in accordance with TBEC-2018. This distinction differentiates the present work from earlier studies, enabling a more comprehensive evaluation of seismic performance under current design provisions.
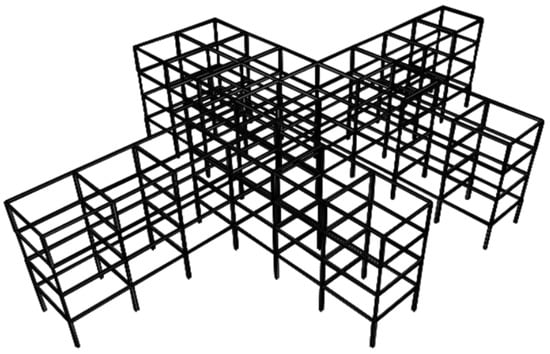
Figure 10.
Three-dimensional view of a 428-member space steel frame.
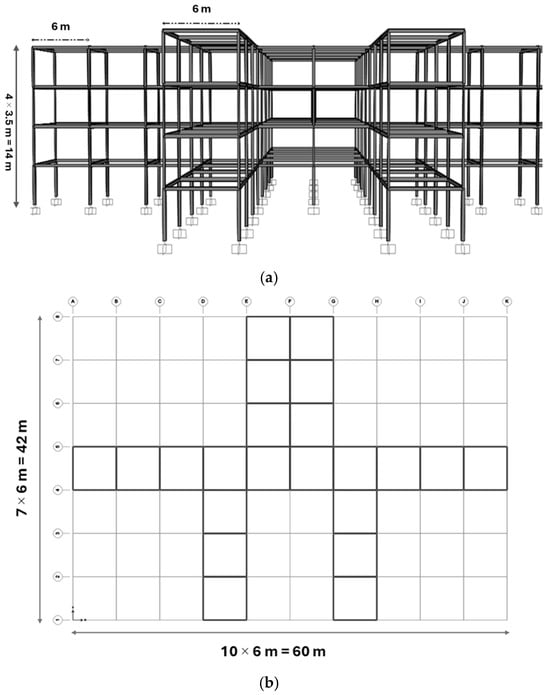
Figure 11.
Schematic of the 428-member frame: (a) 3D perspective view and (b) XY view.
The structure was subjected to dead loads, live loads, and seismic loads. Dead loads of 8.64 kN/m and 17.28 kN/m were applied to exterior and interior beams, respectively. Live loads were taken as 7.17 kN/m and 14.34 kN/m. Seismic effects were calculated using the Equivalent Seismic Load Method defined in TBEC-2018. In total, ten load combinations involving dead, live, and seismic effects were considered in the analysis. The adopted seismic parameters are listed in Table 8.

Table 8.
Seismic design parameters of the 428-member frame for different soil classes according to TBEC-2018.
The optimum sections and statistical results for the 428-member space steel frame are summarized in Table 9. The best structural weights increase from 87.53 t (ZA) to 137.75 t (ZE), corresponding to an approximate 57% increase as the soil class transitions from stiff to very soft (Figure 12). A closer inspection of the optimum designs shows that for soil classes ZA through ZC, the column sections are generally moderate in size, most often within the HE200A to HE300A range. In contrast, for ZD and ZE, substantially heavier sections such as HE500A, HE550B, and even HE600A are required in the lower stories. This shift reflects the redistribution of seismic forces and the increased demand for axial and flexural strength in softer soil conditions. In comparison, the beam sections display less variation across soil classes, although in the ZE case, heavier profiles, including IPE450 and IPE500, are assigned to the upper stories.

Table 9.
Optimal results for a 428-member space steel frame.
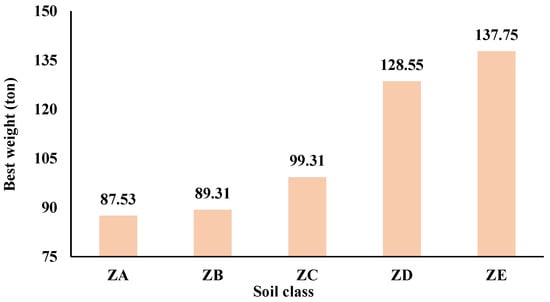
Figure 12.
Best structural weight values of the 428-member space steel frame obtained for different soil classes.
The convergence behavior of the DO reveals a rapid reduction in structural weight during the early iterations (0–100) (Figure 13). With respect to soil class, however, the convergence curves do not exhibit a systematic trend apart from the differences in the final optimum weights. This irregularity can be attributed to the stochastic nature of the DO, where random initialization and probabilistic search operations govern the early and mid-iteration paths. By contrast, soil class primarily influences the design constraints through seismic loads, which dictate the final optimum solution rather than the trajectory of convergence.
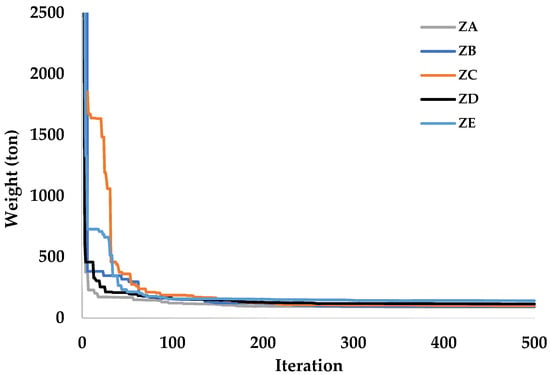
Figure 13.
Convergence behavior of the DO for the 428-member space steel frame under different soil classes.
The demand-to-capacity (D/C) ratios of the 428-member space steel frame across different soil classes are illustrated in Figure 14. All ratios remained below the critical limit of 100%, confirming structural safety. In ZA, 67 members operate at more than 80% of their design capacity, corresponding to about 16% of the total members, whereas in ZE, only 26 members (around 6%) reach this level. This difference is directly related to the drift constraint: in softer soils, the larger seismic demands require greater lateral stiffness, which the optimizer achieves by selecting substantially heavier sections. These larger sections reduce inter-story drifts but also provide higher strength reserves, lowering the D/C ratios of individual members.
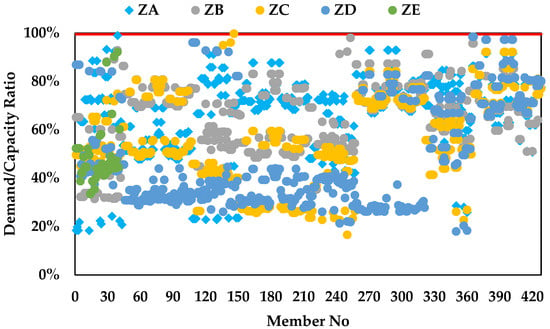
Figure 14.
Demand-to-capacity ratios of the members of the 428-member space steel frame under different soil classes.
Figure 15 shows the inter-story drift ratios of the 428-member frame for different soil classes. All cases remain below the allowable limit of 0.0025, but notable differences appear. ZA and ZB exhibit relatively lower drift demands, while ZD and ZE approach the limit more closely in the upper stories due to higher seismic forces.
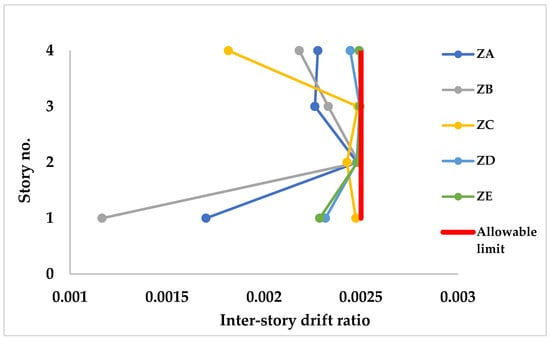
Figure 15.
Inter-story drift ratios of the 428-member space steel frame for different soil classes.
Table 10 and Table 11 summarize the natural periods and base shear forces of the 428-member space steel frame for different soil classes. As expected, the fundamental periods decrease progressively from stiff to soft soils: Tx reduces from 2.13 s in ZA to 1.45 s in ZE, while Ty drops from 2.12 s to 1.42 s. This reduction reflects the increased lateral stiffness imposed using heavier sections in softer soil conditions. The base shear forces exhibit the opposite behavior, rising significantly as soil flexibility increases. The base shear demand grows from 311.9 kN in ZA to 1223.5 kN in ZE, nearly a fourfold increase. This depends directly on the amplification of seismic demands through higher site coefficients in soft soils.

Table 10.
Natural periods of the 428-member space steel frame under different soil classes.

Table 11.
Total base shear forces of 428-member frame calculated according to TBEC-2018 for different soil classes.
5.3. 720-Member Space Steel Frame
The final frame example is an eight-story space frame consisting of 720 members and 594 nodes (Figure 16 and Figure 17). The system comprises 552 beams and 168 columns, organized into 21 member groups for optimization. Beams are classified as inner, outer, and secondary, while columns are categorized as corner, outer, and inner according to their axis positions. In contrast to the previous case studies drawn from literature, this structural model was generated for the present research, with the objective of evaluating the performance of the DO on a taller and more complex structural configuration subjected to higher seismic demands.
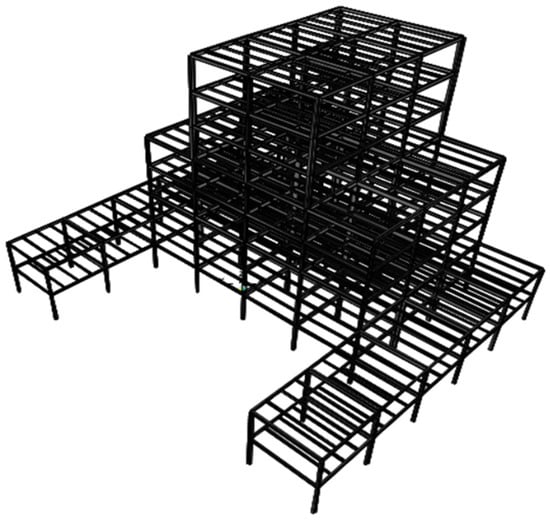
Figure 16.
Three-dimensional view of a 720-member space steel frame.
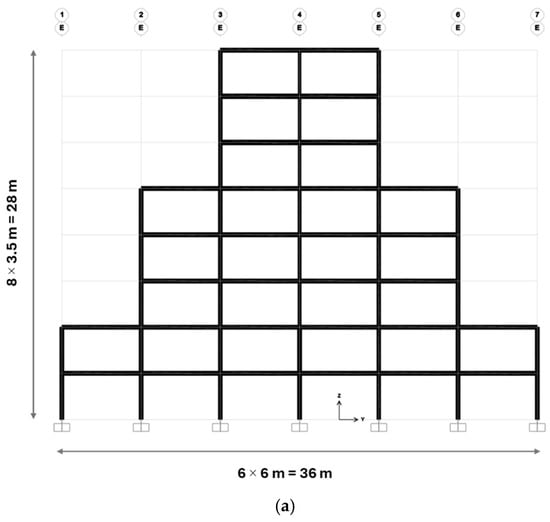
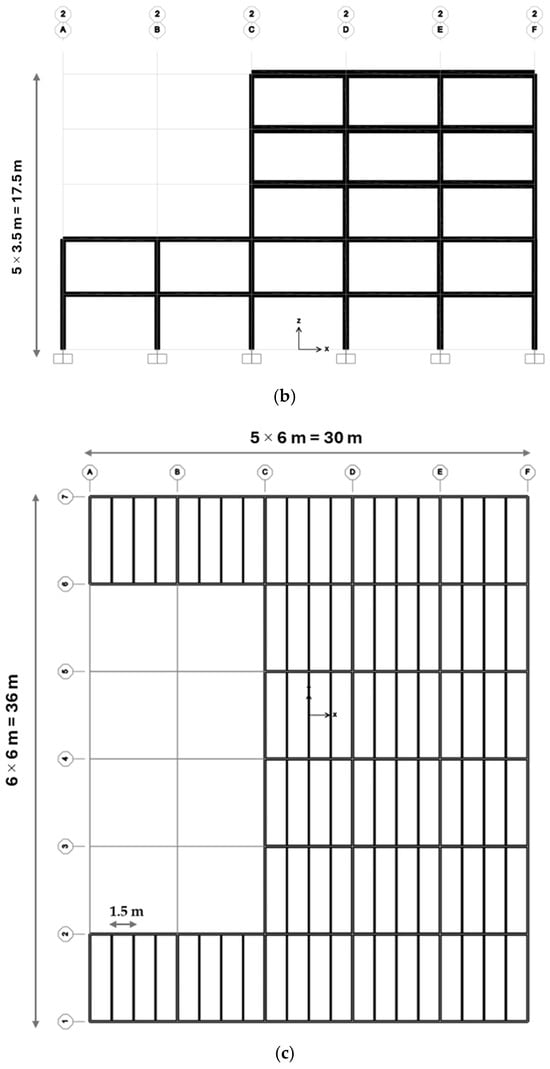
Figure 17.
Schematic of the 720-member space steel frame: (a) YZ view on the E axis, (b) XZ view on the 2nd axis, and (c) XY view on +7.00 m.
The frame was subjected to dead, live, and seismic loads. Dead loads were taken as 3.25 kN/m2 for the roof floor and 3.75 kN/m2 for the typical floors, while live loads were taken as 1.5 kN/m2 for the roof floor and 2.0 kN/m2 for the typical floors. All area loads were converted into equivalent uniform line loads acting on the beams. Seismic effects were determined using the Equivalent Seismic Load Method defined in TBEC-2018, and the seismic parameters are provided in Table 12.

Table 12.
Seismic design parameters of the 720-member frame for different soil classes according to TBEC-2018.
Table 13 presents the optimum design results for the eight-story, 720-member space frame. The effect of soil conditions on structural weight is evident: the best solutions increase from 175.7 t in ZA to 255.1 t in ZE, while the mean values follow a similar trend, ranging between 182.3 t and 260.4 t. This corresponds to nearly a 45% rise in optimum weight as the site class shifts from stiff to soft soils (Figure 18).

Table 13.
Optimal results for a 720-member space steel frame.
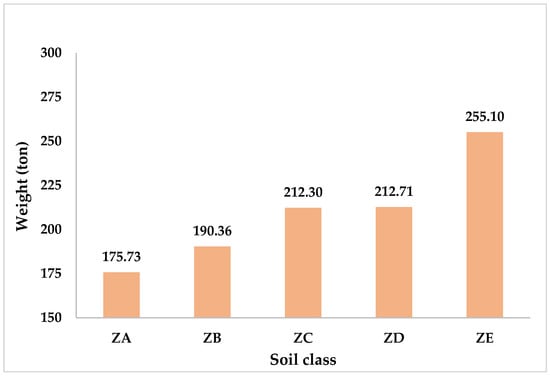
Figure 18.
Best structural weight values of the 720-member space steel frame obtained for different soil classes.
The section choices provide further insight into this trend. In stiff soils such as ZA and ZB, moderate column sizes like HE260A–HE400A are generally adequate, and beams remain relatively light, often within the IPE200–IPE300 range. For softer soils (ZD, ZE), however, the optimizer assigns considerably heavier sections, including HE900A, HE1000A/M, and large IPE profiles up to IPE600, especially in the lower stories. In softer soil conditions, the combination of increased seismic demand and stricter drift limitations necessitates the selection of larger structural members. While these sections enhance the overall lateral stiffness of the frame, they simultaneously contribute to a considerable increase in structural weight.
The convergence histories of the eight-story, 720-member steel frame under different soil classes are presented in Figure 19. A substantial reduction in structural weight is achieved within the first 100 iterations. When comparing soil classes, no consistent trend is observed in the convergence trajectories. This irregularity reflects the stochastic nature of the optimization process, where random initialization and probabilistic update mechanisms govern the early search behavior.
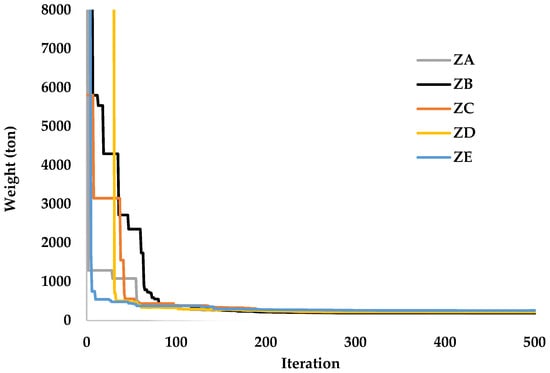
Figure 19.
Convergence behavior of the DO for the 720-member space steel frame under different soil classes.
The demand-to-capacity (D/C) ratios of the 720-member space steel frame under different soil classes are presented in Figure 20. All members remain below the critical threshold of 100%, ensuring structural safety. In the stiff soil condition (ZA), 355 members, representing approximately 49% of the total, operate at utilization levels above 80%. By contrast, in the softest soil condition (ZE), this proportion decreases to 297 members, or about 41.5% of the total. In all soil classes, almost half of the members in the optimum designs operate above 80% utilization. This demonstrates that the Dandelion Optimizer is able to approach the constraint boundaries effectively, ensuring structurally efficient solutions while still achieving lower weight.
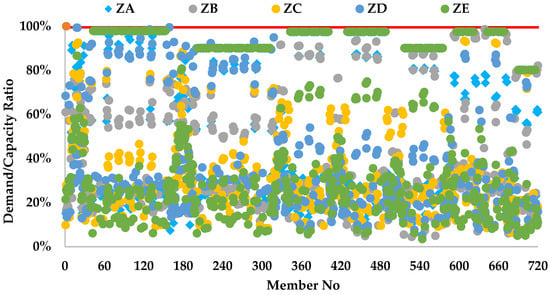
Figure 20.
Demand-to-capacity ratios of the members of the 720-member space steel frame under different soil classes.
Inter-story drift ratios calculated for all stories are presented in Figure 21, with the maximum allowable drift ratio set to 1/400. Optimum designs obtained across all soil classes satisfied the drift limit. The most critical stories are the 2nd, 3rd, 6th, and 7th, where drift ratios approach the allowable limit in all soil classes. Despite differences in values, the distribution trends are similar across soil classes, indicating consistent drift behavior under varying seismic demands.
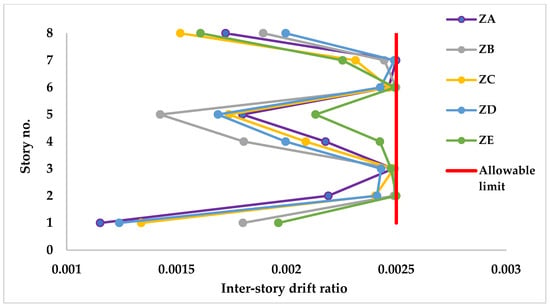
Figure 21.
Inter-story drift ratios of the 720-member space steel frame for different soil classes.
Table 14 and Table 15 present the natural periods and base shear forces of the 720-member space steel frame under different soil classes. The results show a reduction in natural periods as soil conditions soften. In the x-direction, the fundamental period decreases from 1.91 s in ZA to 1.38 s in ZE, while in the y-direction, it drops from 1.80 s to 1.23 s. This shortening of periods reflects the greater lateral stiffness of the frame, achieved through the selection of heavier sections in softer soil conditions. Conversely, the base shear values increase markedly with soil flexibility. The total base shear grows from 414.0 kN in ZA to 1077.3 kN in ZE, more than doubling across the soil spectrum. This rise is not only a consequence of higher site coefficients, which amplify spectral accelerations, but also of the increased structural mass resulting from the heavier sections required to satisfy drift and strength demands. The combined effect of these two factors significantly magnifies the seismic forces acting on the structure in softer soil conditions.

Table 14.
Natural periods of the 720-member space steel frame under different soil classes.

Table 15.
Total base shear forces of 720-member frame calculated according to TBEC-2018 for different soil classes.
6. Conclusions
The findings confirm that soil class has a great impact on the optimum seismic design of space steel frames. Using the Dandelion Optimizer (DO) implemented in MATLAB and linked with SAP2000 through OAPI, three benchmark models of increasing complexity were optimized under equivalent seismic loads, revealing substantial differences in weight, member sizing, and seismic response across soil classes. Optimum weights consistently increased from stiff to soft soils. For example, in the 132-member frame, the weight rose from 48.5 t in ZA to 81.7 t in ZE, while in the 720-member frame, it increased from 175.7 t to 255.1 t. Softer soils required larger sections to satisfy drift and strength constraints, which enhanced stiffness but resulted in heavier structures. Drift ratios remained within the allowable limits for all cases. The distribution of demand-to-capacity ratios further showed that stiffer soil conditions caused a higher proportion of members to work close to their capacity, whereas softer soils produced heavier sections with lower utilization levels.
The DO demonstrated satisfying performance, achieving rapid convergence in the early stages and consistent solutions across multiple runs. Its capability to search near constraint boundaries while minimizing weight highlights its suitability for seismic optimization of steel frames.
A comparison among the three frame models shows that the effect of soil class on structural weight varies with scale. The 132-member frame displayed the largest relative increase in weight from ZA to ZE at about 68%, whereas the increases were 57% in the 428-member frame and 45% in the 720-member frame. This suggests that while soil flexibility consistently produces heavier designs, its proportional impact decreases in larger systems.
Future studies may focus on incorporating reliability-based or performance-based seismic design approaches to better capture uncertainties in ground motion and material properties. The use of hybrid optimization strategies or surrogate modeling techniques could help reduce the computational cost of large-scale analyses while enhancing the robustness of the solutions. Furthermore, benchmarking the DO against other well-established metaheuristics may provide a broader perspective on algorithmic performance.
Author Contributions
Conceptualization, I.B.U.; methodology, I.B.U.; software, I.B.U.; formal analysis, I.B.U. and O.K.; investigation, O.K.; data curation, I.B.U. and O.K.; validation, I.B.U. and O.K.; writing—original draft preparation, I.B.U. and O.K. writing—review and editing, I.B.U.; supervision, I.B.U. All authors have read and agreed to the published version of the manuscript.
Funding
This research received no external funding.
Institutional Review Board Statement
Not applicable.
Informed Consent Statement
Not applicable.
Data Availability Statement
The data presented in this study are included in the article; further inquiries can be directed to the corresponding author.
Conflicts of Interest
The authors declare no conflicts of interest.
References
- Disaster and Emergency Management Presidency. Turkish Building Earthquake Code; Disaster and Emergency Management Presidency: Ankara, Turkey, 2018. [Google Scholar]
- Holland, J.H. Adaptation in Natural and Artificial Systems; University of Michigan Press: Ann Arbor, MI, USA, 1975; Volume 1. [Google Scholar]
- Kennedy, J.; Eberhart, R. Particle Swarm Optimization. In Proceedings of the 1995 IEEE International Conference On Neural Networks, VOLS1-6, Perth, Australia, 27 November–1 December 1995; pp. 1942–1948. [Google Scholar]
- Dorigo, M.; Maniezzo, V.; Colorni, A. Ant System: Optimization by a Colony of Cooperating Agents. IEEE Trans. Syst. MAN Cybern. Part B Cybern. 1996, 26, 29–41. [Google Scholar] [CrossRef]
- Storn, R.; Price, K. Differential Evolution—A Simple and Efficient Heuristic for Global Optimization over Continuous Spaces. J. Glob. Optim. 1997, 11, 341–359. [Google Scholar] [CrossRef]
- Geem, Z.W.; Kim, J.H.; Loganathan, G.V. A New Heuristic Optimization Algorithm: Harmony Search. Simulation 2001, 76, 60–68. [Google Scholar] [CrossRef]
- Rao, R.V.; Savsani, V.J.; Vakharia, D.P. Teaching-Learning-Based Optimization: A Novel Method for Constrained Design Optimization Problems. Comput. Des. 2011, 43, 303–315. [Google Scholar] [CrossRef]
- Mirjalili, S.; Mirjalili, S.M.; Lewis, A. Grey Wolf Optimizer. Adv. Eng. Softw. 2014, 69, 46–61. [Google Scholar] [CrossRef]
- Mirjalili, S. The Ant Lion Optimizer. Adv. Eng. Softw. 2015, 83, 80–98. [Google Scholar] [CrossRef]
- Askarzadeh, A. A Novel Metaheuristic Method for Solving Constrained Engineering Optimization Problems: Crow Search Algorithm. Comput. Struct. 2016, 169, 1–12. [Google Scholar] [CrossRef]
- Li, S.; Chen, H.; Wang, M.; Heidari, A.A.; Mirjalili, S. Slime Mould Algorithm: A New Method for Stochastic Optimization. Future Gener. Comput. Syst. 2020, 111, 300–323. [Google Scholar] [CrossRef]
- Zhao, S.; Zhang, T.; Ma, S.; Chen, M. Dandelion Optimizer: A Nature-Inspired Metaheuristic Algorithm for Engineering Applications. Eng. Appl. Artif. Intell. 2022, 114, 105075. [Google Scholar] [CrossRef]
- Gheyratmand, C.; Khanmohammady, F. Optimization of Steel Frames Considering Soil-Structure Interaction. Iran. J. Struct. Eng. 2015, 2, 1–12. [Google Scholar]
- Daloglu, A.T.; Artar, M.; Özgan, K.; Karakas, A. Optimum Design of Steel Space Frames Including Soil-Structure Interaction. Struct. Multidiscip. Optim. 2016, 54, 117–131. [Google Scholar] [CrossRef]
- Artar, M. Optimum Design of Steel Space Frames under Earthquake Effect Using Harmony Search. Struct. Eng. Mech. 2016, 58, 597–612. [Google Scholar] [CrossRef]
- Ministry of Public Works and Settlement. Turkish Earthquake Code, Specifications for Buildings to Be Built in Seismic Areas; Ministry of Public Works and Settlement: Ankara, Turkey, 2007. [Google Scholar]
- AISC-LRFD. Manual of Steel Construction-Load and Resistance Factor Design; American Institute of Steel Construction: Chicago, IL, USA, 2001. [Google Scholar]
- Baradaran, M.R.; Madhkhan, M. Application of an Improved Genetic Algorithm for Optimal Design of Planar Steel Frames. Period. Polytech. Civ. Eng. 2019, 63, 141–151. [Google Scholar] [CrossRef]
- Hasançebi, O.; Azad, S.K. Discrete Sizing of Steel Frames Using Adaptive Dimensional Search Algorithm. Period. Polytech. Civ. Eng. 2019, 63, 1062–1079. [Google Scholar] [CrossRef]
- van Woudenberg, T.R.; van der Meer, F.P. A Grouping Method for Optimization of Steel Skeletal Structures by Applying a Combinatorial Search Algorithm Based on a Fully Stressed Design. Eng. Struct. 2021, 249, 113299. [Google Scholar] [CrossRef]
- Degertekin, S.O.; Tutar, H. Optimized Seismic Design of Planar and Spatial Steel Frames Using the Hybrid Learning Based Jaya Algorithm. Adv. Eng. Softw. 2022, 171, 103172. [Google Scholar] [CrossRef]
- Liu, D.; Wang, Z.; Pan, J.; Zheng, Y.; Hu, Z. Optimum Design of Nonlinear Semi-Rigid Steel Frame Based on Performance-Price Ratio via Genetic Algorithm. J. Build. Eng. 2022, 61, 105287. [Google Scholar] [CrossRef]
- Azizi, M.; Talatahari, S. Improved Arithmetic Optimization Algorithm for Design Optimization of Fuzzy Controllers in Steel Building Structures with Nonlinear Behavior Considering near Fault Ground Motion Effects. Artif. Intell. Rev. 2022, 55, 4041–4075. [Google Scholar] [CrossRef]
- Eser, H.; Hasançebi, O. Capacity Controlled Search: A New and Efficient Design-Driven Method for Discrete Size Optimization of Steel Framesle. Comput. Struct. 2023, 275, 106937. [Google Scholar] [CrossRef]
- Saka, M.P.; Hasançebi, O.; Eser, H.; Geem, Z.W. Historical Evolution of Structural Optimization Techniques for Steel Skeletal Structures Including Industrial Design Applications. Eng. Optim. 2025, 57, 69–129. [Google Scholar] [CrossRef]
- Üstüner, B.; Doğan, E. Weight Optimization of Outrigger-Braced High-Rise Steel Frames Considering Soil-Structure Interaction via Metaheuristic Algorithms. Structures 2025, 79, 109567. [Google Scholar] [CrossRef]
- Soori, M. Artificial Intelligent in Optimization of Steel Moment Frame Structures A Review. Int. J. Struct. Constr. Eng. 2024, 18, 3. [Google Scholar]
- Shan, W.; Liu, J.; Zhou, J. Integrated Method for Intelligent Structural Design of Steel Frames Based on Optimization and Machine Learning Algorithm. Eng. Struct. 2023, 284, 115980. [Google Scholar] [CrossRef]
- Aksöz, Z.; Preisinger, C. An Interactive Structural Optimization of Space Frame Structures Using Machine Learning. In Impact: Design with All Senses; Springer: Cham, Switzerland, 2020. [Google Scholar]
- Wang, Y.; Du, W.; Wang, H.; Zhao, Y. Intelligent Generation Method of Innovative Structures Based on Topology Optimization and Deep Learning. Materials 2021, 14, 7680. [Google Scholar] [CrossRef] [PubMed]
- Ranalli, F. An Artificial Intelligence Framework for Multi-Disciplinary Design Optimization of Steel Buildings. Ph.D. Thesis, Stanford University, Stanford, CA, USA, 2021. [Google Scholar]
- Bergies, S.; Su, S.F.; Elsisi, M. Model Predictive Paradigm with Low Computational Burden Based on Dandelion Optimizer for Autonomous Vehicle Considering Vision System Uncertainty. Mathematics 2022, 10, 4539. [Google Scholar] [CrossRef]
- Ali, T.; Malik, S.A.; Daraz, A.; Aslam, S.; Alkhalifah, T. Dandelion Optimizer-Based Combined Automatic Voltage Regulation and Load Frequency Control in a Multi-Area, Multi-Source Interconnected Power System with Nonlinearities. Energies 2022, 15, 8499. [Google Scholar] [CrossRef]
- Abbassi, R.; Saidi, S.; Abbassi, A.; Jerbi, H.; Kchaou, M.; Alhasnawi, B.N. Accurate Key Parameters Estimation of PEMFCs’ Models Based on Dandelion Optimization Algorithm. Mathematics 2023, 11, 1298. [Google Scholar] [CrossRef]
- Kaveh, A.; Zaerreza, A.; Zaerreza, J. Enhanced Dandelion Optimizer for Optimum Design of Steel Frames. Iran. J. Sci. Technol. Trans. Civ. Eng. 2023, 47, 2591–2604. [Google Scholar] [CrossRef]
- Computers & Structures Inc. Sap 2000 V19; Computers & Structures Inc.: Walnut Creek, CA, USA, 2019. [Google Scholar]
- MATLAB, R2017b; MathWorks Inc.: Natick, MA, USA, 2017.
- Einstein, A. Investigations on the Theory of the Brownian Movement; Courier Corporation: Chelmsford, MA, USA, 1956; ISBN 0486603040. [Google Scholar]
- Mantegna, R.N.; Stanley, H.E. Stochastic Process with Ultraslow Convergence to a Gaussian: The Truncated Lévy Flight. Phys. Rev. Lett. 1994, 73, 2946. [Google Scholar] [CrossRef]
- Monroe, J.S.; Wicander, R.; Hazlett, R. Physical Geology: Exploring the Earth; Thomson Brooks/Cole: Pacific Grove, CA, USA, 2007. [Google Scholar]
- AFAD Turkiye Seismic Hazard Map. Available online: https://tdth.afad.gov.tr/ (accessed on 11 April 2025).
- Ǒguzhan, H.; Çarbąs, S.; Saka, M.P. Improving the Performance of Simulated Annealing in Structural Optimization. Struct. Multidiscip. Optim. 2010, 41, 189–203. [Google Scholar] [CrossRef]
- Aydoğdu, İ. Optimum Design of 3-D Irregular Steel Frames Using Ant Colony Optimization and Harmony Search Algorithms. Ph.D. Thesis, Middle East Technical University, Ankara, Turkey, 2010. [Google Scholar]
Disclaimer/Publisher’s Note: The statements, opinions and data contained in all publications are solely those of the individual author(s) and contributor(s) and not of MDPI and/or the editor(s). MDPI and/or the editor(s) disclaim responsibility for any injury to people or property resulting from any ideas, methods, instructions or products referred to in the content. |
© 2025 by the authors. Licensee MDPI, Basel, Switzerland. This article is an open access article distributed under the terms and conditions of the Creative Commons Attribution (CC BY) license (https://creativecommons.org/licenses/by/4.0/).