Abstract
This study investigates occupant–seat interaction dynamics in high-speed train frontal collisions. A finite element model of a second-class double seat was developed and simulated using LS-DYNA R12.1 software with a Hybrid III dummy, applying trapezoidal and triangular acceleration pulses per European and American standards. The research analyzes the impact of front-row seatback recline angles (0°, 10°, 20°) and seatback-to-base connection stiffness (1000 N/mm to 0 N/mm) on head, neck, chest, and leg injury severity. Results show that a 10° recline provides optimal protection under fixed stiffness. When optimizing both parameters, a 0° recline with approximately 300 N/mm stiffness minimizes composite injury metrics (HIC15, Nij, CTI). However, reducing stiffness at non-zero recline angles increases neck injury risk due to tray table displacement toward the cervical region. These findings emphasize the critical importance of integrated seat design optimization for rail passenger passive safety and highlight the need to mitigate tray table hazards.
1. Introduction
Train collision accidents exhibit high destructive power, significant casualties, and profound social consequences. Ensuring occupant safety thus remains a critical challenge for researchers. Currently, high-speed trains are designed for crashworthiness based primarily on primary impact scenarios. However, primary impact injuries are relatively uncommon; secondary impact injuries constitute the predominant form of occupant trauma. Consequently, occupant injury analysis under secondary impact scenarios stands as a vital research topic in modern rail transportation studies [1,2,3,4,5]. Physical train collision testing faces challenges including high risk, poor repeatability, and extended testing cycles [6,7,8]. In contrast, numerical simulation significantly reduces both time and economic costs [9,10,11]. Consequently, finite element (FE) dummy models have been widely adopted to study occupant impact injury mechanisms and develop protective measures in train collisions. This approach has emerged as a primary methodology for investigating passive safety in rail crash scenarios [12,13,14].
Wang et al. [15,16,17,18] investigated injuries to passengers caused by seats and tray tables during secondary impacts in high-speed train collisions. They analyzed the influence of factors such as seat distance, arrangement, and stiffness on occupant secondary impact injuries. Focusing on the train cab, their research examined the secondary impact between the driver and the control console. Furthermore, two measures were proposed to reduce driver injury severity: the multi-objective optimization of the driver seat position and the installation of three-point seat belts on the train. Additionally, Hou et al. [19] investigated the factors influencing driver neck injuries during secondary impacts between the driver and the cab control console in train collisions, demonstrating that the distance between the console edge and the knee bolster has the most significant influence on neck injury severity, followed by the distance between the console and the driver’s seat, and the pedal height. Xie et al. [20,21,22] utilized MADYMO to establish a coupled model of the train occupant compartment and a Hybrid III 50th percentile dummy, investigating the influence of impact acceleration, table height, seat distance, and contact stiffness on occupant impact injury severity during secondary collisions in rail vehicles. Subsequently, they established a multi-vehicle coupled collision model, finding that the dummy experienced the highest velocity in Car 3 (moving) and Car 7 (stationary before impact) when occupants faced the table. Concurrently, to predict occupant injury parameters under different experimental conditions, they developed a model for forecasting occupant collision injuries, thereby enhancing the design efficiency of occupant compartment structural parameters. Based on a multi-rigid-body and finite element coupled simulation model, Carvalho et al. [23,24] optimized the structural parameters of railway vehicle seats to reduce the secondary impact injury values for occupants’ heads and necks during train collisions. By introducing head protective padding on the seat backs and implementing multi-objective optimization, the study achieved a 41% reduction in the dummy’s HIC value, although the neck bending moment increased by 49%. Deng et al. [25] developed a validated occupant collision scenario model for high-speed trains by integrating experimental, computational, and inverse approaches. They established finite element and multi-body models of train occupants and seats during frontal collisions in LS-DYNA and MADYMO software respectively, based on experimentally obtained material properties. Dummy sled tests were conducted for three different configurations of folded tables and backrests. The study demonstrated that the experimentally calibrated numerical passenger model could effectively reproduce passenger kinematics in high-speed train collisions. Yao et al. [26,27] analyzed the kinematic changes of passenger postures during frontal collisions in commuter trains, revealing that injury metrics for passengers behind front-row and side-row seats exceeded the requirements of GM/RT2100. Additionally, they investigated occupant kinematics and injury metrics in high-speed trains during frontal collisions with obstacles, examining the influence of collision speed and impact angle on occupant injuries; the results demonstrated that occupant injuries increased with increasing collision speed, while with increasing collision angle, occupant injuries exhibited a trend of decreasing initially and then increasing. Lu et al. [28] designed an energy-absorbing workstation and established a localized collision model simulating dummy–vehicle interactions; through optimization of the wall thickness in the energy-absorbing sandwich layer, they identified optimal gradient parameters, achieving effective reduction in impact injury severity to occupants’ heads, necks, and chests. Yu et al. [29,30] developed an integrated train-dummy finite element model for passive safety simulation analysis, examining occupant kinematics during train rear-end collisions; the results revealed that contact between occupants’ faces and front-row seats in the striking train can induce brainstem injuries, while neck flexion generated significant stresses in the cervical spine. Pratomo et al. [31] optimized the impact resistance of train seats by modifying seat frame thickness and headrest shape; their results demonstrated that thinner frames increase femur injury risk, while thicker frames elevate injury risks to the head, neck, and chest. Implementing a 6 mm frame thickness in critical zones combined with an optimized headrest design effectively reduced injury metrics. Furthermore, certain researchers have conducted safety risk assessments for seated and standing occupants in metro trains [32,33,34,35].
In summary, while the existing literature has significantly advanced our understanding of train crashworthiness and occupant protection, a critical research gap persists regarding the impact of tray tables on secondary collision dynamics in high-speed train compartments. Current studies predominantly address general crash scenarios and occupant kinematics but provide insufficient focus on the unique challenges posed by adjustable tray tables, which are common in modern high-speed trains, compared to traditional fixed tables. This study addresses this deficiency by investigating the influence of front-row seatback recline angles and seatback-to-base connection stiffness on occupant injury severity through finite element simulations using a validated Hybrid III dummy model. By offering insights into optimal seat configurations for injury minimization, especially with tray tables present, this research aims to enhance passive safety in rail transportation.
2. Methods
2.1. Research Method
Research on train occupant safety primarily employs two methodologies. The integrated approach [36,37] conducts simultaneous primary and secondary impact tests and simulations with dummy models, which offers intuitive crash interaction insights but proves structurally destructive for physical testing, prohibitively costly, and computationally inefficient for repetitive simulations. Alternatively, the decoupled approach [38,39] leverages validated primary collision data to focus exclusively on secondary occupant-vehicle interior impacts, enabling cost-effective and time-efficient analyses. This study therefore employs the decoupled method to investigate secondary impact injuries in high-speed train compartments.
2.2. The Finite Element Model
This study utilizes a standard second-class double seat from a Chinese high-speed train. The base frame employs aluminum alloys, while the backrest and armrests use magnesium alloy. The tray table is made of plastic. The material parameters are shown in Table 1. Identical polyurethane foam is used for both seat and back cushions, with its test performance curve shown in Figure 1. The seat’s finite element model (Figure 2a) omits non-structural components, comprising 147,753 shell elements, 89,220 solid elements, and 69 beam elements. As illustrated in Figure 2b, the backrest pivots on two rotating shafts via support arms, connected to the central bracket by a gas spring. This spring fully extends when upright and fully compresses at maximum recline. It automatically returns to full extension via the armrest control button unless manually locked, maintaining backrest angle stability.

Table 1.
Material parameters of seats.
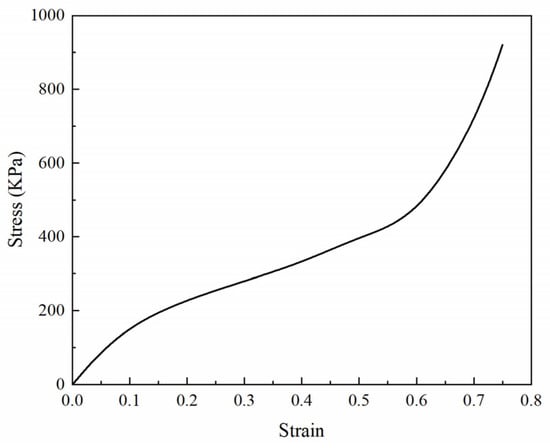
Figure 1.
Mechanical performance curve of the seat foam material.
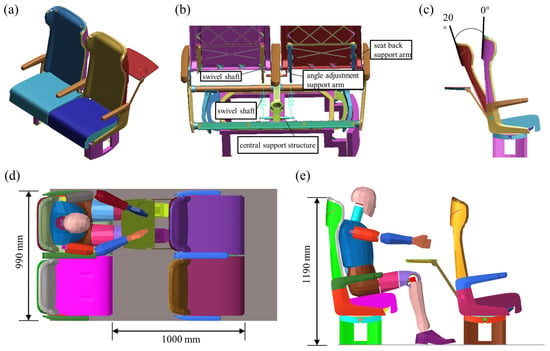
Figure 2.
Finite element model illustration. (a) Finite element model of the seat; (b) Schematic diagram of the seat back structure; (c) Schematic diagram of the seat angle; (d) Top view of the dummy-seat system; (e) Side view of the dummy-seat system.
The seat model was installed in a simplified car floor, as shown in Figure 2d,e, with a Hybrid III dummy positioned according to standard posture. To simulate a common and hazardous scenario, the dummy’s hands were initially placed on the deployed tray table of the front-row seat, reflecting typical passenger activities such as working or dining. For impact analysis, a front seat was added with longitudinal spacing of 1000 mm, vertical height of 1190 mm, and width of 990 mm, featuring a deployed tray table to reflect typical passenger usage. Since occupant injuries primarily result from interaction with their own seat and the front seat during secondary collisions, other seats were omitted without affecting injury assessment validity. This simplified dummy-seat system model retained only the floor structure to reduce computational complexity while maintaining simulation accuracy.
2.3. Validation of Seated Dummy Model Experiments
The Hybrid III 50th percentile dummy model was utilized in this study. Validation of the seated configuration was performed through comparative analysis of posture responses and head acceleration curves against established experimental data [40]. The simulation model replicated documented test conditions, including contact parameters and acceleration loads. Results demonstrated strong agreement with physical test kinematics as shown in Figure 3 and Figure 4. Although the simulated head acceleration profile closely matched experimental trends, peak magnitudes exceeded physical test measurements due to unmodeled seat energy-absorption characteristics. This conservative overestimation of head acceleration, attributed to higher energy transfer during impact, provides methodologically acceptable injury assessment by preventing potential risk underestimation.
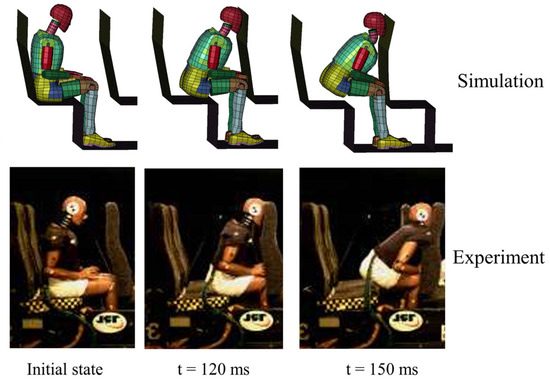
Figure 3.
Comparison of dummy collision test and simulation model in seated position.
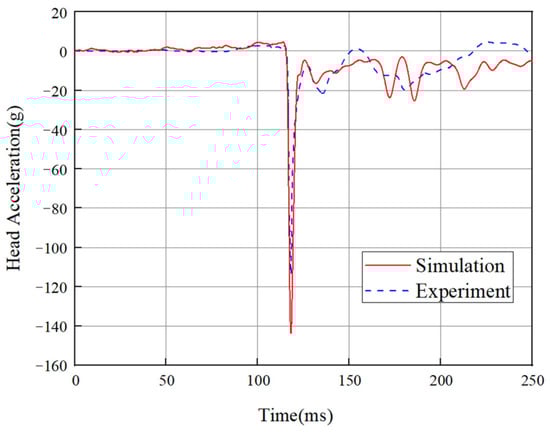
Figure 4.
Comparison of experimental and simulated head acceleration curves in dummy tests.
2.4. Injury Assessment of the Dummy
This paper adopts Appendix H of GM/RT2100 [41] as the injury standard for dummies, focusing on head, neck, chest, and leg injuries.
2.4.1. Head Injury
Head injury indicators include HIC and 3 ms resultant acceleration, among which HIC is a more commonly used standard indicator of head injury. The expression is calculated as in Equation (1):
where is the beginning time of the HIC value; is the end time of the HIC value; Usually 36 ms or 15 ms is selected as the time interval, referred to as HIC36 or HIC15. This paper mainly examined the HIC15 value of the dummy, ensuring compliance with the safety threshold requirement of HIC < 500.
is the 3 ms resultant acceleration of the head measuring point, and the expression is calculated as in Equation (2):
It is required that is not greater than 80 g during any time interval of 3 ms during the collision process.
2.4.2. Neck Injury
Neck injury primarily results from head tension and torque. Recommended allowable values are 310 N·m for buckling torque, 135 N·m for extension torque, 4170 N for tensile force, and 4000 N for compression force. Additionally, the evaluation index Nij is calculated as in Equation (3):
The value of must not be greater than 1.0; if is tensile force, ; if is compressive force ; if is buckling torque ; if is extension torque .
2.4.3. Chest Injury
The chest, crucial due to vital organs, is second in importance after the head. Standards require chest acceleration < 60 g, compression < 63 mm, and viscosity index < 1.0 m/s in any 3 ms collision interval, calculated as in Equation (4):
where is the compression velocity; , where is the instantaneous chest compression, is the chest thickness;
The calculation method for the Combined Thoracic Injury (CTI) index is shown in the following Equation (5):
where g, mm, is the maximum acceleration of the chest, is the maximum chest compression. The value of CTI must not exceed 1.0.
2.4.4. Leg Injury
This paper mainly considers the maximum compression force of the left and right legs, and requires that the maximum cannot exceed 8 kN.
2.5. Working Condition
The trapezoidal acceleration pulse specified in the UK GM/RT2100 standard (Figure 5) was employed, with its upper boundary initially peaking at 8 g and maintaining this level until 0.15 s before linearly decreasing to 0 g at 0.21 s; simultaneously, the lower boundary linearly increased from 0 g at 0 s to 5.67 g at 0.01 s, maintained this value until 0.10 s, then linearly decreased to 0 g at 0.11 s. In accordance with EN15227 [42], the initial velocity of the dummy-seat system was set at 36 km/h (10 m/s).
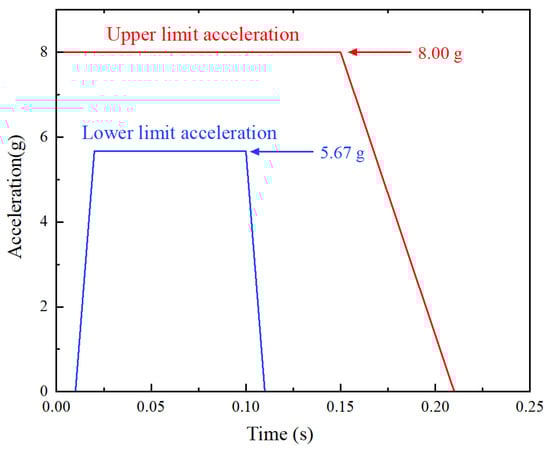
Figure 5.
Collision acceleration curve as defined in AV/ST 9001 [43] vehicle interior crashworthiness.
3. Results and Discussion
3.1. Effect of Front-Row Seatback Recline Angle on Occupant Injury Severity
Modern high-speed train seatbacks are typically continuously adjustable within a defined range. For analytical simplicity, the fully upright position is designated as the 0° baseline. When unlocked via the control button, the backrest rotates counterclockwise around its pivot shaft to a maximum angle of approximately 20°, with positive rotation defined per Figure 2c. Though passengers randomly select recline angles between 0° and 20° during normal operation, this study focuses exclusively on frontal collisions where occupants impact front-row seats, which renders their own backrest angle irrelevant. Three discrete recline angles of 0°, 10°, and 20° were thus analyzed for their effect on rear-seated dummy injuries, with the gas spring travel range held constant throughout simulations under rigid connection stiffness.
As shown in Figure 6, across all tested recline angles, the Hybrid III dummy exhibited consistent kinematic progression during the 300ms frontal collision simulation: initial forward momentum from 0 to 0.05 s, tray table detachment and knee/hand contact with front seatback at 0.10 s, loss of seat contact with chest impacting tray table at 0.15 s, maximal seatback deformation with supine positioning at 0.20 s, center-of-gravity elevation at 0.25 s, and final disengagement at 0.30 s. Crucially, the 20° scenario demonstrated earlier upper torso engagement, with tray table contact occurring nearer the neck at 0.15 s, and reduced seatback deformation. Kinematic divergence between configurations was pronounced during the first 0.15 s due to initial recline differences but converged thereafter as structural deformation dominated the response, indicating that seatback pre-adjustment primarily affects early-phase occupant kinematics rather than final injury outcomes.
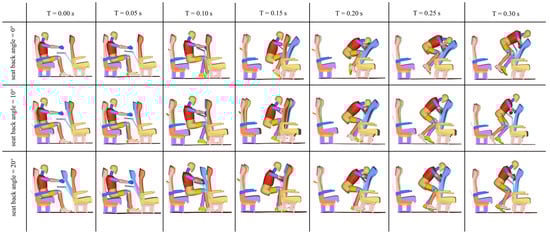
Figure 6.
Simulation process of the dummy-seat system under different seat back angles during collision.
Dummy injury metrics across the three test scenarios are summarized in Table 2. In terms of head injuries, HIC15 values increased progressively with increasing recline angle. The 3 ms resultant acceleration showed minimal variation across the angles, with its peak value occurring at 0° recline. All head injury metrics remained below regulatory thresholds, indicating statistically insignificant differences between scenarios. Regarding neck injuries, both the tension force FZ and the bending moment MY reached their minima at 10° recline and their maxima at 20°. Additionally, the bending moment MY exceeded safety standards at both 0° and 20° recline angles. The Nij values peaked at 20° recline. The 10° configuration demonstrated optimal neck protection, while 20° posed the highest neck injury risk. For chest injuries, chest compression increased incrementally with each increase in recline angle. The 3 ms acceleration reached its maximum at 20° and its minimum at 10° recline. The VC showed a marginal decrease as the recline angle increased, and the CTI exhibited a progressive increase. Comprehensive assessment revealed minimal chest injury risk at 0° recline. Leg injury metrics remained within safe limits across all scenarios, with the 10° recline showing the lowest compression force. Comparative analysis indicates the 10° recline angle provides superior occupant protection, particularly in mitigating life-threatening neck injuries that demonstrate a higher probability of severity at 0° and 20° recline angles.
Table 2.
Dummy injury metrics under varying initial front-row seatback recline angles.
3.2. Influence of Seatback-to-Base Connection Stiffness on Occupant Injuries
Building upon Section 3.1 which examined dummy injury outcomes under varying front-row seatback recline angles with rigid gas spring connections, this section specifically investigates the impact of gas spring connection stiffness on occupant injuries. All simulations maintain a 0° seatback recline. The stiffness was progressively reduced across seven configurations, specifically 1000 N/mm, 500 N/mm, 400 N/mm, 300 N/mm, 200 N/mm, 100 N/mm, and finally 0 N/mm.
The dynamic response of the dummy is illustrated in Figure 7, demonstrating consistent initial collision states across all seven models at four distinct timestamps. At 0.12 s post-impact, the dummy’s hands and knees contacted the front-row seatback while simultaneously losing contact with the seat cushion. By 0.23 s, the dummy assumed a prone position with head contacting the seatback and the tray table displaced to the upper thoracic region. The simulation concluded at 0.30 s with the dummy basically disengaged from the front-row seatback.
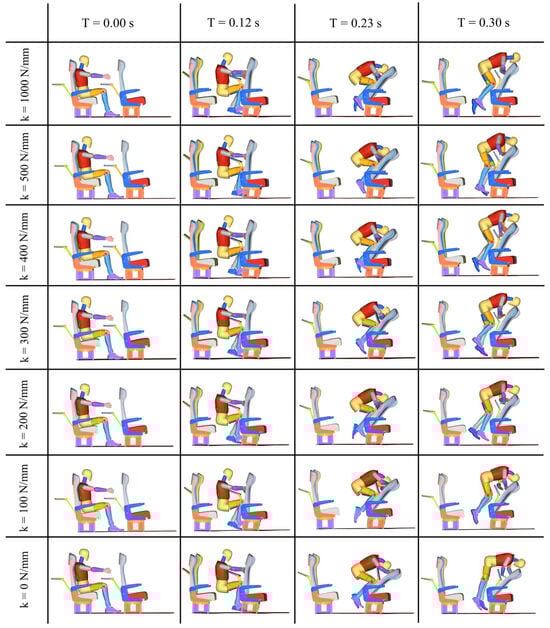
Figure 7.
Simulation process of the dummy-seat system under different connection stiffnesses during collision.
Dummy injury metrics across the seven connection stiffness configurations as shown in Table 3 revealed negligible deviation between the 1000 N/mm and rigid connection cases from Section 3.1 at 0° recline. This is attributable to the magnesium alloy seatback’s inherent energy absorption. When connection stiffness exceeds critical thresholds, its influence becomes marginal compared to material deformation as corroborated by nearly identical force–time progression patterns for both configurations in Figure 8. Subsequent analysis of lower stiffness cases demonstrated minimal head injuries at 0 N/mm with 300 N/mm ranking second. All six configurations yielded superior head protection versus 1000 N/mm. Neck injuries were minimized at 300 N/mm whereas the 1000 N/mm configuration exceeded regulatory limits of bending moment My. For chest injuries, the injury of the dummy’s chest is the least when the connection stiffness is 0 N/mm, followed by 400 N/mm. However, both of these are still slightly greater than the injury of the dummy’s chest under the condition of 1000 N/mm connection stiffness. Collectively, injury mitigation across all three body regions within lower stiffness ranges substantiates the implementation of reduced seatback-to-base connection stiffness for enhanced occupant protection.
Table 3.
Dummy injury metrics under varied connection stiffness.
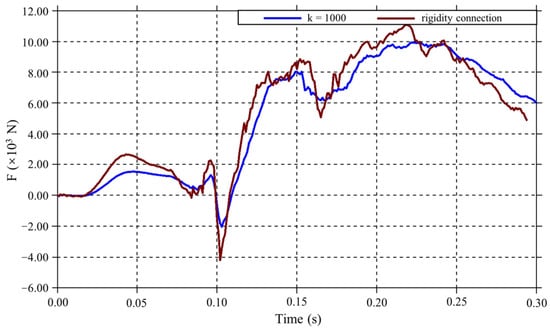
Figure 8.
Force–time curves for seatback connectors.
3.3. Optimization Analysis of Connection Stiffness
Based on dummy injury assessments across configurations in Section 3.2, an optimal connection stiffness value minimizing occupant injury exists within the 0–500 N/mm range for gas spring connections. Practically, zero stiffness would cause seatbacks to collapse forward during normal use, compromising passenger comfort and safety. Thus, stiffness values between 100 and 500 N/mm were selected as optimization boundaries. In this section, 4th-order polynomial response curves are fitted to model the relationships between the three individual injury indicators (HIC15, Nij, CTI) as well as the composite injury metric F and the seatback-to-base connection stiffness within the 100–500 N/mm range using MATLAB R2024a’s polyfit function. This approach yields a high goodness of fit, with the curve accurately passing through all data points and an R-squared value of approximately 1.0, resulting in near-zero residual errors.
Head injury criterion HIC15, neck injury criterion Nij, and chest injury criterion CTI served as optimization targets. As shown in Figure 9a, HIC15 exhibits a multi-modal relationship with stiffness characterized by an initial increase, subsequent decrease, re-increase, and final reduction. Neck injury Nij in Figure 9b demonstrates a biphasic peak-trough progression with similar non-monotonic behavior. Chest injury CTI in Figure 9c, which synthesizes chest compression and 3 ms acceleration, initially increases, decreases, then re-increases with rising stiffness. Comparative analysis reveals congruent trends between head and neck injuries, while chest response diverges. Crucially, stiffness values minimizing head and neck injuries fail to concurrently minimize chest injury, precluding identification of a universal optimum. To holistically evaluate the stiffness-injury relationship, a composite injury metric F integrating weighted head, neck, and chest injury values was developed using Equation (6):
F = (f1A1+ f2A2+ f3A3)
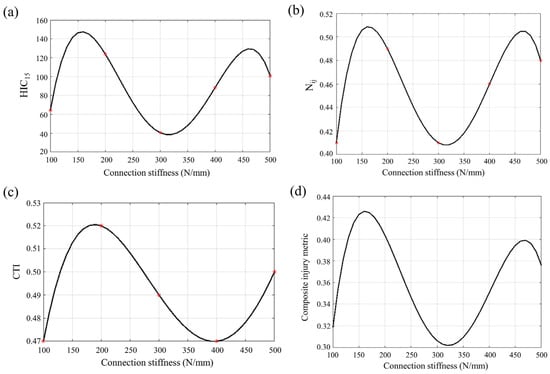
Figure 9.
Curve of injury indicators of the dummy with changes in connection stiffness. (a) Head: HIC15; (b) Neck: Nij; (c) Chest: CTI; (d) Composite injury indicator.
The head, being the most critical human body region, is assigned a preliminary weighting factor . The chest, slightly less critical than the head, receives . Given the lower clinical priority of the neck among these three regions, is provisionally adopted. Due to significant numerical disparities between HIC15, CTI, and Nij values, normalization is required prior to metric combination. Definitions for A1, A2, A3 are provided in Equation (7):
A1 = HIC15/500; A2 = CTI/1; A3 = Nij/1
The composite injury metric reaches its minimum value at a seatback-to-base connection stiffness of 322 N/mm, as demonstrated by the response curve developed using MATLAB R2024a software and presented in Figure 9d.
The weighting factors f1, f2 and f3 were formulated based on the relative criticality of the head, chest, and neck regions. As demonstrated in Table 4, alternative weighting combinations derived through identical methodology consistently yield optimal solutions near 322 N/mm. This indicates negligible impact of weighting factor variations on the identified optimum within a defined parameter range.
Table 4.
Optimal solutions under varying weighting factor combinations.
3.4. Combined Effects of Seatback Recline Angle and Connection Stiffness on Dummy Injuries
Building upon Section 3.3 which established correlations between seatback-to-base connection stiffness and dummy injury metrics in the fixed 0° vertical configuration, this section examines whether stiffness reduction maintains equivalent protective efficacy across initial recline configurations, with particular focus on injury mitigation mechanisms under combined parametric variations.
3.4.1. Influence of Connection Stiffness on Dummy Injuries at 10° Seatback Recline
As shown in Figure 10, the four models arranged top-to-bottom represent connection stiffness values of 100 N/mm, 200 N/mm, 300 N/mm, and 400 N/mm between the seatback and base. During collision simulation, all four configurations exhibited nearly identical kinematic states at four critical timestamps. At 0.12 s post-impact, dummies uniformly lost seat cushion contact while making simultaneous hand and knee contact with the front-row seatback. By 0.18 s, the tray table displaced toward the vulnerable cervical region, posing critical safety concerns. At 0.30 s, occupant–seat separation was substantially achieved, concluding the simulation.
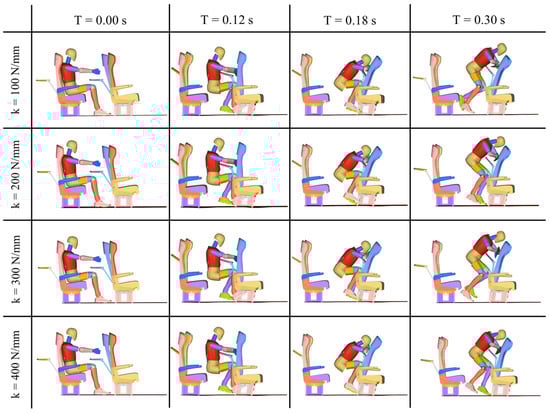
Figure 10.
Collision simulation sequence under varied connection stiffness at 10° seatback recline.
As summarized in Table 5, dummy injury severity across four seatback-to-base connection stiffness configurations at 10° recline demonstrates significant elevation relative to the rigid connection stiffness from Section 3.1 at 10° recline angle. Head and chest injuries increased moderately, while neck injury Nij surged substantially. Configurations at 100, 300 and 400 N/mm exceeded regulatory thresholds, with the 200 N/mm configuration approaching critical limits. This degradation stems from a critical transition in collision dynamics induced by reduced connection stiffness where tray table displacement toward the cervical region fundamentally altered subsequent impact sequences, amplifying injury mechanisms.
Table 5.
Dummy injury metrics under varied connection stiffness at 10° seatback recline.
3.4.2. Influence of Connection Stiffness on Occupant Injuries at 20° Seatback Recline
As illustrated in Figure 11, the four models with different connection stiffnesses exhibited nearly identical kinematic states at four critical timestamps. At 0.12 s post-impact, all dummies were approaching separation from the seat cushion while simultaneously making hand and knee contact with the front-row seatback, exhibiting smaller forward displacement compared to the 10° recline scenario. By 0.18 s, the tray table had slid to the dummy’s cervical region, essentially replicating the conditions observed in the 10° recline configuration and posing equally critical risks to occupants. At 0.30 s, substantial separation between dummies and seats was achieved, concluding the simulation process.
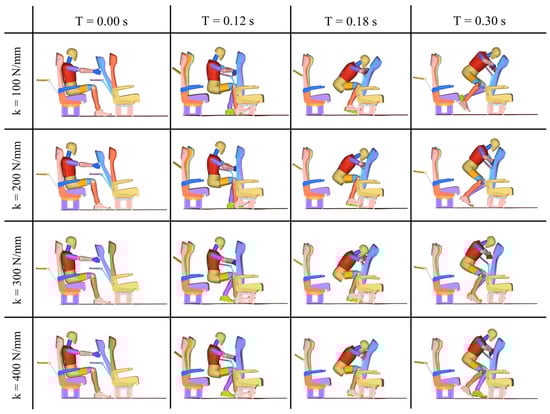
Figure 11.
Collision simulation sequence under varied connection stiffness at 20° seatback recline.
Table 6 presents dummy injury severity under four seatback-to-base connection stiffness configurations at 20° recline. Compared to the rigid connection in Section 3.1, head injuries increased across all four configurations. Chest injuries showed inconsistent changes with either increases or decreases of marginal significance. Regarding neck injuries, tension force FZ substantially increased in all cases while bending moment MY decreased in three configurations at 200, 300, and 400 N/mm stiffness. Nij values decreased only at 200 N/mm stiffness but increased in the other three configurations. Among these, two configurations at 100 and 400 N/mm exceeded regulatory thresholds, while the 300 N/mm configuration approached critical allowable limits. This phenomenon occurs because reduced connection stiffness induces tray table contact with the cervical region, replicating the hazard observed at 10° recline and consequently altering subsequent collision dynamics.
Table 6.
Dummy injury metrics under varied connection stiffness at 20° seatback recline.
Consequently, the implementation of reduced connection stiffness at recline angles of 10° or 20° fails to comprehensively alleviate occupant injuries. In fact, most metrics actually deteriorate, thereby necessitating a cautious application of low-stiffness connections in these configurations. Critically, preventing the displacement of the tray table towards the cervical zone remains of utmost importance, as such contact can precipitate potentially catastrophic injury consequences.
3.5. Response Surface Optimization Analysis
3.5.1. Response Surface Modeling
A third-order response surface model is employed to fit the relationships between the three individual injury indicators (HIC15, Nij, CTI) as well as the composite injury metric F, the seatback-to-base connection stiffness, and the recline angle. The third-order response surface model was constructed using MATLAB’s griddata function with cubic interpolation, which ensures exact passage through all sampled data points, theoretically achieving zero error at those locations. The weighting factors f1, f2 and f3 is assigned as a set of 0.4, 0.35, and 0.25, respectively.
As shown in Figure 12a, head injury values exhibit an oscillatory relationship with connection stiffness within the illustrated range, characterized by an initial increase followed by decrease and subsequent re-increase with rising stiffness. Concurrently, head injury demonstrates a monotonically increasing relationship with recline angle. Neck injury response surfaces in Figure 12b display trends similar to head injury, featuring initial increase, subsequent decrease, and eventual re-increase with rising stiffness while proportionally increasing with recline angle magnitude. Chest injury response surfaces in Figure 12c show significantly smoother profiles than head injury surfaces, with injury severity increasing substantially with greater recline angles but exhibiting minimal variation across stiffness values.
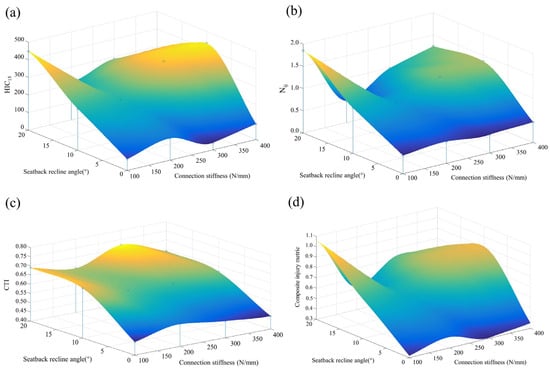
Figure 12.
Response surface of injury indicators of the dummy with changes in connection stiffness. (a) Head: HIC15; (b) Neck: Nij; (c) Chest: CTI; (d) Composite injury indicator.
Although shared trends exist across the three injury response surfaces, their local minima regions show spatial divergence. Consequently, a composite injury metric was generated according to Equation (6) to Equation (7). The resultant response surface in Figure 12d identifies minimized injury severity within stiffness ranges of 200 to 300 N/mm at 0° recline. MATLAB’s built-in optimization toolbox determined the global optimum as 0° seatback recline with 292 N/mm connection stiffness.
A sensitivity analysis of weighting factor allocations for f1, f2 and f3 employed five alternative combinations in Table 7. All configurations yielded optimal solutions at 0° seatback recline with connection stiffness values clustering near 292 N/mm as detailed in Table 7. The optimal solutions exhibit negligible morphological divergence across weighting schemes indicating robust insensitivity of the identified optimum to weighting factor selection within the implemented response surface methodology framework.
Table 7.
Optimal solutions under varying weighting factor combinations.
3.5.2. Verification Analysis of Optimization Results
Verification analysis was conducted on both response surface optimization outcomes from Section 3.5.1 and response curve optimization results from Section 3.3. Given the minimal influence of weighting factors, validation employed the initial allocation scheme with weighting factors f1 at 0.4, f2 at 0.35, and f3 at 0.25. Corresponding dummy injury metrics are detailed in Table 8.
Table 8.
Comparison of injury indicators for the optimized dummy.
For head and chest injuries, which involve seven metrics, all values at a stiffness of 292 N/mm consistently remain lower than those at 322 N/mm. Concerning neck injuries, the tension force, bending moment, and Nij values exhibit an increase at 322 N/mm. In the case of leg injuries, a higher severity level is demonstrated at 292 N/mm. Composite values of core optimization metrics HIC15, CTI, and Nij are compared in Table 8. Both optimized solutions at 292 N/mm and 322 N/mm along with the 300 N/mm reference exhibit comparable composite injury values. The response surface solution yields 0.310 versus 0.306 at 300 N/mm and 0.346 for the response curve. The marginal difference between 0.310 and 0.306 falls within acceptable error margins, whereas the response curve result at 0.346 shows greater deviation. Observed inconsistencies between optimization outcomes stem from operational tolerances in engineering implementation, limited initial sampling density insufficient for full trend resolution, and fundamental algorithmic differences between optimization methods. Disregarding uncontrollable factors, minimal occupant injury occurs at approximately 300 N/mm connection stiffness with 0° recline, with response surface methodology demonstrating superior reliability.
Considering both optimization outcomes and practical constraints, 300 N/mm is selected as the optimal stiffness. This value minimizes the three core injury metrics along with auxiliary injury parameters while maintaining practicality for engineering implementation.
4. Conclusions
This research elucidates the influence of seat design parameters on occupant safety during secondary collisions in high-speed train compartments.
Initial simulations revealed that a front-row seatback recline angle of 10° provides the safest configuration under fixed stiffness conditions, minimizing neck injury risks compared to 0° and 20° angles, where the bending moment exceeded safety thresholds. Further analysis demonstrated that reducing seatback-to-base connection stiffness at a 0° recline significantly mitigates injury severity, with an optimal stiffness of approximately 300 N/mm identified through response surface optimization, effectively reducing head, neck, and thoracic injury metrics. However, applying low stiffness at 10° or 20° recline angles worsened occupant injuries, particularly to the neck, due to tray table migration toward the cervical region, a critical safety concern. These results emphasize that an upright seatback, 0° recline, with tuned connection stiffness offers the most effective protection. The study advocates for careful consideration of tray table dynamics in crashworthiness design and recommends a configuration of 0° recline and 300 N/mm stiffness for practical implementation.
This study fills a gap in the existing literature, which overlooked the hazards of adjustable tray tables in high-speed train seats during frontal collisions. Our integration of recline angle and connection stiffness, optimized by response surface analysis, gives the first quantitative guidelines to reduce occupant injuries. These contributions improve rail transportation safety and offer practical ideas for engineers to reduce secondary impact risks better than traditional fixed-table setups. However, this study is limited to a single crash scenario using a specific acceleration pulse and a simplified finite element seat model, which may not fully represent diverse real-world crash conditions. Future work should validate these findings through physical testing and explore additional safety enhancements, such as energy-absorbing materials or advanced restraint systems, to further reduce occupant injury risks in rail transportation.
Author Contributions
Conceptualization, F.Y. and H.T.; methodology, F.Y.; software, X.S.; validation, F.Y., X.S. and H.T.; formal analysis, F.Y.; investigation, X.S.; resources, H.T.; data curation, L.L.; writing—original draft preparation, F.Y.; writing—review and editing, X.S.; visualization, W.W.; supervision, W.W.; project administration, L.L. and W.W. All authors have read and agreed to the published version of the manuscript.
Funding
This research received no external funding.
Institutional Review Board Statement
Not applicable.
Informed Consent Statement
Not applicable.
Data Availability Statement
Data are contained within the article.
Conflicts of Interest
Author Fei Yu, Honglei Tian and Longxi Liu were employed by the company “CRRC Qingdao Sifang Co. Ltd.”. The remaining authors declare that the research was conducted in the absence of any commercial or financial relationships that could be construed as a potential conflict of interest.
References
- Xue, X.; Robinson, M.; Schmid, F.; Smith, R. Development issues for impact safety of rail vehicles: Robustness of crashworthy designs, effect of structural crashworthiness on passenger safety and behaviour characterisation of vehicle materials. Proc. Inst. Mech. Eng. Part F J. Rail Rapid Transit 2018, 232, 461–470. [Google Scholar] [CrossRef]
- Gao, G.; Wang, S. Crashworthiness of passenger rail vehicles: A review. Int. J. Crashworthiness 2019, 24, 664–676. [Google Scholar] [CrossRef]
- Gao, G.; Zhuo, T.; Guan, W. Recent research development of energy-absorption structure and application for railway vehicles. J. Cent. South Univ. 2020, 27, 1012–1038. [Google Scholar] [CrossRef]
- Jing, L.; Liu, K.; Wang, C. Recent advances in the collision passive safety of trains and impact biological damage of drivers and passengers. Explos. Shock Wave. 2021, 41, 135–167. [Google Scholar] [CrossRef]
- Ding, S. Advances and prospect on passive safety technology for Chinese high-speed trains. J. Cent. South Univ. 2022, 53, 1547–1558. [Google Scholar] [CrossRef]
- Yao, S.; Yan, K.; Lu, S.; Xu, P. Equivalence study involving rail vehicle collision test conditions. Proc. Inst. Mech. Eng. Part F J. Rail Rapid Transit 2019, 233, 73–89. [Google Scholar] [CrossRef]
- Zhao, H.; Xu, P.; Li, B.; Yao, S.; Yang, C.; Guo, W.; Xiao, X. Full-scale train-to-train impact test and multi-body dynamic simulation analysis. Machines 2021, 9, 297. [Google Scholar] [CrossRef]
- Lu, S.; Wang, P.; Yan, K.; Ni, W.; Bao, H.; Zhu, W. Investigation on similitude method for dynamic response of high-speed train body considering thickness distortion. Int. J. Crashworthiness 2024, 29, 1085–1097. [Google Scholar] [CrossRef]
- Lu, S.; Wang, P.; Ni, W.; Yan, K.; Zhao, S.; Yang, C.; Xu, P. Energy absorption design for crash energy management passenger trains based on scaled model. Struct. Multidiscip. Optim 2022, 65, 2. [Google Scholar] [CrossRef]
- Yao, S.; Zhu, H.; Liu, M.; Li, Z.; Xu, P.; Che, Q. A study on the frontal oblique collision-induced derailment mechanism in subway vehicles. Proc. Inst. Mech. Eng. Part F J. Rail Rapid Transit 2020, 234, 584–595. [Google Scholar] [CrossRef]
- Liu, K.; Jing, L.; Wang, K.; Li, Q.M. Design optimization of the bamboo-inspired foam-filled tube for high-speed train collision energy absorption. Int. J. Mech. Sci. 2024, 271, 109128. [Google Scholar] [CrossRef]
- Carvalho, M.; Ambrosio, J.; Milho, J. Implications of the inline seating layout on the protection of occupants of railway coach interiors. Int. J. Crashworthiness 2011, 16, 557–568. [Google Scholar] [CrossRef]
- Xu, P.; Xiao, X.; Yao, S. A review of train passenger safety—Inspiration from passive safety passenger protection technology of automobile. Transp. Saf. Environ. 2021, 4, tdab032. [Google Scholar] [CrossRef]
- Ambrosio, J.; Carvalho, M.; Milho, J.; Escalante, S.; Martin, R. A validated railway vehicle interior layout with multibody dummies and finite element seats models for crash analysis. Multibody Syst. Dyn. 2022, 54, 179–212. [Google Scholar] [CrossRef]
- Wang, W.; Zhang, G.; Zhao, H.; Lu, Z. Second impact effect of chair distance of high-speed train on occupant injury. Comput. Aided Eng. 2008, 17, 1–3. [Google Scholar]
- Wang, W.; Zhao, H.; Liu, X. Railway Vehicle Occupant’s Injury Caused by the Impact Second. Urban Mass Transit. 2007, 10, 23–27. [Google Scholar] [CrossRef]
- Wang, W. Influence factors of railway vehicle interior impact injury. Appl. Mech. Mater. 2011, 79, 227–231. [Google Scholar] [CrossRef]
- Wang, W.; Zhou, H.; Zhan, J. Train driver protection under secondary impact. J. Cent. South. Univ. 2019, 26, 905–915. [Google Scholar] [CrossRef]
- Hou, L.; Peng, Y.; Sun, D. Neck injury mechanisms in train collisions: Dynamic analysis and data mining of the driver impact injury. Accid. Anal. Prev. 2020, 146, 105725. [Google Scholar] [CrossRef]
- Xie, S.; Tian, H. Influencing factors and sensitivity analysis of occupant impact injury in passenger compartment. Traffic Inj. Prev. 2013, 14, 816–822. [Google Scholar] [CrossRef]
- Xie, S.; Tian, H. Dynamic simulation of railway vehicle occupants under secondary impact. Veh. Syst. Dyn. 2013, 51, 1803–1817. [Google Scholar] [CrossRef]
- Xie, S.; Zhou, H. Forecasting impact injuries of unrestrained occupants in railway vehicle passenger compartments. Traffic Inj. Prev. 2014, 15, 740–747. [Google Scholar] [CrossRef] [PubMed]
- Carvalho, M.; Milho, J.; Ambrosio, J.; Ramos, N. Railway occupant passive safety improvement by optimal design. Int. J. Crashworthiness 2017, 22, 624–634. [Google Scholar] [CrossRef]
- Carvalho, M.; Martins, A.; Milho, J. Railway seat design for injury mitigation in crash scenario. Int. J. Rail Transp. 2020, 8, 215–233. [Google Scholar] [CrossRef]
- Deng, G.; Xu, T.; Peng, Y.; Sun, D.; Hu, Z.; Deng, M.; Wang, K.; Simms, C. Validated numerical unrestrained occupant-seat crash scenarios for high-speed trains integrating experimental, computational, and inverse methods. Traffic Inj. Prev. 2024, 25, 640–648. [Google Scholar] [CrossRef]
- Yao, S.; Kong, L.; Xiao, X.; Xu, P. Effect of seat direction on sitting occupant injury risk and improving strategy in the commuter train frontal crash. Int. J. Rail Transp. 2024, 12, 346–367. [Google Scholar] [CrossRef]
- Yao, S.; Kong, L.; Xu, P.; Xiao, X.; Peng, Y. Investigation on the dynamic characteristic of occupant during the frontal collision between high-speed train and obstacle. Accid. Anal. Prev. 2024, 199, 107495. [Google Scholar] [CrossRef]
- Lu, J.; Wang, X.; Qin, R.; Chen, B. Design of energy-absorbing bionic workstation table for trains and research on occupant collision injury. Int. J. Crashworthiness 2024, 29, 1118–1132. [Google Scholar] [CrossRef]
- Yu, Z.; Jing, L.; Huang, Z. Mechanical response and risk assessment of head and neck injury in high-speed train rear-end collision. Chin. J. Appl. Mech. 2024, 41, 77–89. [Google Scholar] [CrossRef]
- Yu, Z.; Jing, L. Head injury mechanisms of the occupant under high-speed train rear-end collision. Theor. Appl. Mech. Lett. 2024, 14, 100537. [Google Scholar] [CrossRef]
- Pratomo, A.N.; Ilhamsyah, R.; Fadillah, H.; Dirgantara, T.; Wibowo, A.; Raharno, S. Optimisation of crashworthy passenger train seat structure to reduce injury risks. Int. J. Crashworthiness 2025, 1–14. [Google Scholar] [CrossRef]
- Wang, C.; Zhang, L.; Wei, L.; Song, Y. Analysis of Secondary Impact on Passenger Injuries in a Subway Vehicle Based on Sitting Dummy. J. China Railw. Soc. 2015, 37, 14–22. [Google Scholar] [CrossRef]
- Zhou, J.; Chen, B. Study of Impact on Passenger Injuries in a Subway Vehicle based on Simplified Model of Secondary Collision. J. Dalian Jiaotong Univ. 2017, 38, 37–42. [Google Scholar]
- Peng, Y.; Xu, T.; Hou, L.; Fan, C.; Zhou, W. An investigation of dynamic responses and head injuries of standing subway passengers during collisions. Appl. Bionics Biomech. 2018, 1, 1096056. [Google Scholar] [CrossRef]
- Yao, S.; Li, X.; Xiao, X.; Xu, P.; Che, Q. Injuries to standing passengers using different handrails in subway train collision accidents. Int. J. Crashworthiness 2021, 26, 53–64. [Google Scholar] [CrossRef]
- Yu, Z.; Zheng, S.; Liu, K.; Gao, Z.; Zhao, L.; Jing, L. A modified finite element dummy model of Chinese adult male used for train collision simulations. Int. J. Rail Transp. 2024, 12, 709–732. [Google Scholar] [CrossRef]
- Yang, W.; Xie, S.; Li, H.; Chen, Z. Design and injury analysis of the seated occupant protection posture in train collision. Saf. Sci. 2019, 117, 263–275. [Google Scholar] [CrossRef]
- Deng, G.; Wang, F.; Yu, C.; Peng, Y.; Xu, H.; Li, Z.; Hou, L.; Wang, Z. Assessment of standing passenger traumatic brain injury caused by ground impact in subway collisions. Accid. Anal. Prev. 2022, 166, 106547. [Google Scholar] [CrossRef] [PubMed]
- Ünlü, O.; Kaya, N. Structural optimisation of a passenger seat according to crash injury criteria with artificial neural networks. Mech. Based Des. Struc. Mach. 2025, 53, 5717–5736. [Google Scholar] [CrossRef]
- Freeman, J.; Matthews, P. Improving the Design of Seats and Tables, and Evaluating Restraints to Minimise Passenger Injuries—Review of Two-Point Passenger Restraints; Rail Safety and Standards Board Ltd.: London, UK, 2005. [Google Scholar]
- GM/RT2100:2020; Rail Vehicle Structures and Passive Safety. Rail Safety and Standards Board Limited (RSSB): London, UK, 2020.
- EN 15227:2020; Railway Applications-Crashworthiness Requirements for Rail Vehicles. British Standards Institution (BSI): London, UK, 2020.
- AV/ST9001:2002; Vehicle Interior Crashworthiness. Railway Safety Evergreen House: London, UK, 2002.
Disclaimer/Publisher’s Note: The statements, opinions and data contained in all publications are solely those of the individual author(s) and contributor(s) and not of MDPI and/or the editor(s). MDPI and/or the editor(s) disclaim responsibility for any injury to people or property resulting from any ideas, methods, instructions or products referred to in the content. |
© 2025 by the authors. Licensee MDPI, Basel, Switzerland. This article is an open access article distributed under the terms and conditions of the Creative Commons Attribution (CC BY) license (https://creativecommons.org/licenses/by/4.0/).