Abstract
Key air route segments refer to route segments that play a hub-supporting role in the air transportation network of a specific airspace, and whose traffic anomalies (such as saturation or delay) are likely to trigger chain reactions through segment correlations. Identifying these segments and implementing resource allocation bias and targeted optimization for them can significantly improve network operational efficiency and alleviate delays. Current key segment identification methods only consider the physical connection status between individual air route segments, ignoring the spatiotemporal correlation of traffic changes among segments. To address this issue, this paper proposes a key segment identification method based on a segment-related network. Firstly, redundant search paths are reduced through the pruning of low-impact indicators, and an improved FP-Growth algorithm is proposed to analyze segment correlations. On this basis, a segment-related network is constructed, where segments serve as nodes and correlations between segments serve as edges. This network integrates the changing relationship between segment flows and the physical connections between segments, thereby improving the accuracy of identification. Finally, in the segment-related network of the Guangdong-Hong Kong-Macao Multi-Airport Terminal Area, key segments such as Pingzhou-Conghua, Pingzhou-Gaoyao, and Zhuhai-Nanlang are identified using degree centrality, PageRank, eigenvector centrality, and global centrality analysis methods.
1. Introduction
Economically developed regions have frequent economic and trade activities, high demand for business travel, and dense distribution of airports. The spatial distribution among airports overlaps, crosses, or is closely connected, resulting in complex routes, tight airspace resources, and serious flight conflicts in the region. Through unified air traffic control in the region, the multi-airport terminal area can optimize traffic flow allocation, route planning, and conflict deployment, avoiding the problems of inefficiency and high safety risk caused by individual management. The high density of routes in the multi-airport terminal area, the complex relationship, the uneven flow of each air route segment, and the delay of one air route segment will affect several air route segments in the region. To realize the cooperative optimization of a multi-airport terminal area, it is very important to analyze the relationship between segments in the terminal area, especially the identification of key segments.
At present, the identification of key air route segments is mainly based on the analysis of the physical connection topology of the air route network. The analysis methods include identifying key nodes based on the “centrality” feature, i.e., constructing centrality feature indicators of waypoints under different measurement methods and quantitatively ranking to identify key nodes. Early studies, such as Kitsak et al. (2010), proposed a node influence identification method based on k-shell decomposition, which revealed the critical role of the network’s core position in propagation efficiency and laid a theoretical foundation for subsequent research []. Chen et al. (2012) improved traditional methods by integrating local and global centrality indicators, enhancing the accuracy of key node identification []. The expansion at the methodological level was further deepened in the research of Bae and Kim et al. (2014) []. The neighborhood coreness algorithm they proposed achieved a refined assessment of the spreader’s influence by considering the structural characteristics of the node’s neighborhood [].
In the field of aviation network applications, Yan et al. (2016) analyzed the spatial distribution characteristics of China’s aviation hub nodes based on degree centrality and the clustering coefficient, revealing the topological control role of core airports []. Wang et al. (2016) constructed an evolutionary model of air traffic situation complexity and found a strong correlation between the dynamic changes in network structure and traffic congestion []. Belkoura et al. (2016) proposed a hierarchical sampling strategy for the air transportation system through multi-dimensional network analysis, effectively solving the data processing challenges in large-scale network research []. Subsequent studies gradually expanded to a finer granularity: Wang et al. (2017) revealed the spatiotemporal evolution patterns of aircraft clusters through empirical analysis [], while Xu et al. (2021) introduced a directed weighted network model to systematically characterize the asymmetric flow characteristics of China’s urban aviation network []. Regarding network vulnerability, the innovative work of Ren and Yang et al. (2020) found that the key links of China’s air cargo network have a significant impact on global connectivity, providing a theoretical basis for emergency management []. The current research trends exhibit two major characteristics: first, node identification methods are evolving from single indicators to multi-dimensional integration; second, aviation network research is shifting from static topological analysis to the exploration of dynamic evolution mechanisms. Some scholars comprehensively consider multiple network attribute indicators to obtain a global centrality indicator, which is used as a ranking criterion to identify key segments. Li et al. (2020) identified key nodes in China’s air route network based on traditional network topological indicators, revealing the strong dependence of network invulnerability on hub nodes []. In 2022, they introduced the TOPSIS multi-criteria fusion method, integrating multi-dimensional features such as node efficiency and betweenness centrality, which significantly improved the objectivity of node importance assessments []. Kang et al. (2023) innovatively combined the risk propagation dynamics model with aircraft departure control scenarios, finding that the failure of key nodes would trigger systematic delay diffusion through an “avalanche effect” []. Wang et al. (2019) constructed an influential node identification framework, confirming that network robustness is significantly affected by the distribution of highly influential nodes, and proposed redundant protection strategies for hub nodes []. Notably, Ding et al. (2021) expanded the research perspective from nodes to edge weights, proposing an evaluation model based on route flow weights and clustering coefficients, which revealed the coupling mechanism between air route transport capacity and network connectivity []. The current research trends show three shifts: the evaluation method is transforming from single indicators to multi-source data fusion; the research paradigm is evolving from static topological analysis to dynamic propagation simulation; and the application scenario is extending from basic network theory to air traffic operation control.
In addition to identifying key segments using centrality indicators, another approach is to identify key nodes based on “destructive” features. This mainly involves analyzing changes in network performance indicators—such as network efficiency, robustness, average clustering coefficient, and maximum connected subgraph—after removing waypoints and using these changes as the basis to identify key nodes. Duan and Zhan (2015) revealed the evolution mechanism of node importance by constructing a cascading failure model, emphasizing the dynamic correlation between failure propagation and network structure under cascading effects []. Morone and Makse (2016) proposed a node influence maximization method based on optimal percolation theory, providing an efficient algorithm for key node identification and promoting the development of network robustness enhancement strategies []. Cheng et al. (2017) evaluated node importance by integrating multiple indicators, analyzing vulnerability by combining network topology and dynamic characteristics, and their method was verified in the aviation equipment manufacturing network []. For air transportation systems, Du et al. (2019) constructed a delay causality network, identifying bottleneck nodes through dynamic traffic analysis and providing a new perspective for multi-layer network robustness research []. Wang et al. (2020) proposed a key node identification model for the aircraft state network based on complex network theory, verifying the invulnerability improvement effect by combining network efficiency and connectivity indicators []. Feng and Jia (2021) innovatively integrated node and edge failure scenarios, proposing a quantitative evaluation framework for aviation network robustness and revealing the sensitivity characteristics of the network to deliberate attacks [].
In general, research in this field presents a multi-dimensional integration trend: node importance analysis has expanded from static topology to dynamic cascading processes; robustness optimization strategies cover structural enhancement and failure recovery mechanisms; and aviation network modeling has gradually integrated multi-layer interdependent network theory. However, existing methods are still limited to the physical connection attributes between routes in network analysis. Although the research methods adopted have incorporated features such as dynamic cascading propagation, they have not fully considered dynamic indicators such as flight traffic in their impact on the network. In addition to the physical connection relationships between routes, factors such as flight flows and delays between air route segments also exhibit significant spatiotemporal correlation. To address the core limitation of existing key segment identification methods—“focusing only on the physical connections of segments while ignoring the spatiotemporal correlation of traffic”—this paper proposes a key segment identification technology suitable for multi-airport terminal area scenarios, providing accurate support for the optimization of terminal area route networks. This scheme identifies key segments by incorporating dynamic segment indicators, analyzing the spatiotemporal correlation between segments in multi-airport terminal areas, and identifying the influence of segments on other segments.
At present, there are relatively few studies on correlation analysis between air route segments, while relevant studies in other fields are relatively abundant. The literature of [] studied the spatiotemporal autocorrelation of urban road networks and found that the road network in London exhibit a significant positive spatiotemporal correlation and provided a new perspective for understanding and predicting urban traffic flow. The literature of [] investigated the correlation of congestion in urban road networks and proposed a variety of correlation analysis methods, aiming to describe urban road networks and traffic conditions more accurately and effectively. The of literature [] proposed the use of Principal Component Analysis (PCA) to analyze the correlation of urban traffic intersections. The literature of [] put forward a spatiotemporal correlation analysis method based on the Pearson correlation index, revealing the spatiotemporal diffusion of traffic congestion. These methods are mainly based on different mathematical and statistical theories, which involve high computational complexity and fail to distinguish causal relationships. Data mining, however, can overcome the limitations of homogeneous modeling through approaches such as dynamic modeling, multimodal data fusion, and causal inference. This paper selects data mining methods to analyze the association features in air route data.
Common data mining algorithms include Apriori [] and FP-Growth []. Nevertheless, with the increase in the dimensions of air route data, the Apriori algorithm suffers from high computational complexity and low operational efficiency when processing sparse data, making it difficult to meet the real-time analysis requirements of large-scale air route networks. To address this issue, the FP-Growth algorithm is based on the FP-Tree compressed storage structure. By constructing a frequent pattern tree, it can quickly identify frequent itemsets with only two database scans, thereby reducing computational redundancy. However, when dealing with large-scale datasets, it may generate a large number of tree branches, which impairs the algorithm’s execution efficiency. Therefore, this paper proposes an improved FP-Growth algorithm that adopts a dynamic pruning strategy [] and parallel computing [] architecture to enhance data processing efficiency. Redundant search paths are reduced through the pruning of low-impact indicators to lower the computational dimension, and a parallel computing model with multi-task nodes is designed to improve both time and space efficiency.
Correlation analysis between segments can reveal the mutual influence relationships among different segments; how to identify key segments from these complex interrelationships is another critical problem to be solved. As a powerful tool for studying the structure, function, and dynamic characteristics of large-scale networks, complex network theory provides a new perspective for the identification of key air route segments.
In summary, this paper addresses the problems of the traditional Apriori algorithm, which has high computational complexity when processing sparse air route data, and the standard FP-Growth algorithm, which generates numerous tree branches and exhibits low execution efficiency when handling large-scale datasets. To solve these issues, an improved FP-Growth algorithm integrating the “pruning of low-impact indicators” and “parallel computing with multi-task nodes” is proposed. This improved algorithm effectively reduces redundant search paths, lowers the computational dimension, improves spatiotemporal efficiency, and enables efficient mining of frequent itemsets related to segment traffic. Meanwhile, by abandoning the static analysis framework that only constructs networks based on the physical connections of segments, this paper integrates the “spatiotemporal correlation of segment traffic” mined by the improved algorithm with the physical connections of segments, constructing a “segment-related network” that adapts to actual operational scenarios. This enriches the theoretical dimension of key segment identification in multi-airport terminal areas. Finally, taking the airspace of the Guangdong-Hong Kong-Macao multi-airports as an empirical scenario, key segments such as Pingzhou-Conghua, Pingzhou-Gaoyao, and Zhuhai-Nanlang are accurately identified using the proposed method. The results can directly serve practical management and control tasks in this region, including route optimization, traffic allocation, and delay resolution, filling the technical gap of “accurately identifying key segments to support cooperative optimization” in dense airport clusters.
2. Improved FP-Growth Algorithm
2.1. FP-Growth Algorithm
The FP-Growth algorithm is a typical data mining method, which adopts FP-Tree compression to store transaction information, and mines frequent itemsets directly on this structure, which solves the problem of exploding candidate itemsets in traditional association rule mining, and thus is more efficient. This experimental simulation and calculation were conducted using MATLAB R2023a, an Intel i7-12700H processor, and 32 GB of RAM. The algorithm first constructs a FP-Tree by two database scans: the first one counts the item support (characterizing the co-occurrence frequency in the transaction library, containing the ratio of the number of transactions to the total number of transactions) screens the frequent items that satisfy the minimum support threshold and arranges them in descending order:
where is the number of transactions in the transaction set containing A. N denotes the number of governor transactions.
Transactions are inserted into the tree sequentially for the second time, merging the same paths and accumulating node counts to form a compact tree structure. Subsequently, a branching strategy is used to mine the frequent item set from the bottom up: the conditional pattern base is generated by backtracking from the bottom item of the tree head pointer table, and the conditional FP-Tree is constructed recursively to extract the sub-frequent item set. On this basis, association rules are filtered. Confidence is a measure of the strength of association between itemset A and itemset B in the transaction dataset, which is defined as the conditional probability of the simultaneous occurrence of itemset B in a transaction in which itemset A occurs, and is denoted by C. The conditional pattern base is a mathematical expression of the association rules. Its mathematical expression is as follows:
where is the frequency of the simultaneous occurrence of itemsets A and B, and is the frequency of occurrence of itemset A. The FP-Growth algorithm efficiently finds out the segments that have correlation in air transportation by mining the frequent itemsets of segment traffic combined with the minimum support threshold. Based on the association rules, the segments with high relevance are filtered by confidence level from the ponderous air segment traffic data. However, the number of recursively generated conditional pattern bases of the standard FP-Growth algorithm may grow exponentially when dealing with large-scale datasets, which directly leads to a decrease in computational efficiency.
2.2. Improved Method
In order to effectively solve the memory consumption and computational efficiency problems of the FP-Growth algorithm when dealing with large-scale data, the algorithm is further optimized. The pruning technique is introduced, which can identify and eliminate low-frequency branches in real time during the algorithm running process, reduce the memory consumption and improve the computational efficiency, and the pruning process is depicted in Figure 1.
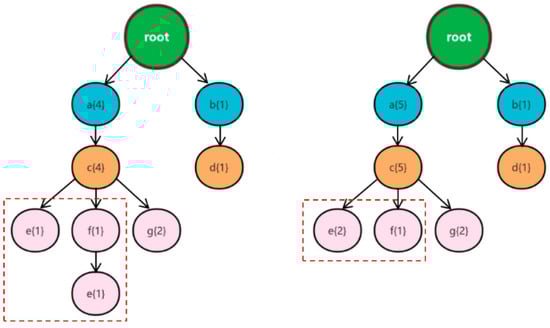
Figure 1.
Pruning process.
Combined with the pruning process in Figure 1 and the segment traffic correlation analysis scenario of this paper, each “branch” of the FP-Tree is essentially “a set of frequently occurring segment traffic combinations”. For example, a branch “f {1} →e {1}” represents that “in the traffic transaction where segment f appears once, segment e also appears once concomitantly”; a “parent branch” refers to the main path corresponding to a certain segment (e.g., segment f), and a “child branch” refers to the child nodes corresponding to other segments (e.g., segment e) that appear along with this main path. The pruning optimization in Figure 1 achieves a more compact FP-Tree and more efficient subsequent mining by “identifying mergeable child branches and eliminating redundant low-frequency branches”. In general, by “proactively handling redundant branches as soon as the tree is built”, the workload of subsequent mining is reduced from the source. Especially for “infrequent event items” (such as low-frequency segments and occasionally occurring abnormal traffic data), their valid data are “aggregated” into high-frequency items in advance. This not only prevents these low-frequency items from interfering with the mining process but also retains their data value. Ultimately, the improved FP-Growth algorithm can more quickly mine valuable segment correlations from massive segment traffic data. The specific data mining process of the improved FP-Growth algorithm is as follows (Figure 2).
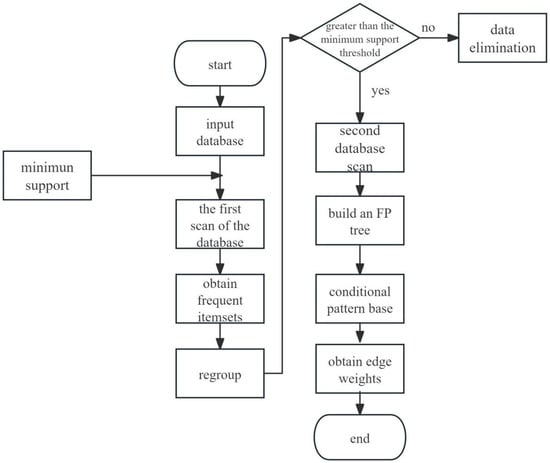
Figure 2.
The flow of the improved FP-Growth method.
2.3. Algorithm Validation
In order to test the computational efficiency and result accuracy of the improved FP-Growth algorithm in data mining tasks, the webdocs.dat dataset is selected for experimental evaluation in this paper. Webdocs.dat is included in the Frequent ItemSet Mining DataSet Repository [], which brings together a large number of datasets often used for research work in the field of association rule mining. The specific datasets are shown in Table 1.

Table 1.
Introduction to datasets.
- (1)
- Reliability verification
Firstly, the mining results of the traditional FP-Growth and improved FP-Growth algorithm are compared to verify the reliability of the improved FP-Growth algorithm mining. This experimental simulation and calculation were conducted using MATLAB R2023a, an Intel i7-12700H processor, and 32 GB of RAM. Mining experiments are conducted in webdocs.dat using the traditional FP-Growth algorithm and the method of this paper, respectively, to compare the mining results of the two methods. Table 2 gives the comparison of results at quantities of 10 MB and 30 MB.
Table 2.
Comparison results.
Comparing and analyzing the experimental data presented in Table 2, it can be found that the set of frequent items mined by the traditional FP-Growth algorithm and the improved FP-Growth algorithm are consistent, and the experimental results show that the improved FP-Growth algorithm is able to ensure the accuracy of the results when performing data mining tasks.
- (2)
- Timeliness validation
Next, the timeliness of the improved algorithm is verified. When evaluating the FP-Growth algorithm, especially when considering improvements based on parallel processing, it is assumed that one task node is only responsible for executing one independent mining task at a certain moment. Under the same experimental conditions such as data volume and association rules, the traditional FP-Growth algorithm, improved FP-Growth algorithm, traditional Apriori algorithm, and improved Apriori algorithm are compared, respectively. The webdocs.dat dataset is mined to test the computational performance, and the specific results are shown in Figure 3.
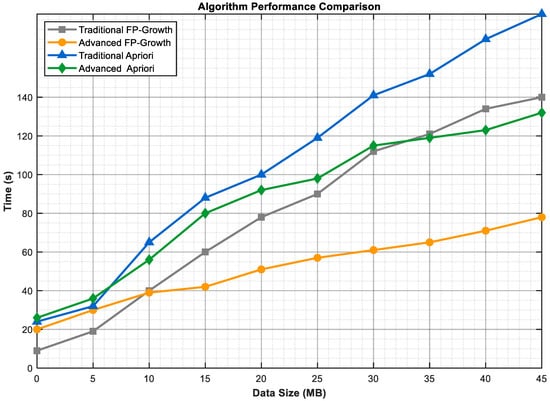
Figure 3.
Algorithm Comparison.
It can be clearly seen from the experimental results that, in terms of the curve trend, the Traditional Apriori (blue line) shows the steepest upward trend. When the data scale increases from 0 to 45 MB, the running time rises sharply from approximately 25 s to nearly 180 s. This is because the traditional Apriori algorithm relies on the logic of “multiple dataset scans + candidate itemset generation” and is prone to the problem of “candidate itemset explosion” in high-dimensional sparse data such as segment traffic, leading to a sharp increase in computational complexity with the expansion of the data scale. Although the Advanced Apriori (green line) reduces part of the redundant overhead through optimization methods such as parallel computing and local pruning, with a running time of about 130 s when the data scale is 45 MB, it still adopts the core framework of “candidate itemset generation-screening”, so its computational overhead under large-scale data are still higher than that of FP-Tree-based methods. The Traditional FP-Growth (gray line) avoids multiple scans of the full-volume data by using the FP-Tree to store frequent itemsets, with a running time of about 140 s at 45 MB. However, in large-scale segment traffic scenarios, the FP-Tree becomes overly complex due to the mixture of high-frequency and low-frequency segment branches, resulting in a relatively high time overhead for tree traversal and frequent itemset mining. The Advanced FP-Growth (orange line) is the flattest among the four curves, with a running time of only about 80 s at 45 MB. This algorithm integrates the strategies of “low-impact indicator pruning” (eliminating redundant low-frequency segment branches in the FP-Tree in advance to greatly simplify the tree structure and reduce the computational dimension) and “multi-task node parallel computing” (multiple nodes processing different data segments simultaneously to improve temporal and spatial efficiency), which effectively reduces redundant search paths and exhibits significant efficiency advantages in frequent itemset mining of large-scale sparse segment traffic data.
The results show that with the increase in data scale, the running time of the improved Advanced FP-Growth algorithm is significantly lower than that of other algorithms, which verifies the effectiveness of its “pruning + parallel” strategy in improving the mining efficiency of large-scale sparse data.
3. Network Construction
The improved algorithm is applied to the multi-airport terminal area to analyze the segment correlation within the multi-airport terminal areas and establish the segment-related network, which lays the foundation for the next key segment identification.
3.1. Air Route Network Construction
The multi-airport terminal area is chosen to be China’s Guangdong-Hong Kong-Macao Greater Bay Area Terminal Area, which consists of three core airports, Hong Kong, Guangzhou, and Shenzhen, as well as important airports such as Macao and Zhuhai, and jointly serves the huge passenger and cargo demand in the Greater Bay Area. There are 94 navigation points and 129 air routes within the Greater Bay Area Multi-Airport Terminal Area. The red dashed line box in Figure 4 demenstrates the scope of the Great Bay Area. Among them, a large number of air routes are concentrated in the middle part of the multi-airport terminal areas, i.e., airports in Zhuhai and Shenzhen have a large number of air routes. The coordinates of the navigation points are inputted and based on the connecting relationship of the air routes, the network of air routes within the Greater Bay Area Multi-Airport Terminal Area is constructed, as shown in Figure 4.
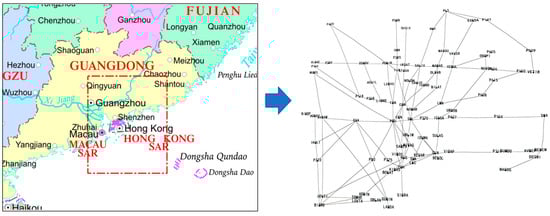
Figure 4.
The scope of the Great Bay Area and Route network of the Greater Bay Area.
3.2. Segment-Related Network Construction
To construct the segment-related network G(V,E), take the segments as the nodes of the network, , which represents the set of segments in the network. The judgment of connecting edges is based on the correlation between two segments, if the correlation between two segments is strong, then it means that there is a connecting edge between two segments, and vice versa, then there is no connecting edge, and is a set of connecting edges in the network, the specific construction process is shown in Figure 5.
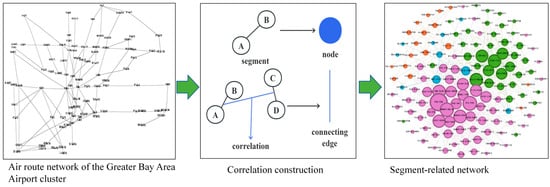
Figure 5.
Segment-related network construction process.
Through web crawling to collect the flight traffic data between each segment within the multi-airport terminal areas in the Greater Bay Area from January to June 2025, selected segment hourly traffic (aircraft traffic data on a specific segment within an hour)(Table 3), the hourly traffic of each segment was counted to obtain the average value of hourly traffic of each segment, if the traffic of a segment was greater than or equal to the average value, it was recorded as one, and if it was less than the average value, it was recorded as zero, which results in the two types of 0/1 State datasets.
Table 3.
Hourly traffic of air route segments on a certain day.
Based on the improved FP-Growth algorithm to mine the segment operation data of the multi-airport terminal areas in the Greater Bay Area, the dataset is processed to filter the low-frequency items and perform frequent item set mining to derive the correlation data, totaling 8256 connecting edges, as shown in Table 4.
Table 4.
Correlation between segments.
Based on the segment traffic operation characterization study, referring to the literature [], the minimum support degree of correlation rules is set to 0.2 (to balance data sparsity), and the minimum confidence degree is set to 0.5 (to filter weak correlation rules). The segment network correlation totaled 696 valid connecting edges, as shown in Table 5.
Table 5.
Strongly correlated segments.
Based on the tabular information, the segment-related network was constructed. Using the Fruchterman–Reingold (FR) force-oriented layout network that comes with Gephi 1.1.1 software, the segment-related network is made, as shown in Figure 6. The node size is adjusted according to the degree value, the larger the degree value the larger the node and the more segments are associated with it. The gradient color system is used to characterize the correlation strength, the darker the color, the greater the correlation, as shown in Figure 6.
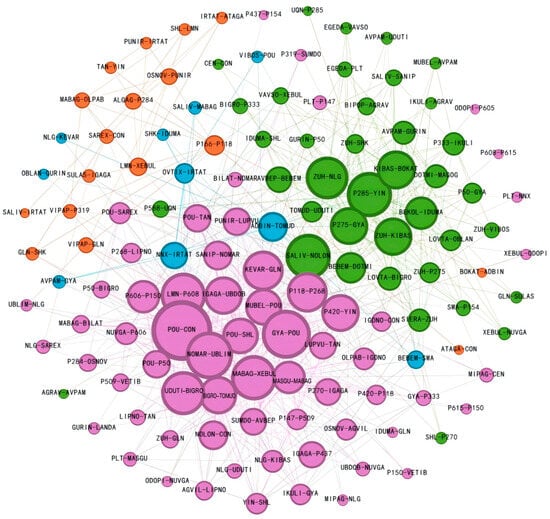
Figure 6.
Multi-airport terminal areas segments-related network.
From the figure, it can be seen that the correlation network consists of 129 nodes and 696 edges, and the association detection algorithm identifies four main associations and uses color to distinguish them, with the largest association accounting for 31% of the total number of nodes, and the density of internal connections is high, reflecting that the overall stability of the segment-related network is good. At the same time, it can be found that the topology of the network has both small-world network characteristics (average path length 2.3 ± 0.4) and scale-free network characteristics (degree distribution index γ = 2.1, R2 = 0.93), and its global efficiency of 0.78 and local clustering coefficient of 0.65 indicate that the network has an efficient information transfer capability and robust architecture. Meanwhile, more nodes with degree value of one appeared in the segment-related network, such as segment P437-P154, which is at the edge of the network structure of multi-airport terminal area routes, and has less correlation with other segments of the multi-airport terminal areas in the Greater Bay Area due to the influence of the neighboring regions. It can be seen that the constructed route segment-related network has obvious complex network characteristics, and the key route segments can be identified through the complex network key node identification method.
4. Key Node Identification Based on the Segment-Related Network
Based on the segment-related network, this paper firstly identifies the key segments through the local centrality-based method, selects the three methods of degree centrality, network PageRank and eigenvector centrality to identify the key segments, and then finds out the key nodes through the comprehensive evaluation method.
4.1. Identification of Key Segments Based on Local Centrality
The local centrality index mainly considers degree, PageRank, and eigenvector centrality.
Degree centrality (degree centrality), as a key indicator to measure the importance of network nodes, its value is proportional to the number of connected edges of a node, reflecting the degree of connectivity and potential influence of a node in the network, and is calculated by the following formula:
where n denotes the total number of nodes in the network and denotes the degree of the node. The higher the degree centrality, the stronger the connectivity of node i in the network, and the greater the importance of node i in the segment network. The degree centrality in the voyage segment-related network is calculated according to the formula to find out the top ten nodes in terms of degree centrality. The experimental results are shown in Figure 7.
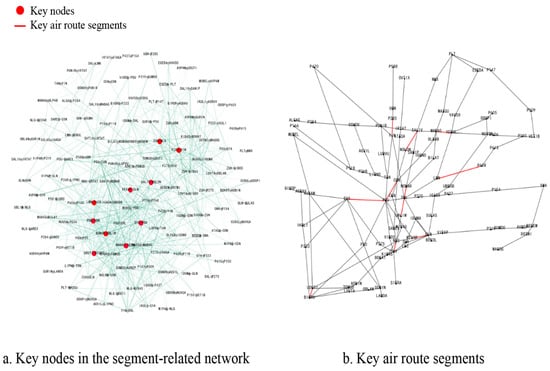
Figure 7.
Degree centrality.key segment identification.
The red nodes in Figure 7a are the high-connectivity important air route segments screened by degree centrality, and their distribution is mainly concentrated in the middle of the network, which is mainly due to the fact that the complex network mapping in this paper adopts the Fruchterman–Reingold force-directed layout network, and the nodes with high degree values are mainly concentrated in the middle part of the network. These important segments are mapped to the realistic route network diagram of the multi-airport terminal areas in the Greater Bay Area, and the mapping results are shown in Figure 7b. The red labeled part in Figure 7a are the key nodes in segment-related network, and from Figure 7b, it can be found that these segments are often connected to the navigation points with higher degree values in the route network, this is due to the fact that the correlation between directly connected segments tends to be larger, and these are often shown as highly valued nodes in the segment-related network.
The core principle of the PageRank algorithm is based on the stochastic wandering model, which depends not only on the number of directly connected nodes, but also on the importance of these nodes, which is assessed and quantified by the following formula:
where the resistance coefficient d represents the probability of randomly jumping to other nodes, which can effectively prevent the wandering factor from falling into a loop and improve the accuracy of the PageRank calculation, taking the value range of , which is set to 0.85 according to the literature [], N denotes the total number of all the nodes in the network, denotes the collection of nodes connected to node v, and denotes the collection of nodes connected to node u. The PageRank calculation is performed by calculating the PageRank of each node. By calculating the PageRank value of each node, the key nodes of the segment network are obtained as shown in Figure 8.
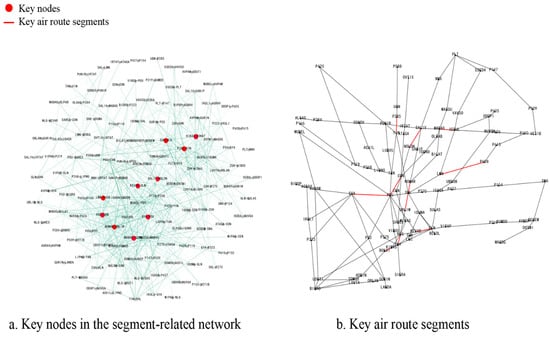
Figure 8.
PageRank centrality key segment identification.
From Figure 8, it can be found that the key nodes identified based on PageRank and the key nodes based on the degree centrality method have a high degree of overlap, and the top four of degree centrality are the same segments. This phenomenon stems from the fact that the two algorithms have a similar theoretical foundation level in assessing the influence of network nodes. Specifically, PageRank quantifies the influence of node transmission through link relationships, while degree centrality is measured based on the number of direct connections of nodes, and the two show positive correlation in measuring the importance of network topology. The main difference between the two approaches is that the PageRank approach considers NOMAR-UBLIM as a key node, while degree centrality identifies UDUTI-BIGRO segments as boundaries in the actual route network. This is due to the fact that the PageRank value models the probability of a node being visited in a random wandering, and the high value node NOMAR-UBLIM is considered to be a key staging point for air traffic propagation, which is more extensive and efficient than UDUTI-BIGRO.
Eigenvector Centrality (EVC) is an important metric in network analysis that measures the importance of nodes in the network. The centrality is calculated by considering the connectivity between the nodes. The formula for its calculation is given below:
where denotes the eigenvector centrality of node i, denotes the edge weights pointing from i to j, λ is the maximum eigenvalue, and n is the total number of nodes. Its essence is the eigenvector corresponding to the largest eigenvalue corresponding to the adjacency matrix A. It reflects the influence on the node’s local connection pattern and structure, and the key voyage segments found based on the eigenvector centrality are shown in Figure 9.
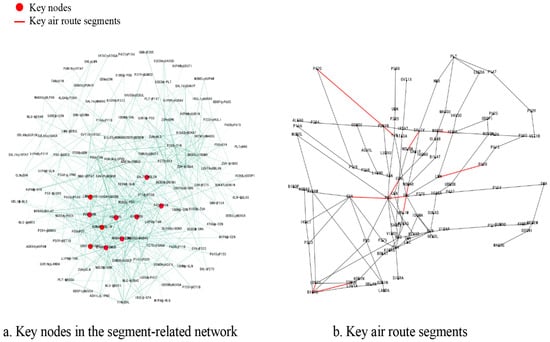
Figure 9.
Identification of key segments based on eigenvector centrality.
From the distribution of key nodes in the segment-related network, it is observed that nodes clustered in the upper left region of the network have more connections between them. These high centrality nodes form a “core” region in the network, which has an important impact on the overall structure and function of the network. When mapped to the real multi-airport terminal areas route network in the Greater Bay Area, the distribution of key segments is geographically concentrated near busy airports (e.g., Baiyun and Bao’an airports) or on routes between busy airports. These key node distributions are consistent with the starting point of the eigenvector centrality ranking: the importance of a node depends not only on the number of nodes connecting it, but also on the importance of these connecting nodes themselves.
4.2. Identification of Key Segments Based on Global Centrality
Local centrality often reflects the local characteristics of the navigation network, in order to solve this problem, the paper chooses the AHP [] method to comprehensively consider multiple network attribute indicators, and comprehensively obtain the global centrality indicator, which is used as a sorting criterion to identify the key segments. We selected the node degree centrality, PageRank, Eigenvector centrality, and point median metrics chosen in the previous section to reflect the degree of centrality of nodes in the network. Since the number of betweenness and Eigenvectors contain edge weight information, we consider them to be more important than degree and PageRank, and the Eigenvector centrality reflects the association structure and is considered to be more important than the number of betweenness. As for degree and PageRank, PageRank reflects the importance of nodes to the network structure, while the degree metrics consider a single piece of information, and PageRank is considered more important. In summary, we consider the importance of each metric to be ranked as Eigenvector (E), Betweenness (B), PageRank (Pr), and Degree (D).
The weight calculation of the four topology indicators takes the hierarchical analysis method, and the scaling method here can be expressed by the following equation:
Through the above analysis, the results of the comparison of the importance of the four indicators can be given in Table 6:
Table 6.
Comparison results of indicators.
The elements in the judgment matrix are defined as:
where , , .
The weight vector is denoted as:
where ; then we have .
Next, the consistency test is performed and the maximum Eigenvalue is calculated :
At this time, , the judgment matrix satisfies the consistency test results, and the weights of each index are: .
Combining the above complex network indicators, the key segments based on global centrality sorting are obtained as shown in Figure 10:
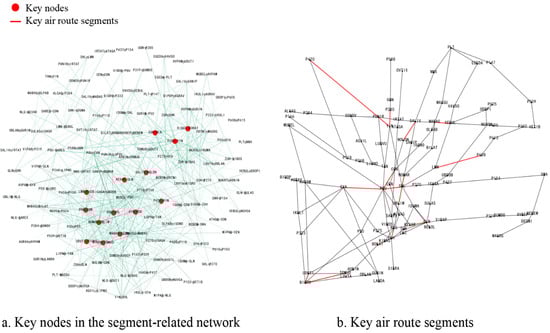
Figure 10.
Key segments based on global centrality.
In the identification process, the paper chooses the first 14 segments as the key segments, from the experimental results, the key segments identified by global centrality and the previous local centrality have a high degree of overlap, but there are some differences in the specific importance ranking. This is mainly due to the fact that some segments, although less important in terms of a certain feature, can be ranked in a top position from different angles, such as the ZUH-NLG segment. In terms of the actual situation in the multi-airport terminal area, the top-ranking segments of Pingzhou-Conghua (POU-CON), Pingzhou-Gao Yao (POU-GYA) and Zhuhai-Nanlang (ZUH-NLG) are mainly concentrated in the areas around busy airports or constitute the main air corridors to these busy airports. Combined with the 2023 civil aviation airport throughput rankings and data on the number of flights guaranteed by each province, the area around Guangzhou is an important flight distribution center in China, POU-CON and POU-GYA are the main air routes within the multi-airport terminal areas in the Greater Bay Area, and ZUH-NLG contains the key inbound and outbound routes to the hub airport of Zhuhai. Therefore, these key segments play a crucial role in maintaining the connectivity and operational efficiency of the entire aviation network, which also indicates that the methodology of this paper is correct.
5. Conclusions
The paper proposes a segment-related analysis method by the improved FP-Growth algorithm, on the basis of which a segment-related network is constructed through the correlation between segments, which combines the changing relationship between segment traffic and the physical connection between segments. Based on the segment-related network, key segments such as Pingzhou-Conghua, Pingzhou-Gaozhou, and Zhuhai-Nanlang are identified in the terminal area of the Guangdong, Hong Kong, and Macao Multi-Airports through the fusion analysis of three indexes, namely, degree centrality, PageRank and Eigenvector centrality, and the validity of the method is proved by combining with the actual situation of connecting relationship between the segments and the traffic flow in the terminal area. The identified key segments can provide the basis for the optimization of the subsequent flight routes, traffic distribution, delay propagation elimination, etc.
6. Future Research Directions
- (1)
- Limitations of Existing Methods
Single Dimension of Segment Correlation Analysis: Currently, the network is only constructed based on the “spatiotemporal correlation of segment traffic”, without incorporating key practical factors that affect segment correlations, such as flight types (large aircraft and small aircraft have different segment occupancy requirements), air traffic control rules (flight restrictions at different time periods), and weather conditions (severe weather may change segment correlations). This results in insufficient alignment between correlation analysis and actual operational scenarios.
Static Limitation of Segment Network: The constructed segment-related network is based on static data from January to June 2025, without considering temporal dynamic changes (e.g., fluctuations in segment correlations caused by morning and evening peaks or seasonal differences). It fails to reflect changes in key segments at different time periods, making it difficult to support real-time air traffic control decisions.
- (2)
- Future Research Directions
Construction of Dynamic Segment Network and Prediction Model: Introduce the temporal dimension to build a time-series segment-related network (updated hourly/daily) and analyze the dynamic changes in key segments at different time periods. Combine time-series prediction models such as LSTM and GRU to realize the short-term prediction of key segments, providing support for real-time traffic allocation and delay resolution.
Research on Correlated Delay Propagation Mechanism: Based on the identified key segments, construct a delay propagation model (e.g., cascading failure model) to analyze the impact scope and speed of key segment delays on the entire terminal area network. Form a closed-loop research framework of “key segment identification—delay risk early warning—control strategy optimization”.
Author Contributions
Conceptualization, X.W. and H.T.; methodology, X.W.; software, M.Z.; validation, H.T. and Z.W.; formal analysis, H.T.; investigation, X.W. and H.T.; resources, X.W. and Z.W.; data curation, H.T. and M.Z.; writing—original draft preparation, H.T. and X.W.; writing—review and editing, H.T., X.W. and M.Z.; visualization, Z.W.; supervision, X.W.; project administration, X.W. All authors have read and agreed to the published version of the manuscript.
Funding
This research received no external funding.
Data Availability Statement
The data presented in this study are available from the corresponding author upon request.
Conflicts of Interest
The authors declare no conflicts of interest.
References
- Kitsak, M.; Gallos, L.K.; Havlin, S.; Liljeros, F.; Muchnik, L.; Stanley, H.E.; Makse, H.A. Identification of influential spreaders in complex networks. Nat. Phys. 2010, 6, 888–893. [Google Scholar] [CrossRef]
- Chen, D.; Lü, L.; Shang, M.S.; Zhang, Y.C.; Zhou, T. Identifying influential nodes in complex networks. Phys. A Stat. Mech. Its Appl. 2012, 391, 1777–1787. [Google Scholar] [CrossRef]
- Bae, J.; Kim, S. Identifying and ranking influential spreaders in complex networks by neighborhood coreness. Phys. A Stat. Mech. Its Appl. 2014, 395, 549–559. [Google Scholar] [CrossRef]
- Yan, L.; Chen, Z.; Zhang, Q. Analysis of key nodes in China s aviation network based on the degree centrality indicator and clustering coefficient. CAAI Trans. Intell. Syst. 2016, 11, 586–593. [Google Scholar]
- Wang, H.; Song, Z.; Wen, R.; Zhao, Y.F. Study on evolution characteristics of air traffic situation complexity based on complex network theory. Aerosp. Sci. Technol. 2016, 58, 518–528. [Google Scholar] [CrossRef]
- Belkoura, S.; Cook, A.; Peña, J.M.; Zanin, M. On the multi-dimensionality and sampling of air transport networks. Transp. Res. Part E Logist. Transp. Rev. 2016, 94, 95–109. [Google Scholar] [CrossRef]
- Wang, H.Y.; Xu, X.H.; Zhao, Y.F. Empirical analysis of aircraft clusters in air traffic situation networks. Proc. Inst. Mech. Eng. Part G J. Aerosp. Eng. 2017, 231, 1718–1731. [Google Scholar] [CrossRef]
- Xu, K.; Xiao, C.; Yang, Y. Directed weighted analysis of Chinese urban aviation network based on complex network theory. Sci. Technol. Eng. 2021, 21, 15669–15673. [Google Scholar]
- Ren, X.; Yang, L. Vulnerability analysis of China air cargo transportation network. J. Saf. Environ. 2020, 20, 840–848. [Google Scholar]
- Li, Y.; Liang, C.; Dai, F. Key node identification and invulnerability analysis of China’s air route network. China Saf. Sci. J. 2020, 30, 115–121. [Google Scholar]
- Li, Y.; Liang, C. Research on key node identification and damage resistance of airway network based on TOPSIS fusion method. Flight Dyn. 2022, 40, 83–87. [Google Scholar]
- Kang, R.; Yang, K. Key node identification and risk propagation of aircraft departure control. J. Sichuan Univ. (Nat. Sci. Ed.) 2023, 60, 013003. [Google Scholar]
- Wang, X.; Zhang, S. Identification and Robustness Analysis of Aviation Network Influence Nodes. Sci. Technol. Eng. 2019, 19, 297–302. [Google Scholar]
- Ding, J.; Wang, J. Route Importance Assessment Method Based on Edge Weight and Agglomeration Coefficient. Comput. Appl. Softw. 2021, 38, 39–44. [Google Scholar]
- Duan, D.; Zhan, R. Evolution mechanism of no de imp ortance based on the information ab out cascading failures in complex networks. Acta Phys. Sin. 2014, 63, 385–393. [Google Scholar]
- Morone, F.; Makse, H.A. Influence maximization in complex networks through optimal percolation. Nature 2015, 524, 65–68. [Google Scholar] [CrossRef] [PubMed]
- Cheng, G.; Lu, Y.; Zhang, M.; Huang, J.C. Node importance evaluation and network vulnerability analysis on complex network. J. Natl. Univ. Def. Technol. 2017, 39, 120–127. [Google Scholar]
- Du, W.B.; Zhang, M.Y.; Zhang, Y.; Cao, X.B.; Zhang, J. Delay causality network in air transport systems. Transp. Res. Part E: Logist. Transp. Rev. 2018, 118, 466–476. [Google Scholar] [CrossRef]
- Wang, Z.K.; Wen, X.X.; Wu, M.G. Identification of key nodes in aircraft state network based on complex network theory. IEEE Access 2019, 7, 60957–60967. [Google Scholar] [CrossRef]
- Feng, X.; Jia, H. Aviation network robustness considering node failure and edge failure. J. Beijing Jiaotong Univ. 2021, 45, 84–92. [Google Scholar]
- Zhao, L.; Wang, J.Q.; Deng, M.; Huang, J. Spatial-temporal autocorrelation model of road network based on travelling time. J. Cent. South Univ. (Sci. Technol.) 2012, 43, 4114–4122. [Google Scholar]
- Zou, Z.; Mao, B.; Gong, Q.; Hao, H. Failure Correlation Analysis of Urban Road Network. J. Transp. Syst. Eng. Inf. Technol. 2009, 9, 110–114. [Google Scholar]
- Dong, J.; Zhang, Y.; Zhang, Z.; Kuang, X. Principal Component Analysis of Dependency of Urban Intersections. J. Southwest Jiaotong Univ. 2003, 16, 619–622. [Google Scholar]
- Zhang, J.; Ren, G. Spatio-temporal Correlation Analysis of Urban Traffic Congestion Diffusion. J. Transp. Syst. Eng. Inf. Technol. 2015, 15, 175–183. [Google Scholar]
- Liu, D.H.; Zhao, X.; Zhao, J.P. Dynamic association network analysis of tower crane accident causation based on improved Apriori algorithm. Saf. Environ. Eng. 2023, 30, 106–112. [Google Scholar]
- Qiao, Y.; Wang, L. Simulation of Parallel FP Growth Mining Algorithm for Data Point Location. Comput. Simul. 2023, 40, 501–505. [Google Scholar]
- Xie, Z.; Zou, X.; Zhang, W. High-Efficient Parameter-Pruning Algorithm of Decision Tree for Large Dataset. Comput. Eng. 2024, 50, 156–165. [Google Scholar]
- Xu, X.; Tan, S.; Liu, J.; Shi, Y. User Location Prediction Based on Parallel Pattern Mining and Path Matching. J. Northeast. Univ. Nat. Sci. 2020, 41, 767–770, 777. [Google Scholar]
- Frequent ItemSet Mining DataSet Repository. Available online: http://fimi.ua.ac.be/data/ (accessed on 9 June 2025).
- Huang, Y.; Wu, Z.; Zhao, M. Quality Certification, Gift Box Packaging and Online Consumption Premium of Agricultural Products: Data Mining and Analysis of Apple Products Based on JD.com Platform. Nankai Bus. Rev. 2025, 28. [Google Scholar]
- Amankwah-Nkyi, K.; Hernandez, S.; Mitra, S.K. Highway-Transportation-Asset Criticality Estimation Leveraging Stakeholder Input Through an Analytical Hierarchy Process (AHP). Sustainability 2025, 17, 5212. [Google Scholar] [CrossRef]
Disclaimer/Publisher’s Note: The statements, opinions and data contained in all publications are solely those of the individual author(s) and contributor(s) and not of MDPI and/or the editor(s). MDPI and/or the editor(s) disclaim responsibility for any injury to people or property resulting from any ideas, methods, instructions or products referred to in the content. |
© 2025 by the authors. Licensee MDPI, Basel, Switzerland. This article is an open access article distributed under the terms and conditions of the Creative Commons Attribution (CC BY) license (https://creativecommons.org/licenses/by/4.0/).