Abstract
In karst regions (KRs), unique surface morphology and irrational human exploitation have led to increasingly prominent issues such as land fragmentation and rocky desertification. Understanding the spatiotemporal evolution of cultivated land (CL) in these areas is of great significance for supporting regional socioeconomic development, food security, and ecological sustainability. This study focuses on Guilin, combining GIS spatial analysis with methods including kernel density analysis, dynamic degree, spatial transfer matrix, and a Geodetector to examine the spatiotemporal distribution characteristics, evolution trends, and driving factors of land use based on five-phase of land use data from 2000 to 2020. The results show that: (1) over the past two decades, land use in Guilin has been dominated by CL and forest land, with CL exhibiting a spatial pattern of more in the east and south, and less in the west and north; (2) the CL transfer-out rate exceeded the transfer-in rate, mainly shifting to construction land and forest land; (3) the overall density of CL showed a declining trend, with a relatively stable spatial pattern; and (4) driving factor analysis indicates that the spatiotemporal changes in CL are jointly influenced by multiple factors, with natural factors exerting a stronger influence than socio-economic factors. Among them, the interaction between elevation and temperature had the greatest impact and served as the dominant factor. Although GDP and population were not dominant individually, their explanatory power and sensitivity increased significantly when interacting with other factors, making them key sensitive factors. The results can provide a scientific reference for the protection and rational utilization of CL resources in KR.
1. Introduction
Cultivated land (CL) is a strategic resource for ensuring national food security, promoting high-quality economic development, and maintaining social stability and ecological security [1,2,3]. It plays a vital role in sustaining the supply of agricultural products, supporting ecosystem functions, facilitating soil and water conservation, and regulating the carbon cycle.
However, rapid urbanization, industrialization, and infrastructure construction in China have led to extensive conversion of high-quality CL into non-agricultural uses [4,5] such as non-grainization [6,7], extensive use and marginalization of land have become increasingly prominent [8,9], resulting in the continuous reduction in CL area, degradation in quality, landscape fragmentation, and habitat loss [10], thereby intensifying human–land conflicts [11]. These challenges are especially severe in karst regions (KRs), which are characterized by shallow soils, high bedrock exposure, and fragile ecosystems [12]. Unsustainable land use practices in these areas exacerbate soil erosion and rocky desertification [13], posing dual threats to regional food security and ecological stability. Studies indicate that the declining trend in CL area will be difficult to reverse in the foreseeable future [4], underscoring the persistent pressure on CL protection [3]. Thus, achieving a balance between socioeconomic development and the effective preservation and rational use of CL has become a critical concern for both scholars and policymakers worldwide.
Extensive research has been conducted to analyze the conversion between CL and other land types, identify driving mechanisms, and predict future trends. Key research themes include the spatiotemporal evolution of CL [4,14], natural and socio-economic drivers [3,10,15,16], the relationships between CL change and food security [17,18], and the ecological effects of land use change [19,20]. Urban expansion and rapid industrialization are major contributors to CL loss and fragmentation [5,18], while policies such as Grain for Green, basic farmland protection, and land quota systems directly affect the amount and distribution of CL [21,22]. Adjustments in agricultural structure, market demand, and farming practices also significantly influence CL use [23,24,25].
Internationally, studies in major agricultural regions such as the Mediterranean [26,27], the U.S. Midwest [28,29], Southeast Asia [30,31], and the Andean [32,33] have utilized long-term surveys, remote sensing, and agricultural census data to reveal the diverse pathways of CL evolution [34,35]. For instance, European research links subsidy policies and rural depopulation to farmland abandonment and ecological restoration [36,37]; North American studies emphasize technology intensification and market globalization [38,39]; and work in Southeast Asia KRs highlights slope degradation and terrace abandonment driven by terrain, climate, and labor migration [40,41,42,43].
Methodologically, CL research has evolved from single statistical indicator to using integrated spatial modeling [44,45]. Remote sensing and GIS technologies now enable high-resolution, multi-temporal monitoring using sources such as Landsat, MODIS, and Sentinel-2, along with derived products like NLCD and GlobeLand30 [6,42]. Common analytical methods such as the land use transfer matrix [46], kernel density estimation, spatial autocorrelation, hotspot analysis, and landscape pattern indices [47] have been widely applied to characterize the changes in the quantity and spatial patterns of CL [48,49,50].
To examine driving factors, researchers have employed logistic regression, spatial regression and geographical detector (Geodetector) models [6,51,52,53]. The Geodetector is particularly valuable for quantifying factor contributions (via the q-statistic) and detecting interactions without assuming linearity or variable independence [53]. It has been widely applied in studies of land use change, ecological evolution, and public health geography. In KRs, it helps identify key drivers—such as slope, elevation, settlement density, and road proximity—and reveals that interactive effects between factors often exceed individual impacts [54,55,56,57].
Most existing KR studies have focused on Guizhou, northwestern Guangxi, and southeastern Yunnan, emphasizing the relationships among land use change, rocky desertification control, and ecological restoration [58,59,60]. Findings indicate that the complex terrain, scattered distribution of CL, poor soil, and limited water availability in these areas make CL highly sensitive to external disturbances like construction expansion, infrastructure development, and policy adjustments [13,60]. Guilin, a typical karst city, has experienced rapid urbanization and tourism growth over the past two decades, leading to construction encroachment on plains and low-hill CL. Meanwhile, the Grain for Green policy and labor outmigration have reduced sloping and low-yield farmland, threatening both the quantity and quality of CL. Guilin’s subtropical monsoon climate, with high rainfall variability and extreme weather, combined with karst-related water leakage, further complicates agricultural sustainability. These attributes make Guilin an ideal region for studying CL dynamics in KRs.
Despite progress, current research still has limitations: (1) inadequate exploration of coupling effects between natural and socioeconomic factors, especially interaction types and spatial heterogeneity; (2) few long-term, high-precision studies at the municipal scale in KRs, limiting local insights and policy evaluation; (3) insufficient sensitivity testing of data sources, spatial scales, and factor processing methods in Geodetector applications, affecting robustness; and (4) limited coupling analysis between CL change and ecological processes such as ecosystem services and carbon storage, hindering comprehensive sustainability assessment.
Therefore, this study selects Guilin City as a representative KR area, using land use data from 2000 to 2020 alongside topographic, climatic, vegetation, and socioeconomic factors. Integrating GIS spatial analysis, transfer matrices, landscape indices, and the Geodetector, we analyze the spatiotemporal evolution of CL, identify key drivers and their interactions, and assess the relative contributions of natural and human factors across time and space. Guilin was selected as the study area for the following reasons: (1) as a highly typical karst region both in China and globally, its distinctive geomorphology strongly governs the distribution and dynamics of CL, making evolutionary patterns more observable; (2) accelerated urbanization has intensified human–land conflicts, with human activities further inducing surface fragmentation and rocky desertification; and (3) constrained by topography, CL in Guilin is relatively fragmented and highly sensitive to spatial restructuring under external disturbances. Research in Guilin can therefore inform local CL protection and management strategies while providing a valuable reference for other karst regions.
By detecting the spatiotemporal changes in CL and their driving factors, this study aims to address the following scientific questions: (1) What are the dominant factors driving spatiotemporal changes in CL? (2) Which factors exhibit enhanced effects combination shows the strongest interaction? (3) Which factors are most sensitive to CL change in Guilin? The results are expected to provide scientific support for the protection and sustainable utilization of CL in KRs.
2. Materials and Methods
2.1. Study Area
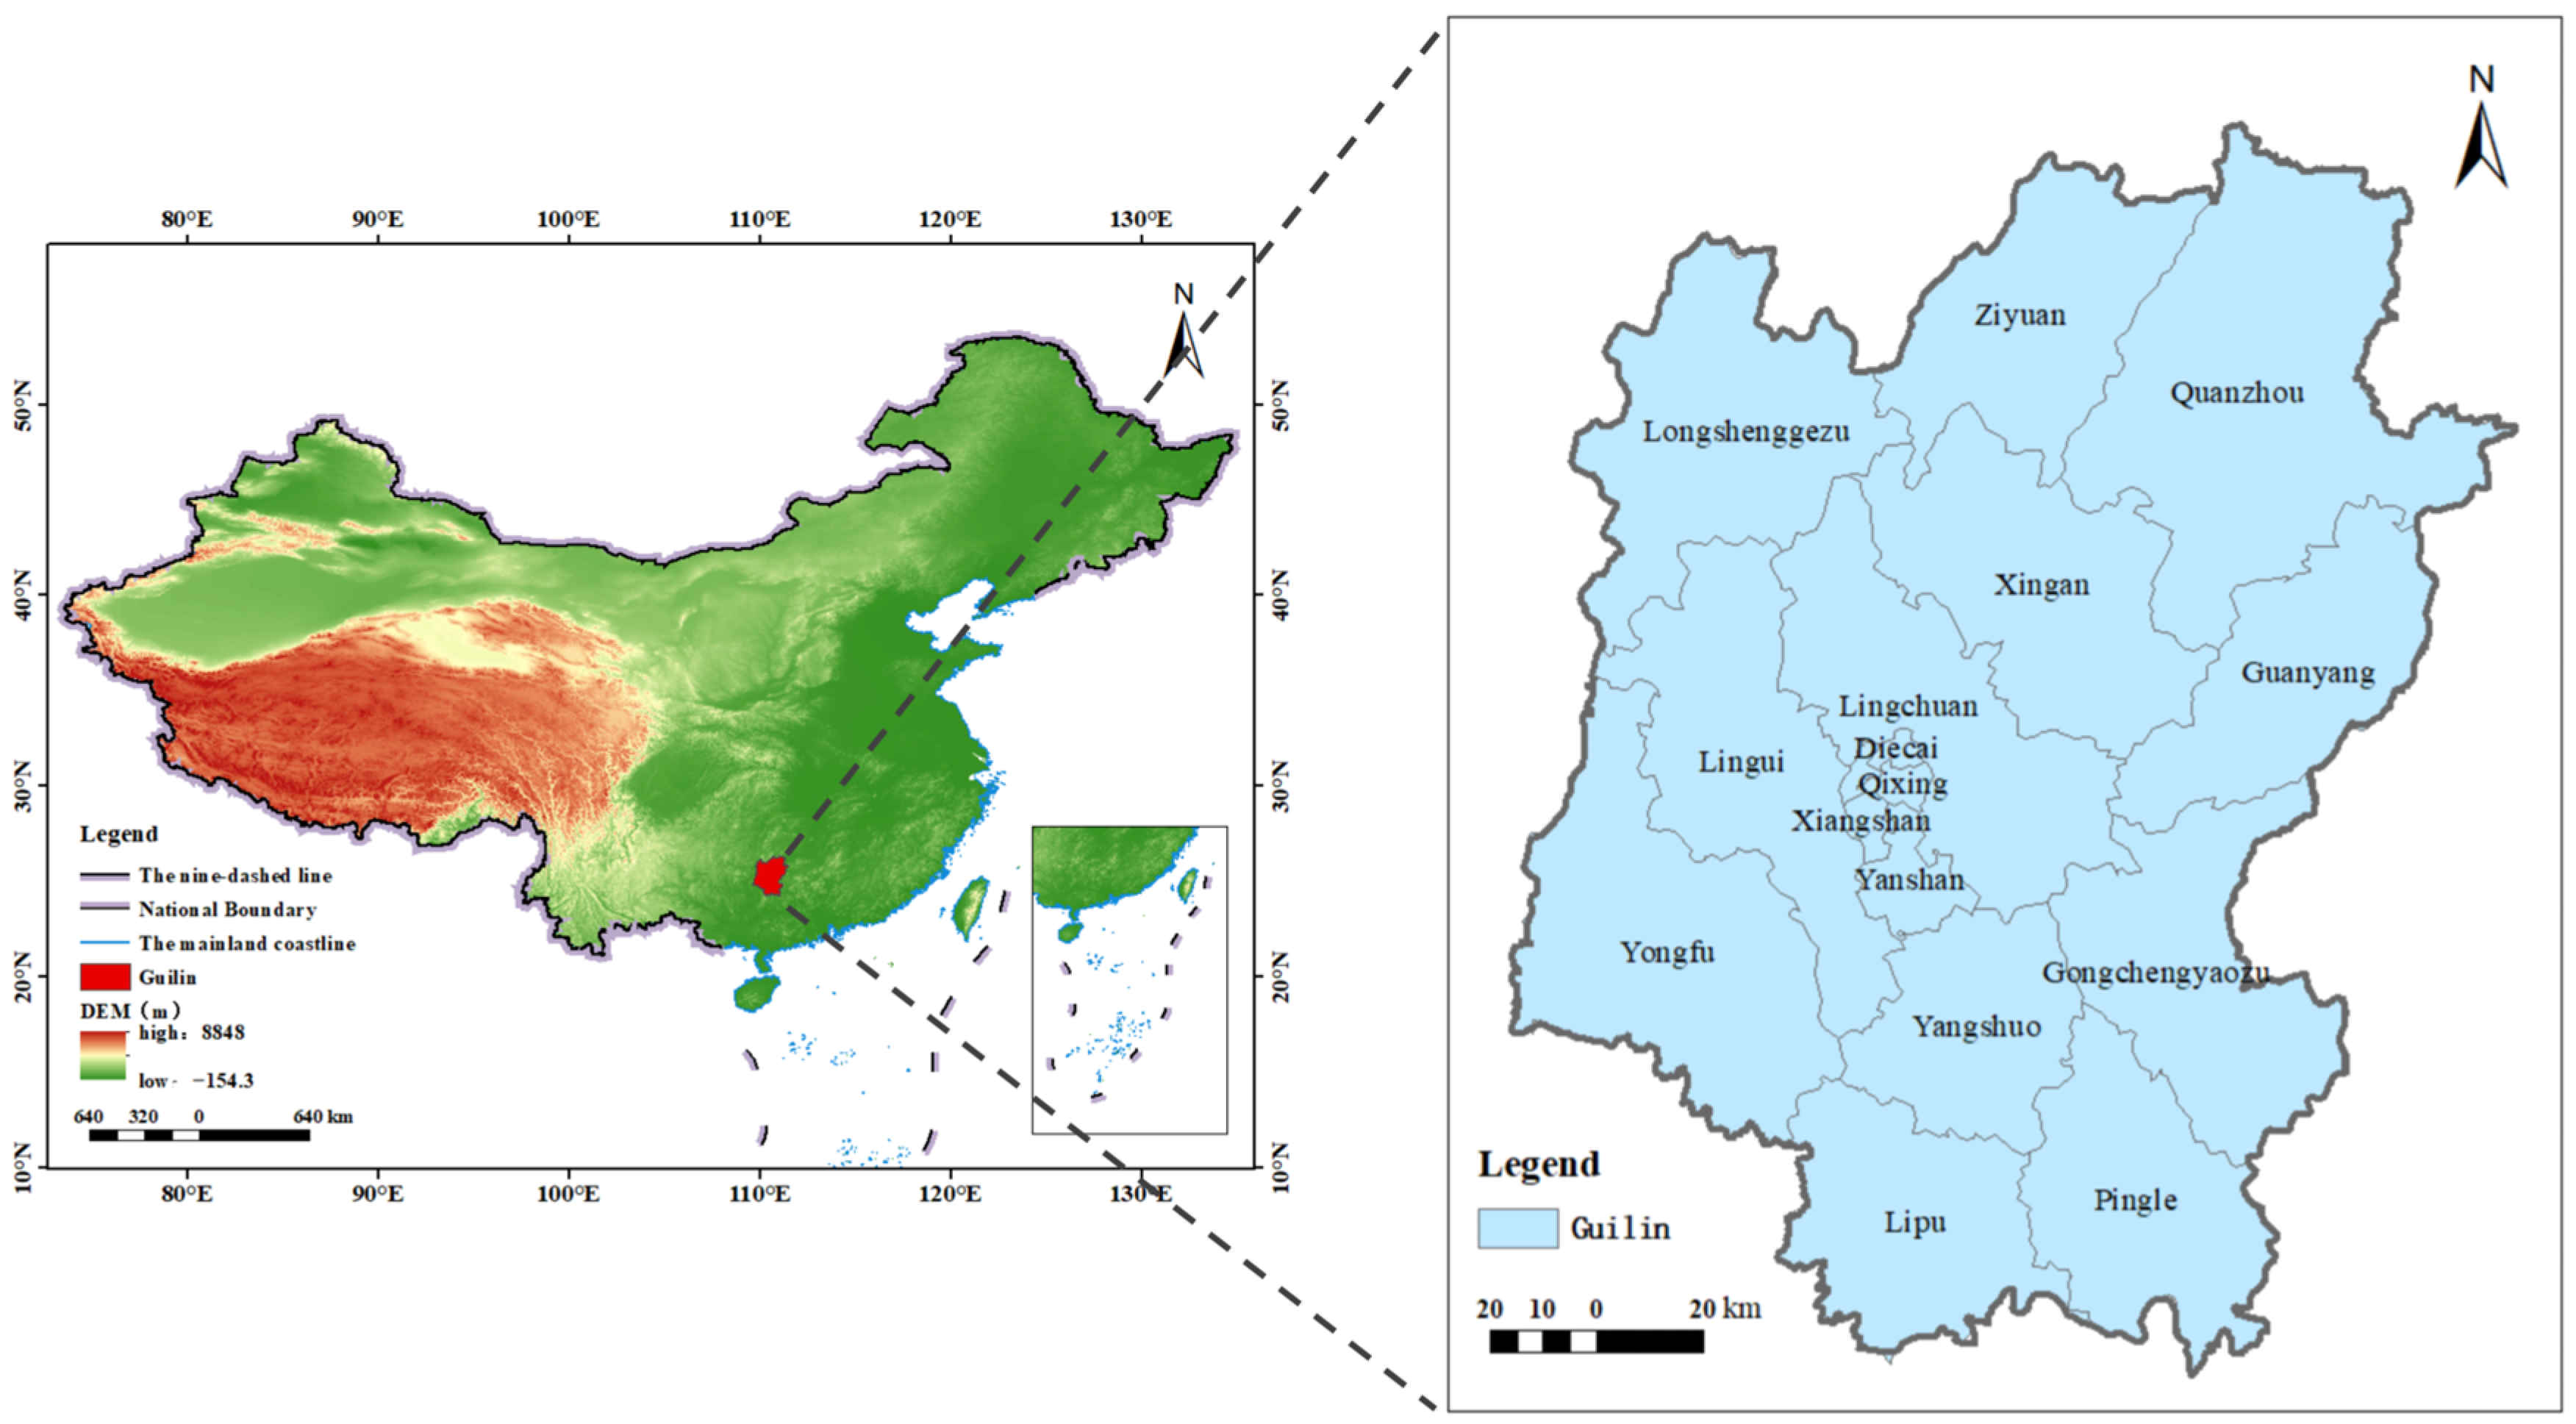
Guilin is located in the northeastern Guangxi Zhuang Autonomous Region, spanning 109°45′ E–104°40′ E and 24°18′ N–25°41′ N, with a total area of approximately 27,800 km2 (Figure 1). The region is characterized by complex topography dominated by typical karst landforms. The terrain slopes from higher elevations in the north to lower elevations in the south, with the Li River flowing north to south through the city. Under a subtropical monsoon climate, Guilin experiences hot and humid summers, with an average annual temperature of 18–19 °C and annual precipitation averaging about 1872 mm. The karst landscape contributes to high surface fragmentation and significant soil erosion risk. In recent years, rapid urbanization and intensified human activities have accelerated the degradation of CL resources. Since 2013 in particular, CL in Guilin has shown declining contiguity, increased patch fragmentation, and scarcity of reserve CL resources, posing serious challenges to socio-economic development and landscape ecological conservation. Against this backdrop, this study selects Guilin as a representative case to reveal the driving mechanisms behind human-induced spatiotemporal changes in CL within complex karst environments. The findings aim to provide a scientific basis and practical reference for the protection and sustainable utilization of CL in KRs.
2.2. Data Sources
- (1)
- Selection of Factors
This study selected influencing factors from both natural and socio-economic dimensions: natural factors include precipitation (PRE), temperature (TEM), elevation (DEM), slope (SLP), aspect (ASP), and Normalized Difference Vegetation Index (NDVI), while socio-economic factors include population (POP) and gross domestic product (GDP). The selection is based on the following rationale: over multi-year to decadal time scales, natural factors such as topography and climate serve as fundamental determinants of land use/cover spatial patterns, forming the baseline environment that constrains land use change. Geomorphological features (e.g., DEM and SLP) not only directly affect the redistribution of soil and hydrological conditions, thereby altering the structure and intensity of land use types, but also interact with climatic factors to shape the evolution of regional land use patterns [41,43,54]. Meteorological factors such as PRE and TEM, which fluctuate frequently over short cycles, are key drivers of CL change [42]: variations in PRE directly affect surface water availability and irrigation conditions, thus influencing the extent of CL that is sensitive to water supply; TEM changes impact crop water demand and growth cycles, thereby indirectly affecting the CL area [54]. The NDVI reflects vegetation coverage and is significantly correlated with the conversion between CL and other land types. From the socio-economic perspective, POP and GDP are key drivers of the spatiotemporal change in CL [6,54]. POP and GDP were selected as they are fundamental, widely used proxies for core anthropogenic pressures. POP growth and economic development not only intensify the pressure of non-agricultural land expansion on CL, but also alter its quality and the overall ecological environment through adjustments in land use structure, resource consumption, and pollutant emissions.
- (2)
- Data Sources and Processing
Land use data for five phases (2000, 2005, 2010, 2015, and 2020) and the average PRE, TEM, POP, and GDP for three phases (2000, 2010, and 2020) were obtained from the Resource and Environment Science and Data Center, Institute of Geographic Sciences and Natural Resources Research, Chinese Academy of Sciences (http://www.resdc.cn) (accessed on 15 July 2024). The spatial resolution of the land use data are 30 m, while the remaining datasets have a spatial resolution of 1 km. DEM data and Landsat 8 remote sensing imagery for 2001, 2011, and 2019 were obtained from the Geospatial Data Cloud platform (http://www.gscloud.cn) (accessed on 15 July 2024), all at 30 m resolution. Based on the DEM data, elevation, SLP, and ASP information for the study area were derived. To ensure high-quality NDVI extraction, Landsat images from 2001, 2011, and 2019 with cloud coverage below 5% were used as substitutes for the originally intended years (2000, 2010, and 2020), which had excessive cloud cover (>30%), and NDVI values for these corresponding time points were calculated accordingly.
2.3. Methodology
- (1)
- Kernel Density Estimation
Kernel density analysis is a commonly used method to assess the spatial distribution of data [61,62], helping to understand the density characteristics and reveal potential spatial patterns and trends [63]. In this study, this method was used to measure the spatial distribution characteristics of CL types, the spatial variation in their locations, and the distance decay characteristics of central intensity. The calculation formula is as follows:
In Equation (1) f(a,b) is the kernel density estimate at location (a,b), indicating the carrying capacity of CL resources per unit area (hm2/km2); n is the number of observations; h is the distance decay threshold (bandwidth); k is the spatial weight function; and is the distance (km) from location (a,b) to the i-th observation point. In this study, the bandwidth used was 20 km and the kernel function was Gaussian.
- (2)
- Dynamic Degree of CL Change
The dynamic degree of CL change quantitatively measures the speed of change in land use resource quantity within a certain area over a specific period [64,65]. The land use change rate can be divided into the single dynamic degree (SDD) and the comprehensive dynamic degree (CDD) [4,66]. In this study, both the SDD and the CDD were used to quantitatively analyze the spatiotemporal dynamics of CL in Guilin, thereby revealing the magnitude of CL changes. The expressions for the SDD (K) and the CDD (LC) are shown in Equations (2) and (3), respectively:
In Equation (2) K is the CL change rate during the study period. and are the quantities of CL at the beginning and end of the study period, respectively; T is the length of the study period. As T in this study is set in years, K represents the annual rate of change in CL in karst mountainous areas.
In Equation (3) LC is the comprehensive land use change rate; is the total area of the i-th land use type at the beginning of the study period; is the absolute value of the area converted from type i to type j; and T is the length of the study period.
- (3)
- Land Use Transfer Matrix
The land use transfer matrix is a mathematical model that describes the transfer characteristics between land use states in different periods [67,68]. In this study, the land use transfer matrix was used to analyze land use transitions during different periods, revealing the conversion relationships between CL and other land use types. Its mathematical expression is as follows:
In Equation (4) represents the state of land use from the beginning (i) to the end (j) of the study period, and n is the number of land use types.
- (4)
- Geographical Detector
The geographical detector is a statistical method commonly used to detect spatial differentiation characteristics of factors and to reveal their underlying driving forces [53]. In this study, the factor detector was used to explore the explanatory power of different factors on the spatial differentiation of CL in Guilin. The explanatory power is measured by the q-value [53], as expressed by:
In Equation (5), the value range of q is [0, 1]; a larger q-value indicates a stronger explanatory power of the influencing factor on the spatial distribution of CL. SSW and SST represent the sum of within-layer variance and the total variance of the whole area, respectively; N is the total number of units in the study area; is the variance of Yin layer h; is the variance of Y in the entire study area; L is the stratification of variable Y or influencing factor X; and is the number of units in layer h. For continuous variables (such as DEM), this study employed the natural breakpoint method to categorize the total amount of cultivated land for each year into 9 levels.
The interaction detector is used to identify the strength of interaction between different influencing factors and their combined explanatory power for the dependent variable. In this study, the interaction detector was applied to explore the effects of pairwise interactions between influencing factors on the spatial differentiation of CL resources. The judgment method is shown in Table 1.
3. Results and Analysis
3.1. Spatiotemporal Distribution Characteristics of CL
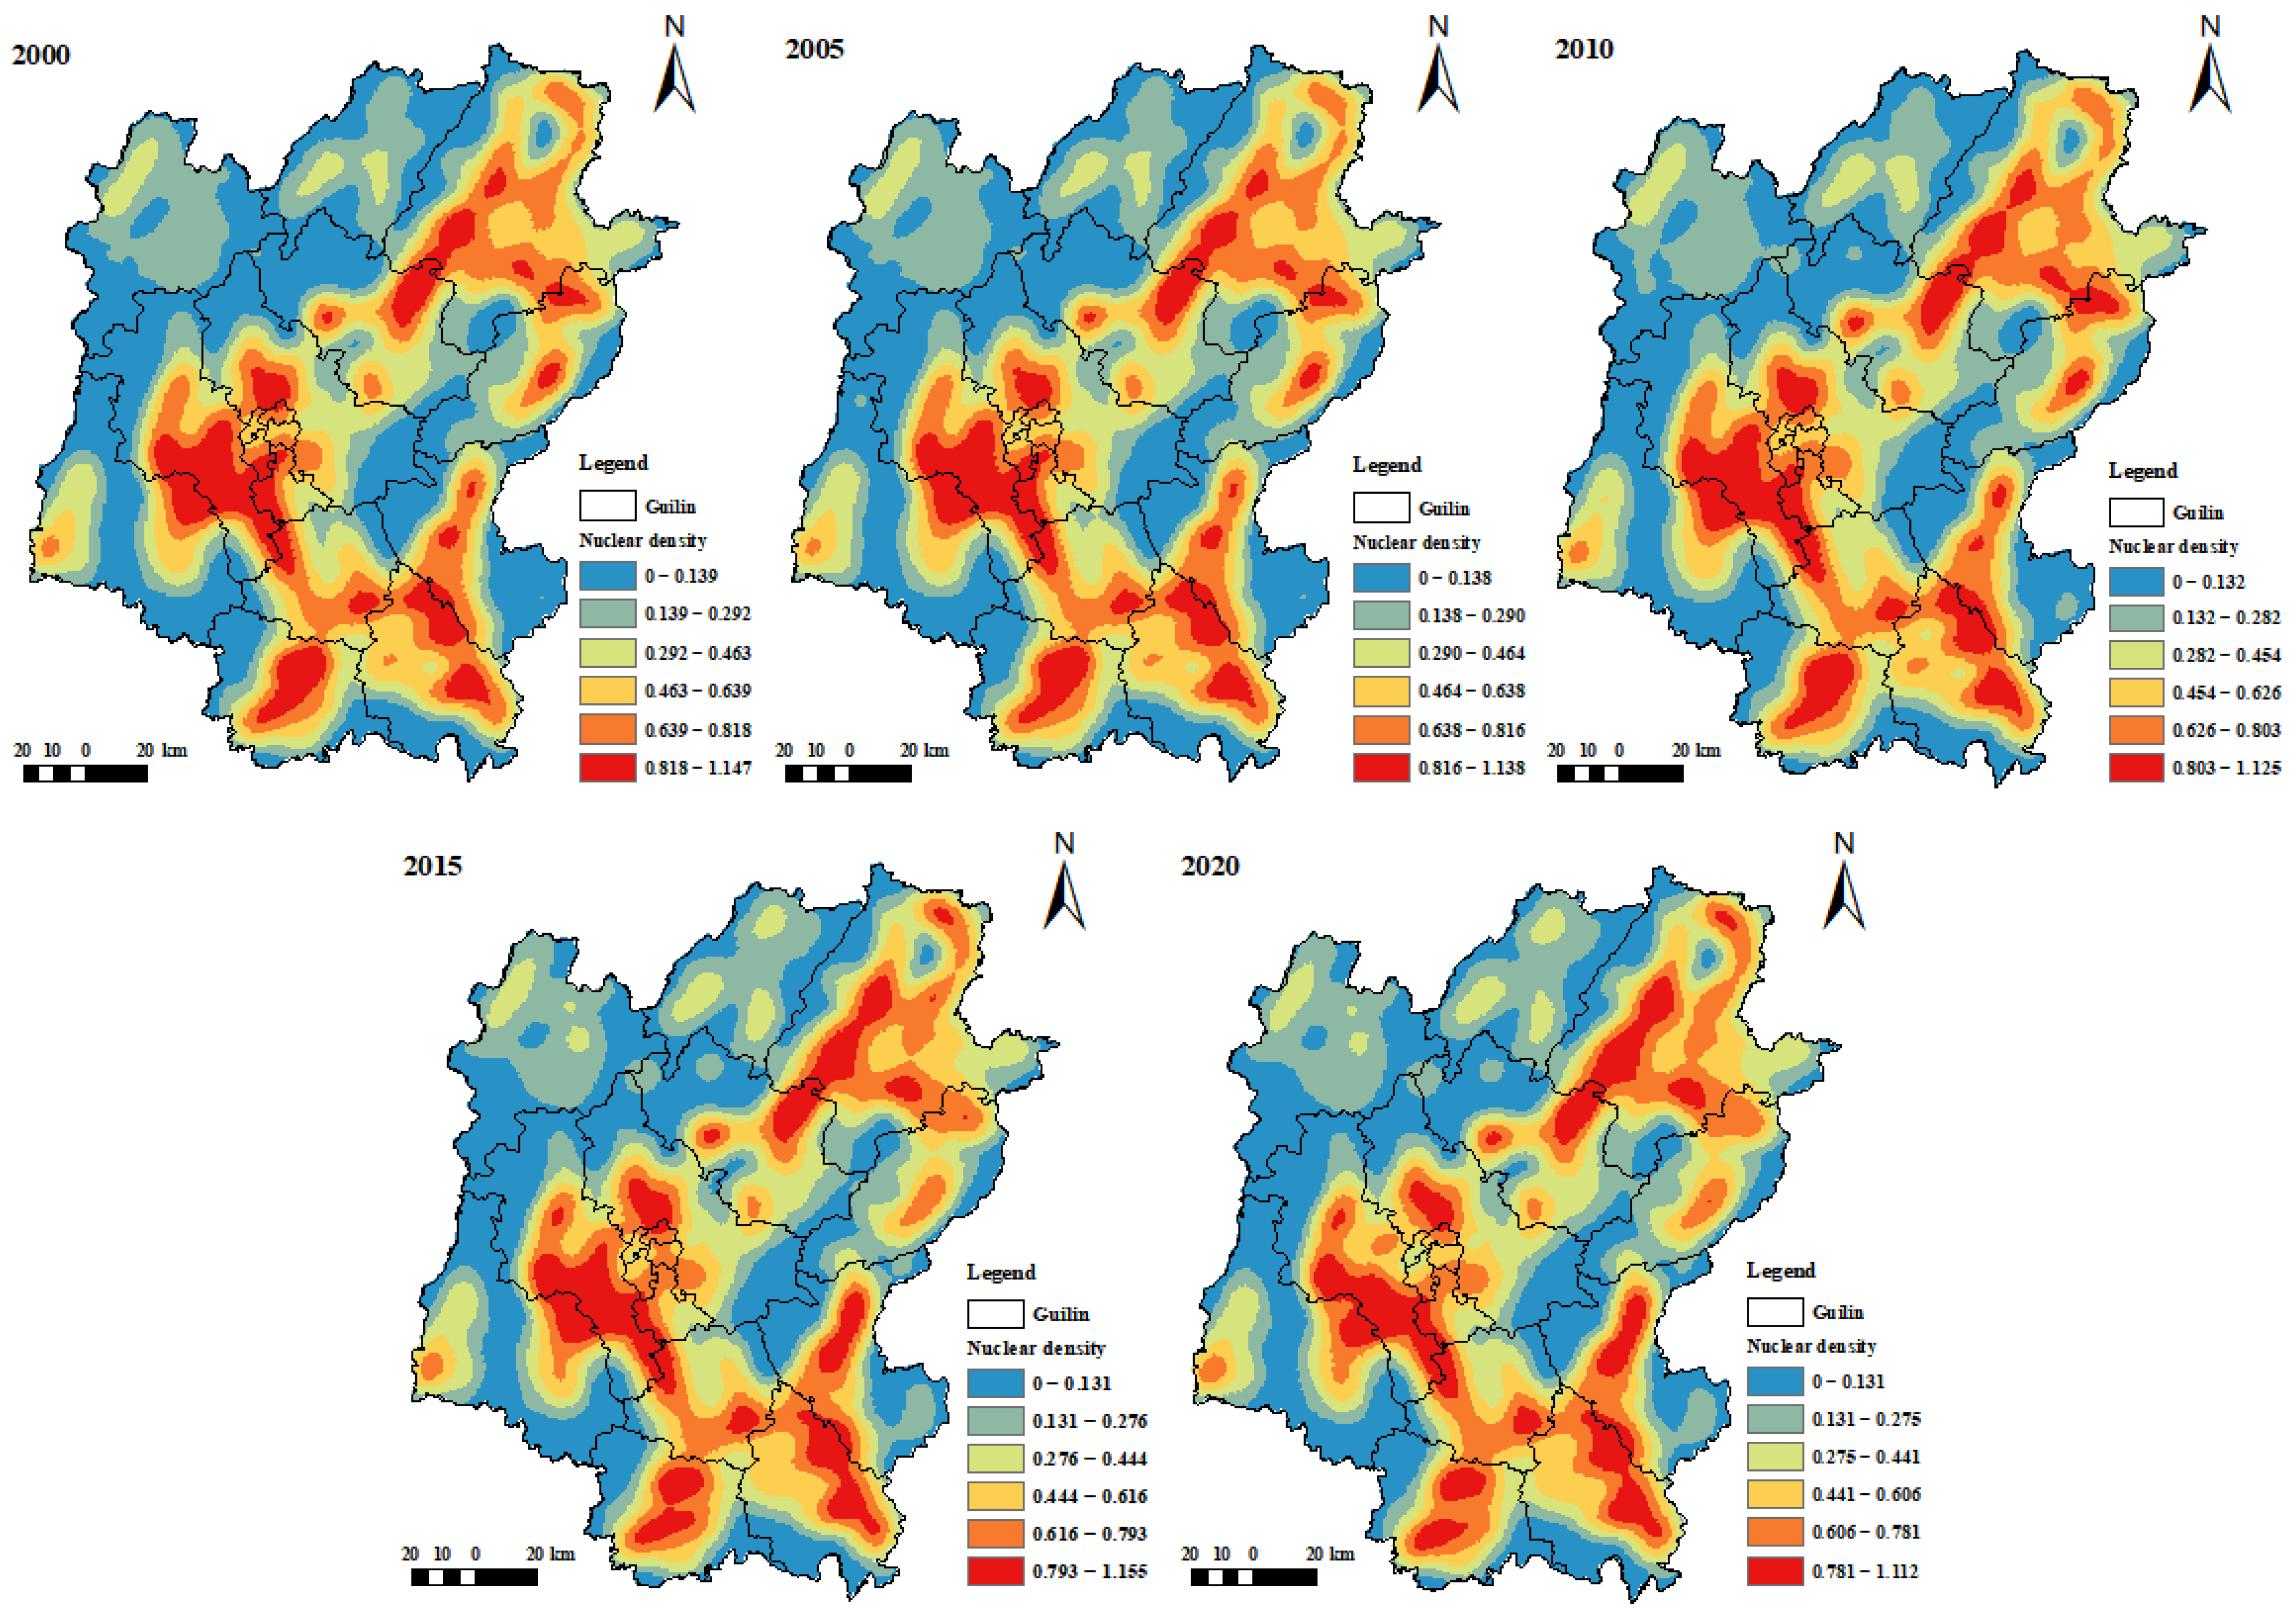
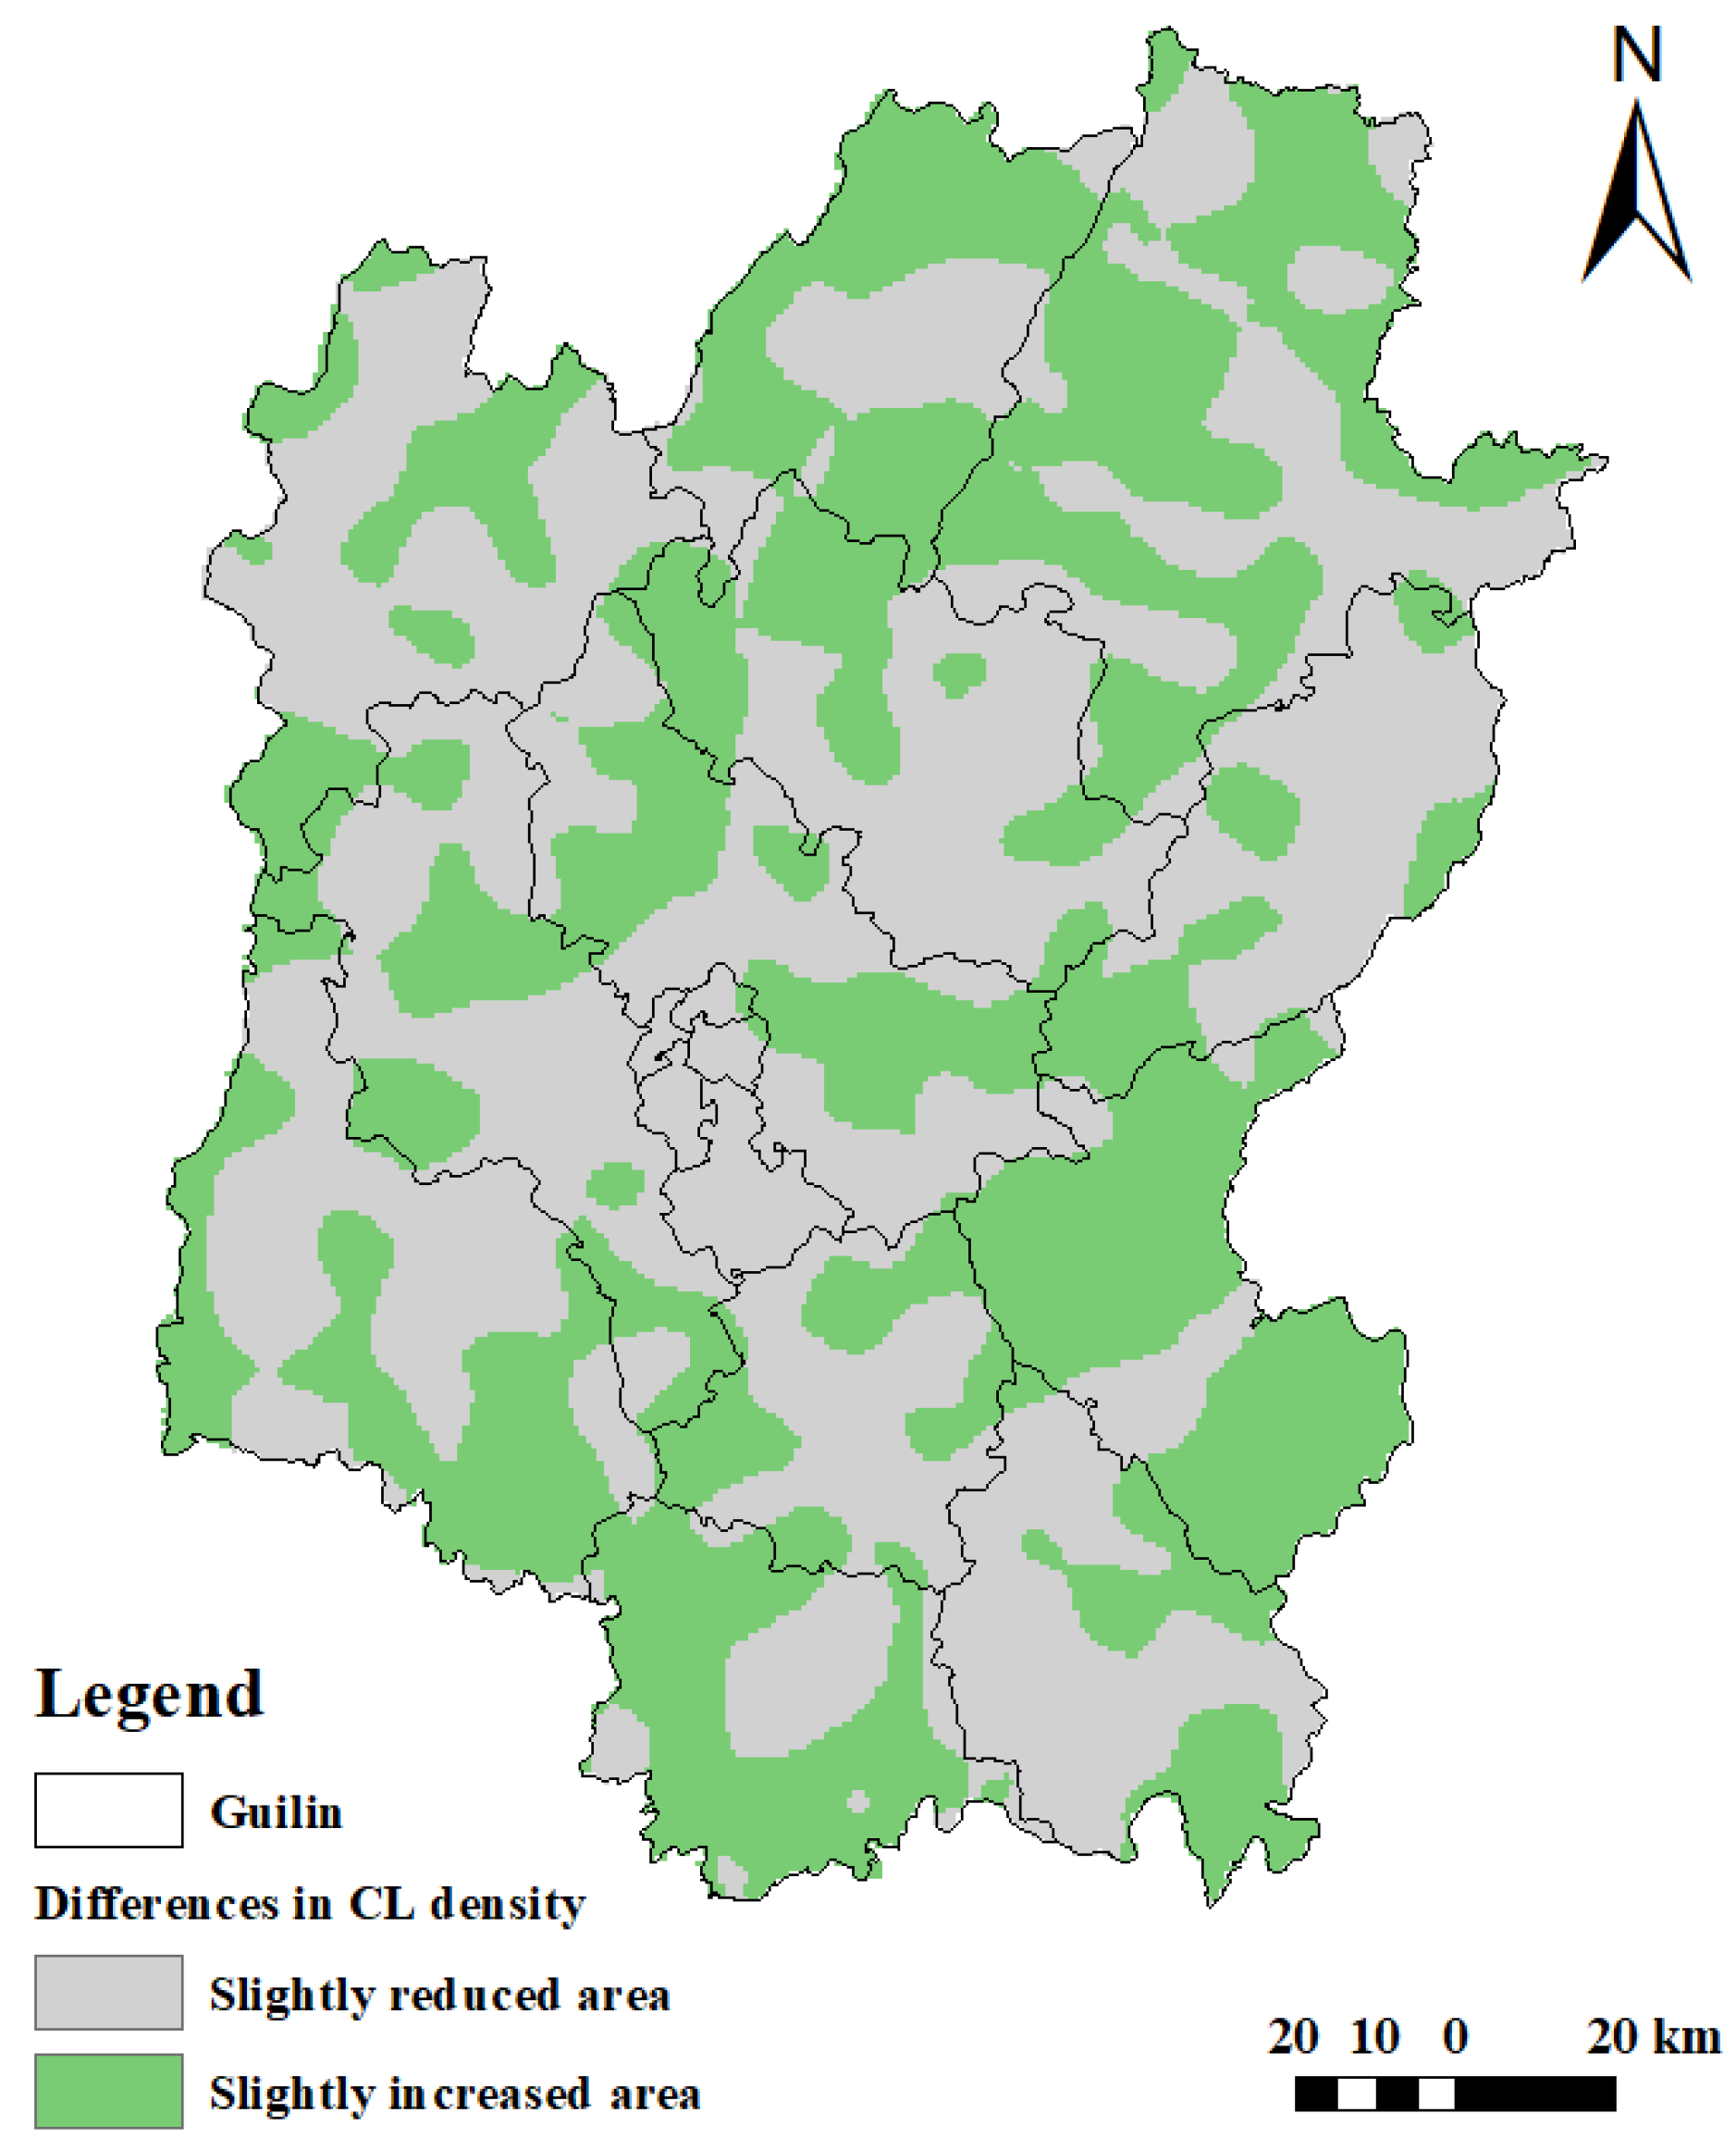
Kernel density estimation reveals that from 2000 to 2020, the spatial distribution of CL density in Guilin consistently exhibited a pattern of higher concentrations in the east and south, and lower in the west and north (Figure 2). Specifically, (1) over the past two decades, the total CL area experienced an overall decline, accompanied by a gradual shrinkage of high-density zones; (2) relatively high-density CL areas were primarily concentrated in the southeastern Lingui District, central Lingchuan County, northwestern Gongcheng Yao Autonomous County, central Quanzhou County, and the southern border of Xing’an County, with the highest densities observed in the northern Xing’an County and southeastern Lingui District (Figure 3).
Spatial overlay analysis of land use data from 2000, 2010, and 2020 was used to construct land use transfer chord diagrams for 2000–2010, 2010–2020, and 2000–2020 (Figure 4). The results show that forest land (64.06%) and CL (19.17%) dominate land use in Guilin. During 2000–2010, grassland and CL underwent the most significant changes after construction land. Grassland decreased at an average annual rate of 28.64 km2 with dynamic degrees of −0.08%, mainly in northeastern Quanzhou County, the border of the Xing’an and Quanzhou counties, and northwestern Lingchuan County regions characterized by complex topography, higher elevation, and fragmented CL. CL loss averaged 18.69 km2 per year (dynamic degree: −0.03%), concentrated in Quanzhou, Xing’an, Yangshuo, and Lingui areas with higher mountainous terrain. In contrast, flatter regions with contiguous CL, such as northwestern Lingui and northwestern Xing’an, experienced minimal change. Construction land expanded notably at an annual rate of 24.20 km2, with a dynamic degree of 0.54%, primarily spreading outward from urban cores (the Qixing, Xiufeng, and Xiangshan districts) into the topographically favorable areas of Lingui, Xing’an, and Quanzhou, driven mainly by economic development and urbanization.
From 2010 to 2020, construction land expansion accelerated markedly, with an average annual increase of 157.02 km2 (dynamic degree: 3.31%). The five urban districts served as cores of expansion, extending into the Quanzhou, Xing’an, and Lipu counties, though karst terrain constraints prevented the formation of strongly clustered patterns. Concurrently, CL and forest land decreased by 86.61 km2/year (−0.16%) and 72.50 km2/year (−0.04%), respectively. Grassland reduction was most evident in the central Lingui District, western Qixing District, southwestern Diecai District, and Xiufeng District, where conversion to construction land was dominant. This reflects the dominant role of rapid economic development and population agglomeration in driving land use pattern changes during this period.
3.2. Analysis of CL Change Dynamics
The SDD of land use types in Guilin varied significantly across periods (Table 2), From 2000 to 2010, CL experienced an SDD of −0.03%, with a net reduction of 18.69 km2. Outflow reached 74.66 km2, mainly to forest land and construction land, reflecting substantial CL occupation due to urbanization. Inflow was 55.98 km2, mainly from forest land, indicating active land conversion.
During 2010–2020, the SDD of CL decreased further to −0.16%. Outflow increased to 154.38 km2, of which 90.38 km2 (a 259.22% increase from the previous period) was converted to construction land. Inflow totaled 132.11 km2, largely from forest land (30.30% increase compared to 2000–2010), resulting in a net decrease of 86.61 km2. These shifts reveal intensified non-agriculturalization and non-grain use of CL.
Over the entire 2000–2020 period, CL decreased by 105.30 km2, with a dynamic degree of −0.20%. Outflow of CL reached 193.62 km2, 57.51% of which was converted to construction land, while inflow was 103.61 km2, mainly from forest land (56.21%). Construction land expansion radiated from urban districts into flat, water-rich, and CL-concentrated areas such as Quanzhou County, Xing’an County, and Guanyang County.
The transfer chord diagram (Figure 4) and Table 2 show that mutual conversion between CL and forest land was relatively balanced, yet CL served as the primary source for construction land expansion. Influenced by karst terrain, CL in Guilin is highly fragmented with poor spatial continuity. The CDD (comprehensive dynamic degree) increased from 0.01% (2000–2010) to 0.03% (2010–2020) and 0.04% (2000–2020), indicating intensifying land use changes over time.
3.3. Characteristics of Driving Factor Changes
3.3.1. Variation in Single-Factor q Values
The dominant factors influencing the spatiotemporal variation in CL in different regions of Guilin were determined based on the magnitude of their q values (Table 3). The results indicate that the influence of different driving factors on the spatial differentiation of CL showed little change over time. In 2000, 2010, and 2020, DEM consistently exhibited the highest q value, followed by TEM and NDVI, while ASP had the lowest q value.
Table 3.
Variables and indicators of the geographic detector in Guilin in 2000, 2010, and 2020 (q is the degree of influence of the influencing factors on the temporal and spatial distribution of CL; p is the significance level).
In 2000, DEM and TEM had the strongest explanatory power for spatial heterogeneity of CL, with q values exceeding 0.40, whereas socio-economic factors such as POP (0.262) and GDP (0.199) had q values significantly lower than those of natural factors. PRE and ASP had relatively small q values, 0.47 and 0.39, respectively. By 2010, the influence of TEM increased by 13.47% compared to 2000, and the q value of GDP increased by 32.16%, with other social factors such as POP also showing improved explanatory power.
The influence of different factors exhibited certain temporal variation patterns. The q values of TEM and NDVI increased during 2000–2010, reaching a peak in 2010, and then decreased slightly by 2020. SLP and ASP showed slight upward and downward trends, respectively, during 2010–2020. From 2000 to 2020, the q value of GDP continued to rise, whereas the q values of DEM, POP, and PRE remained relatively stable.
3.3.2. Variation in Interaction-Factor q Values
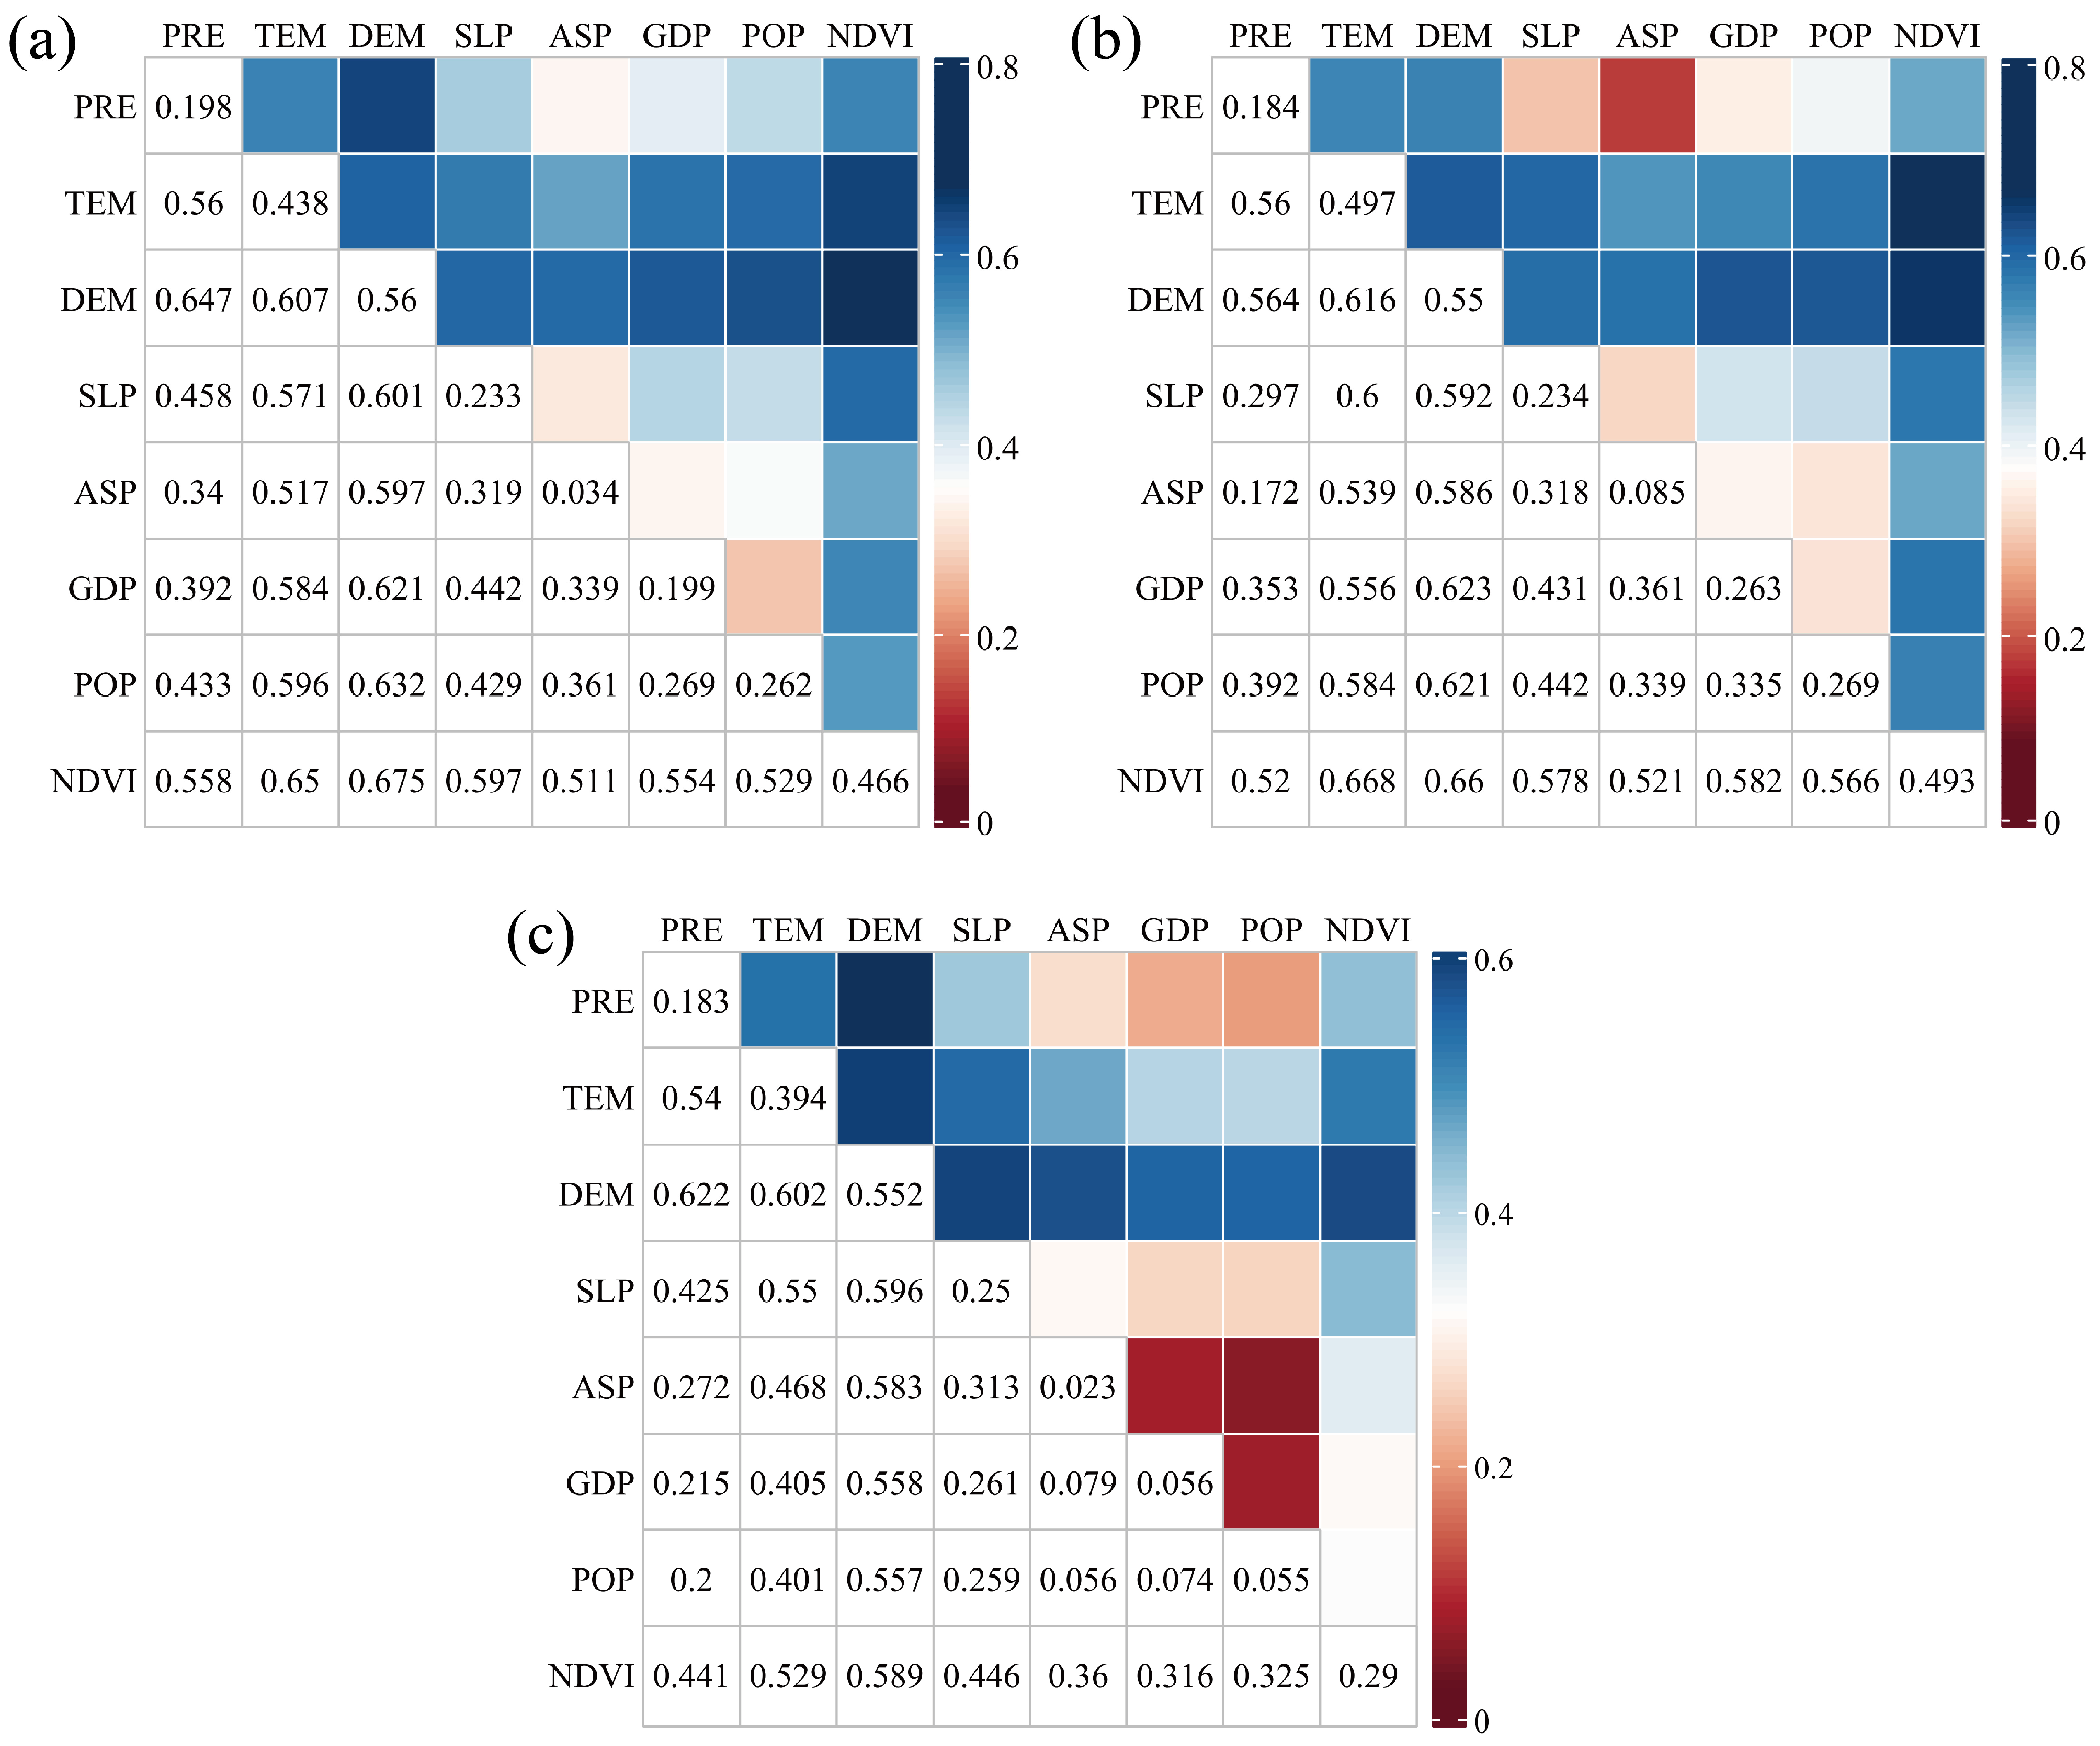
According to the interaction-factor detection results in 2000, 2010, and 2020 (Figure 5), the interactions between different factors in all three years exhibited either double-factor enhancement or nonlinear enhancement. In terms of q values of interaction factors, high q values were observed for interactions such as DEM∩NDVI, DEM∩TEM, DEM∩PRE, NDVI∩TEM, NDVI∩DEM, GDP∩DEM, and POP∩DEM across the three years. As shown in Figure 4 and Figure 5, although ASP as a single factor had the lowest explanatory power for CL distribution, its q value increased significantly when interacting with other factors, with the largest enhancement among all factors. PRE, while not a dominant factor affecting changes in CL quantity, also exhibited q values exceeding 0.40 when interacting with other factors. During 2000–2010, the interactive influence of GDP with other factors strengthened, making it an important driver of changes in CL quantity. However, since 2010, the overall interactive effects among driving factors have shown a declining trend, especially for socio-economic factors such as GDP and POP, whose interactive influence with other factors decreased the most. In this period, the explanatory power of interactions between natural factors (e.g., DEM, TEM) and other factors was generally higher than that of interactions between socio-economic factors (e.g., GDP, POP) and other factors.
3.3.3. Sensitivity Analysis of Driving Factors
To assess the sensitivity of various factors affecting CL changes in Guilin across different years, this study constructed a sensitivity model. The model calculates the difference between the q value of the two-factor interaction and that of the single factor and then accumulates these differences. A larger cumulative q value indicates that the factor is more sensitive to interactions, serving as a sensitivity factor. Figure 6 presents the results of this analysis. Each row in the figures represents the q value change in a factor, i.e., the difference between its q value after interaction with other factors and its individual q value. Each column represents the cumulative differences in one factor interacting with all other factors relative to its individual q value.
In the single factor explanatory analysis (Table 3), DEM had the highest q value, indicating it was the dominant factor influencing CL changes. However, after interacting with other factors, the cumulative q values of all factors were relatively small, suggesting that while DEM is a primary driver of CL change, it is not highly sensitive. In contrast, PRE and ASP, despite their relatively low individual q values across 2000, 2010, and 2020, exhibited the largest cumulative changes when interacting with other factors. This indicates that PRE and SLP can rapidly amplify the effects of other factors, making them the most sensitive factors affecting CL changes in Guilin.
During 2010–2020, the cumulative q values of interactions involving socio-economic factors such as GDP and POP increased annually, indicating a significant rise in sensitivity. As shown in Table 2 and Figure 6, over the past decade, the interaction of socio-economic changes and policy-driven human interventions has significantly shaped land use patterns. Rapid socio-economic development, urbanization, and the migration of rural labor to urban areas have reduced rural dependence on CL, promoting its conversion to construction land and forests. This demonstrates that human activities can alter land use structures and influence the flow of CL. Therefore, in the context of urbanization and economic development, it is essential to balance land expansion with the protection of CL.
4. Discussion
This study quantifies the multi-dimensional drivers of CL evolution in Guilin from 2000 to 2020, highlighting the independent and interactive effects of natural and socio-economic factors over time. The results provide an empirical basis for understanding human–land system coupling in KRs. The spatiotemporal changes in CL demonstrate a multi-level driving mechanism characterized by natural baseline constraints, human activity response, and policy feedback. The evolution process is not only shaped by karst topography but also increasingly influenced by urbanization and agricultural policy adjustments.
From the perspective of single-factor effects, DEM and TEM consistently remained the dominant natural factors influencing the spatial differentiation of CL, with q-values exceeding 0.39 in all periods, significantly higher than those of socio-economic factors. This result highlights the high dependence of CL distribution in KRs on topography and climate: complex geomorphic patterns limit the spatial expansion of CL resources, while temperature conditions directly affect crop growth cycles and farming systems. It is worth noting that although urbanization in Guilin accelerated, the explanatory power of POP and GDP factors in 2000 was relatively low (with q-values of 0.262 and 0.199, respectively), indicating that natural conditions remained the fundamental controlling factors in the early stage. This phenomenon is closely related to the inherent vulnerability of the environmental carrying capacity in KRs (steep slope cultivation easily triggers rocky desertification), so human activities in the early stage were still significantly constrained by the natural baseline.
However, over time, the influence of socio-economic factors increased significantly. The q-value of GDP in 2010 rose by 32.16% compared to 2000, and by 2020 its explanatory power was second only to elevation and temperature, indicating that urbanization, non-agricultural industrial development, and land development activities gradually became significant drivers of CL loss. This shift aligns closely with Guilin’s development orientation as an international tourist city and regional transportation hub. The large-scale construction of airports, high-speed rail stations, and tourism facilities has continuously occupied upon high-quality CL in suburban areas [69]. At the same time, the implementation of the Grain for Green policy has promoted the conversion of marginal CL (steep slopes and fragmented plots) into ecological land, reflecting a transition in the function of CL from singular production to a multiple value system integrating ecological–economic–social dimensions.
In terms of factor interactions, the study identified significant enhancement effects and sensitive factors. Although elevation and temperature had the strongest independent explanatory power, PRE and ASP exhibited high sensitivity in interactive effects. When combined with other factors, these two factors showed the greatest increase in q-values, indicating that they act as catalytic factors that significantly amplify the effects of other drivers. For example, the combination of precipitation and steep slopes easily exacerbates soil erosion, while the overlay of aspect and urbanization significantly alters the transformation pathways of CL. On the other hand, the interactive q-values between GDP and factors such as DEM and TEM all exceeded 0.40 during 2010–2020, further confirming that human activities are reshaping natural constraints; through engineering technologies (e.g., terrace transformation, irrigation facilities) and policy interventions (e.g., ecological compensation), some areas have overcome topographic and climatic limitations, but excessive development may also amplify ecological risks.
It is noteworthy that although the influence of socio-economic factors has increased, the core role of natural factors has not been fundamentally altered. KRs are ecologically sensitive, and once human activities exceed environmental carrying capacity, they can easily trigger irreversible degradation processes. Therefore, changes in CL are ultimately the result of complex feedback between natural and social systems: the natural baseline determines the fundamental pattern and sensitive areas of CL use, while human activities modulate the intensity and direction of changes by altering land use patterns.
Based on the spatiotemporal evolution and driving mechanisms of CL in Guilin, the following two policy recommendations are proposed to enhance sustainable use and protection in KR: First, adopt differentiated protection and adaptive utilization strategies based on dominant natural factors such as elevation and TEM. In low-elevation areas, prioritize ecological agriculture while improving soil and water conservation; in mid-to-high-elevation areas, promote forest and grassland restoration as well as characteristic agroforestry to strengthen ecosystem stability. Second, utilize highly sensitive factors like precipitation and aspect as key regulators in ecological governance. In high-precipitation zones, enhance slope water management and build resilience against droughts and floods; adapt irrigation systems and crop types according to slope aspect to maximize land productivity and reduce ecological risks under climate change and human pressure.
This study also has several limitations: First, the spatial resolution of socio-economic data (1 km) does not match that of the land use data (30 m), which may affect the accurate identification of factor effects at local scales. Additionally, due to cloud cover, substitute images were used for some years, and although corresponding processing was applied, this may still introduce a certain degree of error. Furthermore, the depth of mechanistic analysis is somewhat insufficient. While this study clarified the influence and interactive effects of various factors, it did not employ dynamic models (such as system dynamics or agent-based models) to further reveal the causal feedback and long-term process mechanisms among factors. Future studies should focus on addressing these shortcomings.
5. Conclusions
Based on multi-temporal land use data from 2000 to 2020, this study applied a geographical detector, landscape pattern indices, and GIS spatial analysis to systematically examine the spatiotemporal evolution and driving mechanisms of CL in Guilin, a typical KR. The main findings are as follows:
- (1)
- CL continued to decrease in area with reduced spatial aggregation. Over the study period, the total CL area in Guilin decreased by 105.30 km2, with an annual change rate of −0.20%. Spatially, CL showed a general pattern of more in the southeast, less in the northwest, but the extent of high-density areas shrank significantly and fragmentation intensified. The loss was mainly due to conversion to construction land and forest land, particularly during 2010–2020.
- (2)
- Natural factors were the dominant drivers, while socio-economic influences increased. DEM and TEM were the most influential factors, with q-values consistently above 0.40, highlighting the rigid constraints of topography and climate on CL in KRs. At the same time, the impact of socio-economic factors grew continually: the q-value of GDP increased by 32.16% from 2010 to 2020, indicating a strengthening role of urbanization and industrialization in the loss of CL.
- (3)
- Factor interactions showed significant nonlinear enhancement. Although PRE and ASP had limited independent explanatory power, they were highly sensitive in interactions and markedly amplified the effects of other factors. The loss of CL reflected a dual pathway of non-agriculturalization and ecologicalization, signaling a functional shift from singular agricultural production to a multi-dimensional ecological–economic–social system. Under the dual pressures of economic development and ecological conservation, there is an urgent need to establish more refined and systematic mechanisms for CL protection and sustainable use.
The above results can provide scientific reference for the protection and rational utilization of CL resources in KRs.
Author Contributions
Conceptualization, S.Z. and T.L.; methodology, H.J.; software, Y.R.; validation, S.Z., H.J. and Y.R.; data curation, T.L.; writing—original draft preparation, S.Z. and H.J.; writing—review and editing, F.W. and Y.R.; visualization, S.Z.; supervision, F.W. and Y.R.; project administration, F.W. and Y.R.; funding acquisition, F.W. All authors have read and agreed to the published version of the manuscript.
Funding
This study was funded by the Guangxi science and technology base and talent special project (GuiKeAD23026194, GuiKeAD23026055), the Open Fund of Key Laboratory of Coastal Science and Integrated Management, Ministry of Natural Resources (2024COSIM01), the Open Fund of key Laboratory for Earth Surface Processes, Ministry of Education, and the Guangxi Higher Education Undergraduate Teaching Reform Project (2025JGB142).
Data Availability Statement
The original contributions presented in this study are included in the article. Further inquiries can be directed to the corresponding authors.
Conflicts of Interest
The authors declare no conflicts of interest.
Abbreviations
The following abbreviations are used in this manuscript:
ASP | Aspect |
CDD | Comprehensive Dynamic Degree |
CL | Cultivated Land |
DEM | Elevation |
GDP | Gross Domestic Product |
KR | Karst Regions |
POP | Population |
PRE | Precipitation |
SDD | Single Dynamic Degree |
SLP | Slope |
TEM | Temperature |
References
- Schmidhuber, J.; Tubiello, F.N. Global food security under climate change. Proc. Natl. Acad. Sci. USA 2007, 104, 19703–19708. [Google Scholar] [CrossRef]
- Rockström, J.; Williams, J.; Daily, G.; Noble, A.; Matthews, N.; Gordon, L.; Wetterstrand, H.; DeClerck, F.; Shah, M.; Steduto, P. Sustainable intensification of agriculture for human prosperity and global sustainability. Ambio 2017, 46, 4–17. [Google Scholar] [CrossRef] [PubMed]
- Zhou, Y.; Li, X.; Liu, Y. Cultivated land protection and rational use in China. Land Use Policy 2021, 106, 105454. [Google Scholar] [CrossRef]
- Liu, J.; Kuang, W.; Zhang, Z.; Xu, X.; Qin, Y.; Ning, J.; Zhou, W.; Zhang, S.; Li, R.; Yan, C. Spatiotemporal characteristics, patterns, and causes of land-use changes in China since the late 1980s. J. Geogr. Sci. 2014, 24, 195–210. [Google Scholar] [CrossRef]
- Zhou, B.-B.; Aggarwal, R.; Wu, J.; Lv, L. Urbanization-associated farmland loss: A macro-micro comparative study in China. Land Use Policy 2021, 101, 105228. [Google Scholar] [CrossRef]
- Guo, A.; Yue, W.; Yang, J.; Xue, B.; Xiao, W.; Li, M.; He, T.; Zhang, M.; Jin, X.; Zhou, Q. Cropland abandonment in China: Patterns, drivers, and implications for food security. J. Clean. Prod. 2023, 418, 138154. [Google Scholar] [CrossRef]
- He, T.; Jiang, S.; Xiao, W.; Zhang, M.; Tang, T.; Zhang, H. A non-grain production on cropland spatiotemporal change detection method based on Landsat time-series data. Land Degrad. Dev. 2024, 35, 3031–3047. [Google Scholar] [CrossRef]
- Zhang, Y.; Li, X.; Song, W.; Zhai, L. Land abandonment under rural restructuring in China explained from a cost-benefit perspective. J. Rural Stud. 2016, 47, 524–532. [Google Scholar] [CrossRef]
- Li, H.; Wu, Y.; Huang, X.; Sloan, M.; Skitmore, M. Spatial-temporal evolution and classification of marginalization of cultivated land in the process of urbanization. Habitat Int. 2017, 61, 1–8. [Google Scholar] [CrossRef]
- Shao, Y.; Jiang, Q.O.; Wang, C.; Wang, M.; Xiao, L.; Qi, Y. Analysis of critical land degradation and development processes and their driving mechanism in the Heihe River Basin. Sci. Total Environ. 2020, 716, 137082. [Google Scholar] [CrossRef] [PubMed]
- Fang, C.; Liu, H.; Wang, S. The coupling curve between urbanization and the eco-environment: China’s urban agglomeration as a case study. Ecol. Indic. 2021, 130, 108107. [Google Scholar] [CrossRef]
- Jiang, Z.; Lian, Y.; Qin, X. Rocky desertification in Southwest China: Impacts, causes, and restoration. Earth-Sci. Rev. 2014, 132, 1–12. [Google Scholar] [CrossRef]
- Wang, K.; Zhang, C.; Chen, H.; Yue, Y.; Zhang, W.; Zhang, M.; Qi, X.; Fu, Z. Karst landscapes of China: Patterns, ecosystem processes and services. Landsc. Ecol. 2019, 34, 2743–2763. [Google Scholar] [CrossRef]
- Zhang, W.; Qie, R. Spatiotemporal change of cultivated land in China during 2000–2020. PLoS ONE 2024, 19, e0293082. [Google Scholar] [CrossRef] [PubMed]
- Wang, J.; Wang, S.; Zhou, C. Quantifying embodied cultivated land-use change and its socioeconomic driving forces in China. Appl. Geogr. 2021, 137, 102601. [Google Scholar] [CrossRef]
- Wang, G.; Liu, Y.; Li, Y.; Chen, Y. Dynamic trends and driving forces of land use intensification of cultivated land in China. J. Geogr. Sci. 2015, 25, 45–57. [Google Scholar] [CrossRef]
- Foley, J.A.; Ramankutty, N.; Brauman, K.A.; Cassidy, E.S.; Gerber, J.S.; Johnston, M.; Mueller, N.D.; O’Connell, C.; Ray, D.K.; West, P.C. Solutions for a cultivated planet. Nature 2011, 478, 337–342. [Google Scholar] [CrossRef]
- Deng, X.; Huang, J.; Rozelle, S.; Zhang, J.; Li, Z. Impact of urbanization on cultivated land changes in China. Land Use Policy 2015, 45, 1–7. [Google Scholar] [CrossRef]
- Newbold, T.; Hudson, L.N.; Hill, S.L.; Contu, S.; Lysenko, I.; Senior, R.A.; Börger, L.; Bennett, D.J.; Choimes, A.; Collen, B. Global effects of land use on local terrestrial biodiversity. Nature 2015, 520, 45–50. [Google Scholar] [CrossRef]
- de Graaff, M.-A.; Hornslein, N.; Throop, H.L.; Kardol, P.; van Diepen, L.T. Effects of agricultural intensification on soil biodiversity and implications for ecosystem functioning: A meta-analysis. Adv. Agron. 2019, 155, 1–44. [Google Scholar]
- Ge, D.; Long, H.; Zhang, Y.; Ma, L.; Li, T. Farmland transition and its influences on grain production in China. Land Use Policy 2018, 70, 94–105. [Google Scholar] [CrossRef]
- Lichtenberg, E.; Ding, C. Assessing farmland protection policy in China. Land Use Policy 2008, 25, 59–68. [Google Scholar] [CrossRef]
- Li, M. The effect of land use regulations on farmland protection and non-agricultural land conversions in China. Aust. J. Agric. Resour. Econ. 2019, 63, 643–667. [Google Scholar] [CrossRef]
- Chen, Y.; Li, X.; Tian, Y.; Tan, M. Structural change of agricultural land use intensity and its regional disparity in China. J. Geogr. Sci. 2009, 19, 545–556. [Google Scholar] [CrossRef]
- Yu, X.; Wang, Q.; Tian, M.; Ji, A. Exploring the Impact of Cultivated Land Utilization Green Transformation on Agricultural Economic Growth: Evidence from Jiangsu Province in China. Sustainability 2024, 16, 7032. [Google Scholar] [CrossRef]
- Bajocco, S.; De Angelis, A.; Perini, L.; Ferrara, A.; Salvati, L. The impact of land use/land cover changes on land degradation dynamics: A Mediterranean case study. Environ. Manag. 2012, 49, 980–989. [Google Scholar] [CrossRef] [PubMed]
- Ruiz, I.; Sanz-Sánchez, M.J. Effects of historical land-use change in the Mediterranean environment. Sci. Total Environ. 2020, 732, 139315. [Google Scholar] [CrossRef]
- Lark, T.J.; Spawn, S.A.; Bougie, M.; Gibbs, H.K. Cropland expansion in the United States produces marginal yields at high costs to wildlife. Nat. Commun. 2020, 11, 4295. [Google Scholar] [CrossRef]
- Fudge, R.; Lovdal, A.; Zimmerman, E.; Kushner, L.; Grossman, J. Environmental outcomes of landscape-scale agricultural transitions in the Upper Midwestern US. Front. Sustain. Food Syst. 2025, 9, 1499410. [Google Scholar] [CrossRef]
- Schmitz, C.; Kreidenweis, U.; Lotze-Campen, H.; Popp, A.; Krause, M.; Dietrich, J.P.; Müller, C. Agricultural trade and tropical deforestation: Interactions and related policy options. Reg. Environ. Change 2015, 15, 1757–1772. [Google Scholar] [CrossRef]
- Othman, J. Linking agricultural trade, land demand, and environmental externalities: Case of oil palm in Southeast Asia. ASEAN Econ. Bull. 2003, 20, 244–255. [Google Scholar] [CrossRef]
- Tovar, C.; Seijmonsbergen, A.C.; Duivenvoorden, J.F. Monitoring land use and land cover change in mountain regions: An example in the Jalca grasslands of the Peruvian Andes. Landsc. Urban Plan. 2013, 112, 40–49. [Google Scholar] [CrossRef]
- Brandt, J.S.; Townsend, P.A. Land use–land cover conversion, regeneration and degradation in the high elevation Bolivian Andes. Landsc. Ecol. 2006, 21, 607–623. [Google Scholar] [CrossRef]
- Potapov, P.; Turubanova, S.; Hansen, M.C.; Tyukavina, A.; Zalles, V.; Khan, A.; Song, X.-P.; Pickens, A.; Shen, Q.; Cortez, J. Global maps of cropland extent and change show accelerated cropland expansion in the twenty-first century. Nat. Food 2022, 3, 19–28. [Google Scholar] [CrossRef]
- Fritz, S.; See, L.; Perger, C.; McCallum, I.; Schill, C.; Schepaschenko, D.; Duerauer, M.; Karner, M.; Dresel, C.; Laso-Bayas, J.-C. A global dataset of crowdsourced land cover and land use reference data. Sci. Data 2017, 4, 1–8. [Google Scholar] [CrossRef]
- Keenleyside, C.; Tucker, G.; McConville, A. Farmland Abandonment in the EU: An Assessment of Trends and Prospects; Institute for European Environmental Policy: London, UK, 2010. [Google Scholar]
- Prishchepov, A.V.; Müller, D.; Dubinin, M.; Baumann, M.; Radeloff, V.C. Determinants of agricultural land abandonment in post-Soviet European Russia. Land Use Policy 2013, 30, 873–884. [Google Scholar] [CrossRef]
- Lark, T.J.; Hendricks, N.P.; Smith, A.; Pates, N.; Spawn-Lee, S.A.; Bougie, M.; Booth, E.G.; Kucharik, C.J.; Gibbs, H.K. Environmental outcomes of the US renewable fuel standard. Proc. Natl. Acad. Sci. USA 2022, 119, e2101084119. [Google Scholar] [CrossRef] [PubMed]
- Ramankutty, N.; Mehrabi, Z.; Waha, K.; Jarvis, L.; Kremen, C.; Herrero, M.; Rieseberg, L.H. Trends in global agricultural land use: Implications for environmental health and food security. Annu. Rev. Plant Biol. 2018, 69, 789–815. [Google Scholar] [CrossRef]
- Ren, W.; Yang, A.; Wang, Y. Spatial patterns, drivers, and sustainable utilization of terrace abandonment in mountainous areas of Southwest China. Land 2024, 13, 283. [Google Scholar] [CrossRef]
- Guo, H.; Sun, L.; Wu, S.; Siddique, K.H. The process and driving mechanism of abandoned terraces in mountain region at the watershed scale. Ecol. Eng. 2025, 215, 107582. [Google Scholar] [CrossRef]
- Liu, T.; Yu, L.; Liu, X.; Peng, D.; Chen, X.; Du, Z.; Tu, Y.; Wu, H.; Zhao, Q. A Global Review of Monitoring Cropland Abandonment Using Remote Sensing: Temporal–Spatial Patterns, Causes, Ecological Effects, and Future Prospects. J. Remote Sens. 2025, 5, 0584. [Google Scholar] [CrossRef]
- Chaudhary, S.; Wang, Y.; Khanal, N.R.; Xu, P.; Fu, B.; Dixit, A.M.; Yan, K.; Liu, Q.; Lu, Y. Social impact of farmland abandonment and its eco-environmental vulnerability in the high mountain region of Nepal: A case study of Dordi River Basin. Sustainability 2018, 10, 2331. [Google Scholar] [CrossRef]
- Verburg, P.H.; Crossman, N.; Ellis, E.C.; Heinimann, A.; Hostert, P.; Mertz, O.; Nagendra, H.; Sikor, T.; Erb, K.-H.; Golubiewski, N. Land system science and sustainable development of the earth system: A global land project perspective. Anthropocene 2015, 12, 29–41. [Google Scholar] [CrossRef]
- Long, H.; Zhang, Y.; Ma, L.; Tu, S. Land use transitions: Progress, challenges and prospects. Land 2021, 10, 903. [Google Scholar] [CrossRef]
- Jing, J.; Wei, F.; Jiang, H.; Chen, Z.; Lv, S.; Li, T.; Li, W.; Tang, Y. Prediction of Land Use Change and Carbon Storage in Lijiang River Basin Based on InVEST-PLUS Model and SSP-RCP Scenario. Land 2025, 14, 460. [Google Scholar] [CrossRef]
- Masoudi, M.; Richards, D.R.; Tan, P.Y. Assessment of the influence of spatial scale and type of land cover on urban landscape pattern analysis using landscape metrics. J. Geovis. Spat. Anal. 2024, 8, 8. [Google Scholar] [CrossRef]
- Zhou, K.; Sun, Z.; Ma, T.; Li, Y.; Xie, B. Spatiotemporal Heterogeneity and Zoning Strategies of Multifunctional Trade-Offs and Synergies in Cultivated Land in the Hexi Corridor. Land 2025, 14, 335. [Google Scholar] [CrossRef]
- Ye, Y.; Wang, Y.; Liao, J.; Chen, J.; Zou, Y.; Liu, Y.; Feng, C. Spatiotemporal pattern analysis of land use functions in contiguous coastal cities based on long-term time series remote sensing data: A case study of Bohai Sea Region, China. Remote Sens. 2022, 14, 3518. [Google Scholar] [CrossRef]
- Chen, G. Comparative Spatial Distribution Simulation of Plateau Mountain Cultivated Land Based on Spatial Multi-Scale Model, Yunnan Central Urban Agglomeration Area, China. Pol. J. Environ. Stud. 2023, 32, 3063–3080. [Google Scholar] [CrossRef]
- Xie, H.; He, Y.; Xie, X. Exploring the factors influencing ecological land change for China’s Beijing–Tianjin–Hebei Region using big data. J. Clean. Prod. 2017, 142, 677–687. [Google Scholar] [CrossRef]
- Prabhakar, S. A succinct review and analysis of drivers and impacts of agricultural land transformations in Asia. Land Use Policy 2021, 102, 105238. [Google Scholar] [CrossRef]
- Wang, J.; Xu, C. Geodetector: Principle and prospective. Acta Geogr. Sin. 2017, 72, 116–134. [Google Scholar]
- Zhou, Y.; Li, X.; Liu, Y. Land use change and driving factors in rural China during the period 1995–2015. Land Use Policy 2020, 99, 105048. [Google Scholar] [CrossRef]
- Shuanglong, C.; Wei, S.; Yuanzhe, L.; Han, L. Patterns and driving forces of cropland abandonment in mountainous areas. J. Resour. Ecol. 2022, 13, 394–406. [Google Scholar] [CrossRef]
- Li, X.; Yang, H.; Jia, J.; Shen, Y.; Liu, J. Index system of sustainable rural development based on the concept of ecological livability. Environ. Impact Assess. Rev. 2021, 86, 106478. [Google Scholar] [CrossRef]
- Wei, F.; Liang, Z.; Wang, Y.; Huang, Z.; Wang, H.; Sun, F.; Li, S. Exploring the Driving Factors of the Spatiotemporal Variation of Precipitation in the Jing-Jin-Ji Urban Agglomeration from 2000 to 2015. Sustainability 2020, 12, 7426. [Google Scholar] [CrossRef]
- Zhang, J.; Dai, M.; Wang, L.; Zeng, C.; Su, W. The challenge and future of rocky desertification control in karst areas in southwest China. Solid Earth 2016, 7, 83–91. [Google Scholar] [CrossRef]
- Wang, X.; Dong, X.; Liu, H.; Wei, H.; Fan, W.; Lu, N.; Xu, Z.; Ren, J.; Xing, K. Linking land use change, ecosystem services and human well-being: A case study of the Manas River Basin of Xinjiang, China. Ecosyst. Serv. 2017, 27, 113–123. [Google Scholar] [CrossRef]
- Tong, X.; Brandt, M.; Yue, Y.; Horion, S.; Wang, K.; Keersmaecker, W.D.; Tian, F.; Schurgers, G.; Xiao, X.; Luo, Y. Increased vegetation growth and carbon stock in China karst via ecological engineering. Nat. Sustain. 2018, 1, 44–50. [Google Scholar] [CrossRef]
- Silverman, B.W. Density Estimation for Statistics and Data Analysis; Routledge: London, UK, 2018. [Google Scholar]
- Dehnad, K. Density Estimation for Statistics and Data Analysis; Taylor & Francis: Abingdon, UK, 1987. [Google Scholar]
- Zhong, A.; Yang, G. Research on the Change of Land Use Agglomeration Based on Kernel Density Estimation and Hot Spot Analysis. In CRIOCM: International Symposium on Advancement of Construction Management and Real Estate, Proceedings of the International Symposium on Advancement of Construction Management and Real Estate, Wuhan, China, 28–30 November 2020; Springer: Singapore, 2021; pp. 987–1003. [Google Scholar]
- Song, W.; Pijanowski, B.C. The effects of China’s cultivated land balance program on potential land productivity at a national scale. Appl. Geogr. 2014, 46, 158–170. [Google Scholar] [CrossRef]
- Lambin, E.F.; Geist, H.J. Land-Use and Land-Cover Change: Local Processes and Global Impacts; Springer Science & Business Media: Berlin/Heidelberg, Germany, 2008. [Google Scholar]
- Jiang, L.; Yu, L. Analyzing land use intensity changes within and outside protected areas using ESA CCI-LC datasets. Glob. Ecol. Conserv. 2019, 20, e00789. [Google Scholar] [CrossRef]
- Pontius, R.G., Jr.; Shusas, E.; McEachern, M. Detecting important categorical land changes while accounting for persistence. Agric. Ecosyst. Environ. 2004, 101, 251–268. [Google Scholar] [CrossRef]
- Liu, J.; Zhang, Z.; Xu, X.; Kuang, W.; Zhou, W.; Zhang, S.; Li, R.; Yan, C.; Yu, D.; Wu, S. Spatial patterns and driving forces of land use change in China during the early 21st century. J. Geogr. Sci. 2010, 20, 483–494. [Google Scholar] [CrossRef]
- Huang, T.; Xu, J. The characteristics, causes and countermeasures of spatial-temporal evolution of guangxi cultivated land deagriculturalization in the past 40 years. Chin. J. Agric. Resour. Reg. Plan. 2023, 44, 40–51. [Google Scholar]
Disclaimer/Publisher’s Note: The statements, opinions and data contained in all publications are solely those of the individual author(s) and contributor(s) and not of MDPI and/or the editor(s). MDPI and/or the editor(s) disclaim responsibility for any injury to people or property resulting from any ideas, methods, instructions or products referred to in the content. |
© 2025 by the authors. Licensee MDPI, Basel, Switzerland. This article is an open access article distributed under the terms and conditions of the Creative Commons Attribution (CC BY) license (https://creativecommons.org/licenses/by/4.0/).