Abstract
We design a phase rendering technique that exploits the link between the angular deviations of a beam and the optical implementation of cross-correlations. We employ two suitably coded gratings, which are incorporated as part of a new device here called a dark-field, Lau interferometer. To this end, we use a first grating whose unit cell is coded with the white and black versions of a Barker sequence. We employ a second grating that is coded as the Babinet’s complementary of the first grating. We describe the cross-correlation operation by using a compact matrix formulation, which is amenable to numerical evaluation.
1. Introduction
Under coherent illumination, masks coded with periodic structures can create Fresnel diffraction patterns that are like the initial mask. This remarkable effect, known as the self-imaging phenomenon, appears in several ranges of the electromagnetic spectrum, as well as in matter waves [1,2,3,4,5,6].
The discovery of the self-imaging phenomenon goes back to Talbot [7,8]. Commonly, the self-imaging phenomenon is discussed by assuming that a monochromatic plane wave illuminates a low-frequency grating. However, as noted by Lord Rayleigh, one can also use spherical waves for observing the self-imaging phenomenon [9]. Furthermore, by using polychromatic illumination Lohmann applied the self-imaging phenomenon for implementing an optical spectrometer [10]. And under polychromatic illumination, the self-imaging phenomenon has been applied for proposing a range sensor [11].
The self-imaging phenomenon effect has been applied for setting simple optical interferometers [12,13,14]. And before the publication of Jahns and Lohmann [15], it was somehow unknown that under noncoherent illumination one can observe a related self-imaging phenomenon. The noncoherent version of the Talbot effect is now known as the Lau effect [16,17], which can also be applied for setting nonconventional interferometers [18,19] and for sensing of lateral displacements [20].
Several authors have recognized that there is an akin phenomenon and related applications in temporal optics [21,22,23]. The Talbot–Lau phenomenon and its akin relatives have generated a myriad of contributions in several branches of applied optics.
Here, our aim is to propose a dark-ground, Lau interferometer. To our end, we relate the deflections caused by phase gradients with the optical generation of cross-correlations, between two coded gratings. Beam deflections are easily visualized if one grating is coded with the white and black version of Barker sequences [24]. We recognize that one can also use the white and black version of the pseudo-random sequences [25]. As part of our current deliberation for coding the gratings, we discuss the advantages of employing an extension of the Babinet principle [26,27,28,29,30]. By applying this extension, we define a binary complementary grating, which is used in conjunction with the initial grating. These pairs of gratings augment the role of an optical cross-correlation for implementing a dark-field, Lau interferometer.
In Section 2, we apply the concept of a virtual Fourier spectrum [31,32] for reassessing the fundamentals of the Talbot effect. We also reconsider Rogers’ insightful discussion on the noncoherent superposition of interference fringes [33]. In Section 3, we indicate the need for stating a nonconventional treatment of Babinet’s principle. This nonconventional treatment is applied for the generation of two complementary binary gratings. In Section 4, we revisit the basic features of a Barker sequence. We evaluate numerically the autocorrelations of the white and black versions of the Barker sequences, as well as the cross-correlations between the Barker sequences and their complementary versions. In Section 5, we describe a variation of the Lau interferometer. In Section 6, we discuss the use of the cross-correlations for setting a dark-field, phase gradient sensor. In Section 7, we summarize our contribution.
2. The Talbot Effect and Lau Interferometry
For our current discussion, it is convenient to revisit the Talbot effect and its noncoherent analogue the Lau effect. We do not aim for a generic description. But rather for a simple, insightful description. As depicted in Figure 1, we consider that a point source generates a paraxial spherical wave, which illuminates a low frequency grating. By placing the origin of the z-axis at the grating, the source is located at a distance z0 < 0. And the detection plane is at a distance z > 0 from the grating.
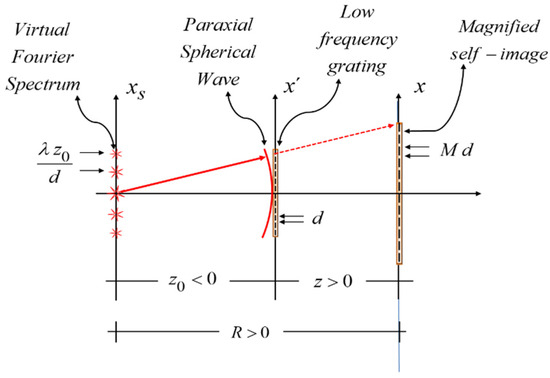
Figure 1.
Pictorial showing the generation of a virtual Fourier spectrum by using a paraxial spherical wave, which comes from a point source located at the distance z0 < 0. The virtual Fourier spectrum is applied for evaluating the Fresnel diffraction pattern associated with the grating. The detection plane is located at a distance z > 0 from the grating. Or equivalently, the detection plane is at a distance R = z − z0 > 0 from the source.
We assume that a paraxial spherical wave illuminates a lower-frequency grating. The spherical wave has the following complex amplitude distribution
In Equation (1), the lower-case Greek letter lambda represents the wavelength. And the lower-case Latin letter z0 denotes the distance from the grating to the point source as depicted in Figure 1. We use a Fourier series for describing the grating’s complex amplitude transmittance, which reads
In Equation (2) the lower-case Latin letter d denotes the period of the grating. And the letter C m is the Fourier coefficient of the series. Just after the grating, the complex amplitude distribution is
At the source, under the paraxial regime, the complex amplitude distribution of the virtual diffraction pattern is obtained by evaluating the Fresnel integral
By substituting Equation (3) with Equation (4), and after some simple algebraic operations, we obtain
We recognize that the integral in Equation (5) is a Fourier transformation. And consequently, we can rewrite Equation (5) as
In Equation (6), the lower-case Grek letter delta represents a Dirac’s delta. Now, it is convenient to identify the Talbot distance ZT = (2 d2/λ). If one employs the Talbot distance in Equation (6), then the complex amplitude distribution of the virtual diffraction pattern reads
The result in Equation (7) is especially useful for evaluating the Fresnel diffraction patterns of the grating, at a distance R > 0 from the source. We consider next the complex amplitude distribution ψ(x; R), at the distance R > 0, from the source. That is,
By substituting Equation (7) with Equation (8), we obtain
It is clear from Equation (9) that one can recover the amplitude distribution of the illuminated grating by setting R = −z0. In other words,
The result in Equation (10) validates our current description. Now, we turn our attention to the noncoherent version of the Lau effect. To this end, first we consider the optical setup in Figure 2.
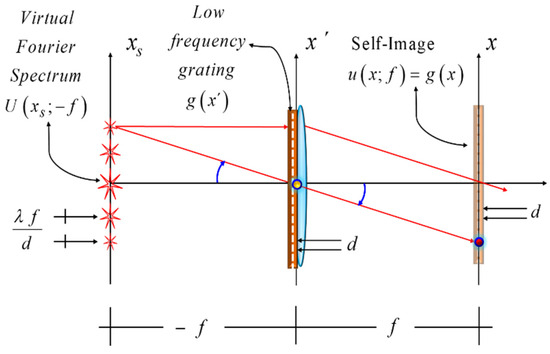
Figure 2.
Schematics showing the formation of a self-image, out of the virtual Fourier spectrum. The initial grating is placed in close contact with a positive lens, which has a focal length equal to f. At the front focal plane, we have the virtual Fourier spectrum. And at the back focal plan, we implement optically a Fourier transform. In this manner, one can obtain a self-image of the initial grating.
As depicted in Figure 2, the grating is located at the lens. Next, we show that out of the virtual Fourier spectrum, one can obtain a self-image of the grating. For this goal, we note that the virtual Fourier spectrum of the grating is located at the front focal plane of the lens. Since the lens performs optically a Fourier transform, then at the back focal plane of the lens, one can obtain a self-image of the grating. In mathematical terms, we evaluate Equation (7) for the case z0 = −f, then
Next, we evaluate the Fourier transform
By substituting Equation (11) with Equation (12) we have that
And from Equation (13), it is apparent to recognize a self-imaging condition
In Equation (14), the lower-case letter q denotes any integer number.
Now, it is convenient to revisit the insightful description (advanced by Rogers in reference [31]) for superimposing the interference fringes that one can obtain in a two-slit experiment. In Figure 3, we show the optical setup for our current purpose
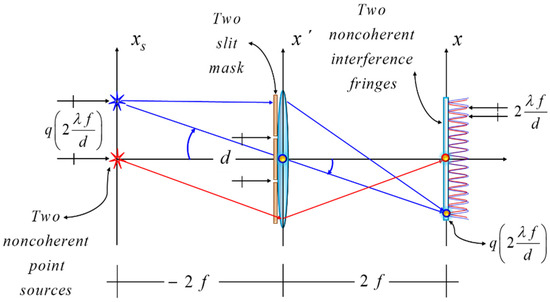
Figure 3.
After Rogers, this pictorial shows the condition for superimposing two mutually noncoherent, irradiance interference patterns. Each interference pattern is obtained by employing the celebrated two-slit experiment. At the source plane, with two distinct colors, we indicate the presence of two mutually noncoherent point sources. At the detection plane, two sinusoidal irradiance distributions (with the same period) are superimposed with maximum visibility. For the sake of clarity, the two interference patterns are slightly displaced.
In Figure 3, the optical setup illustrates well the possibility of superimposing two mutually incoherent interference patterns. This key observation can be generalized by substituting the two-slit mask for a binary grating; as depicted in Figure 4.
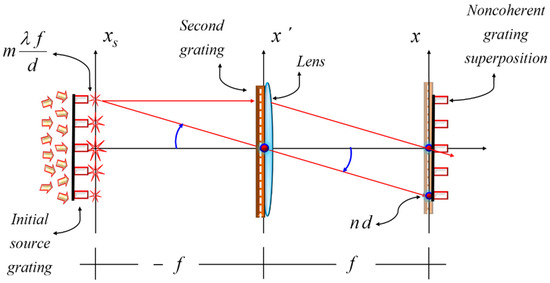
Figure 4.
The schematic depicts the conditions that are shown in Figure 2 and Figure 4. But now, at the back focal plane of a positive lens, we consider the superposition of two binary gratings. The initial grating is under noncoherent illumination. It is located at the front focal plane of the positive lens. The initial grating has transparent windows that coincide with the positions of the virtual Fourier spectrum of the second grating. This later grating is in close contact with a positive lens.
Before considering our main goal, it is convenient to describe some basic features of the Barker sequences, as well as the rationale for defining and employing the complementary Barker sequences. For this purpose, next we discuss a nonconventional treatment of Babinet’s principle.
3. Nonconventional Babinet’s Principle
It is convenient to revisit the concept of complementary masks. According to Babinet’s principle, for a given amplitude transmittance, say b(x, y), one can define the following complementary amplitude transmittance bC(x, y)
For example, if the amplitude transmittance is
Then, from Equations (15) and (16), we have that the amplitude transmittance of the complementary masks is
We note, however, that in Equations (16) and (17), the amplitude transmittances are not binary. For obtaining a pair of complementary masks that are binary, we also require that the amplitude transmittance, b(x, y), satisfies the condition
In Appendix A, we show that the condition in Equation (18) is related to the following binary requirement
The conditions in Equations (21) and (22) constitute a nonconventional description of the Babinet principle, which is useful for our current purpose.
4. The Barker Sequences and Complementary Sequences
For clarifying our notation, we indicate that the initial grating is coded with the black and white version of the Barker sequences. In Table 1, we list the numerical values of five members of the Barker sequences under discussion. The number of elements in the sequence is denoted as the length L.

Table 1.
White and black versions of some Barker sequences, for lengths L = 3, 5, 7, 11, and 13.
In Table 2, we list the numerical values of the complementary sequences in Table 1. Trivially, the Barker sequences and the complementary Barker sequences are of the same length.

Table 2.
White and black versions of the complementary Barker sequences in Table 1.
The autocorrelations of the Barker sequences show a highly peaked value at the origin, with low peaked values at the side lobes. Due to their different lengths, the Barker sequences cannot be used for implementing cross-correlations. This is not the case for the Barker sequences and their associated complementary sequences, listed in Table 2. In Figure 5, we show a graphical comparison between autocorrelations of the Barker sequences and the cross-correlations of the Barker sequences and their complementary sequences.
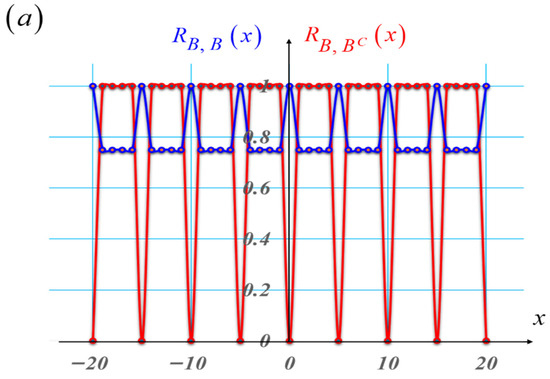
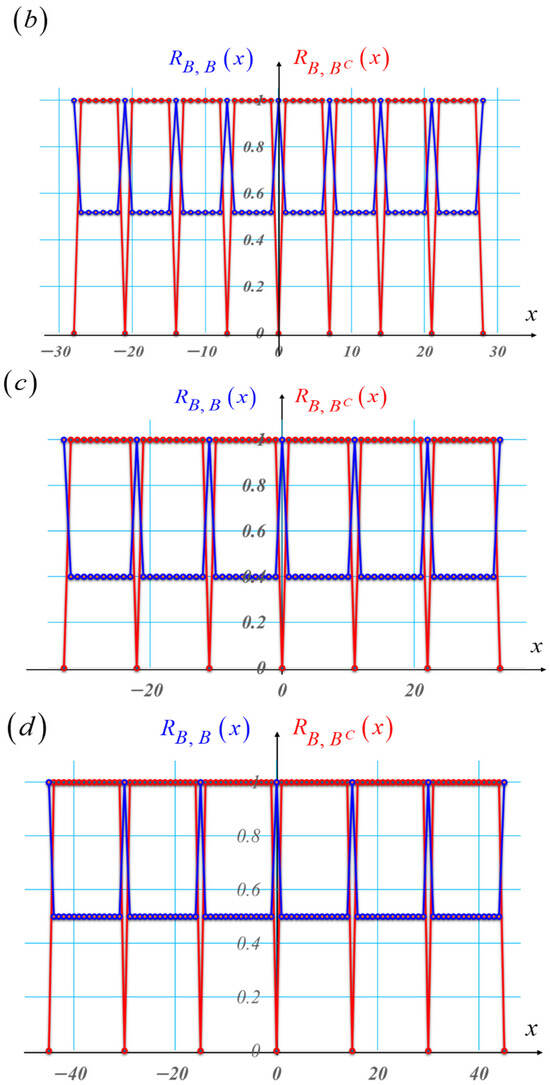
Figure 5.
Graphs depicting a comparison between the autocorrelations of the Barker sequences (in blue) and the cross-correlations between the Barker sequences and their complementary sequences (in red). In (a), the length is L = 5. In (b), the length is L = 7. In (c), the length is L = 11. And in (d), we plot the autocorrelation between a pseudorandom sequence (in blue) and the cross-correlations between the pseudorandom sequence (in red) and its complementary sequence with L = 15.
From Figure 5, we conclude the following. The white and black versions of the Barker sequences have cyclic autocorrelations (in blue) with a distinctive peak over a gray level background. The cross-correlations between the white and black versions of the Barker sequences and their complementary sequences exhibit a distinctive zero value, over a uniform background, with value equal to unity. From this later property, we claim the described cross-correlation has a visibility that is equal to unity.
5. The Lau Interferometer
In this section, we discuss the use of two complementary gratings for implementing a novel Lau interferometer. For achieving this goal, it is convenient to reexamine the description advanced by Jahns and Lohmann, as depicted in Figure 6.
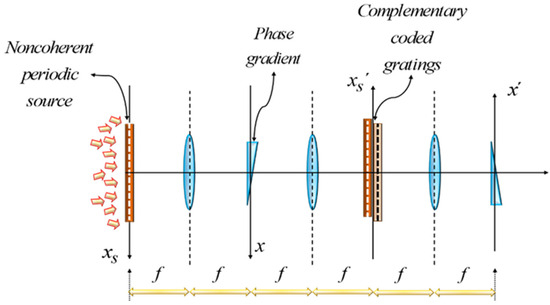
Figure 6.
The diagram (after Jahns and Lohmann) depicts the optical setup for implementing a Lau interferometer.
In the schematics, the optical setup employs three positive lenses, all of them having the same focal length. The inter-lens separation is equal to the focal length, as is common when using optical processors. A folded version of Figure 6 is shown in Figure 7.
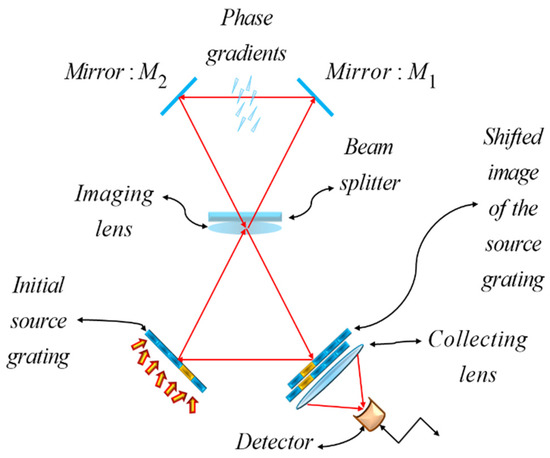
Figure 7.
Folded version of the optical setup in Figure 6.
It has been noted that the irradiance distribution of the Lau interferograms is related to the autocorrelation of two similar gratings. The main advantage of the Lau interferometer is that it employs a rather simple setup, which works under noncoherent illumination. To our current knowledge, there are no quantitative comparisons between classical interferograms and those obtained with the Lau interferometer.
From our previous results, we highlight that the novelty of our current proposal consists in employing two coded complementary gratings, rather than two conventional binary gratings. The new gratings are coded with complementary sequences. Hence, the novel interferometer exploits the cross-correlation operation. The absence of a phase grating is associated with a dark background. On the other hand, the presence of phase gradients produces bright regions over the otherwise dark background. The main limitation of our proposal is that it lacks experimental validations.
For emphasizing our proposal, it is convenient to discuss the coding procedure on the unit cell of a grating. We consider that along the x-axis, the amplitude transmittance is
In Equation (20), the upper-case letter “L” stands for the length of the Barker sequence. As before, the lower-case Latin letter “d” denotes the period of the grating. And the letter Bn denotes the values of the white and black Barker sequence of length L, as in Table 1.
For coding the unit cell of the complementary grating, the amplitude transmittance is
In Figure 8, we portray the product between unit cells that are binary complementary. In Figure 8a, we depict a unit cell coded with the sequence {0,0,1}. In Figure 8b, we display the complementary mask that is coded with the sequence {1,1,0}, which corresponds to the Barker sequence of length L = 3. In Figure 8c, we show a shifted image of Figure 8a. In Figure 8d, we draw the product of the two masks.
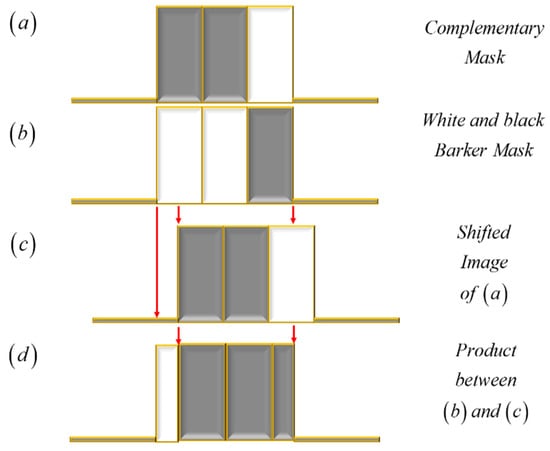
Figure 8.
Illustration depicting the product of two binary complementary masks. In (a), a mask is coded with the complementary sequence {0,0,1}. In (b), the mask is coded with the white and black Barker sequence {1,1,0}. In (c), a laterally shifted image of the mask is in (a). In (d), the product of the masks is in (b,c).
In Figure 9, we show the presence of a prism that represents a phase gradient at a lens.
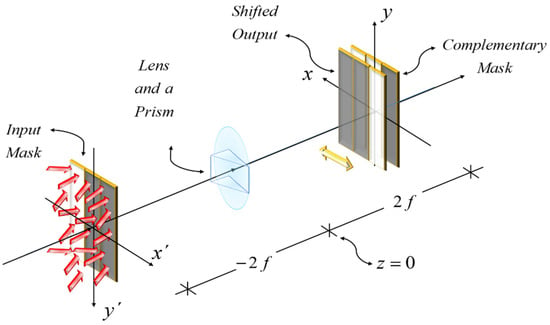
Figure 9.
Imaging device for implementing the mathematical operation in Figure 2, for two complementary binary masks. At the X–Y plane, the initial masks is laterally shifted due to the presence of the prism, which is located at the imaging lens. The complementary mask is coded with the Barker sequence of length L = 3.
Under noncoherent illumination, one can implement the product optically in Figure 9, by employing the optical setup in Figure 9.
From Figure 8 and Figure 9, it is apparent that in the absence of phase gradients, there is not a lateral shift. And consequently, the light throughput is equal to zero. In other words, the presence of the phase gradient breaks the zero-throughput condition. Next, we discuss a simple mathematical description of the above heuristic pictorials. The unit cell of the first grating has the following amplitude transmittance
The Babinet complementary unit cell has the following amplitude transmittance
Now, from Equations (22) and (23), we obtain the product
From Equation (30), we note that the product is equal to zero, each time that the coefficient Bn is equal to zero. And the product is also equal to zero each time that the coefficient Bn is equal to unity. We can rephrase this result in terms of matrix algebra; for the case L = 3, we can rewrite Equation (29) as
In Equation (31), each value of the column vector (at the left-hand side) represents the light throughput in the presence of phase gradients. The columns of the square matrix (at the right-hand side of Equation (14)) describe the positions of the shifted Barker mask, in integer steps of (2 d/L f). In what follows, we list two other examples of this type of matrix product. For the white and black Barker sequence of length L = 5, the matrix product reads
And for the white and black Barker sequence of length L = 7, the matrix product is
Next, we depict the optical setup for setting a dark-field, Lau interferometer.
6. The Dark-Field, Lau Interferometer
For the sake of clarity, we describe in simple terms the dark-field, Lau interferometer. At the source plane, the irradiance distribution is
As before, in Equation (34) the lower-case Greek letter denotes a Dirac’s delta. And the lower-case Latin letter “q” denotes an integer number between unity and L. The composing source points are located at
Next, we include the presence of a prismatic lateral displacement, caused by an angular deviation θ. At the image plane, the irradiance distribution is
At the detection plane, we place the second mask. Its irradiance transmittance is
Hence, after the second mask, the light throughput is written as the cross-correlation
By substituting Equations (30) and (31) with Equation (32), we obtain
From Equation (33), if θ = 0, then the cross-correlation reads
From Equation (34), we recognize the following. At the detection plane, the light throughput can be expressed as a cross-correlation of the Bn coefficients. The result in Equation (34) agrees well with the result expressed in Equation (24). Therefore, we claim that we have designed a noncoherent technique for visualizing phase gradients. Our proposal exploits the connection between a noncoherent cross-correlation with the deflections of an optical beam. The discussed design uses two binary complementary gratings. In the absence of phase gradients, the proposed devices generate a uniform zero value background.
7. Results
In Section 3, we have presented a new figure (number 3) that clarifies the notion of noncoherent superposition of two interferograms. This key visual clarification is the starting point for describing the Lau effect.
In Section 4, we have extended the use of Babinet’s principle of complementary masks. Thanks to this extension, it was possible to define the complementary sequence of a white and black Barker sequence. These discussions play a fundamental role in the definition of complementary Barker gratings.
Furthermore, we have indicated that the white and black versions of the Barker sequences have cyclic autocorrelation with a distinctive peak over a gray level background.
In contrast to the cyclic autocorrelations (of the Barker sequences), the cross-correlations (between two complementary Barker sequences) exhibit a distinctive zero value, over a uniform background. Thus, we have claimed that the proposed cross-correlations have a visibility that is equal to unity.
In Section 5, we have presented a folded version (figure number 7) of the Lau interferometer. Moreover, we have reported a simple matrix formulation for evaluating the lateral shifts in the proposed cross-correlation. This simple formulation describes, in mathematical terms, the cross-correlations between two complementary Barker sequences.
In Section 6, we have presented a mathematical description of the proposed dark-field Lau interferometer.
8. Conclusions
We have designed a nonconventional phase rendering technique that exploits a connection between the optical implementation of a noncoherent cross-correlation and the deflections of an optical beam. The proposed technique is akin to the Lau interferometer, which uses two binary gratings, under noncoherent illumination. However, in the absence of phase gradients, the reported technique generates a uniform zero value background.
For achieving our aim, we have revisited the fundamentals of the Talbot effect, as well as the key features of a Lau interferometer. Furthermore, for coding the two gratings used in a Lau interferometer, we have extended the applications of Babinet’s principle. This extension was used for identifying the complementary binary grating of an initial grating, which has a unit cell coded with the white and black versions of a Barker sequence.
We have shown that the Barker coded grating and its complementary binary grating have cross-correlations suitable for creating transparent bands with a distinctly zero value. This feature was here advantageously used for visualizing the presence of phase gradients. In the absence of phase variations, the device generates a dark background. On the other hand, in the presence of phase gradients, the device produces bright regions. This special irradiance distribution may be helpful for sensing zero beam deflections.
We have employed a simple matrix formulation for describing the cross-correlation between the two coded gratings.
To summarize, we have described a nonconventional phase rendering technique, which works under noncoherent illumination. The main limitation of our current proposal is that it lacks experimental validation.
Author Contributions
Conceptualization, J.O.-C.; Methodology, J.O.-C. and C.M.G.-S.; Software, C.M.G.-S.; Validation, J.O.-C.; Formal Analysis, J.O.-C.; Writing—original draft preparation, J.O.-C.; Witting—review and editing, J.O.-C.; Visualization, C.M.G.-S.; Supervision, C.M.G.-S. All authors have read and agreed to the published version of the manuscript.
Funding
This research received no external funding.
Institutional Review Board Statement
Not applicable.
Informed Consent Statement
Not applicable.
Data Availability Statement
The original contributions presented in this study are included in the article. Further inquiries can be directed to the corresponding author.
Acknowledgments
We are truly indebted to Manuel Filipe Costa for his cordial invitation to present this contribution. We extend our gratitude to Adolf W. Lohmann, Hartmut Bartelt and Juergen Jahns for inspiring discussions on the Lau effect.
Conflicts of Interest
The authors declare that there are no conflicts of interest related to this article.
Appendix A. A Nonconventional Use of the Babinet Principle
We include mathematical proof, by induction, for validating our claim on the binary feature of the Babinet complementary mask. First, we note that the square of the amplitude transmittance, associated with the complementary mask reads.
From Equation (A1) is straightforward to obtain
Consequently, the cubic of the amplitude transmittance reads
Then, by using Equation (A2) in Equation (A3) we have that
According to the mathematical induction method, we assume that for the integer value n, the following expression is true
Next, we proceed to the case integer value n + 1,
By employing Equations (A5) and (A2) in Equation (A6), we show that
References
- Neuwirth, T.; Backs, A.; Gustschin, A.; Vogt, S.; Pfeiffer, F.; Böni, P. A high visibility Talbot-Lau neutron grating interferometer to investigate stress-induced magnetic degradation in electrical steel. Nat. Sci. Rep. 2020, 10, 1764. [Google Scholar] [CrossRef]
- Hall, L.A.; Yessenov, M.; Sergey, A.; Ponomarenko, S.A.; Abouraddy, A.F. The space–time Talbot effect. Appl. Phys. Lett. Photon. 2021, 6, 056105. [Google Scholar] [CrossRef]
- Deng, K.; Li, J.; Xie, W. Modeling the Moiré fringe visibility of Talbot-Lau X-ray grating interferometry for single-frame metacontrast imaging. Opt. Express 2020, 28, 27107–27122. [Google Scholar] [CrossRef]
- Morimoto, N.; Shirai, T.; Kimura, K.; Doki, T.; Sano, S.; Horiba, A.; Kitamura, K. Talbot–Lau interferometry-based X-ray imaging system, with retractable and rotatable gratings for nondestructive testing. Rev. Sci. Instrum. 2020, 91, 023706. [Google Scholar] [CrossRef]
- Bouffetier, V.; Ceurvorst, L.; Valdivia, M.P.; Dorchies, F.; Hulin, S.; Goudal, T.; Stutman, D.; Casner, A. Proof-of-concept Talbot-Lau X-ray interferometry with a high-intensity, high repetition-rate, laser-driven K-alpha source. Appl. Opt. 2020, 59, 8380–8387. [Google Scholar] [CrossRef]
- Rieger, J.; Meyer, P.; Pelzer, G.; Weber, T.; Michel, T.; Mohr, J.; Anton, G. Designing the phase grating for Talbot-Lau phase-contrast imaging systems: A simulation and experiment study. Opt. Express 2016, 24, 13357–13365. [Google Scholar] [CrossRef]
- Talbot, H.F. Facts relating to optical science, LXXVI, No. IV. Philosophical Magazine Series 1. Lond. Edinb. Dublin Philos. Mag. J. Sci. 1836, 9, 401–407. [Google Scholar] [CrossRef]
- Lohmann, A.W. Optical Information Processing; Sinzinger, S., Ed.; Univeristaetsverlag Ilmenau: Ilmenau, Germany, 2006; pp. 183–201. [Google Scholar]
- Rayleigh, L. On copying diffraction-gratings, and on some phenomena connected therewith. Philos. Mag. 1881, 11, 196–205. [Google Scholar] [CrossRef]
- Lohmann, A.W. A new Fourier-spectrometer consisting of a two-grating interferometer. In Proceedings of the Conference on Optical Instruments and Techniques, London, UK, 11–14 July 1961; Chapman and Hall: London, UK, 1962; pp. 58–61. [Google Scholar]
- Chavel, P.; Strand, T.C. Range measurement using Talbot diffraction imaging of gratings. Appl. Opt. 1984, 23, 862–871. [Google Scholar] [CrossRef]
- Lohmann, A.W.; Silva, D.E. An interferometer based on the Talbot effect. Opt. Commun. 1971, 2, 413–415. [Google Scholar] [CrossRef]
- Yokozeki, S.; Suzuki, T. Shearing interferometer using the grating as the beam splitter. Appl. Opt. 1971, 10, 1575–1580. [Google Scholar] [CrossRef] [PubMed]
- Silva, D.E. Talbot Interferometer for Radial and Lateral Derivatives. Appl. Opt. 1972, 11, 2613–2624. [Google Scholar] [CrossRef] [PubMed]
- Jahns, J.; Lohmann, A.W. The Lau effect (a diffraction experiment with incoherent illumination). Opt. Comm. 1979, 28, 263–265. [Google Scholar] [CrossRef]
- Lau, E. Interference phenomenon on double gratings (Beugungserscheinungen an doppelrastern). Ann. Phys. 1948, 6, 417. [Google Scholar] [CrossRef]
- Ojeda-Castañeda, J.; Ibarra, J.; Barreiro, J.C. Noncoherent Talbot effect: Coherence theory and applications. Opt. Commun. 1989, 71, 151–155. [Google Scholar] [CrossRef]
- Bartelt, H.O.; Jahns, J. Interferometry based on the Lau effect. Opt. Commun. 1979, 30, 268–270. [Google Scholar] [CrossRef]
- Bartelt, H.O.; Li, Y. Lau interferometry with cross gratings. Opt. Commun. 1983, 48, 1–5. [Google Scholar] [CrossRef]
- Gómez-Sarabia, C.M.; Ledesma-Carrillo, L.M.; Ojeda-Castañeda, J. Lau visibility sensor. Opt. Commun. 2019, 453, 124320. [Google Scholar] [CrossRef]
- Jannson, T.; Jannson, J. Temporal self-imaging effect in single-mode fibers. J. Opt. Soc. 1981, 71, 1373–1376. [Google Scholar] [CrossRef]
- Azaña, J.; Muriel, M.A. Temporal Talbot effect in fiber gratings and its applications. Appl. Opt. 1999, 38, 6700–6704. [Google Scholar] [CrossRef]
- Torres-Company, V.; Lancis, J.; Andrés, P. Unified approach to describe optical pulse generation by propagation of periodically phase-modulated CW laser light. Opt. Express 2006, 14, 3171–3180. [Google Scholar] [CrossRef] [PubMed]
- Barker, R.H. Group Synchronizing of Binary Digital Systems. In Communication Theory; Jackson, W., Ed.; Butterworth: London, UK, 1953; pp. 273–287. [Google Scholar]
- MacWilliams, F.J.; Sloane, N.J.A. Pseudo-Random Sequences and Arrays. Proc. IEEE 1976, 64, 1715–1729. [Google Scholar] [CrossRef]
- Born, M.; Wolf, E. Principles of Optics: Electromagnetic Theory of Propagation, Interference and Diffraction of Light, 4th ed.; Pergamon Press: Oxford, UK, 1970. [Google Scholar]
- Lipson, H.; Walkley, K. On the validity of Babinet’s principle for Fraunhofer diffraction. Opt. Acta 1968, 15, 83–91. [Google Scholar] [CrossRef]
- Umul, Y.Z. Babinet’s principle in the Fraunhofer diffraction by a finite thin wire. Optik 2011, 122, 1434–1436. [Google Scholar] [CrossRef]
- Sun, B.; Yang, P.; Kattawar, G.W.; Mishchenko, M.I. On Babinet’s principle and diffraction associated with an arbitrary particle. Opt. Lett. 2017, 42, 5026–5029. [Google Scholar] [CrossRef]
- Mayer, V.V.; Varaksina, E.I. Study of Babinet’s principle and Rayleigh criterion through elementary theory and simple experiments. Eur. J. Phys. 2021, 42, 065302. [Google Scholar] [CrossRef]
- Knopp, J.; Becker, M.F. Virtual Fourier transform as an analytical tool in Fourier optics. Appl. Opt. 1978, 17, 1669–1670. [Google Scholar] [CrossRef]
- Knopp, J.; Becker, M.F. Generalized model for noncoherent optical convolvers and correlators. Appl. Opt. 1978, 17, 984–985. [Google Scholar] [CrossRef] [PubMed]
- Rogers, G.L. Noncoherent Optical Processing; John Wiley: New York, NY, USA, 1977; pp. 166–167. [Google Scholar]
Disclaimer/Publisher’s Note: The statements, opinions and data contained in all publications are solely those of the individual author(s) and contributor(s) and not of MDPI and/or the editor(s). MDPI and/or the editor(s) disclaim responsibility for any injury to people or property resulting from any ideas, methods, instructions or products referred to in the content. |
© 2025 by the authors. Licensee MDPI, Basel, Switzerland. This article is an open access article distributed under the terms and conditions of the Creative Commons Attribution (CC BY) license (https://creativecommons.org/licenses/by/4.0/).