Abstract
This study investigates slope stability in an open-pit mining area by integrating engineering geological surveys, field investigations, and laboratory rock mechanics tests. A coordinated multimethod analysis was carried out using finite element-based numerical simulations from both two-dimensional and three-dimensional perspectives. The integrated approach revealed deformation patterns across the slopes and established a multiscale analytical framework. The results indicate that the slope failure modes primarily include circular and compound types, with existing step slopes showing a potential risk of wedge failure. While the designed slope meets safety requirements under three working conditions overall, the strongly weathered layer in profile XL3 requires a slope angle reduction from 38° to 37° to comply with standards. Three-dimensional simulations identify the main deformations in the middle-lower sections of the western area and zones B and C, with faults located at the core of the deformation zone. Rainfall and blasting vibrations significantly increase surface tensile stress, accelerating deformation. Although wedges in profiles XL1 and XL4 remain generally stable, coupled blasting–rainfall effects may still induce potential collapse in fractured areas, necessitating preventive measures such as concrete support and bolt support, along with real-time monitoring to dynamically optimize reinforcement strategies for precise risk control.
1. Introduction
Open-pit mining, as a crucial method for efficient resource extraction, ensures the supply of national energy and metallic raw materials but simultaneously faces increasingly severe risks of slope instability [,]. As mining depths continue to increase, open-pit slopes are evolving towards steeper and more complex configurations []. The coupling effects of well-developed rock mass discontinuities, uneven weathering, dynamic groundwater variations, and external dynamic factors such as blasting vibrations and rainfall infiltration significantly exacerbate the potential for slope failure []. In recent years, numerous open-pit slope landslides globally have not only caused significant economic losses [] but also posed serious threats to mine personnel safety and the ecological environment, highlighting the urgency and complexity of slope stability research []. Ensuring the long-term stability of open-pit slopes under the coupled influences of complex geological settings and dynamic mining activities has become a critical scientific and engineering challenge demanding immediate resolution for safe and green mining operations.
Although current slope stability research has formed a system encompassing various technical means such as engineering geological analysis [], limit equilibrium methods [,], and numerical simulation [,,], it still exhibits significant limitations [] when applied to the complex giant system of open-pit mines. Baskari et al. [] proposed the progressive slope failure theory, describing the evolution process of slopes from local to overall instability. Ding et al. [] established a numerical analysis model based on the geological conditions of the Anjialing Open-pit Mine to study the evolution of slope stability during bench mining. Nguyen et al. [] used the finite difference method to evaluate the slope stability in the Thao Son Open-pit Mining Area, Vietnam. Li et al. [] applied the true 3D safety analysis method to evaluate the safety and stability of mine slopes using the Shizhuyuan Non-ferrous Metal Mine as a case study. Karir et al. [] utilized multiple physical and geometric parameters of natural residual soil slopes and artificial cover waste dump slopes to predict their safety factors. Teng et al. [] introduced the engineering geological background of a stratified mining-disturbed slope in China and evaluated its stability using numerical methods. Sdvyzhkova et al. [] developed a method for predicting the geomechanical conditions during the mining of steeply dipping stratified deposits; this method employs the finite element method to determine the changes in Slope Stability State occurring at various stages of mining operations due to design alterations of the overall open-pit slope angle. Rajan et al. [] developed a slope stability prediction model using multiple linear regression and artificial neural networks and employed random forest and support vector machines to classify slopes as safe or unsafe. Casale et al. [] suggested that safety conditions of hazardous rock slopes could be improved by using explosives to remove unstable rock components followed by final profile analysis. Based on a comprehensive study of the geometry and shear strength of geological structural planes, Du et al. [] proposed a new method for evaluating the stability of large open-pit mine slopes.
Conventional methods often focus on single-scale or static analysis [,]. While engineering geological analysis can qualitatively characterize rock mass structure and tectonic features, it struggles to accurately quantify the evolution of stress–strain fields []. Limit equilibrium methods are computationally simple but require predefined assumptions about the shape of the failure surface, limiting their applicability to slopes exhibiting complex failure modes (e.g., compound multi-sliding surface failure, wedge sliding) or those controlled by specific structural planes []. Conventional numerical simulations can reveal stress and deformation distributions, but remain inadequate for analyzing multi-field (seepage, stress, seismic) coupling effects, three-dimensional spatial effects, and long-term time-dependent behavior []. Particularly for open-pit slopes affected by faulting, significant weathering variations, and high spatial variability in rock mass mechanical properties, a single method proves insufficient for comprehensively capturing their instability mechanisms and evolutionary processes [,]. Consequently, there is an urgent need to develop a comprehensive methodological framework that integrates multi-scale information, couples multi-physical fields, and spans the entire chain from survey and analysis to assessment and prevention-control. This integrated approach is essential for achieving an accurate assessment and dynamic regulation of open-pit slope stability and risk status.
To address these challenges, this studies a typical open-pit mining area to systematically integrate engineering geological surveys, field investigations, rock mechanics testing, and multi-dimensional numerical simulations for in-depth slope stability optimization and risk mitigation. Through synergistic fusion of multi-source data and complementary methodologies, it accurately identifies the dominant arc-composite sliding failure mode with localized bench-scale wedge instability risks, quantitatively evaluates overall slope stability, and pinpoints a critical design flaw requiring slope angle reduction from 38° to 37° in the highly weathered layer of Section XL3. Furthermore, 3D simulations explicitly reveal deformation concentrations in the mid-lower western section and Zones B/C, fault-dominated failure mechanisms, and degradation effects where rainfall–blasting vibration coupling significantly intensifies surface tensile stress and deformation. Based on these findings, this study proposes a real-time monitoring-data-driven slope support optimization strategy, which provides scientific and technical support for safe, efficient mining operations. This research enriches theoretical frameworks for multi-method coupled analysis of open-pit slope stability, offers practical references for risk mitigation in geologically complex mines, and contributes significantly to advancing mine safety.
2. Project Overview
2.1. Landform
The mining area features a hilly landform with the terrain being higher in the northwestern part and lower in the southeastern part. The highest point in the mining area is located in the northwestern part with an elevation of 259 m; the lowest point is situated in the northeastern part of the mining area and to the northeast of the current mining permit area, with an elevation of approximately 70 m. The maximum relative elevation difference is about 189 m. The terrain in the area is quite undulating. The natural slope gradient of the landform in the area is generally between 10° and 35°, with some areas being relatively steep. In the southeastern part of the mining area, the slope elevation of the current open-pit mine ranges from approximately 80.20 to 207.57 m, with a relatively steep slope gradient, reaching nearly 85° at its steepest point. The proposed influence map of the mining area is shown in Figure 1.

Figure 1.
Topographic and geomorphological images of the mining area.
There are no major surface water systems in the area; the water system mainly consists of streams and gullies, all of which are seasonal. Surface water has a relatively minor impact on the mining area, and the terrain and topography are conducive to the natural drainage of atmospheric precipitation. There is a hillside reservoir located about 173 m to the south-east of the mining area, which has water all year round.
2.2. Engineering Geological Conditions
- (1)
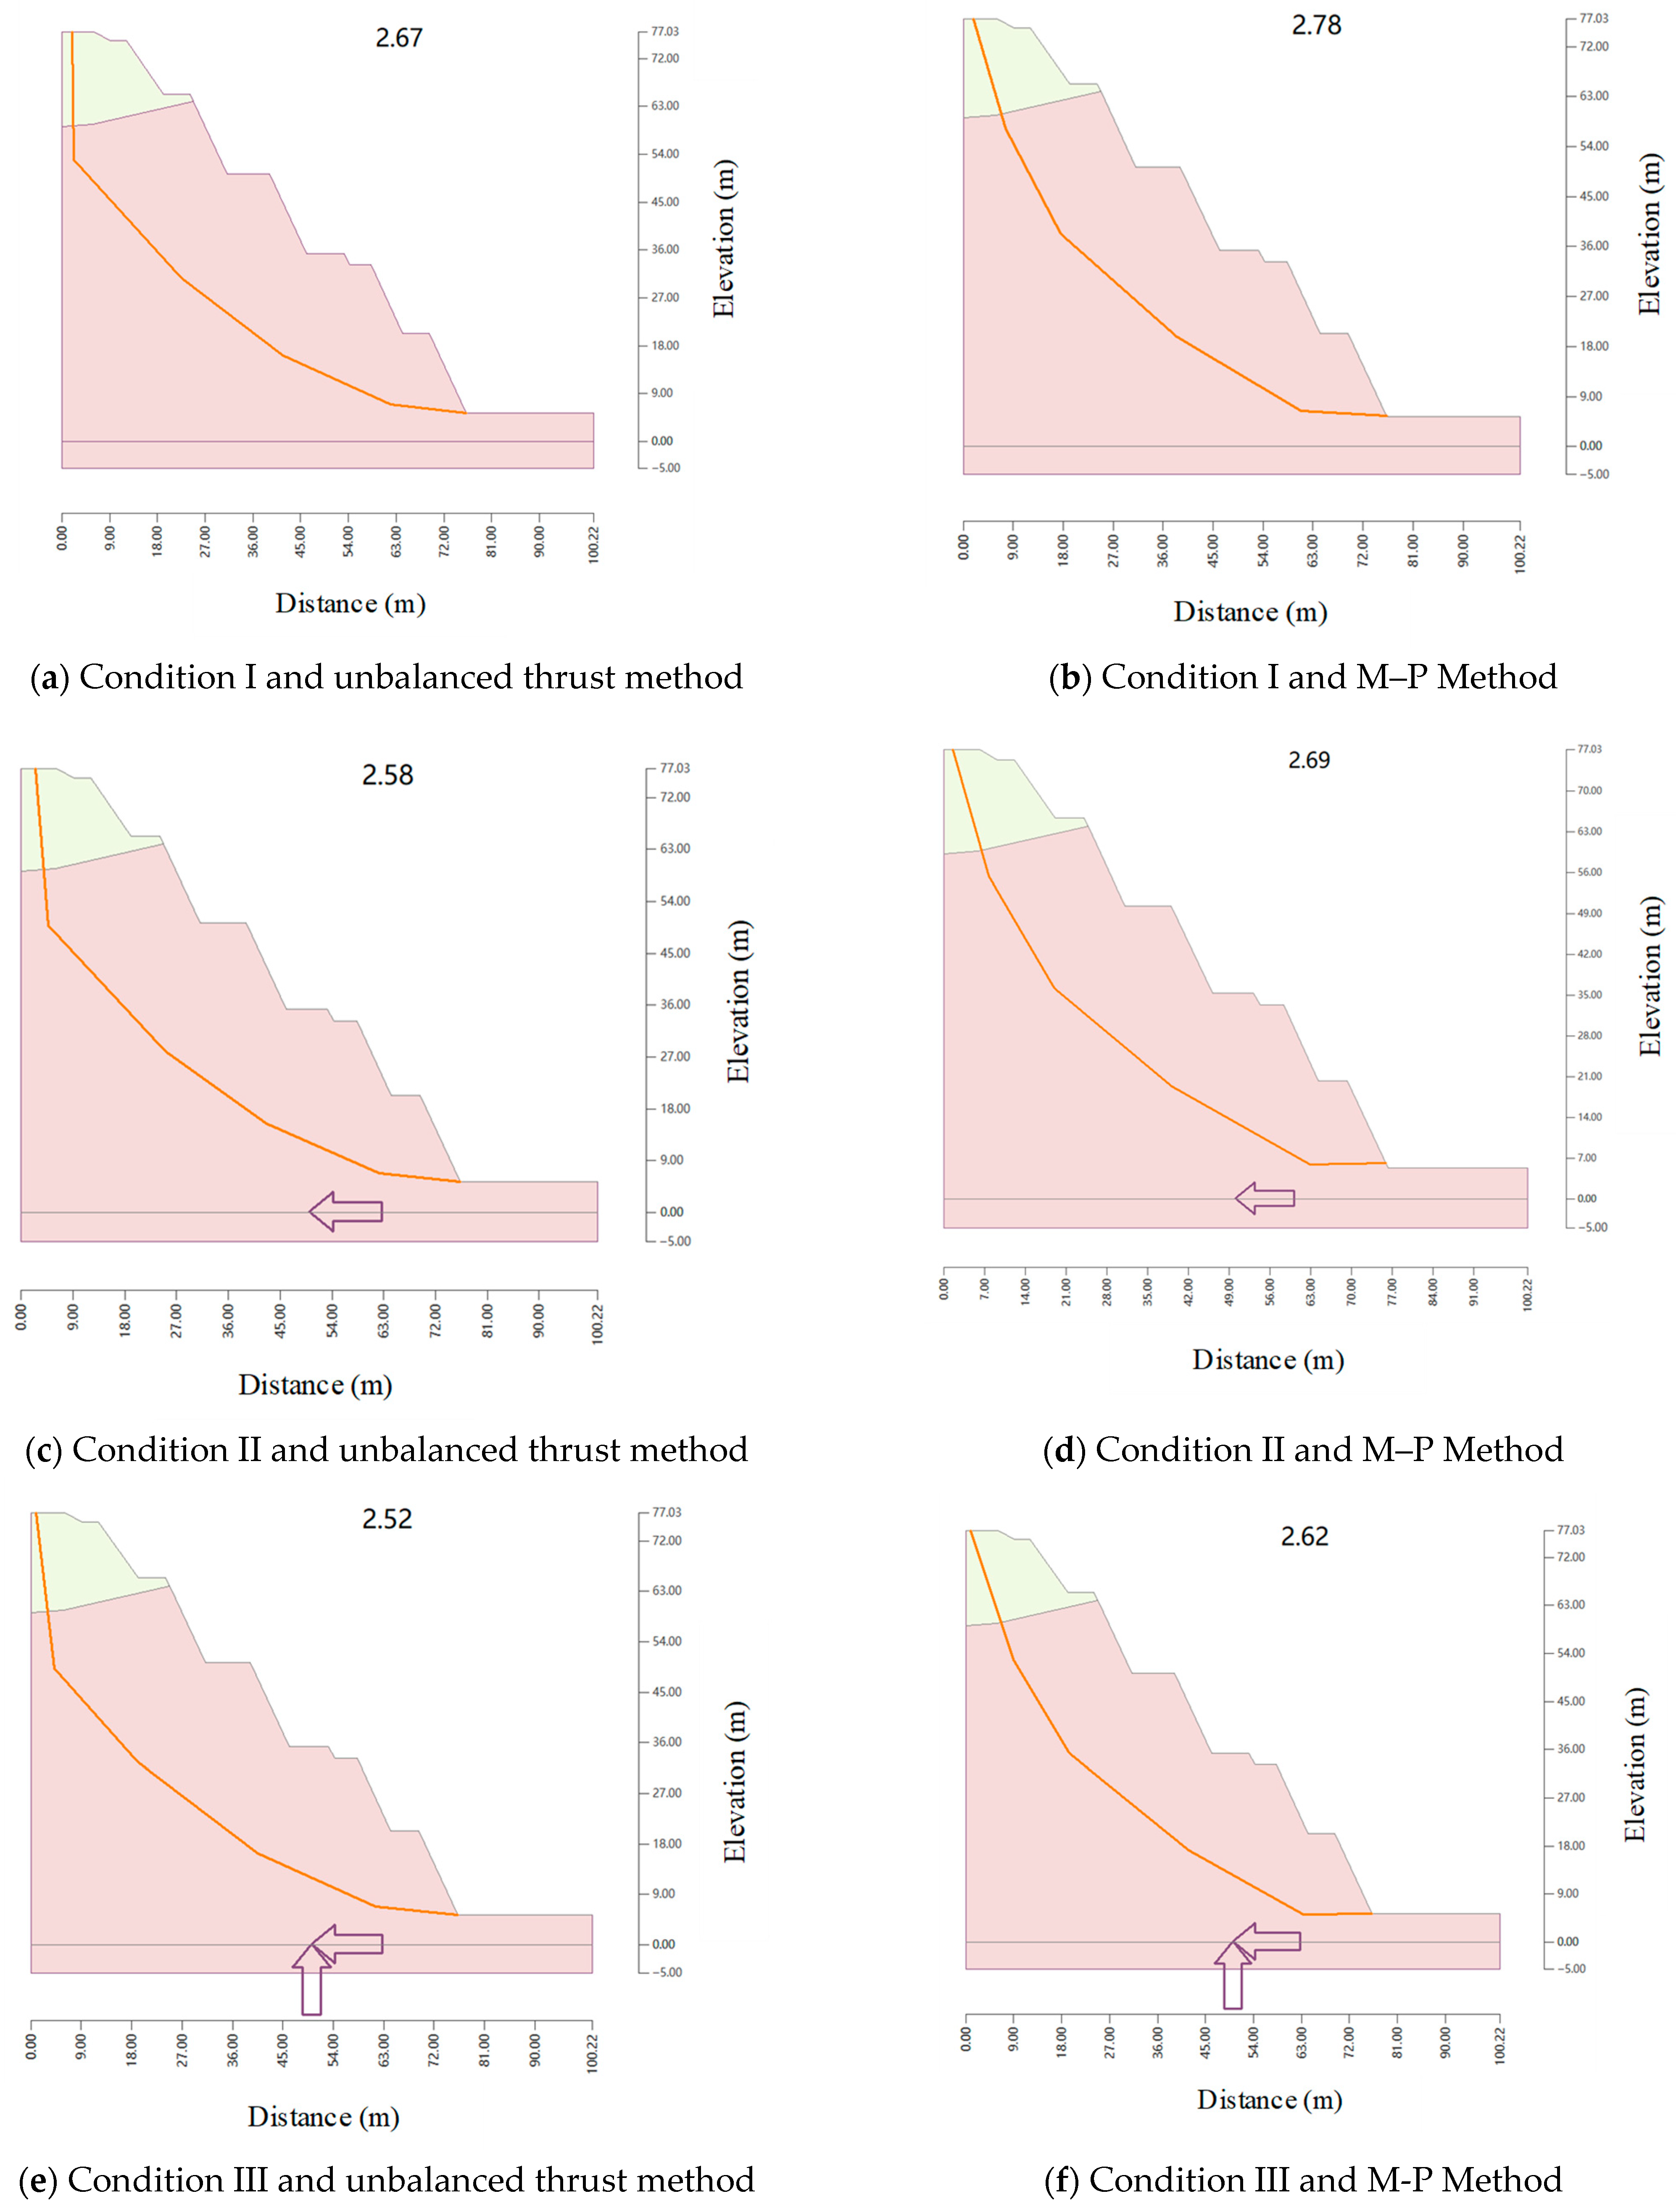
- Engineering Geology
The slightly weathered and fresh granite (ore) has a relatively intact structure, is dense and has high strength, with a typical uniaxial compressive strength (UCS) in the range of 100–180 MPa. Joints and fractures are relatively well-developed. The rock quality designation (RQD) values typically range from 75% to 90%, classifying the rock mass quality as “Good” to “Excellent” according to engineering rock mass classification []. The rock mass is relatively intact to intact, and the slope stability is relatively good.
In contrast, the overlying loose rock mass, primarily consisting of sandy clay and highly weathered rock fragments, exhibits significantly different characteristics. It is distributed in the upper part of the orebody with a typical thickness ranging from 6 to 8 m in residual-slope layers, and 10 to 12 m in moderately weathered zones, with local accumulations exceeding 15 m. This material has a loose soil–rock structure, which is prone to softening and disintegration when exposed to water, resulting in poor stability. Field investigations have identified signs of historical shallow instability, such as small-scale slumps and tension cracks on the surface, particularly after heavy rainfall events. This is consistent with the overall stripping ratio of 0.22:1 in the mining area, reflecting the significant proportion of unstable overburden relative to the competent ore below.
According to the relevant technical specifications [], the mining area is divided into the same zone based on the principle of the same or consistency of major factors such as rock type, structure, engineering geological conditions, and hydrogeological conditions. The mining area mainly exposes granite bodies of different intrusive phases from the Early Cretaceous period. Each rock body has a distinct shape, clear intrusive contact relationships, orderly structural and textural variations, and minimal differences in mineral and chemical composition, indicating a common source evolution. Due to the overall consistency of engineering geological and hydrogeological conditions in the open pit, the mining area is divided into a single engineering geological zone.
- (2)
- Slope Zoning
The engineering geological rock masses are distributed differently in various parts of the open pit, leading to variations in slope design parameters and rock mass deformation types. To accurately reflect the actual conditions of each slope section, it is essential to divide the open pit into several sections based on its actual engineering geological characteristics, considering factors such as rock type, structure, engineering geological, and hydrogeological conditions. This division allows for the establishment of corresponding geological and slope structure models for each section, providing a foundation for slope stability calculations. The principle of slope zoning is to group sections with essentially the same characteristics into the same zone, with each zone’s slope represented by the same set of calculation parameters.
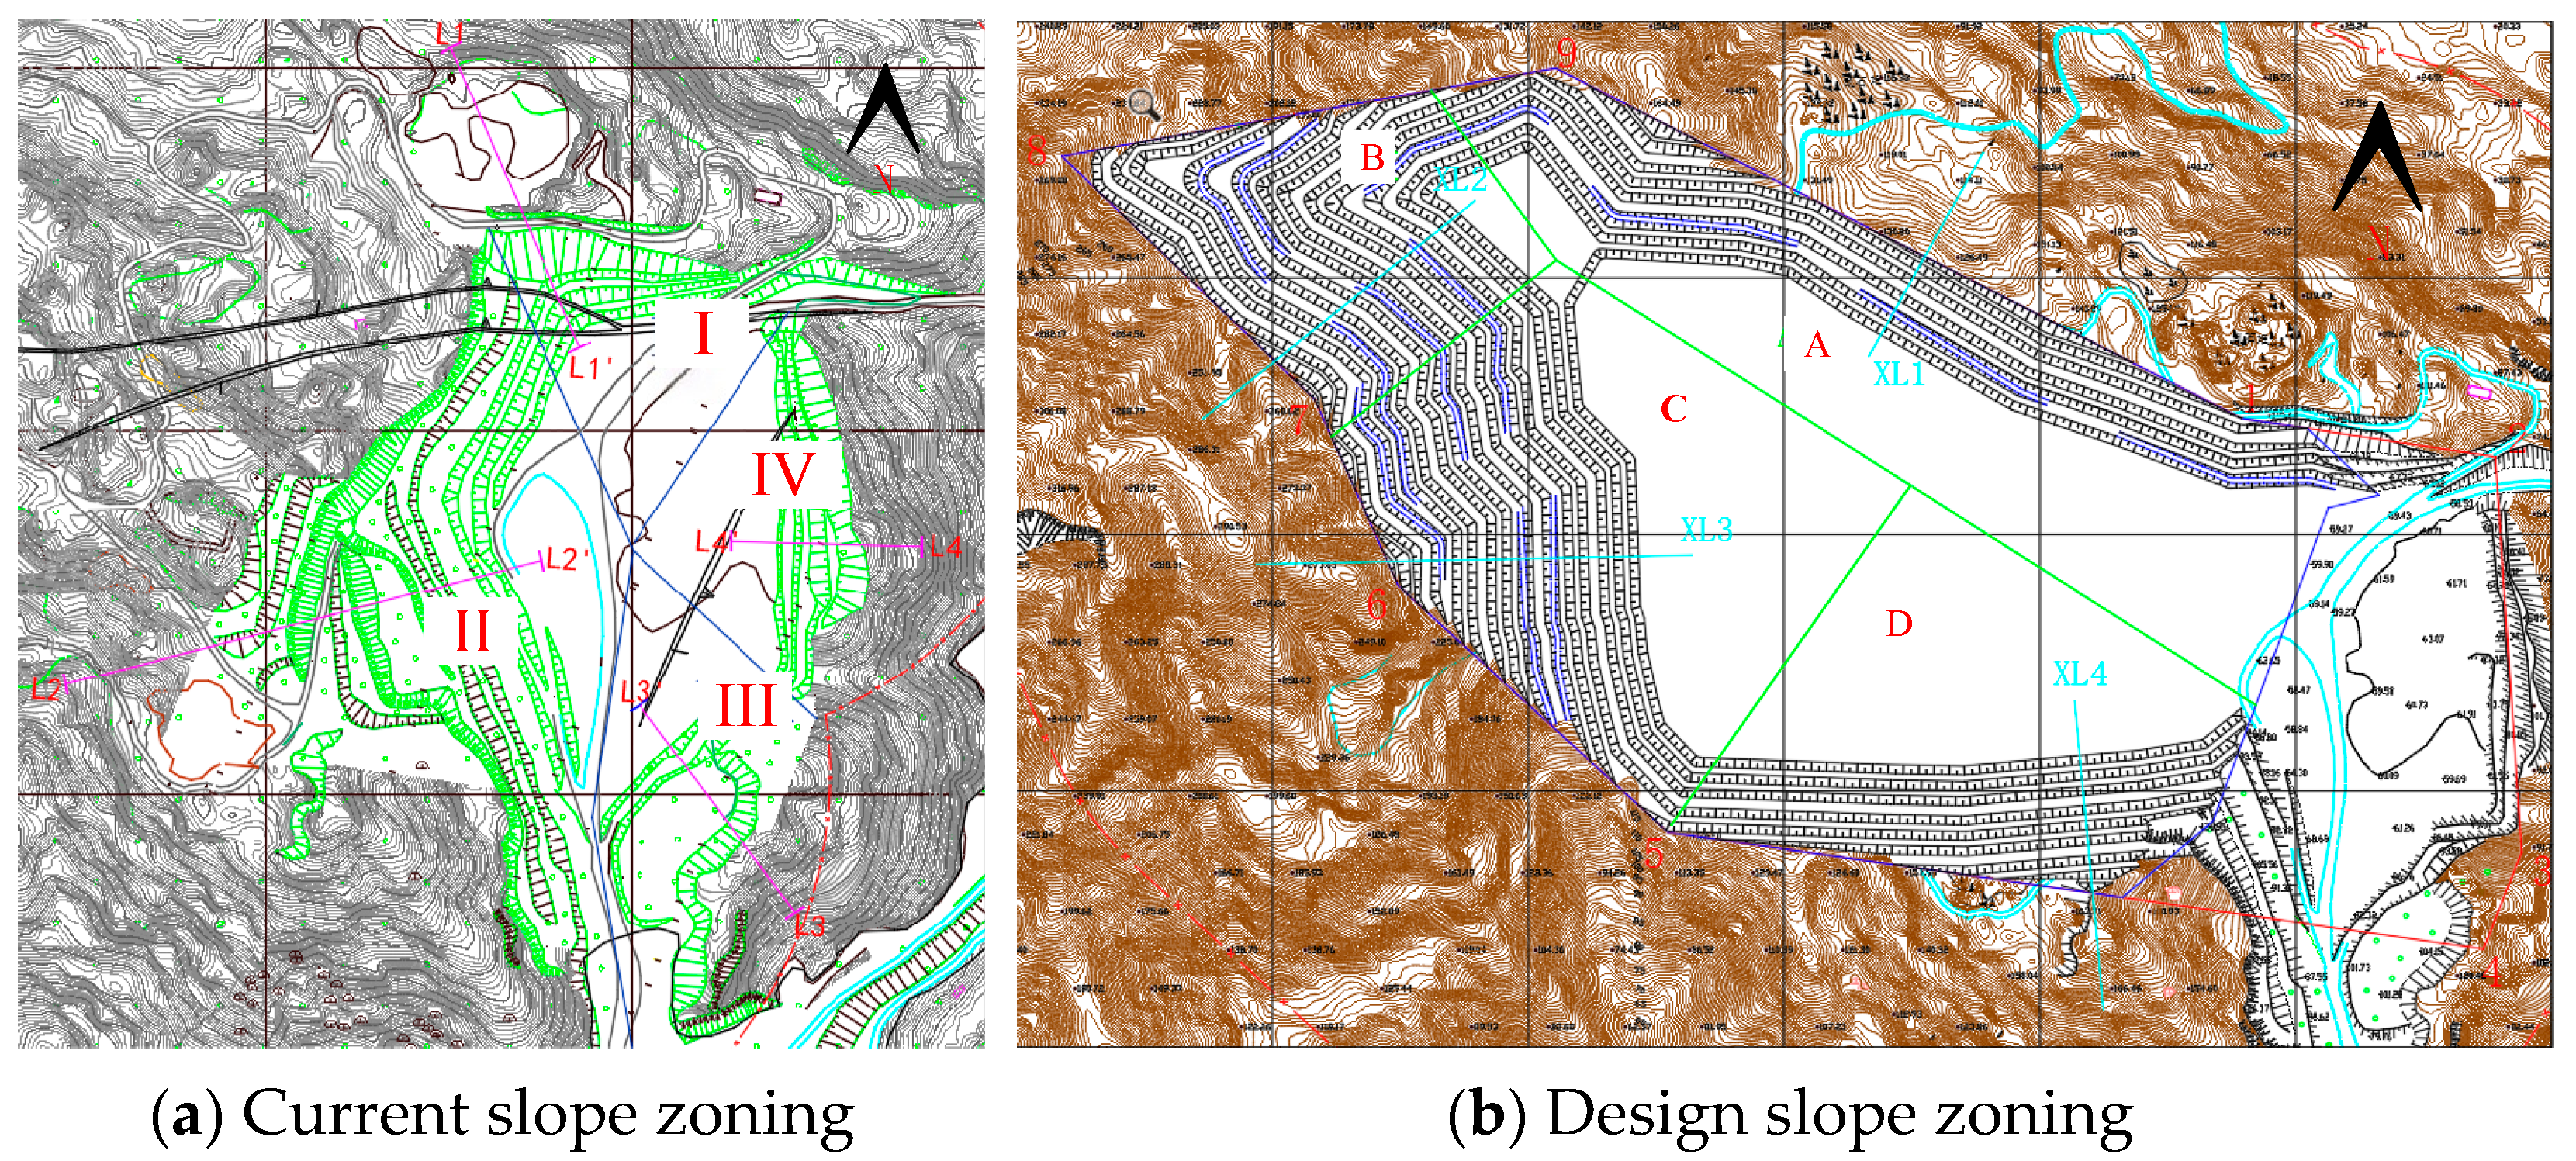
Based on the current mining status and field engineering geological survey results, the main rock type constituting the mine slope is granite. After comprehensively considering factors such as slope parameters, rock mass conditions, geological sections, and joint and fracture surveys, the mine’s existing and designed slopes are divided into zones. Both the existing and designed slopes in the open-pit mining area are divided into four regions. The basis for the existing slope zoning is shown in Table 1 and Figure 2a, and the basis for the designed slope zoning is shown in Table 2 and Figure 2b.

Table 1.
Current slope zoning and structural surface statistics.

Figure 2.
Schematic diagram of slope zoning.

Table 2.
Statistics of slope zoning and structural surfaces.
According to the ore district lithology and landforms, the engineering geology of the ore district is divided into one zone. Then, based on factors like slope geometry and attitude, the existing slopes are divided into four zones, I, II, III, and IV, and the designed slopes into four zones: A, B, C, and D. On this basis, four calculation sections are determined for each slope zone, totaling eight calculation sections for stability analysis.
Based on the open-pit location, drill-hole data, and field structural-plane surveys, joints and fractures are well-developed in the ore district. The joint attitudes, density, and rock mass structural types are shown in Figure 3. Most rock mass structural surfaces are nearly parallel. Vertical and horizontal joints and fractures are prominent. Most structural surfaces are relatively smooth but vary in extension, spaced about 0.13–1 m apart, with straight and tight contact. Locally, they are slightly open, mostly no wider than 3.3 cm, with poor water-transmitting and water-holding properties.

Figure 3.
Mine site.
3. The Slope Analysis Method Is Determined
3.1. Determination of Analysis Method for Current Slope
- (1)
- L1 Section
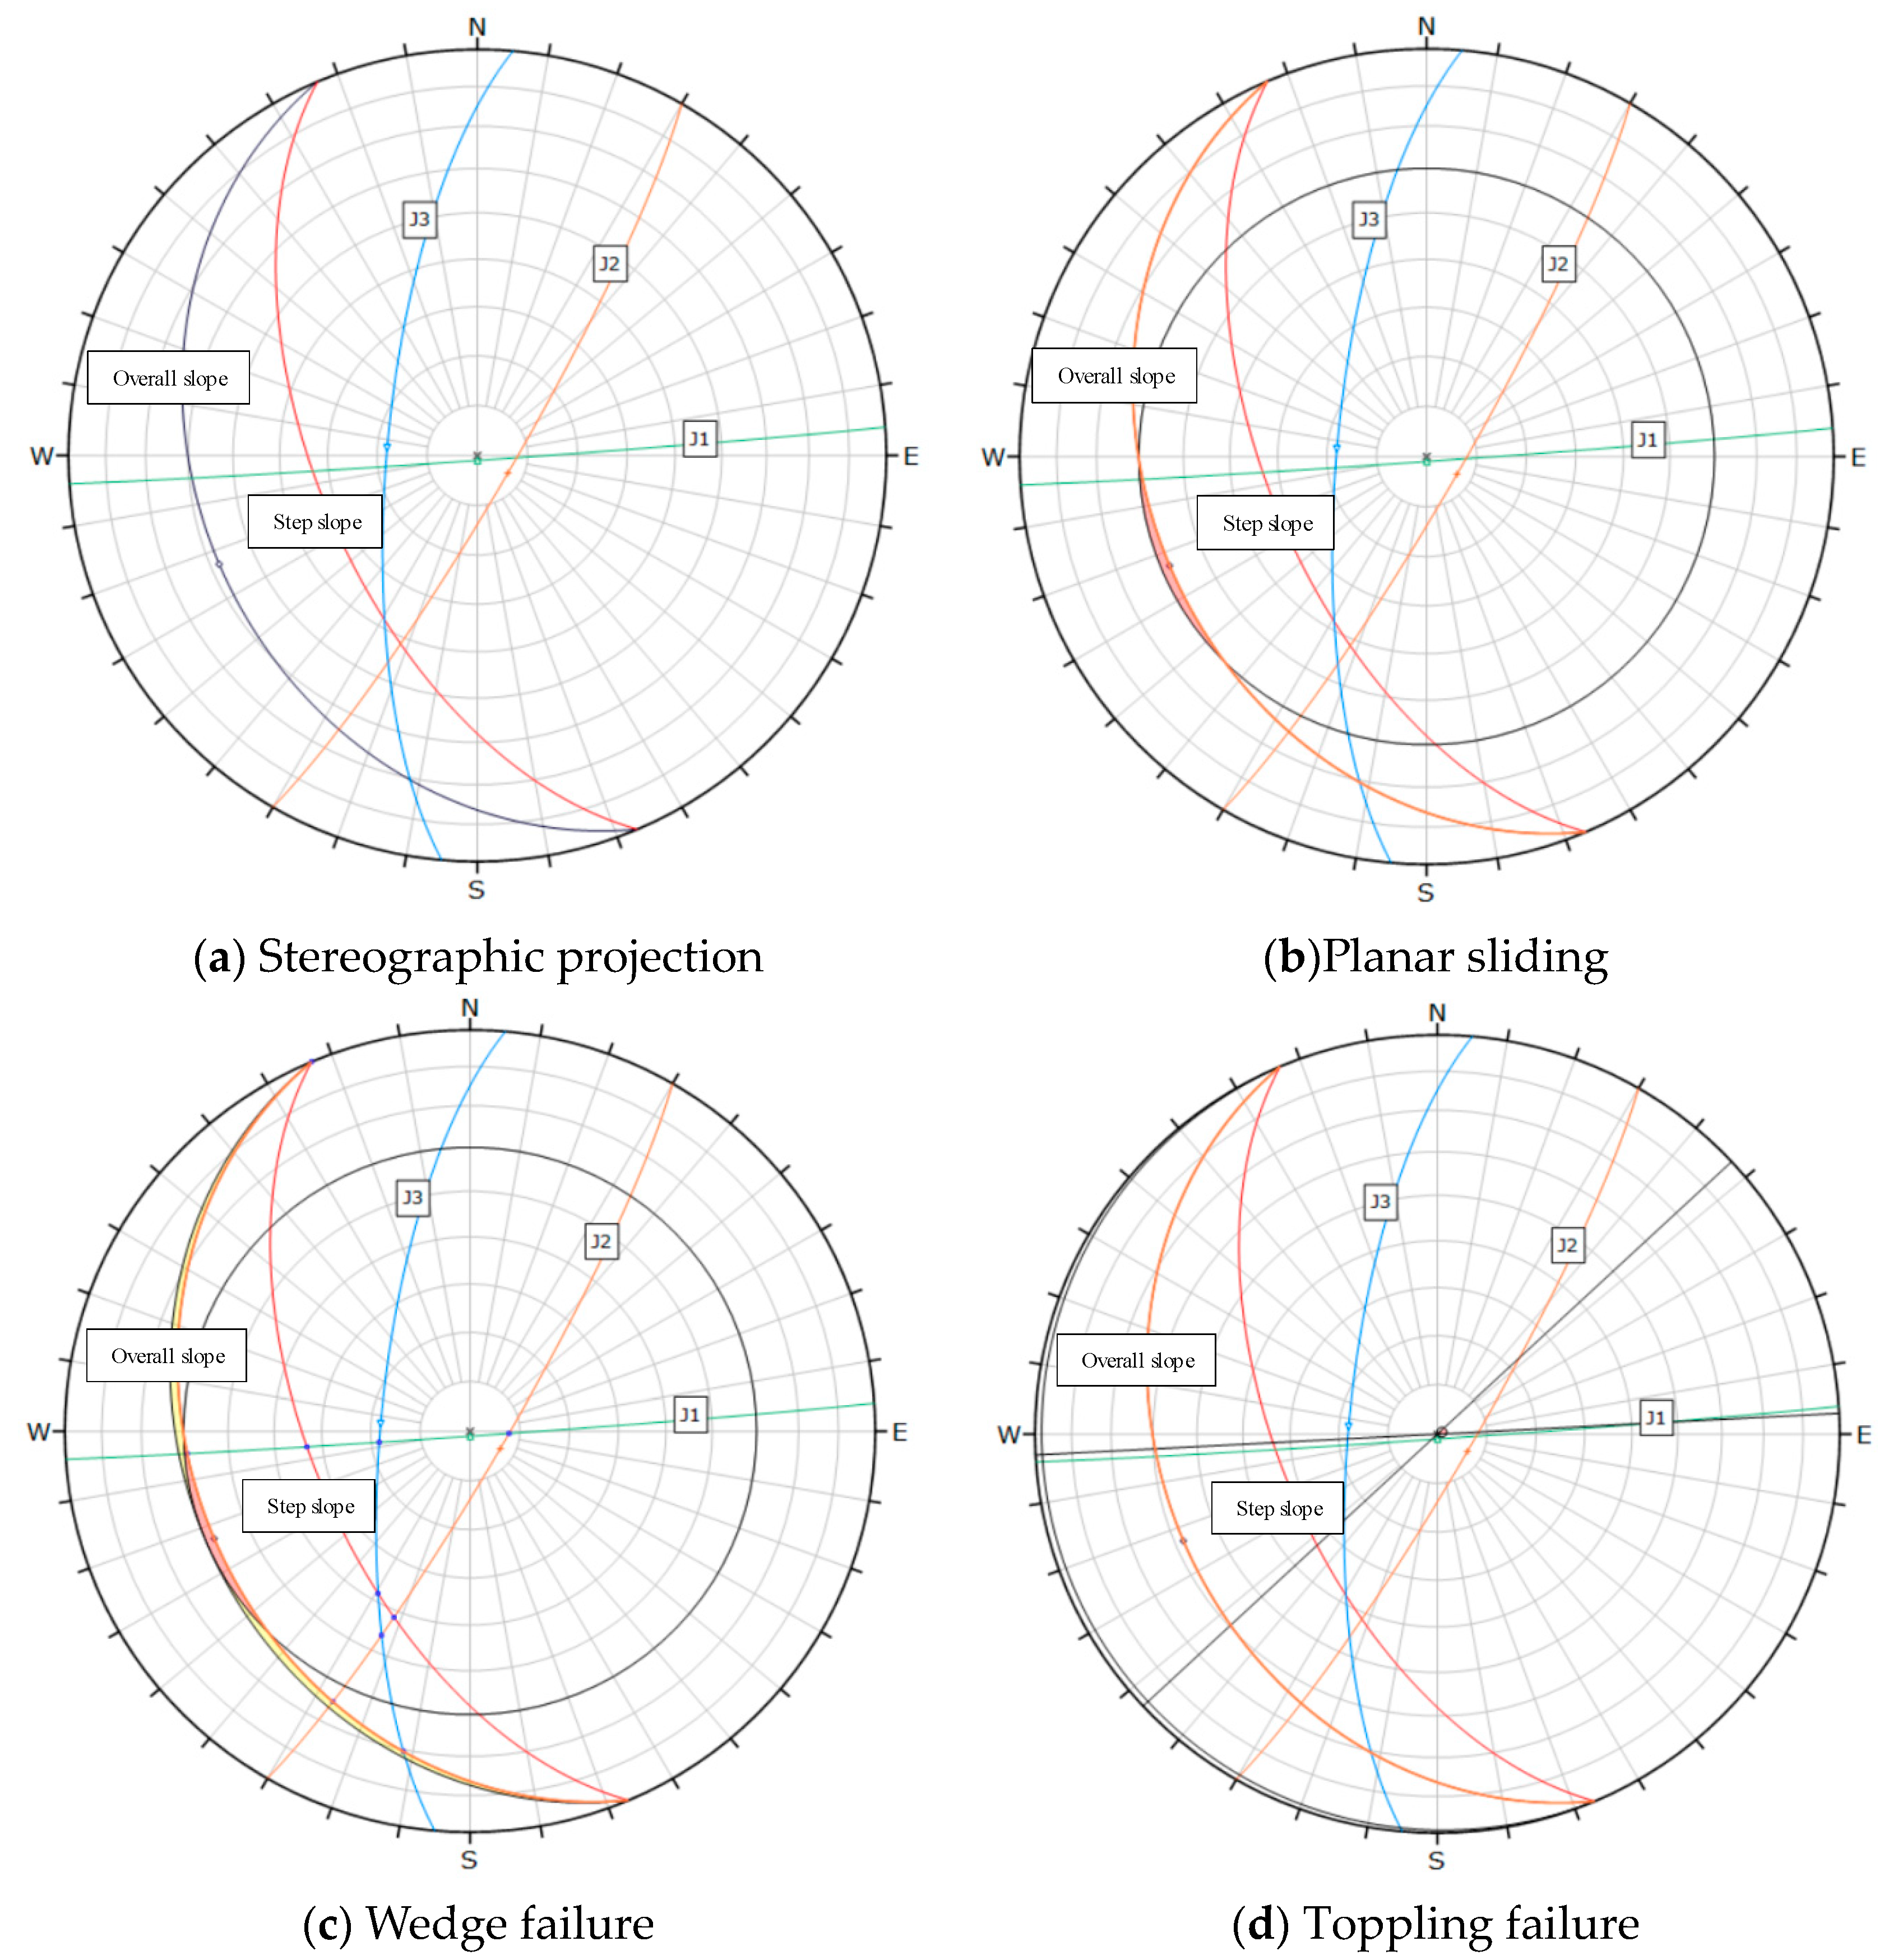
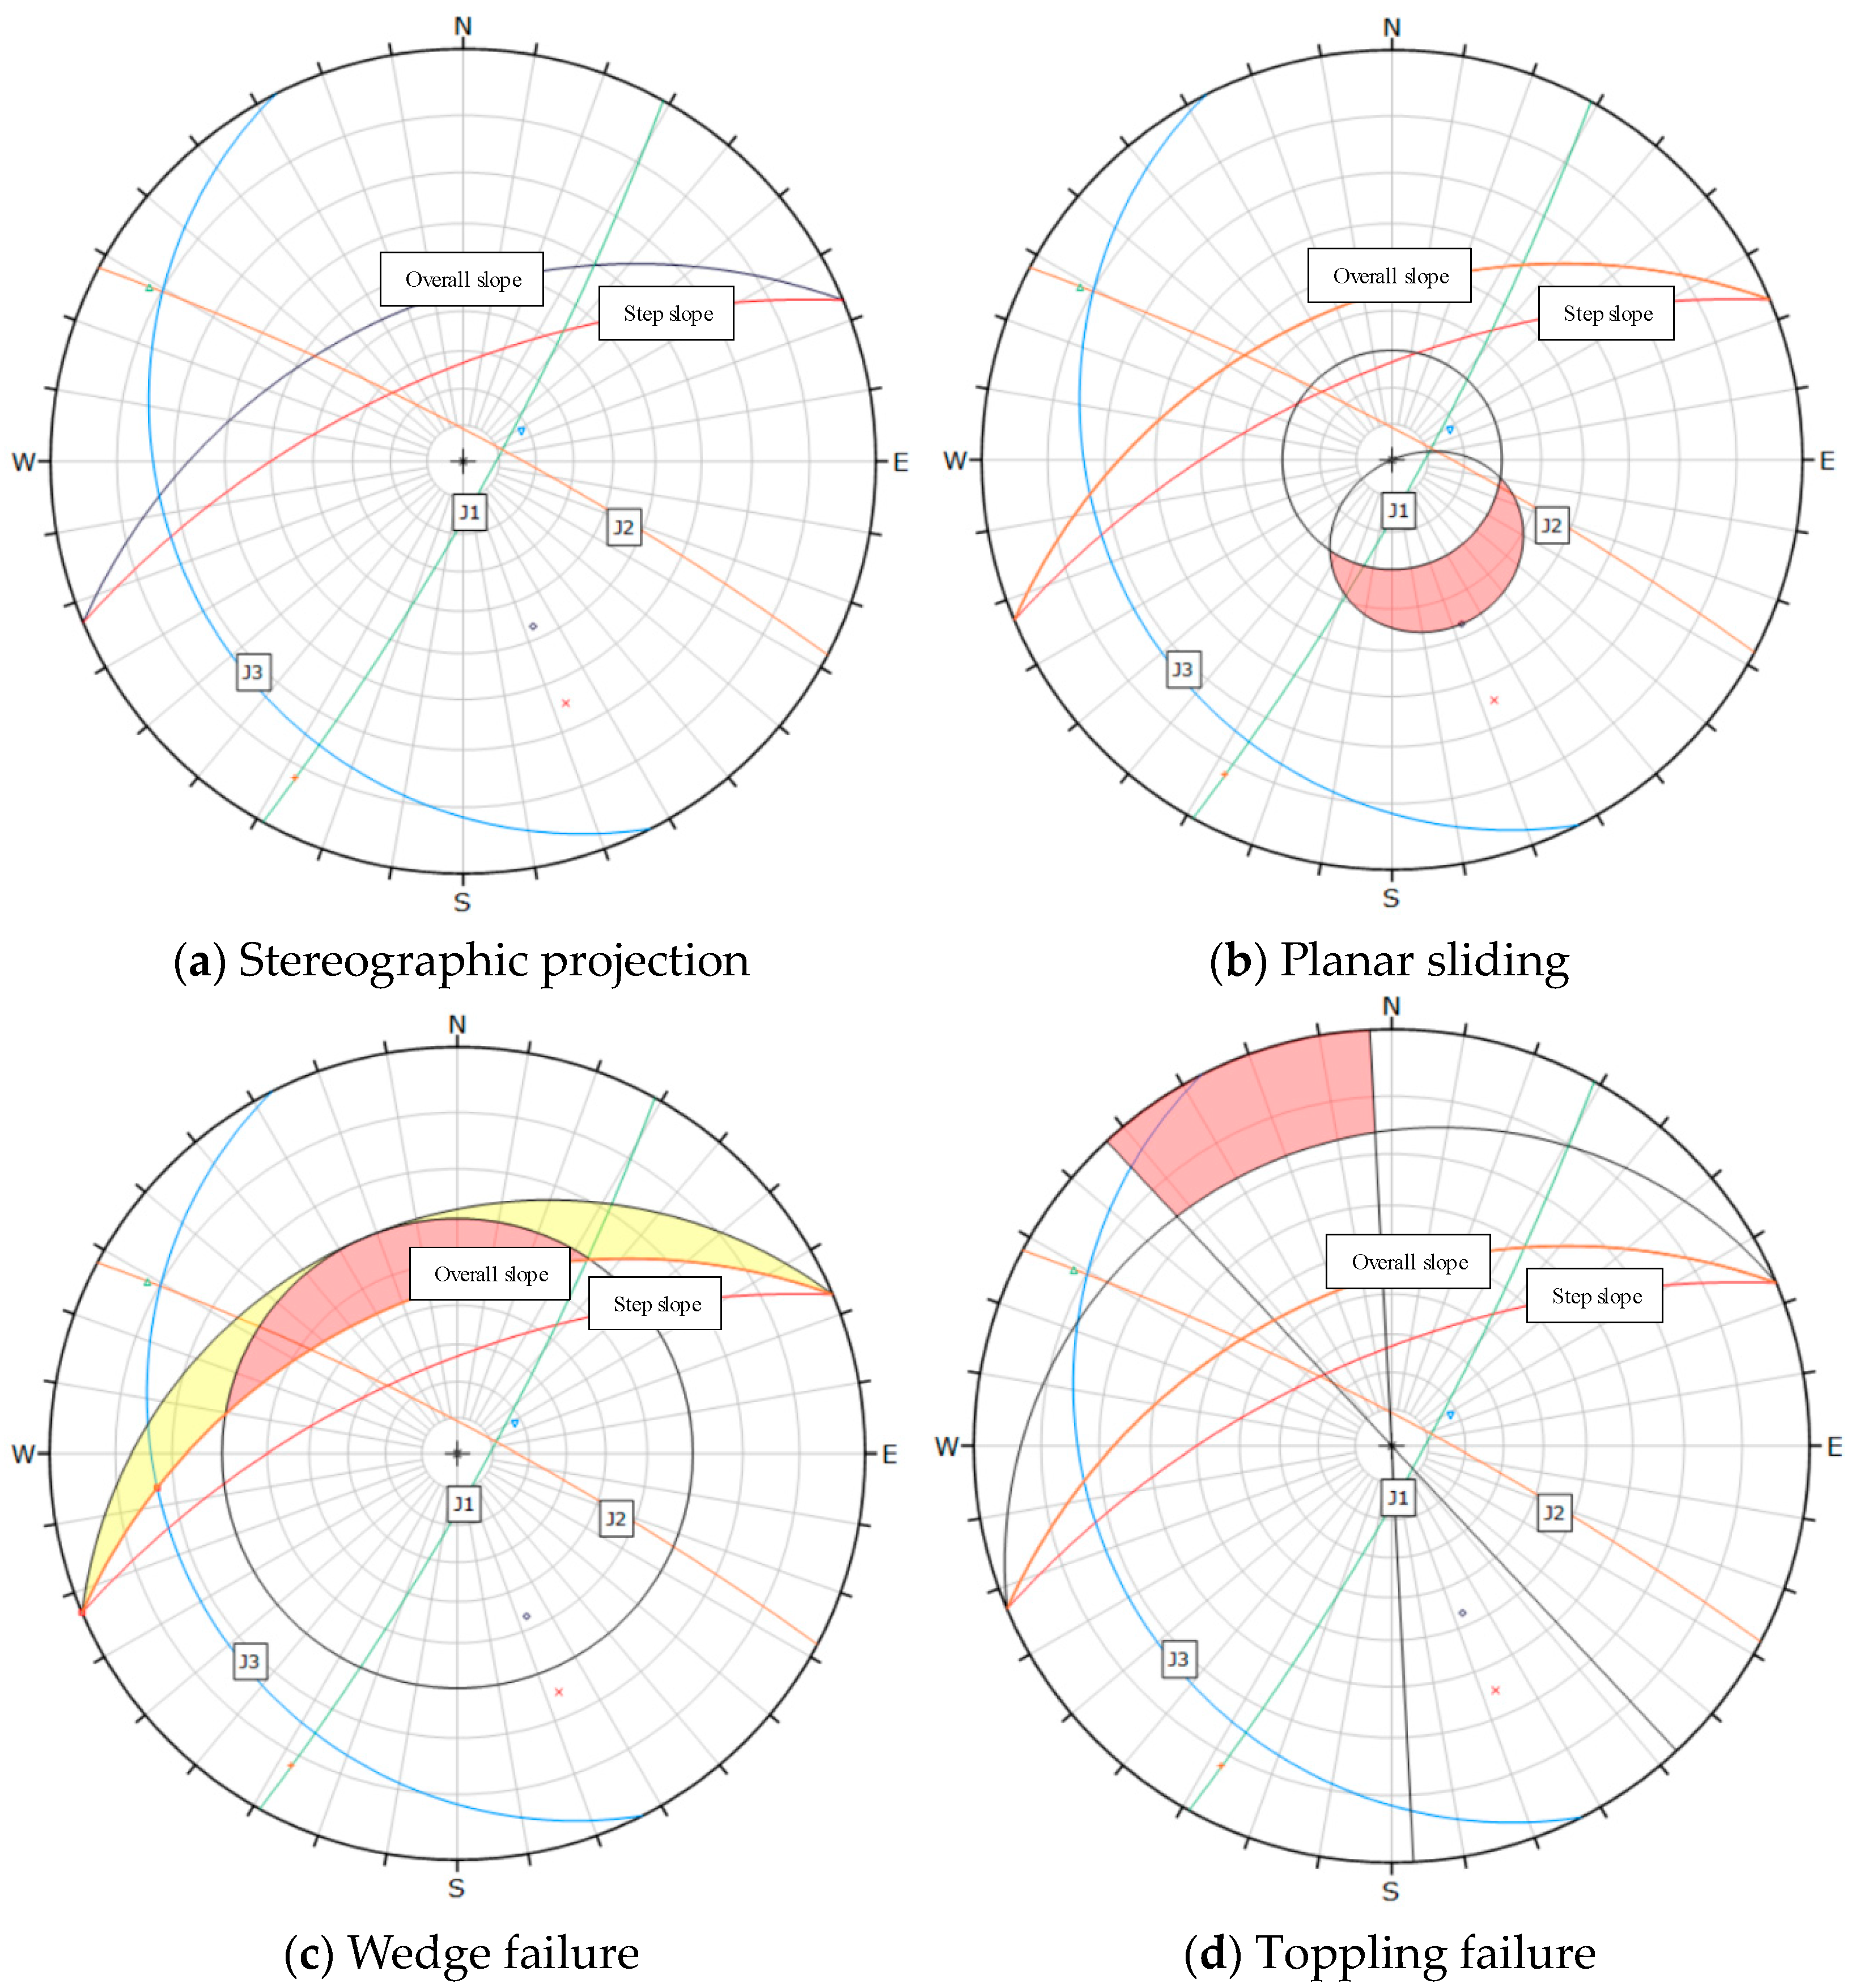
The overall slope of the L1 Section strikes 247° with a dip angle of 32°, while the maximum weathered rock mass step slope strikes 247° with a dip angle of 58° (representative values with a typical measurement tolerance of ±2° to ±5°). According to the calculation results shown in Figure 4, the structural surfaces J1, J2, and J3 intersect the slope face at a large angle, indicating a minor influence on the slope stability. The intersection points formed by J1–J3 are located on the opposite side of the slope, and the dip direction of the combined intersection line is opposite to that of the slope, representing the most stable structure. The intersection points formed by J1–J2 are located on the inner side of the slope, indicating a basically stable structure. The intersection points formed by J2–J3 are located outside the step slope but inside the overall slope. This suggests a basically stable structure for the overall slope, but local wedge-shaped failures may occur in the single step slope. There is no planar sliding or toppling failure. The slope is composed of moderately weathered granite. However, due to historical excavation and blasting, some local fractures are extremely well-developed, and there are large accumulations of collapsed rock debris. The stability of the slope can be analyzed using a composite failure mode. The safety factor is calculated using the Morgenstern–Price (M–P) method [] and the transfer coefficient method (also known as the unbalanced thrust method) [].

Figure 4.
L1 Section structure plane analysis.
- (2)
- L2 Section
The overall slope of the L2 Section strikes 165° with a dip angle of 31°, while the maximum weathered rock mass step slope strikes 165° with a dip angle of 76°. As shown in Figure 5, the structural surfaces J1, J2, and J3 intersect the slope face at a large angle, indicating a minor influence on the slope stability. The intersection points formed by J1–J2 are located on the inner side of the slope, indicating a basically stable structure. The intersection points formed by J2–J3 are located outside the step slope but inside the overall slope. This suggests a basically stable structure for the overall slope, but local wedge-shaped failure may occur in the single step slope. The intersection points formed by J1–J3 are located on the opposite side of the slope, and the dip direction of the combined intersection line is opposite to that of the slope, representing the most stable structure. There is no planar sliding or toppling failure. The slope is composed of moderately weathered granite. However, due to historical excavation and blasting, some local fractures are extremely well-developed, and there are many collapsed gravel. The stability of the slope can be analyzed using a composite failure mode. The safety factor is calculated using the M-P method and the thrust imbalance method.

Figure 5.
L2 Section structure plane analysis.
- (3)
- L3 Section
The overall slope of the L3 Section strikes 233° with a dip angle of 31°, while the maximum weathered rock mass step slope strikes 233° with a dip angle of 55°. As shown in calculation result Figure 6, structural surfaces J1, J2 and J3 intersect the slope face at a large angle, indicating a minor effect on slope stability. The intersection points of J1–J2 are on the inner side of the slope, representing a basically stable structure. The intersection points of J2–J3 are outside the step slope but within the overall slope, suggesting that while the overall slope is basically stable, local wedge-shaped failures might occur in the individual step slope. The combination of J1–J2 and J1–J3 intersection points are on the opposite side of the slope. The dip direction of the combined intersection line is opposite to that of the slope, which is the most stable structure. There is no planar or toppling failure. The slope is composed of moderately weathered granite. However, due to historical excavation and blasting, some local fractures are extremely well-developed, and there is a lot of collapsed gravel. The stability of the slope can be analyzed using a composite failure mode. The safety factor is calculated using the M-P method and the thrust imbalance method.

Figure 6.
L3 Section structure plane analysis.
- (4)
- L4 Section
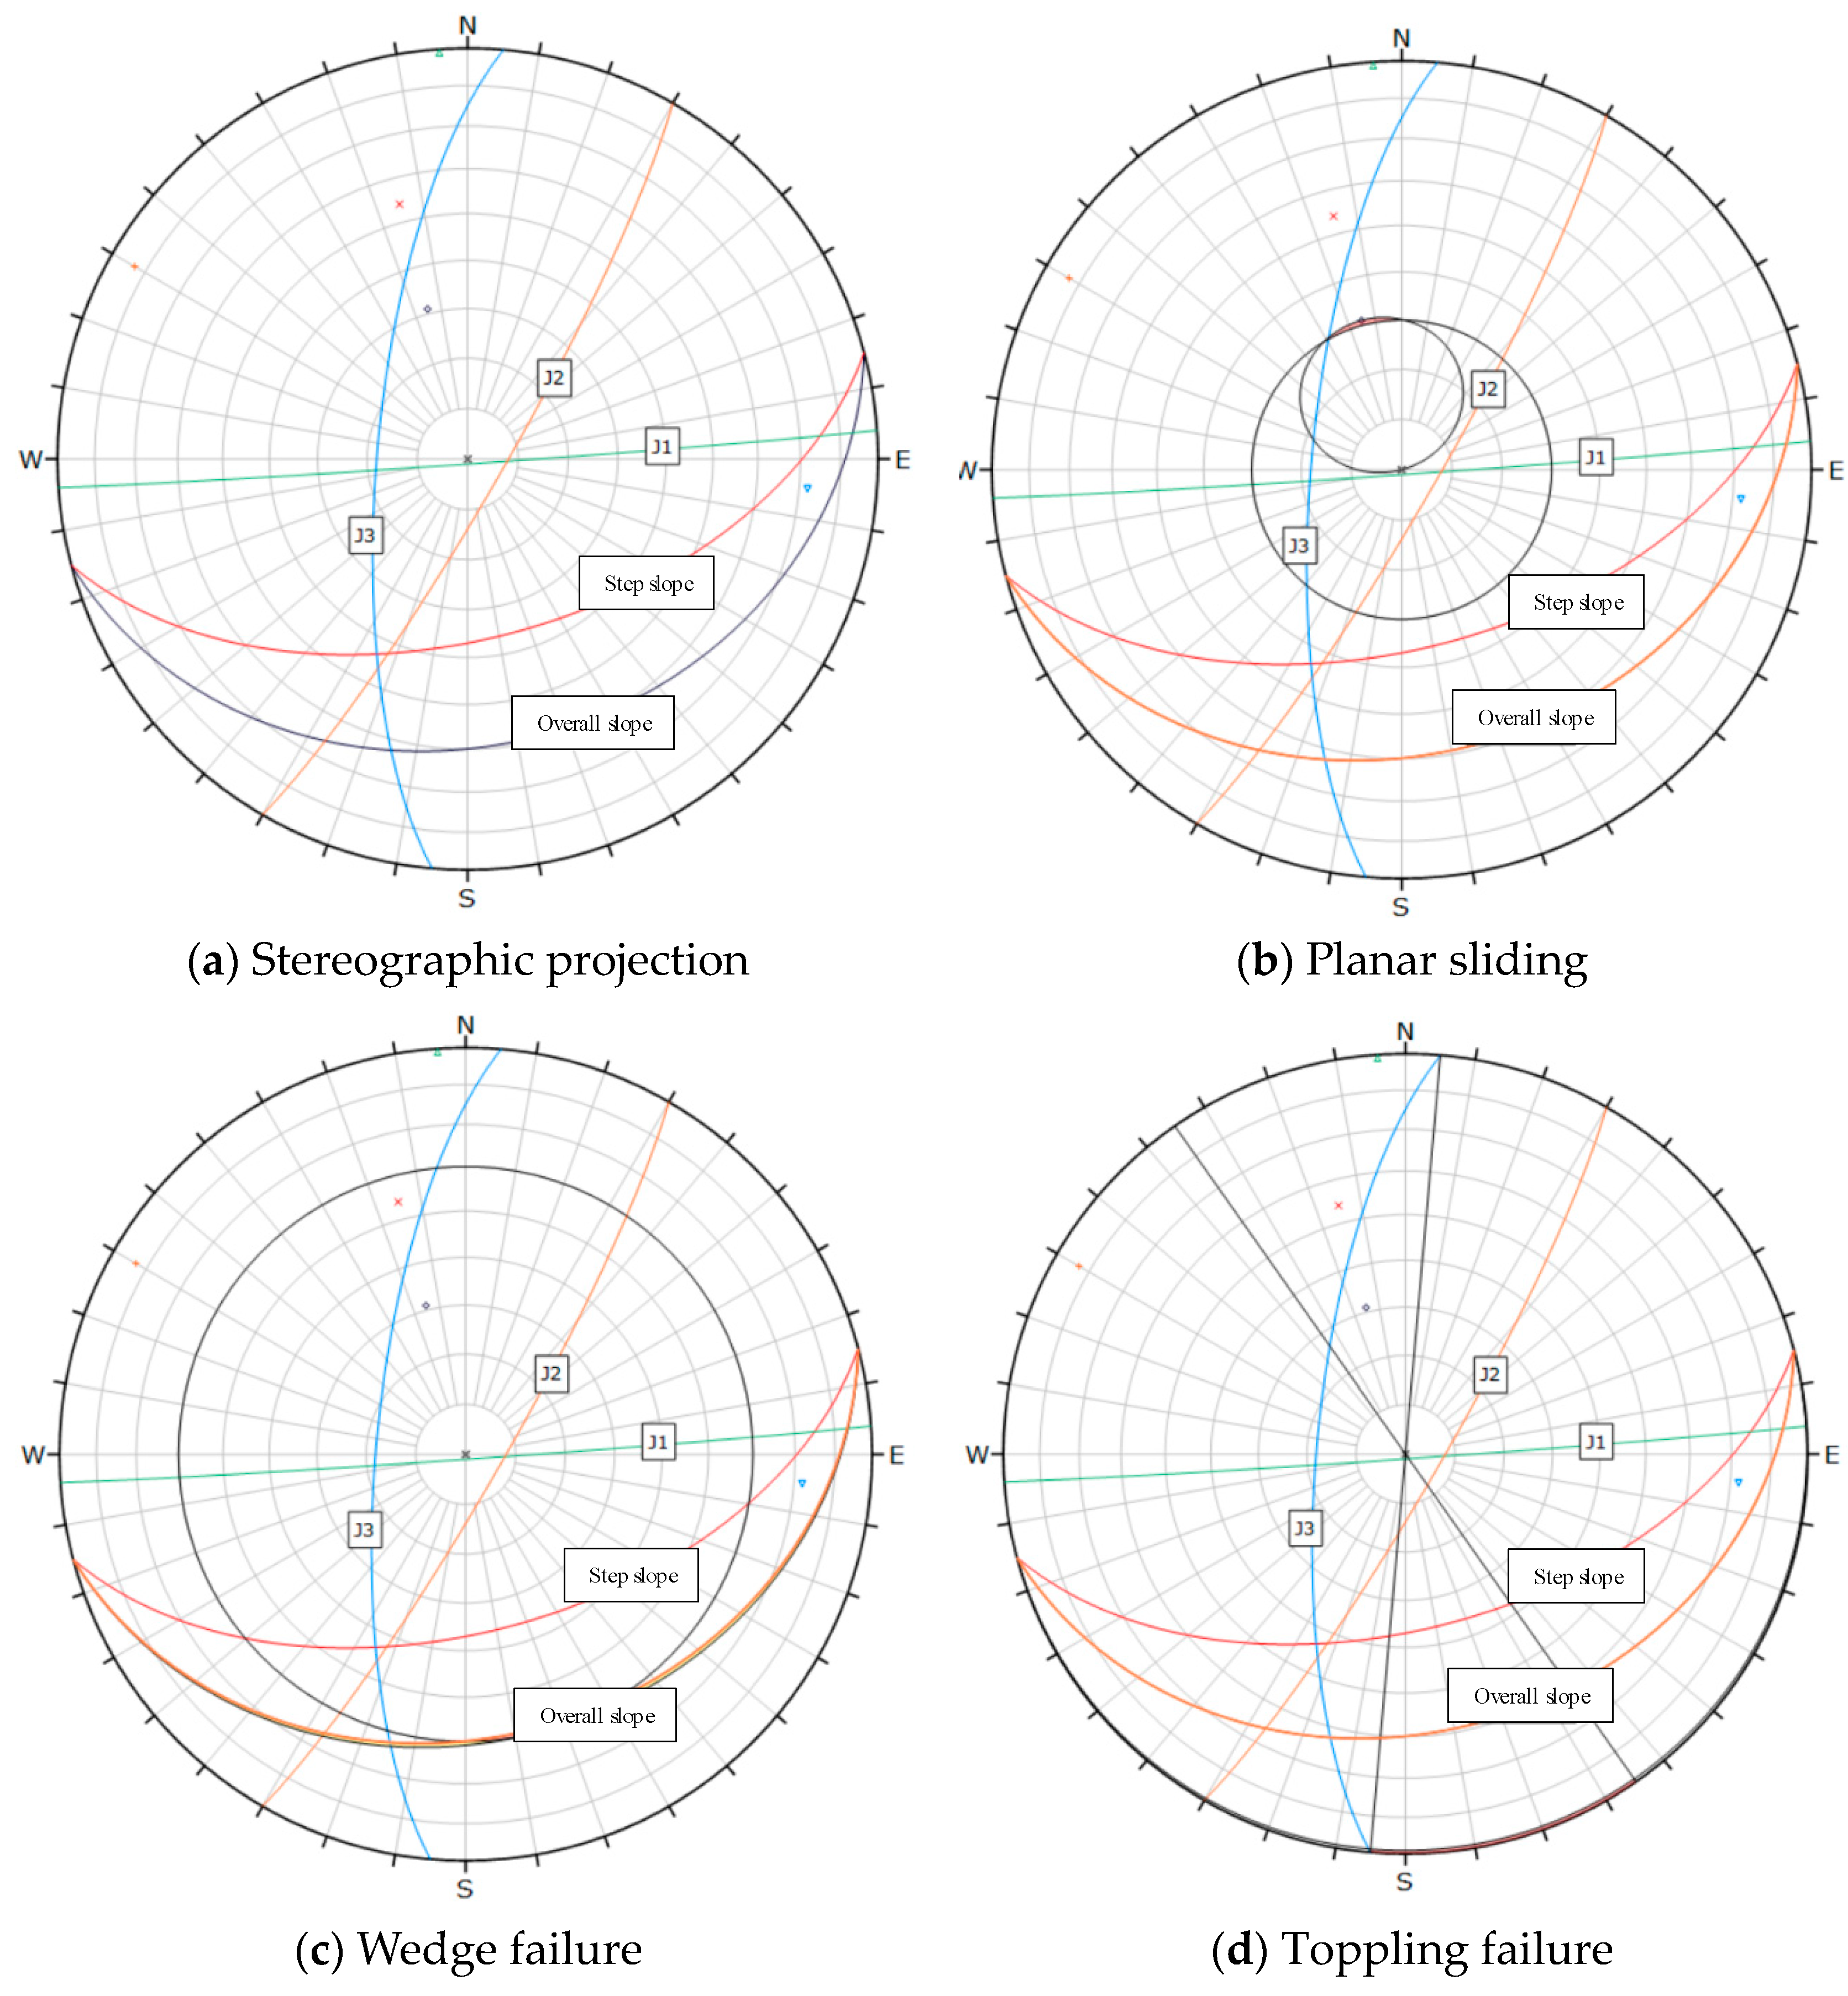
The overall slope of the L4 Section strikes 182° with a dip angle of 39°, while the maximum weathered rock mass step slope strikes 182° with a dip angle of 69°. As indicated in Calculation Result Figure 7, structural surfaces J1, J2 and J3 intersect the slope face at a large angle, suggesting a minor impact on slope stability. The intersection points formed by J1–J3 are situated on the opposite side of the slope, and the dip direction of the combined intersection line is opposite to that of the slope, which is the most stable structure. The intersection points formed by J1–J2 are located on the inner side of the slope, indicating a basically stable structure. The intersection points formed by J2–J3 are positioned outside the step slope but within the overall slope. This implies that the overall slope is basically stable, but local wedge-shaped failures might occur in the individual step slope. There is no planar or toppling failure. The slope is composed of moderately weathered granite. However, due to historical excavation and blasting, some local fractures are extremely well-developed, and there is a significant amount of collapsed gravel. The stability of the slope can be analyzed using a composite failure mode. The safety factor is calculated using the M-P method and the thrust imbalance method.

Figure 7.
L4 Section structure plane analysis.
3.2. The Design Slope Analysis Method Is Determined
- (1)
- Area A
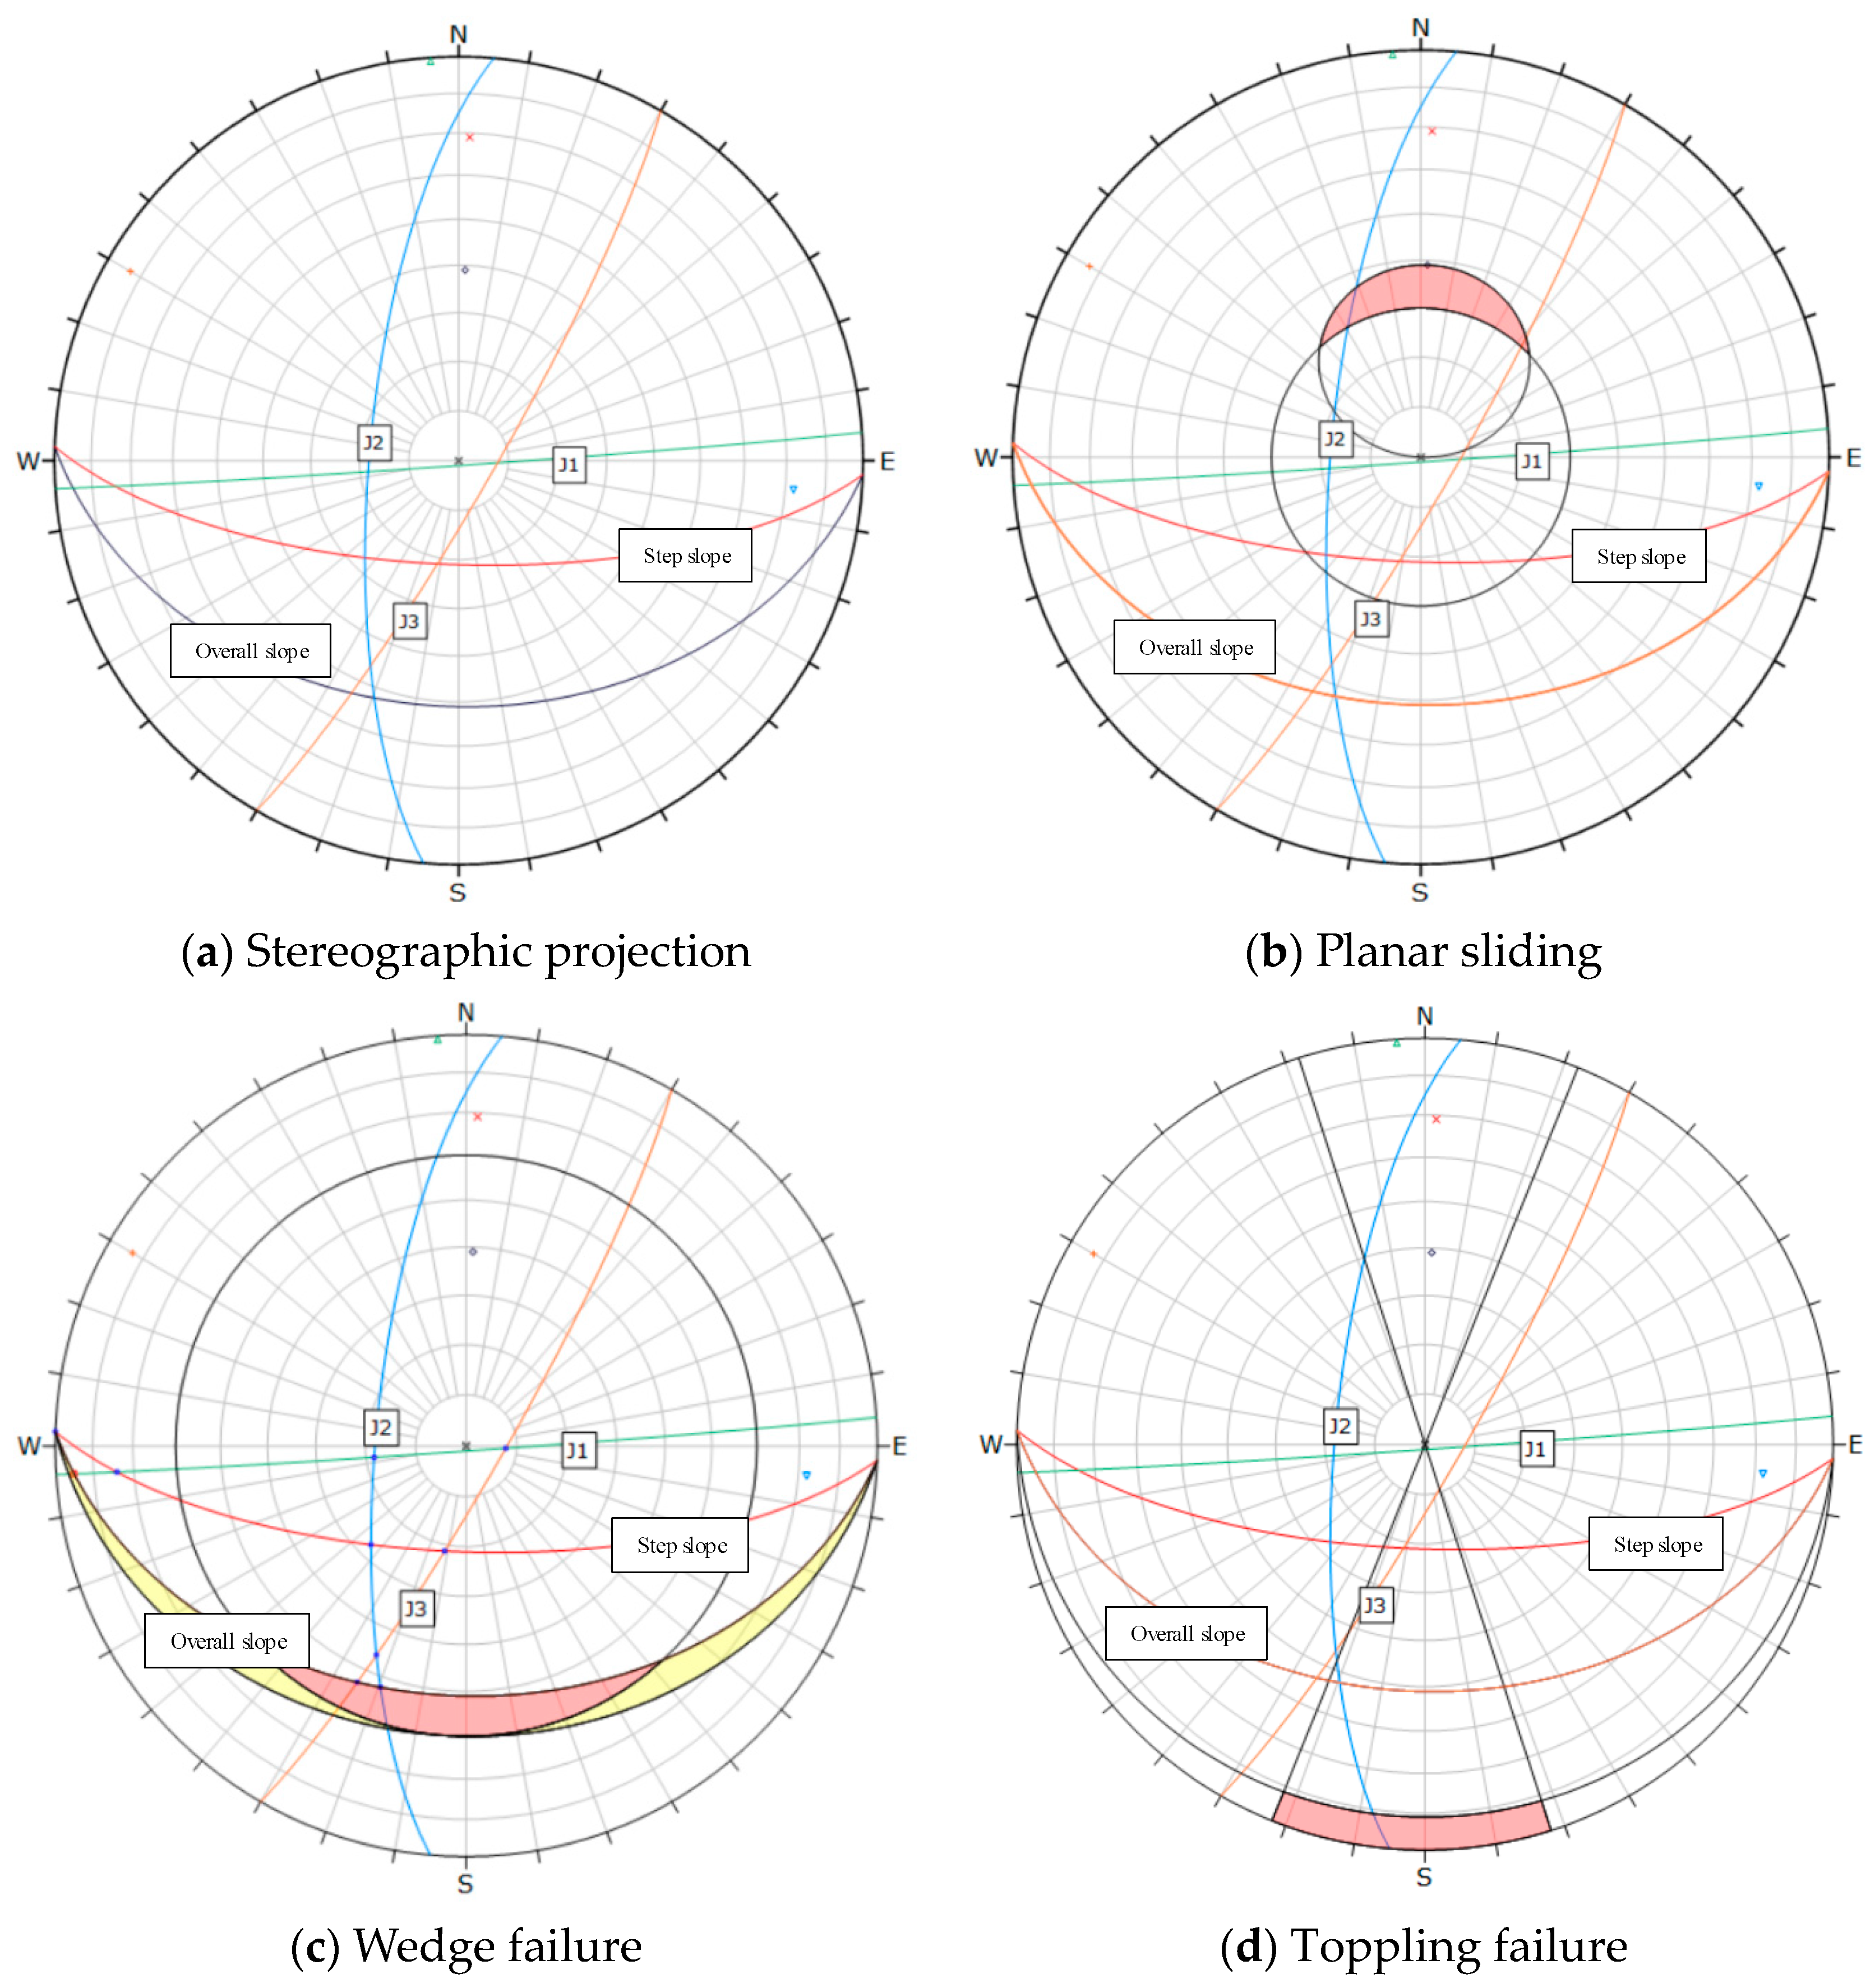
The overall slope angle of Area A is 46°, with a bench slope face angle of 65°. There are 3 main joint sets in this area. The dominant structural surfaces are J1 (strike 177°, dip 85°), J2 (strike 358°, dip 86°), and J3 (strike 285°, dip 74°). For the XL1 Section, the overall slope strikes 134° with a dip angle of 46°, while the weathered rock mass step slope strikes 134° with a dip angle of 65°. As shown in Figure 8, structural surfaces J1, J2, and J3 intersect the slope face at a large angle, indicating a minor influence on slope stability. The intersection points of J1–J2 are located outside the slope, where wedge-shaped failure may occur. The combination of J1–J3 and J2–J3 intersection points are on the opposite side of the slope. The dip direction of the combined intersection line is opposite to that of the slope, representing the most stable structure. There is no planar sliding or toppling failure. The upper part of the overall slope is strongly weathered granite with a small thickness, so local stability analysis is not required. The lower part is moderately weathered granite. The stability of the overall slope can be analyzed using a composite failure mode. The safety factor is calculated using the M-P method and the thrust imbalance method.

Figure 8.
Sectional structure analysis of XL1.
- (2)
- XL2 Section Line
The overall slope angle of Area B is 49°, with the bench slope face angle being 53° in the moderately weathered layer and 65° in the slightly weathered layer. No structural surfaces were identified at the survey points in this area. The upper part of the overall slope comprises moderately weathered granite, while the lower part is slightly weathered granite. The stability of the overall slope can be analyzed using a composite failure mode, with the safety factor computed by the M-P method and the thrust imbalance method.
- (3)
- XL3 Section Line
The overall slope angle of Area C is 44°. Specifically, the micro-weathered layer bench slope angle is 65°, the moderately weathered layer bench slope angle is 55°, and the fully weathered layer bench slope angle ranges from 45° to 53°. There are 2 main joint sets in this area. The dominant structural surfaces are J1 (strike 40°, dip 75°) and another set (strike 155°, dip 42°). For the XL3 Section, the overall slope strikes 179° with a dip angle of 44°, while the weathered rock mass step slope strikes 179° with a dip angle of 65°. As shown in Figure 9, structural surfaces J1 and J2 intersect the slope face at a large angle, indicating a minor influence on slope stability. The intersection points of J1–J2 are located on the inner side of the slope, indicating a basically stable structure. There is no planar sliding or toppling failure. The upper part of the overall slope is strongly weathered granite with a considerable thickness, which may lead to approximate circular arc failure. The simplified Bishop method and M–P method should be used for local stability calculations. The stability of the overall slope can be analyzed using an approximate circular arc failure mode, with the safety factor calculated by the M-P method and the thrust imbalance method.

Figure 9.
Sectional structure analysis of XL3.
- (4)
- XL4 Section Line
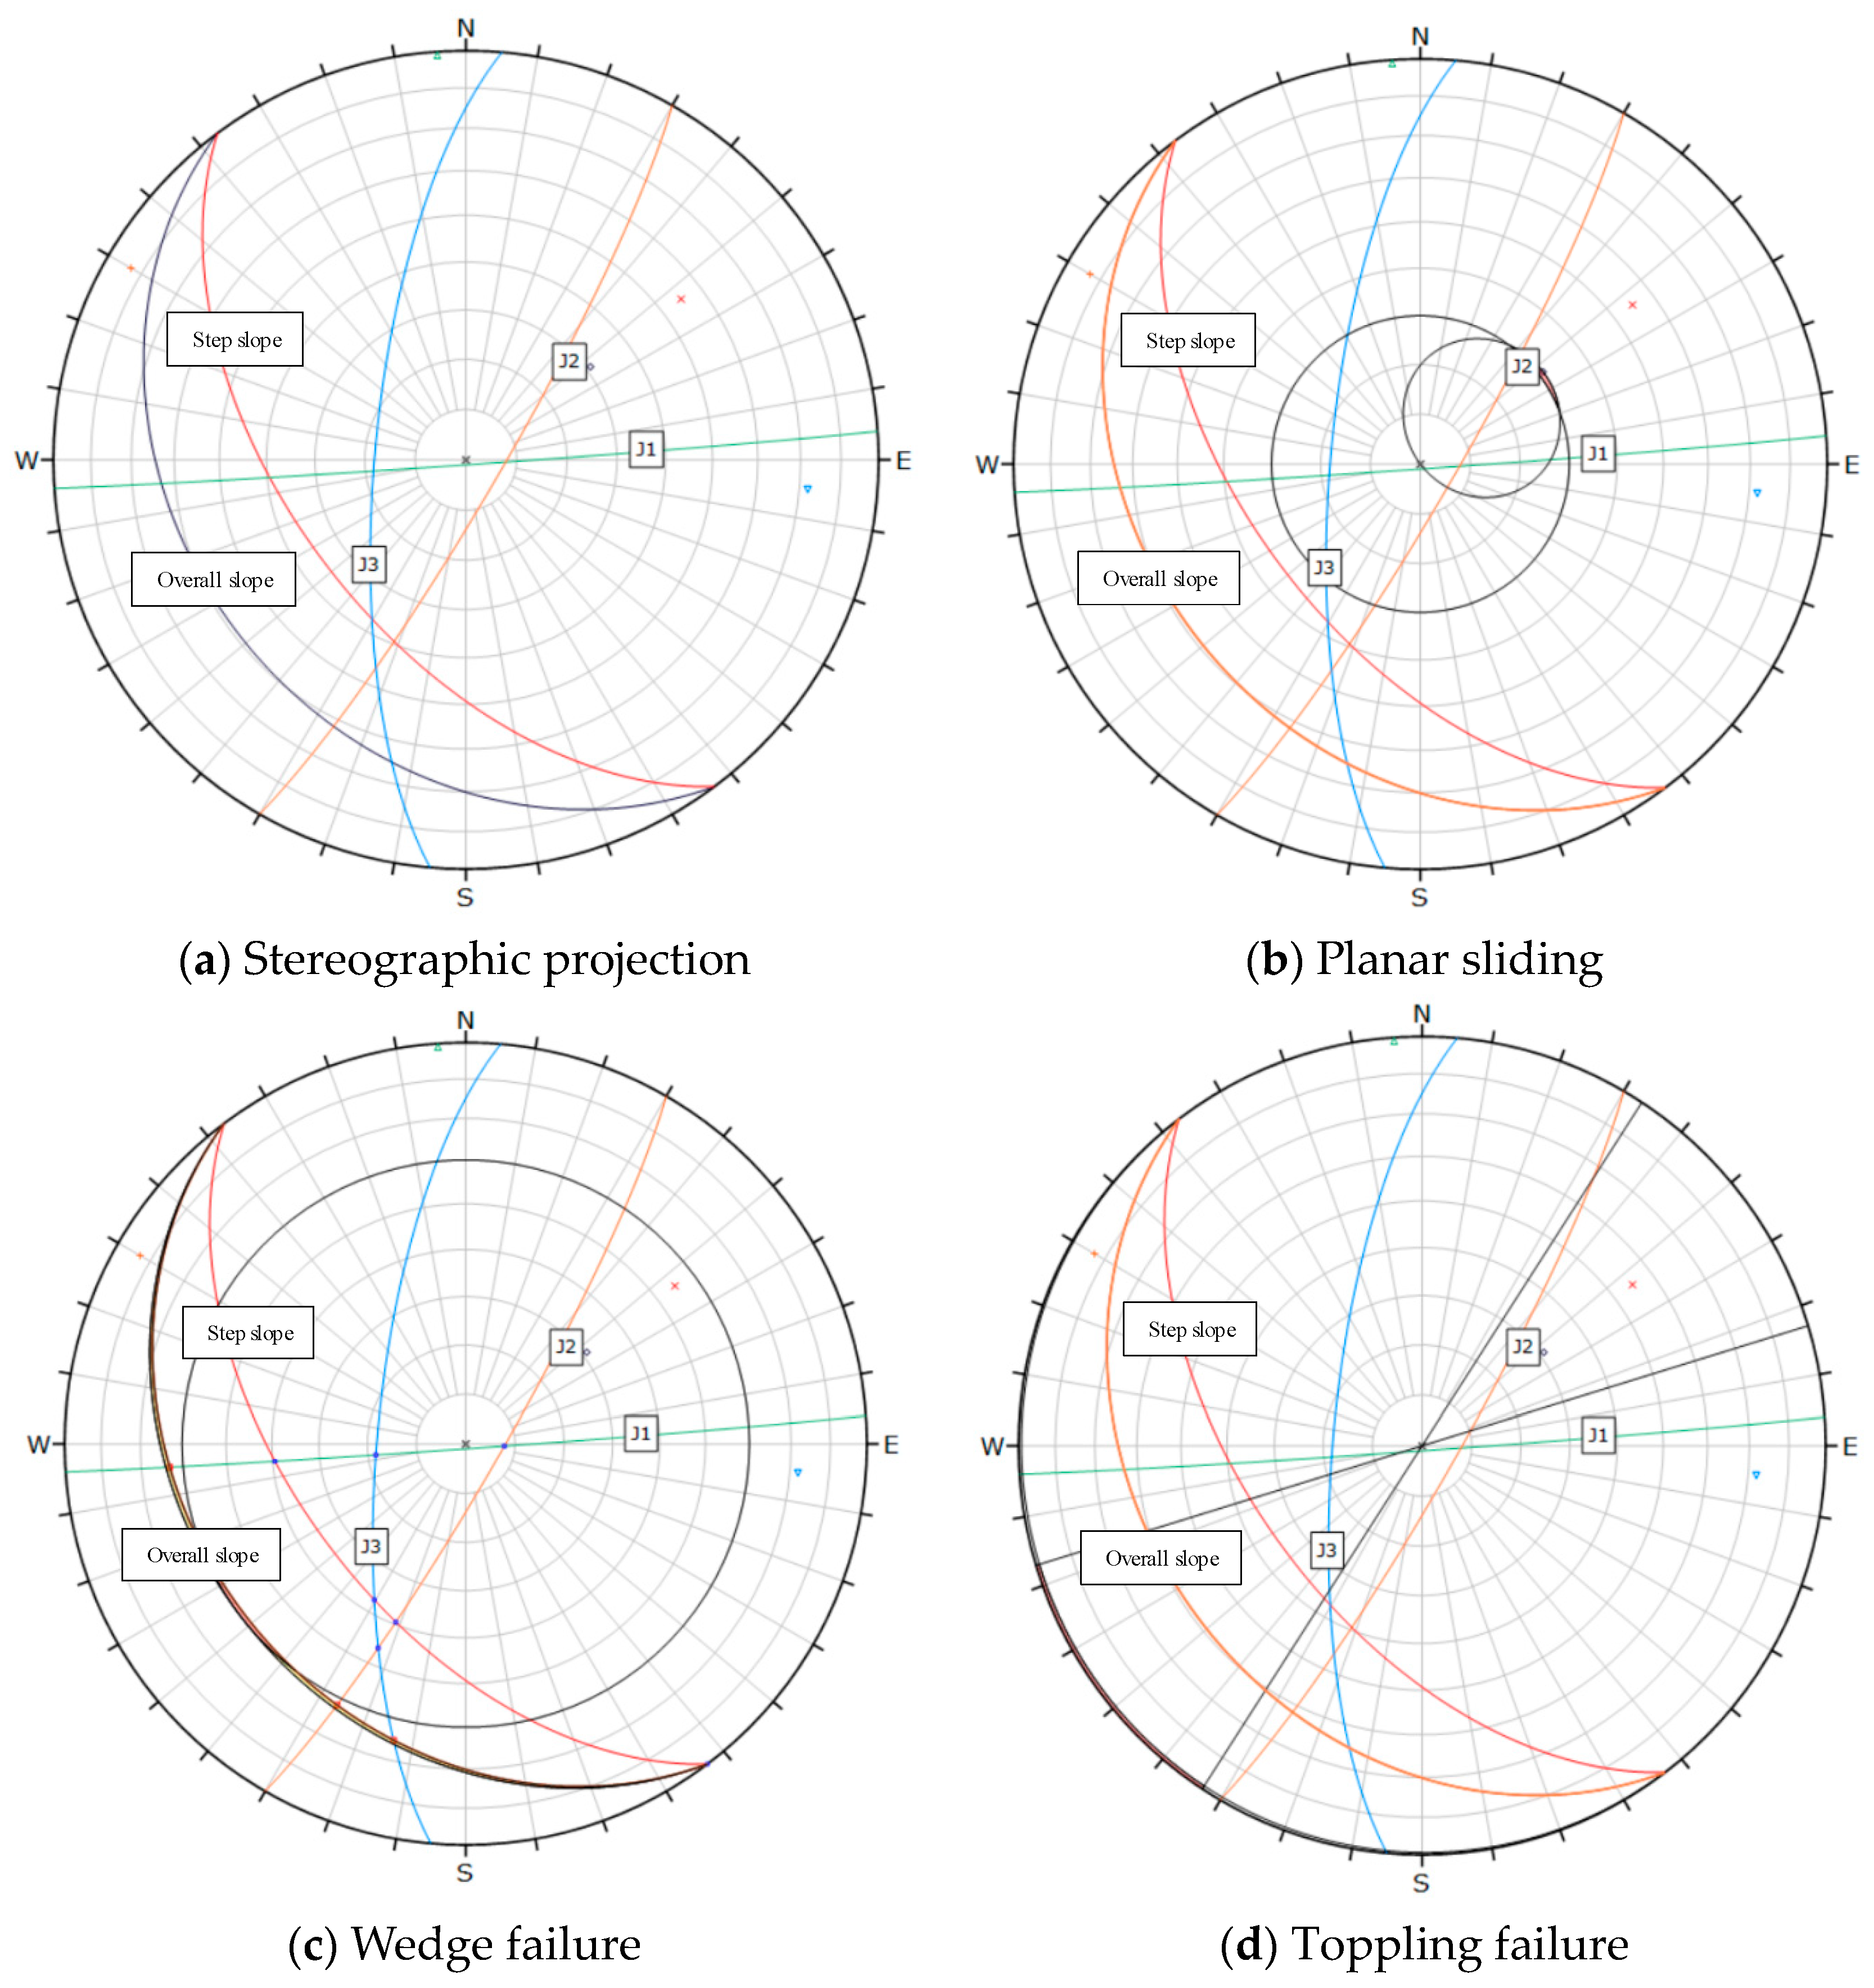
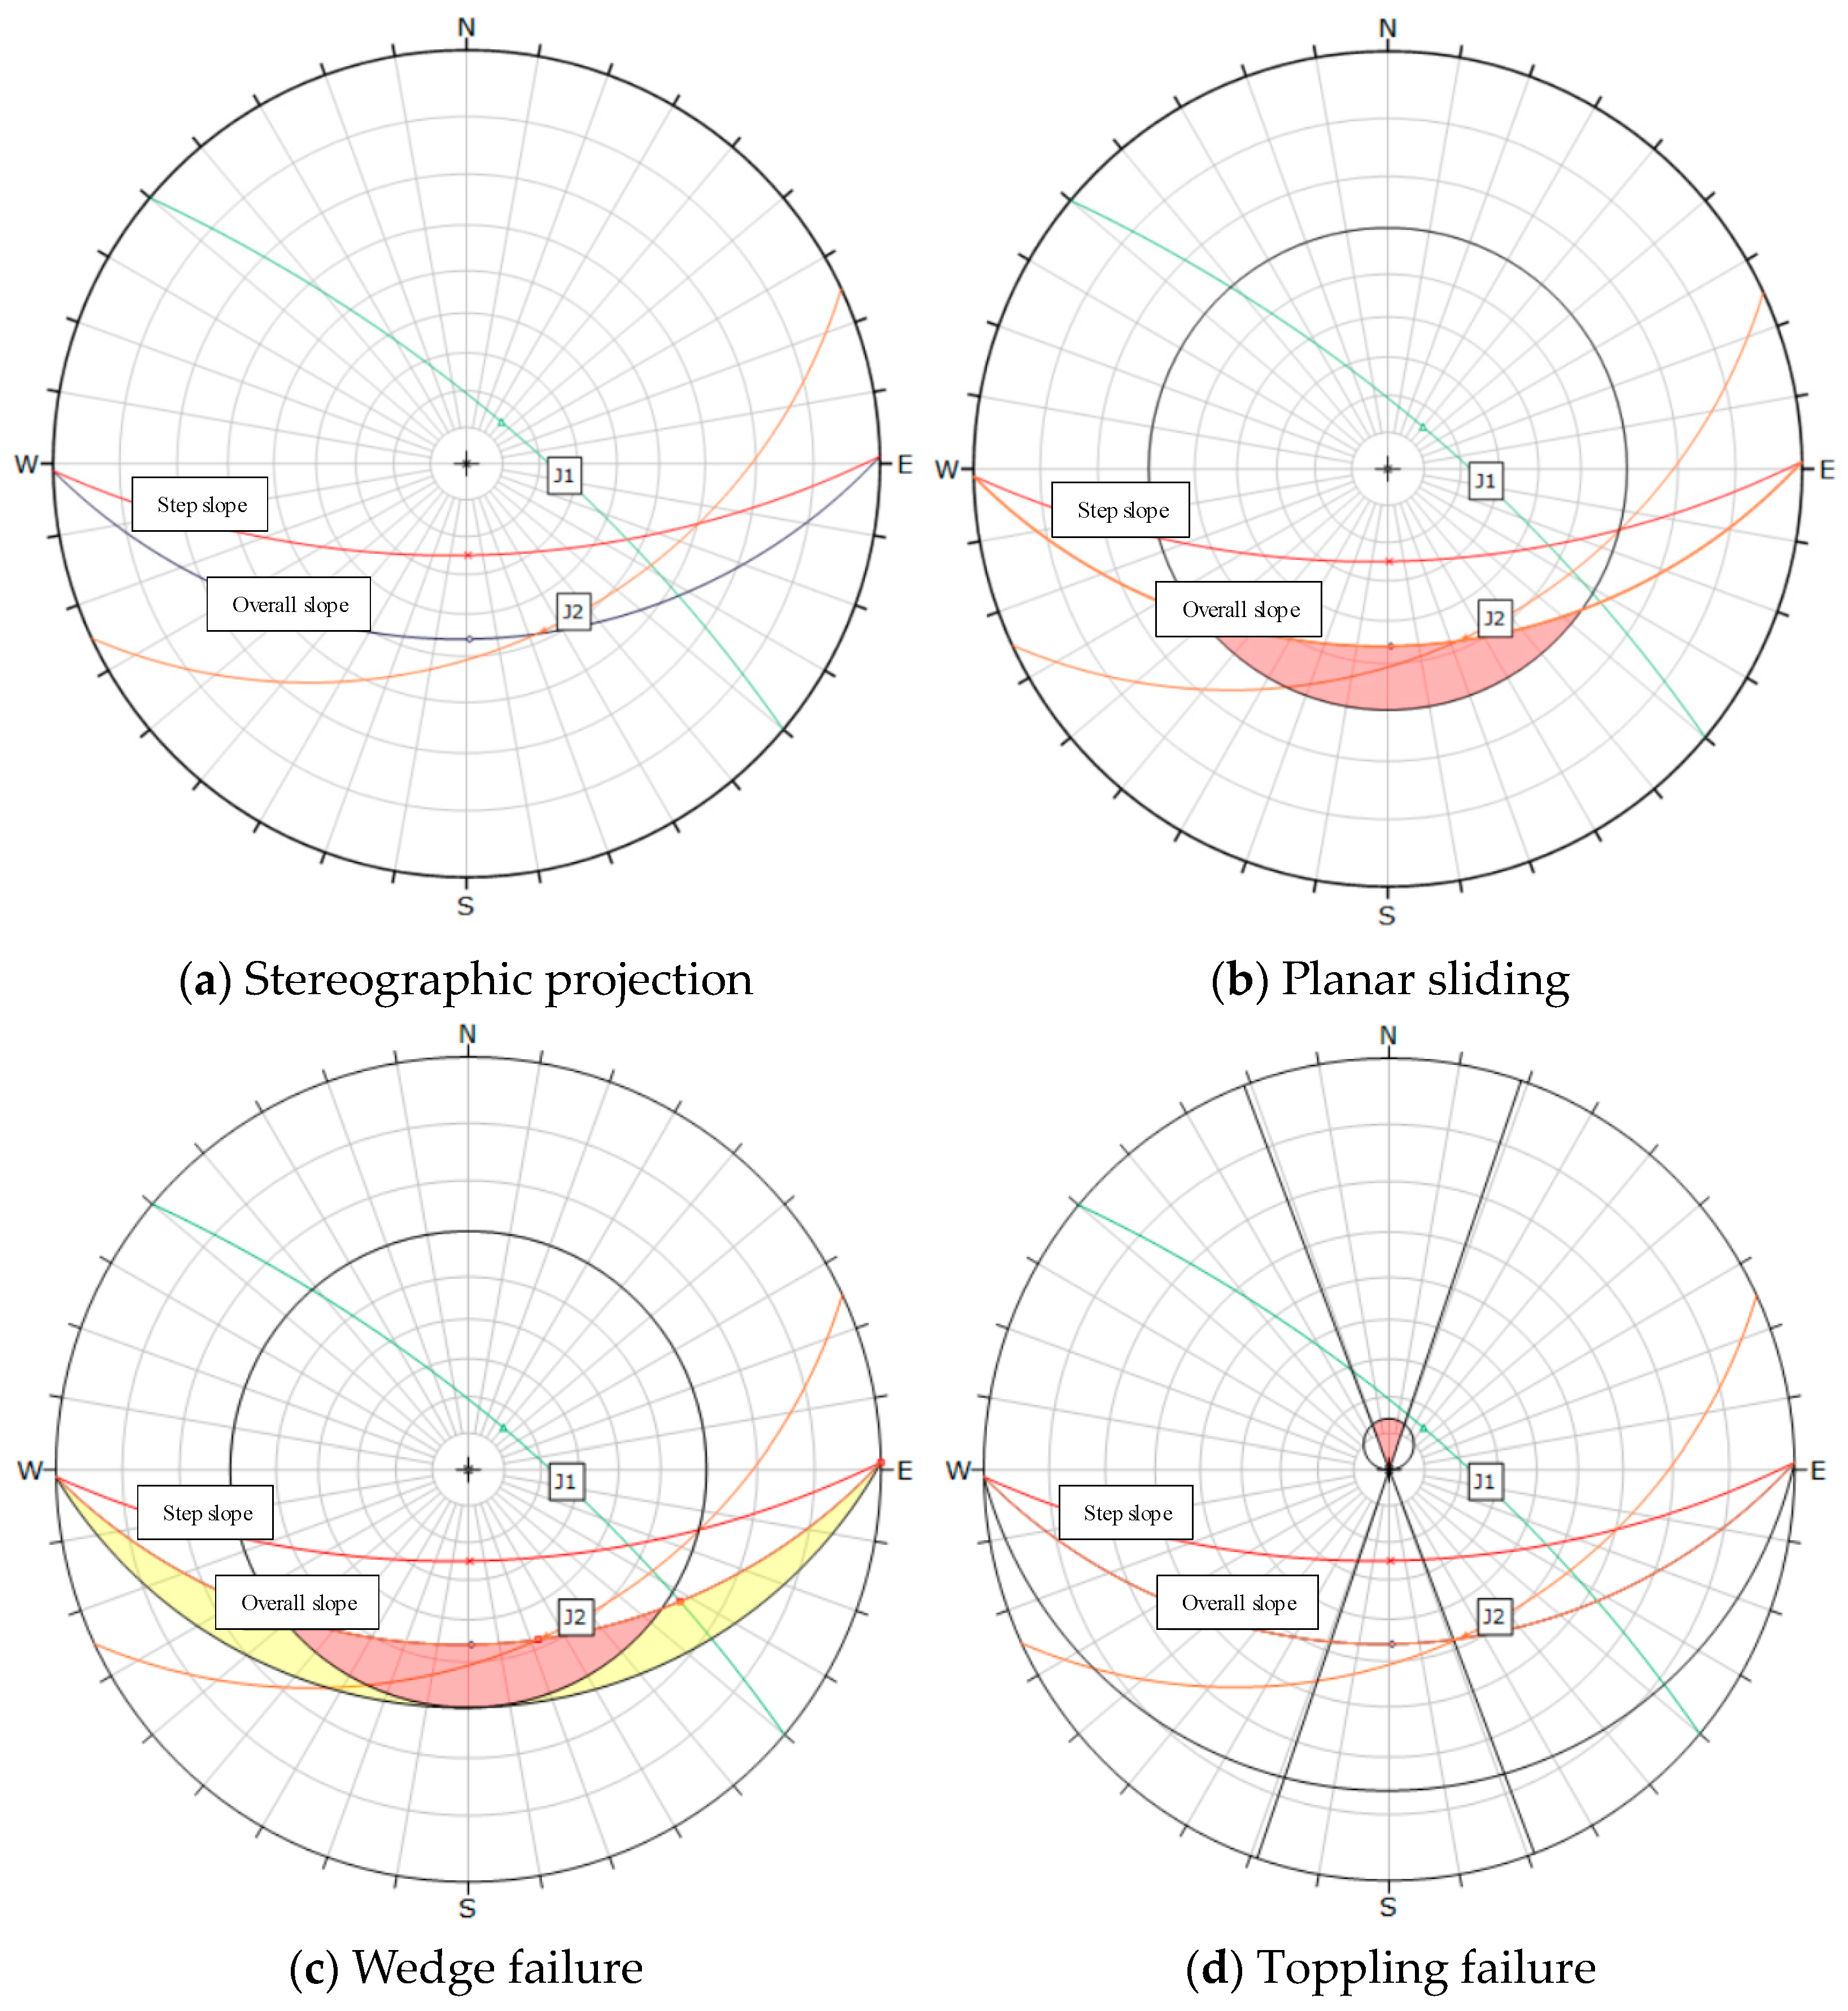
The overall slope angle of Area D is 47°. The bench slope face angles at elevations 165 m and 175 m are 43° and 55°, respectively, and below these, the bench slope face angle is 65°. There are 3 main joint sets in this area. The dominant structural surfaces are J1 (strike 119°, dip 82°), J2 (strike 28°, dip 82°), and J3 (strike 243°, dip 18°). For the XL4 Section, the overall slope strikes 337° with a dip angle of 47°, while the weathered rock mass step slope strikes 337° with a dip angle of 65°. As shown in Figure 10, structural surfaces J1, J2 and J3 intersect the slope face at a large angle, indicating a minor influence on slope stability. The combined intersection lines of J1–J2 and J1–J3 dip in the direction opposite to the slope, indicating the most stable structure. The intersection points of J2–J3 are located outside the slope, where wedge-shaped failure may happen. Planar sliding and toppling failures are not present. The upper part of the overall slope is strongly weathered granite with a small thickness, so local stability analysis is not. The lower part is moderately weathered granite. Composite failure mode analysis is used for the overall slope stability. The safety factor is calculated by the M-P method and thrust imbalance method.

Figure 10.
Sectional structure analysis of XL4.
According to the kinematic analysis of the open-pit mine, the existing slope has been affected by historical excavation and blasting activities, resulting in a significant amount of collapse debris and potential for landslides. This indicates a composite failure mode, and thus, the M–P method and thrust imbalance method should be used for calculations. For the designed slope, the upper portion consists of strongly weathered layers with relatively low strength, making it prone to circular failure. Additionally, the lower part of the slope comprises hard rock. This creates a sliding tendency at the interface between the superficial soil and the underlying rock, leading to composite sliding and composite failure. Therefore, the M–P method and thrust imbalance method are also recommended for calculations. In the case of the XL3 designed slope, the thick upper strongly weathered layer may result in circular failure, and thus, the M–P method and Bishop method (1955) should be employed for calculations.
The intersection points formed by the combination of structural surfaces J2–J3 are located outside the step slopes of the existing slope L1–L4 Sections but within the overall slope. This suggests that while the overall slope has a basically stable structure, local wedge-shaped failures might occur in individual step slopes. To ensure the stability of the existing slope, it is advisable to implement safety measures such as rock bolting, removing loose rocks, and constructing drainage ditches.
4. Stability Analysis of Slope Limit Equilibrium
4.1. Analysis of Groundwater Seepage
Hydrological conditions are a key factor in slope stability, especially groundwater seepage. Its impact takes two forms: hydrostatic action and seepage action. Hydrostatic action softens rock masses, reduces their physical and mechanical strength, and creates buoyancy, which decreases the effective weight of the soil. Seepage action, on the other hand, erodes the slope, generates seepage pressure, and triggers seepage deformation, all of which weaken slope stability. Groundwater seepage calculations and simulations in slopes are essential for stability analysis and remediation. Most practical seepage problems involve saturated-unsaturated seepage. Negative pore water pressure, or matrix suction, significantly affects slope stability. When soil transitions from unsaturated to saturated, matrix suction is lost, the strength of the rock and soil mass decreases, and slope stability declines. This is often a key factor in water-induced landslides. The stress state of unsaturated soil is mainly described by Fredlund’s strength theory [] for unsaturated soil, as shown in Equation (1):
where τ is the shear strength; c′ is the effective cohesion; σn is the normal stress; uw is the pore water pressure; ua is the pore air pressure; φb is the internal friction angle varies with matrix suction (ua − uw).
Since the matrix suction affects the shear strength of saturated-saturated soil, the traditional limit equilibrium method is no longer applicable to the calculation of saturated-saturated soil. Therefore, after modification [], the normal force on the base surface of the strip is expressed as in Equation (2):
For the safety factor calculation formula, when only the moment balance is satisfied, the safety factor is expressed as in Equation (3):
The safety factor equation without consideration of moment balance is expressed as in Equation (4):
where W is the determine weight of the soil; l is the length of the base edge of the strip soil; a is the angle between the base of the soil mass and the horizontal plane; N is the total normal force acting on the bottom of the strip; X is the vertical shear force between the bars, where the subscripts L and R refer to the left and right sides of the bars, respectively, and β is the length of the base of each block.
4.2. Initial Boundary Conditions and Parameter Values
In the analysis of slope stability, the model was simplified by ignoring factors such as air influence, rainfall evaporation, and external loads. The natural state of the slope is complex, and during the survey period, rainfall in the mining area was frequent, causing fluctuations in the water level of boreholes between the strongly weathered and fully weathered layers. The actual phreatic line was determined to be the water level 24 h after drilling. Due to the limitations of groundwater level measurement and the significant differences in stress state, water content, and permeability of the rock and soil above and below the groundwater level, the numerical simulation adopted a stable water level for detection. A total head boundary was set on the right side boundary of the model to simulate pore water pressure, and the initial water level was obtained through steady state seepage analysis. The software identifies zero pore pressure isolines as the water table and calculates the hydrostatic pressure and pore water pressure of the rock and soil below the groundwater level, which are linearly distributed. Based on the changes in pore water pressure and initial water level, different saturated-unsaturated seepage models were used to derive curves of the relationship between saturation, permeability coefficients, and volumetric water content, providing a basis for subsequent slope stability calculations.
The boundary conditions were specified as follows: the two side boundaries are total head boundaries below the phreatic surface and impermeable boundaries above it; the lower boundary is an impermeable boundary; the top boundary is an impermeable boundary above the original water level after excavation and a seepage boundary below.
In terms of parameter selection, the mining area primarily consists of granite with varying degrees of weathering. As there are no seepage points on the existing slope, seepage analysis was not performed. Instead, the slope seepage field was simulated using the soil and rock permeability coefficients provided in the engineering survey report. The specific parameters are listed in Table 3.

Table 3.
Recommended values of geotechnical physical and mechanical indexes of the site.
The GEO-studio (2024) software’s built-in volumetric water content data point function was used to estimate the relationship curves between volumetric water content and matrix suction for each weathered rock layer. Then, the Fredlund & Xing method [] was employed to calculate the relationship curves between permeability coefficients and matrix suction. Since the engineering survey report only provided data for the strongly, moderately, and slightly weathered rock layers, calculations were performed solely for these three layers. The details are shown in Figure 11, Figure 12 and Figure 13.

Figure 11.
Strongly weathered granite.

Figure 12.
Moderately weathered granite.

Figure 13.
Slightly weathered granite.
4.3. Model Assignment Results
The groundwater levels from the investigation report were used to simulate and analyze the seepage field of the slope formed after mining. The distribution of groundwater seepage hydraulic head gradients, wetting fronts, and water tables for each Section is shown in Figure 14.

Figure 14.
Design slope seepage analysis diagram.
4.4. Scheme Design
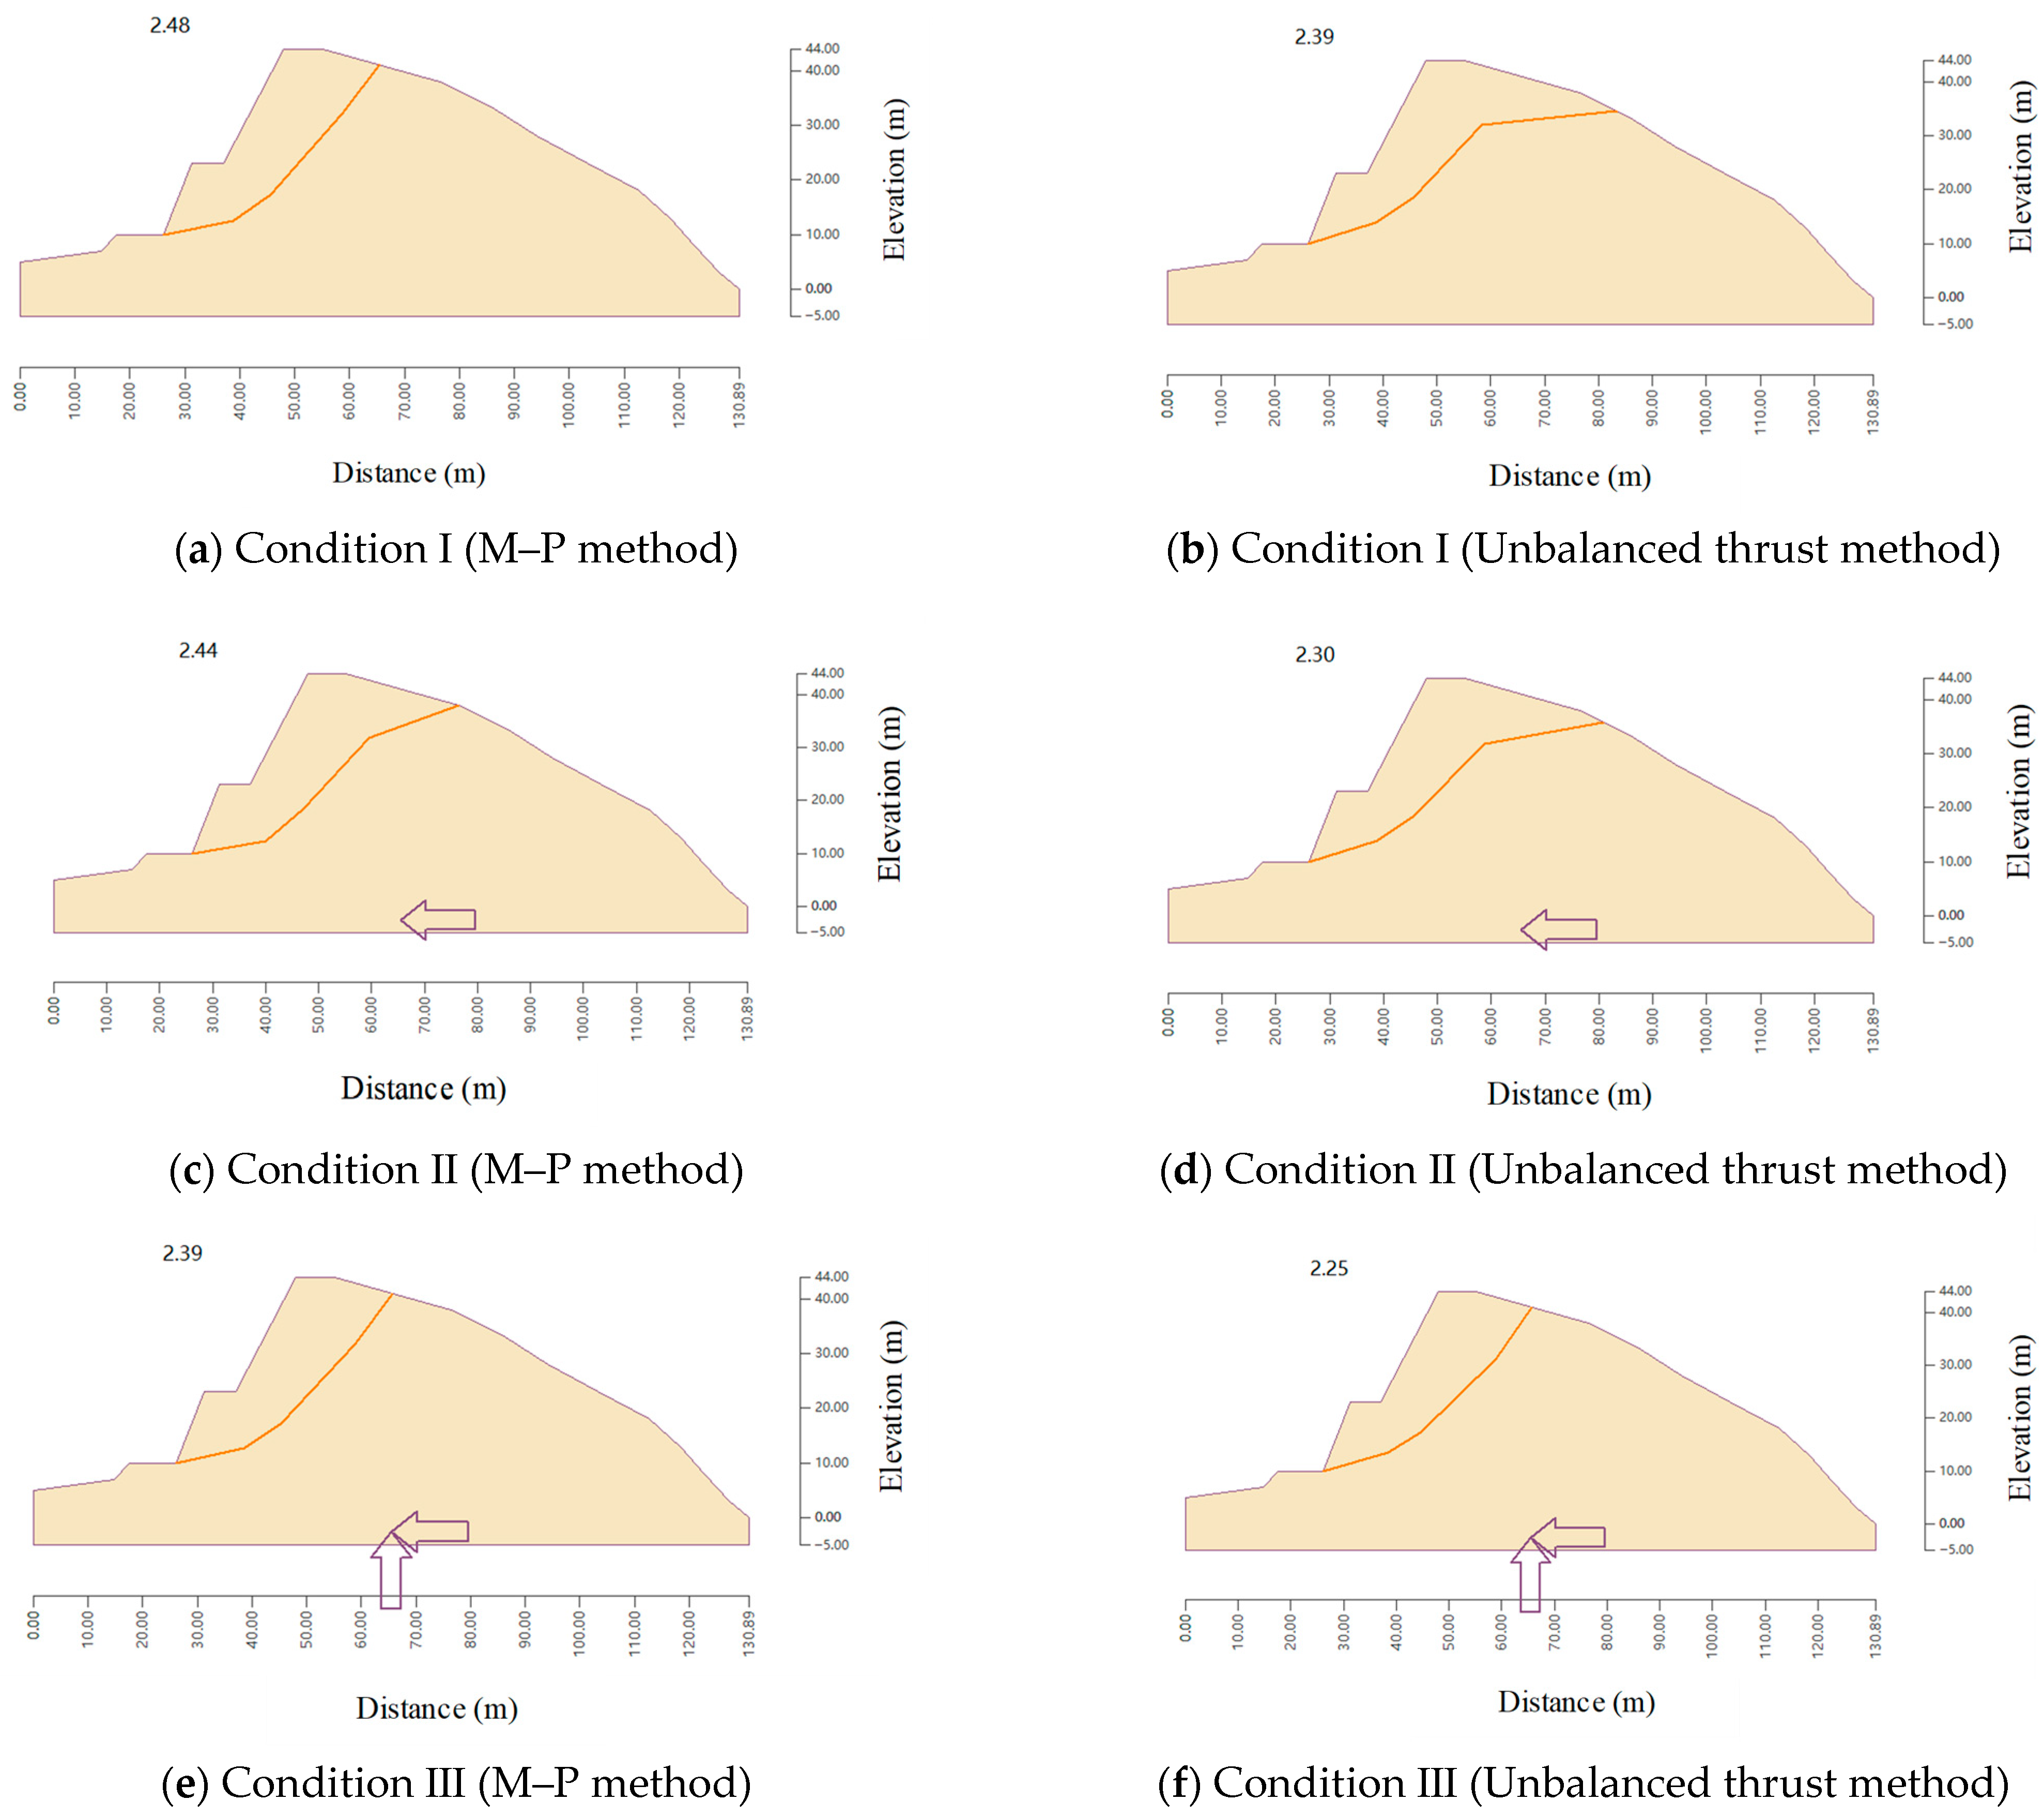
According to the relevant technical specifications [], Table 4 shows the required design safety factors for overall slopes under different load combinations. The calculation conditions are divided into: Condition I, which includes self-weight and groundwater; Condition II, which includes self-weight, groundwater, and blasting vibration; and Condition III, which includes self-weight, groundwater, and seismic forces. For bench slopes and temporary working benches some degree of failure is allowed, so the design safety factor can be appropriately reduced.

Table 4.
Design safety factor of the overall slope under different load combinations.
4.5. Design Slope Stability Calculation and Analysis
- (1)
- Overall stability analysis
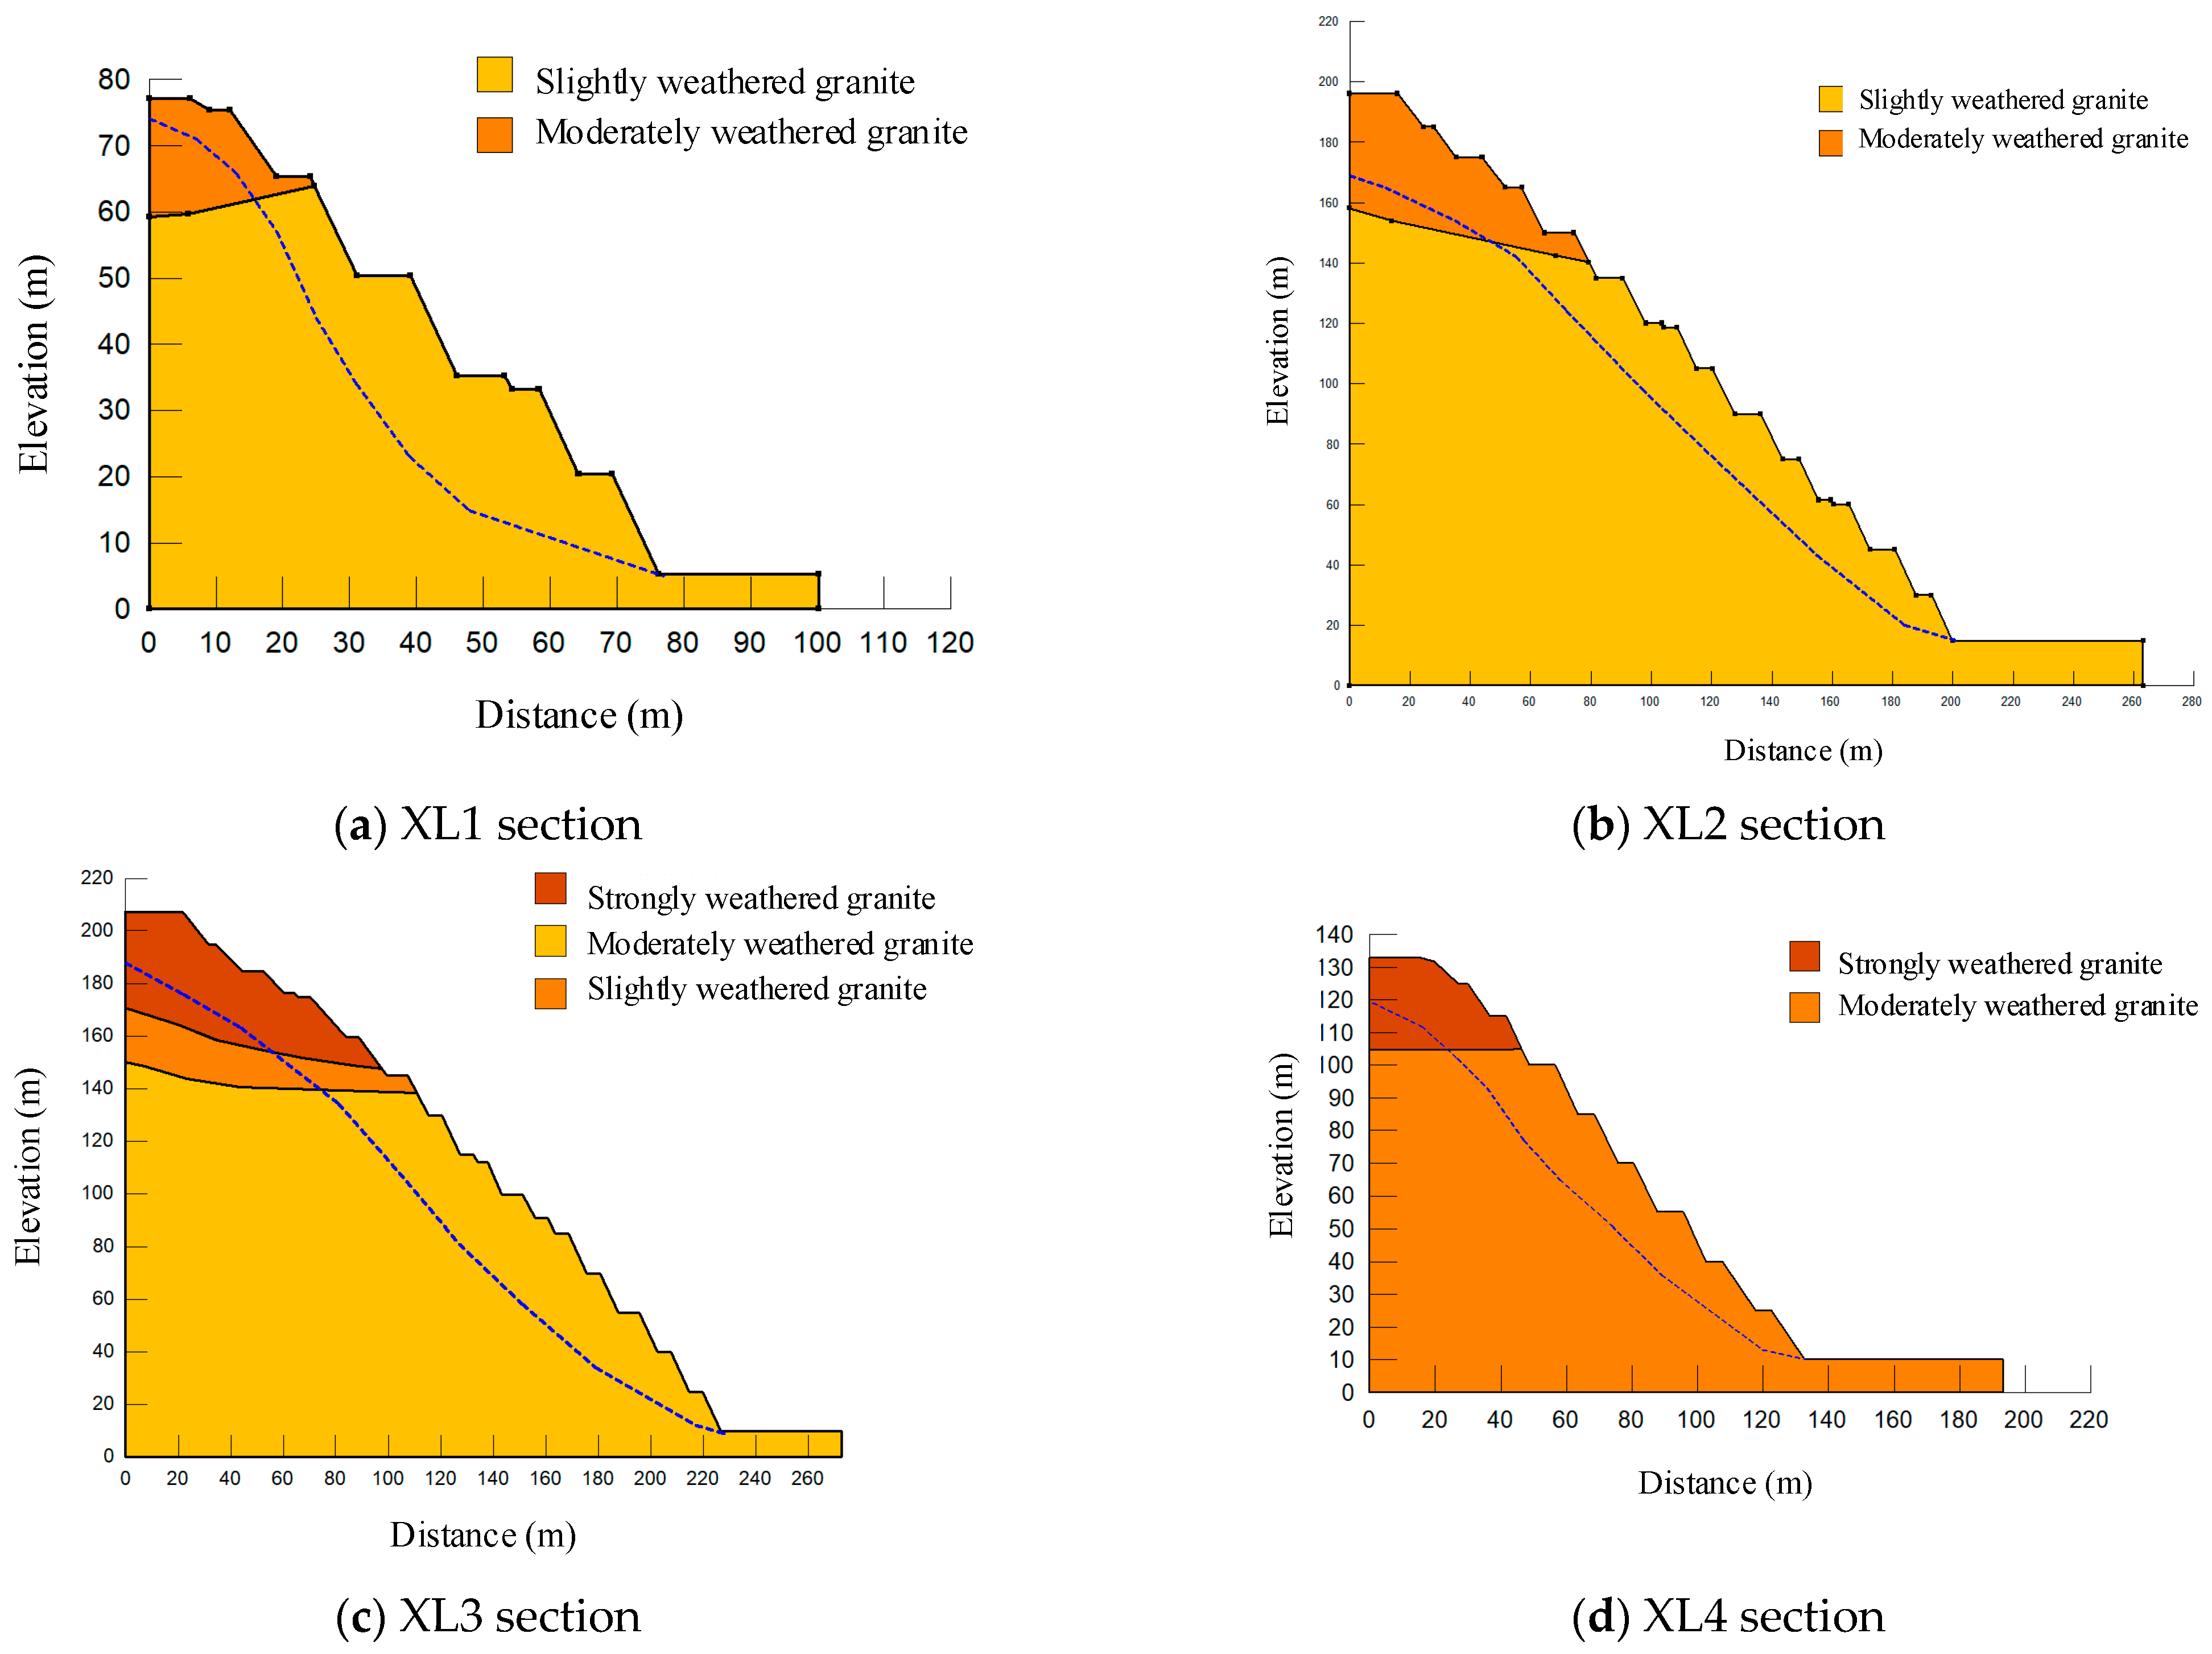
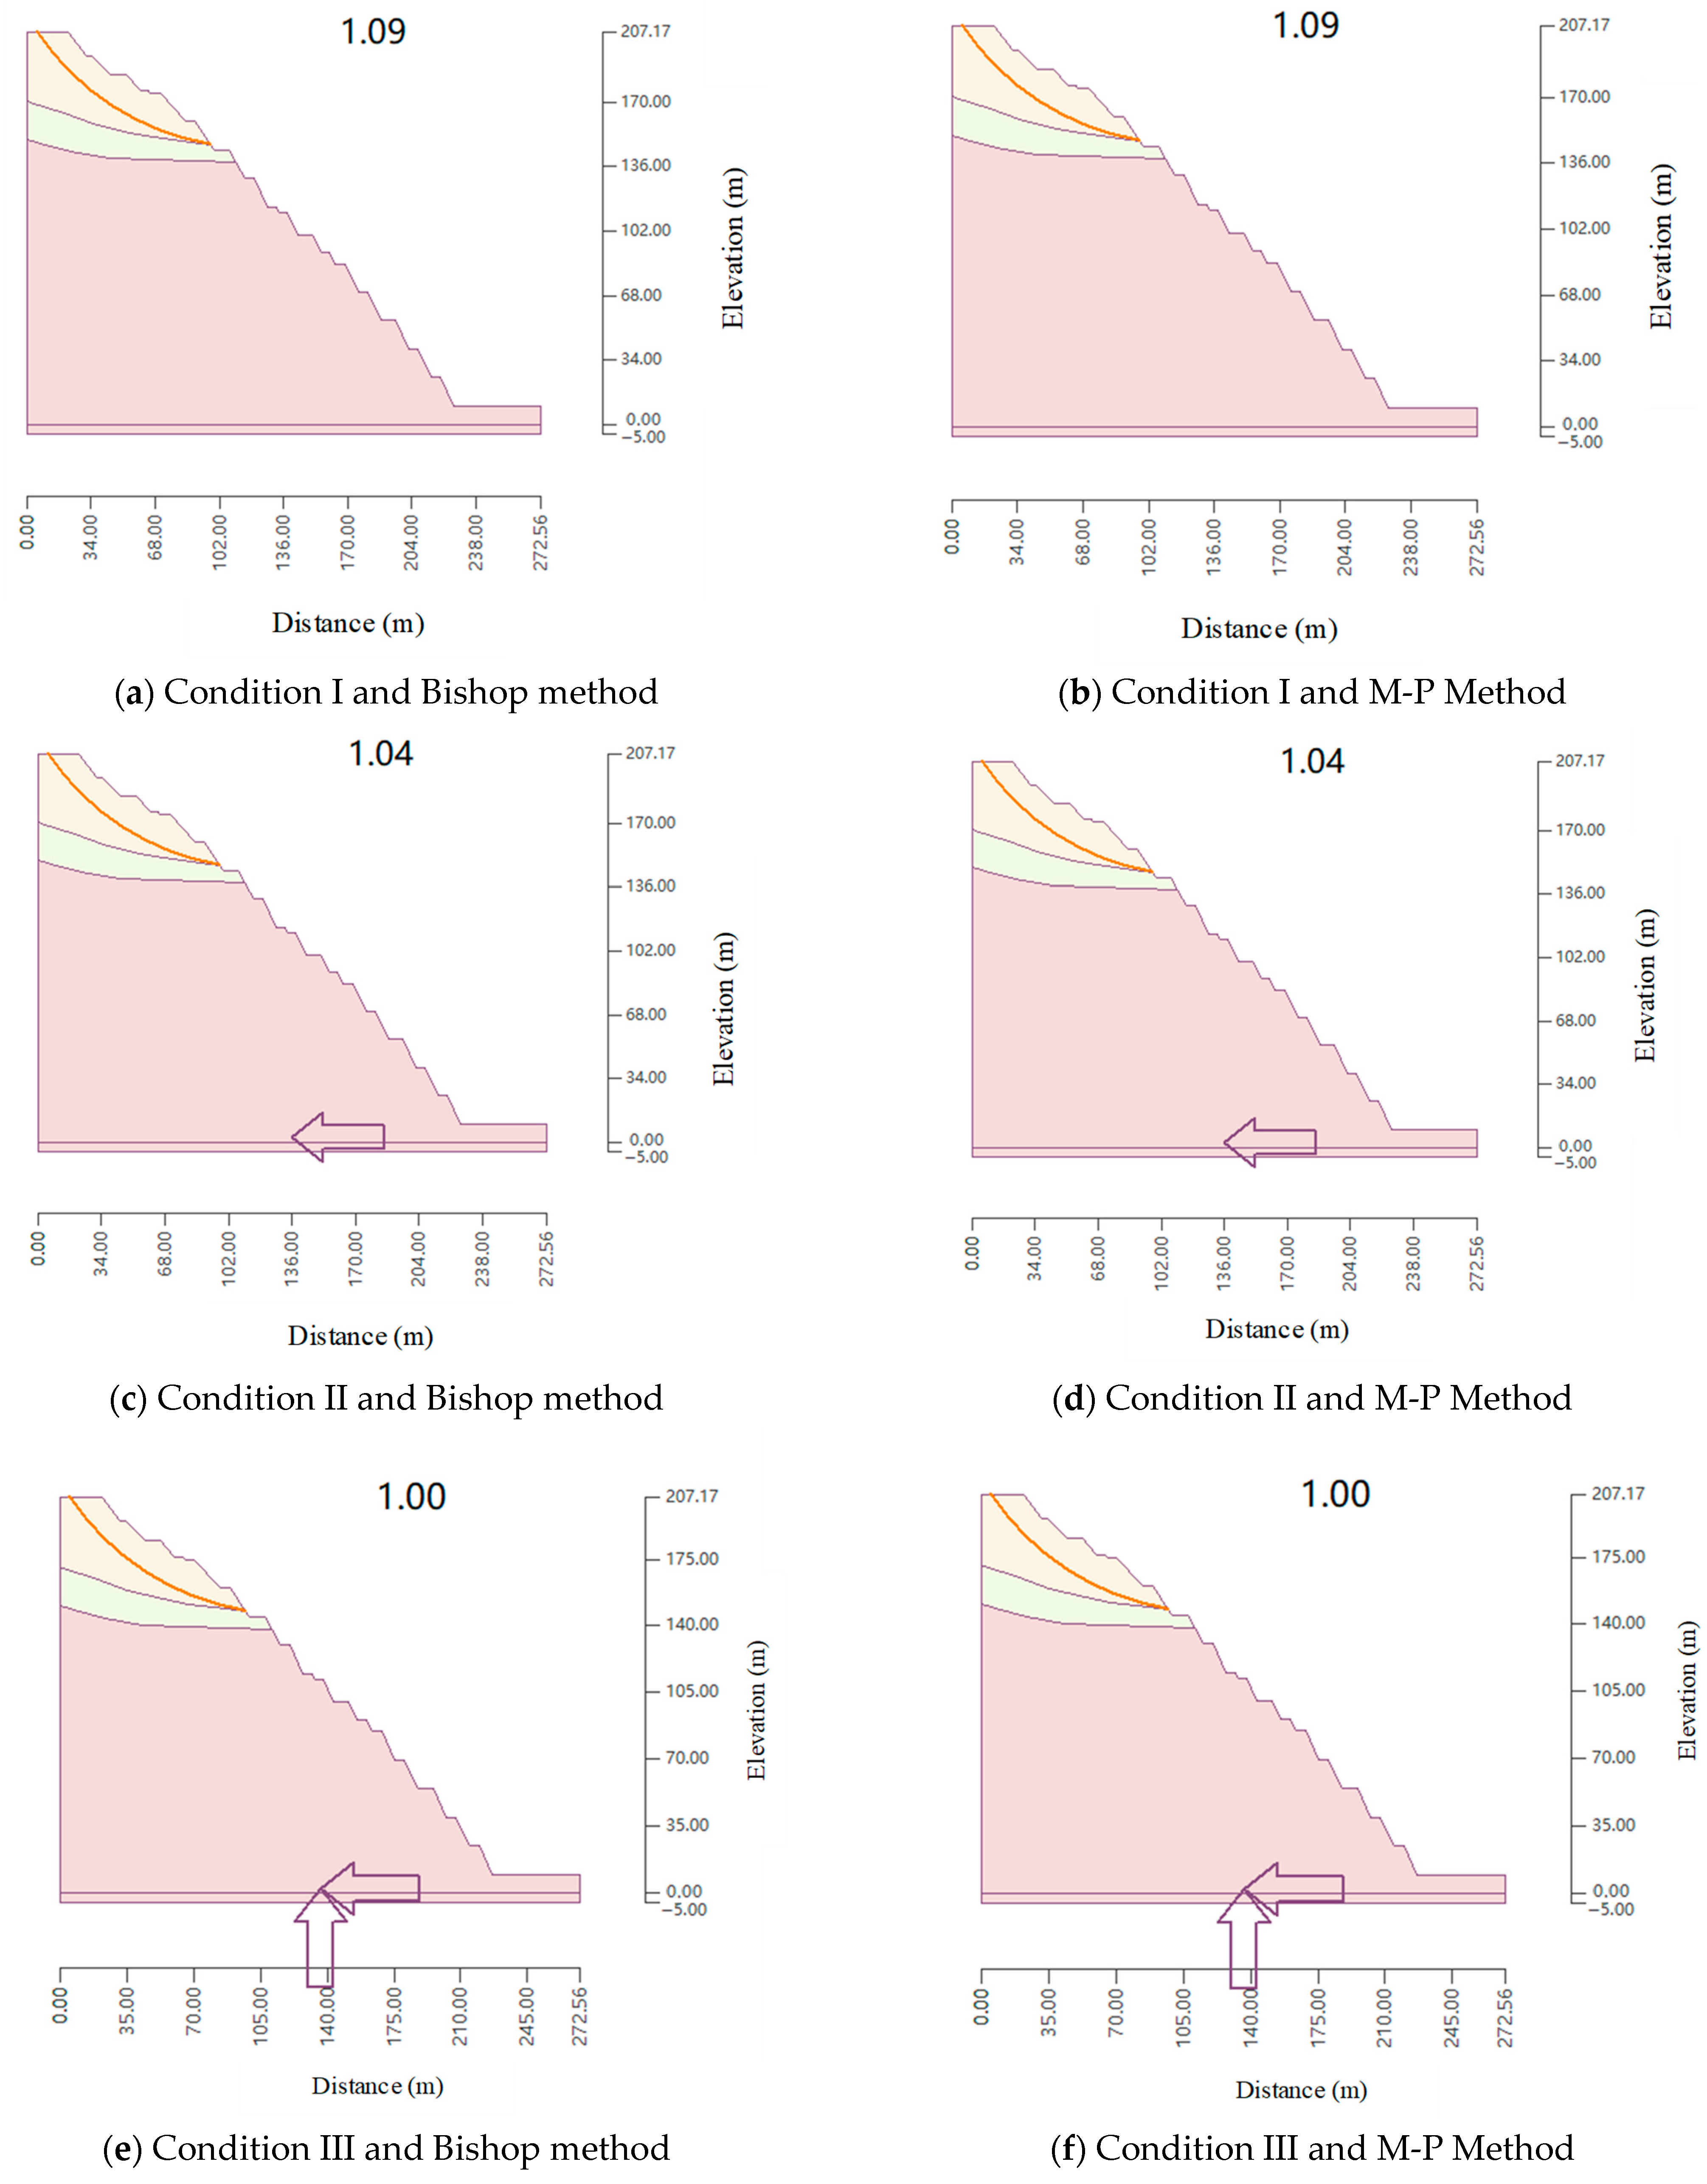
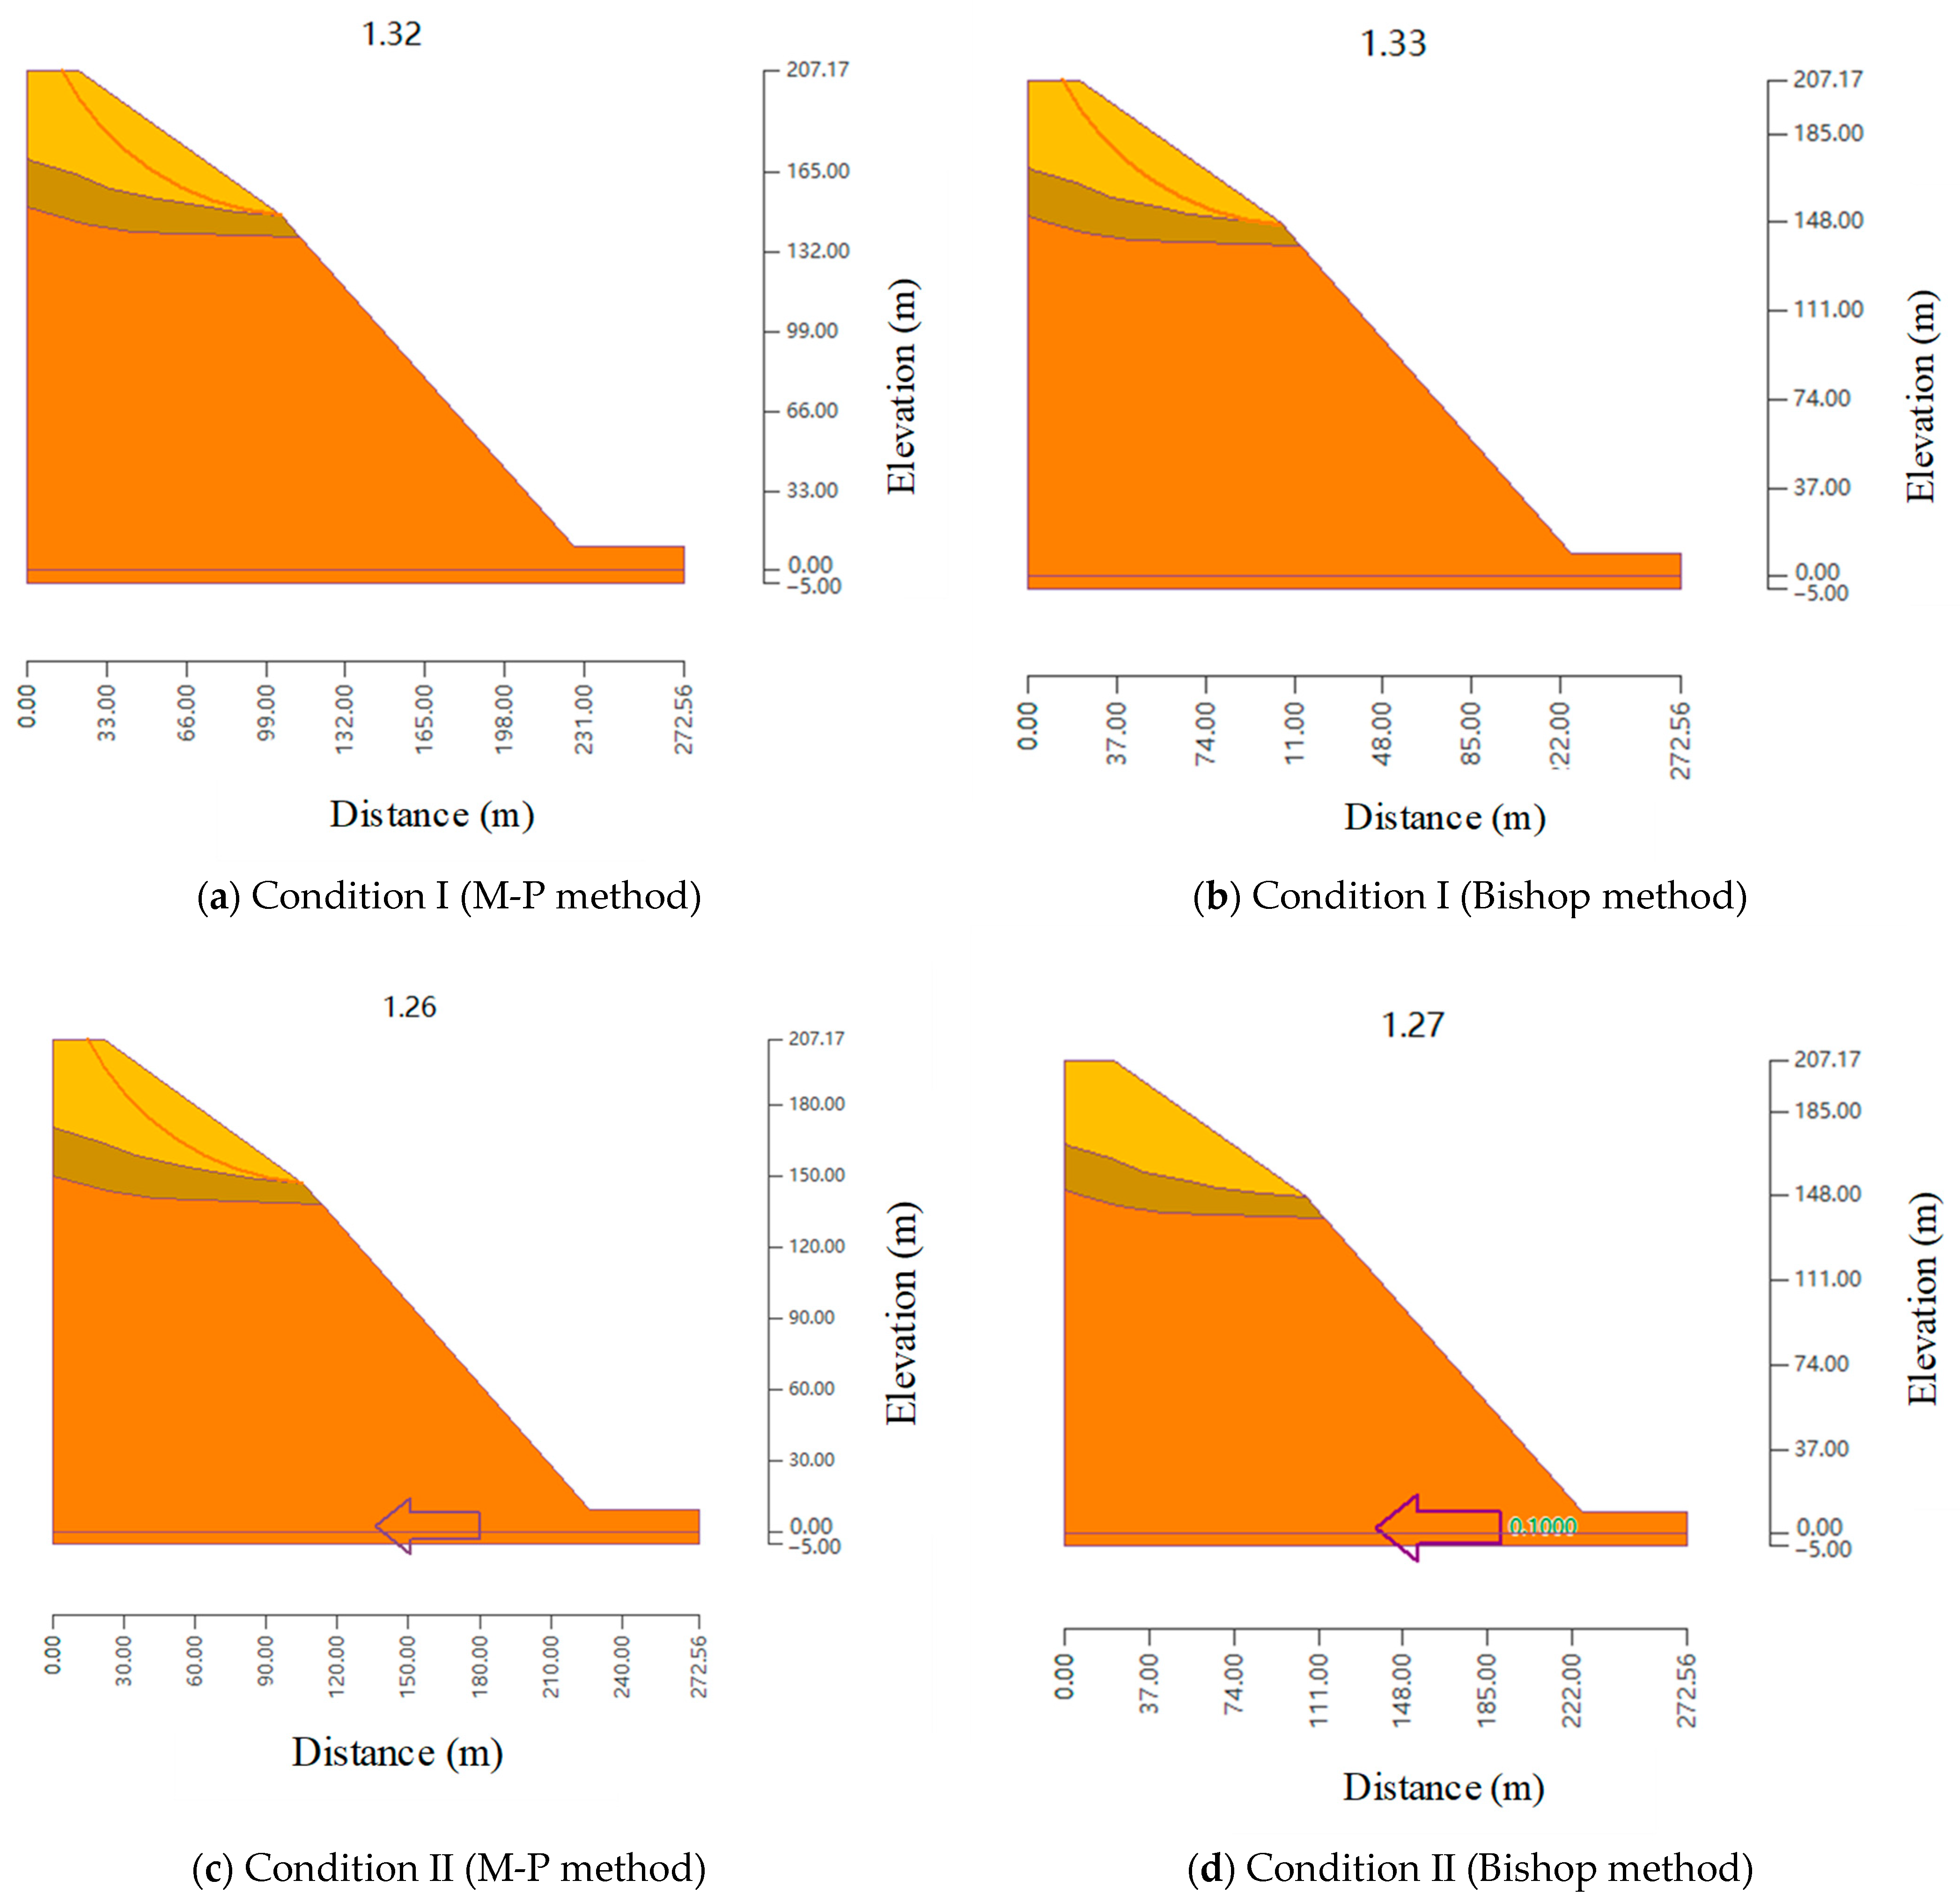
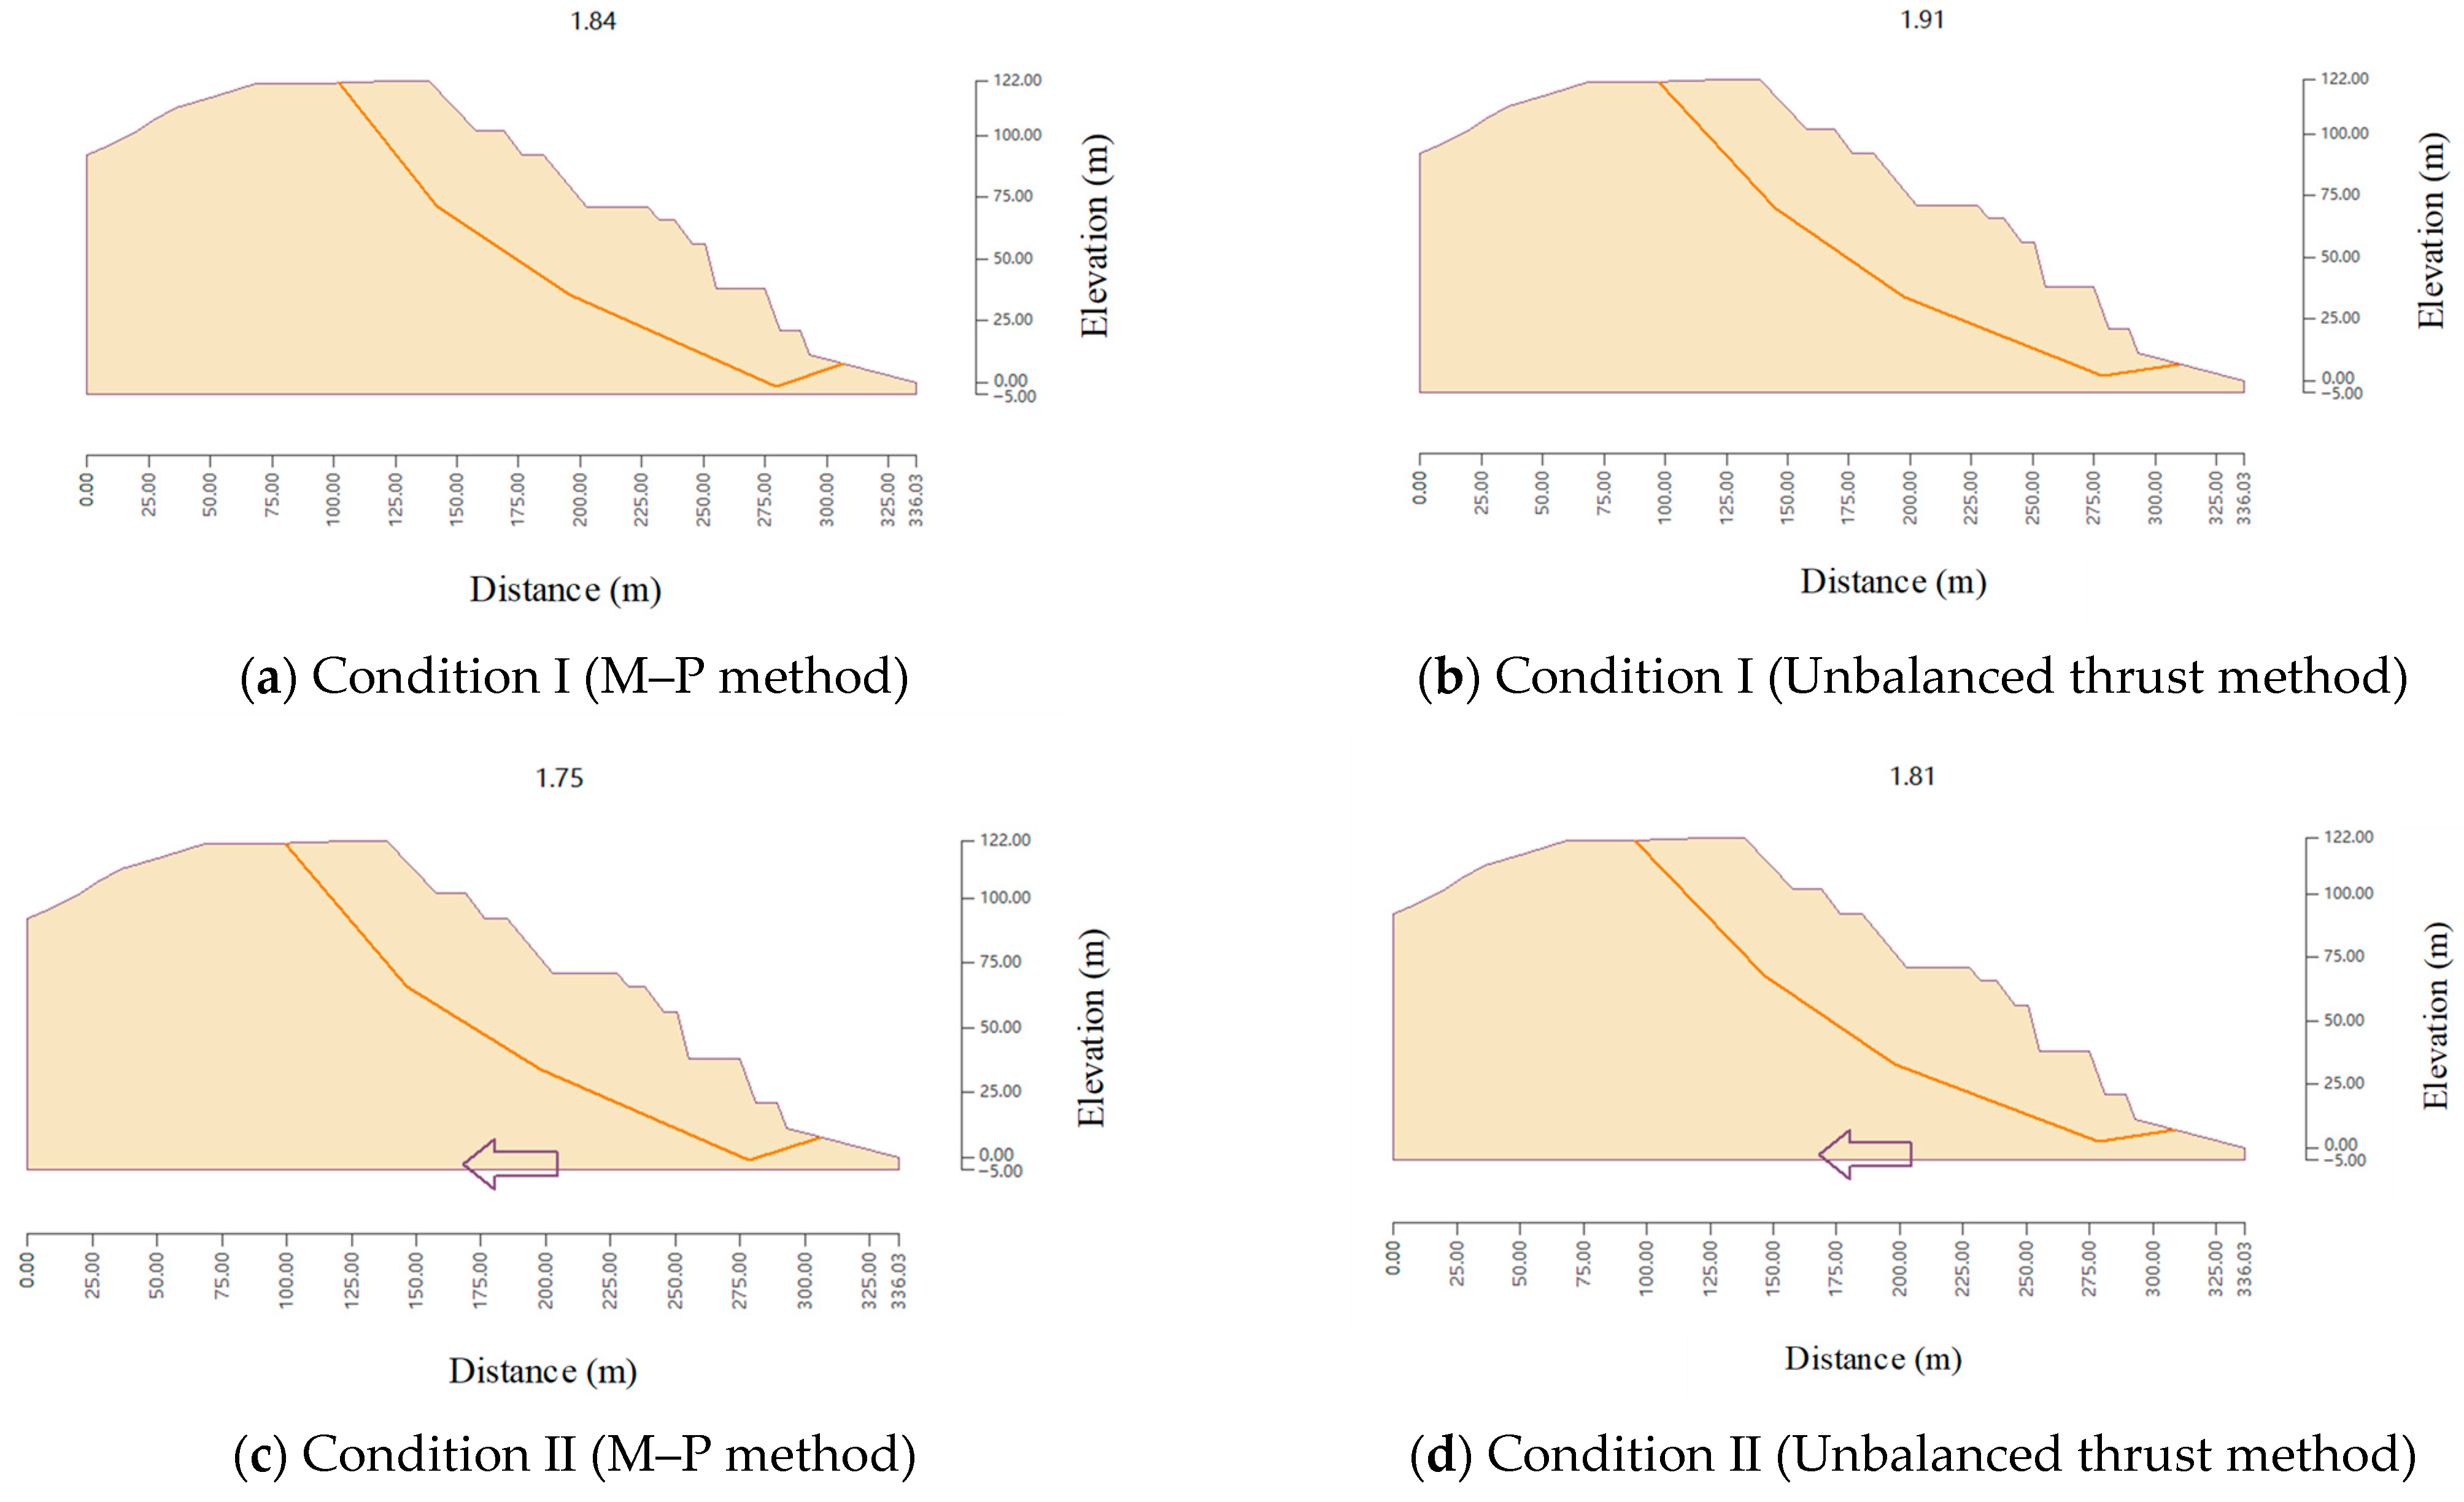
This study calculated the stability using specialized software based on the above working condition design, and the relevant results are shown in Figure 15, Figure 16, Figure 17, Figure 18 and Figure 19.

Figure 15.
Calculation results of section XL1.

Figure 16.
Calculation results of XL2 section.

Figure 17.
Calculation results of XL3 section.

Figure 18.
Calculation results of XL4 section.

Figure 19.
Local stability calculation results of XL3 section.
- (2)
- Local stability analysis
Because the strong weathered layer in section XL3 of the designed slope is relatively thick, arc-shaped sliding may occur. Therefore, the Bishop method [] and M–P (Morgenstern–Price) method [] are used for local stability analysis as shown in Figure 19.
- (3)
- Calculate the stability of the designed slope
According to the calculation results of the limit balance method, the stability of the XL3 Section of the strong weathered layer slope Section is low, and the slope Angle can be optimized. The specific calculation results are shown in Table 5 and Table 6.

Table 5.
Calculation results of overall stability analysis of each designed slope Section.

Table 6.
Calculation results of local stability analysis of each designed slope Section.
Table 5 presents the overall stability calculation results for all designed slope sections under various conditions. The safety factor for each section meets the standard and satisfies the stability requirements.
For the XL1 section, under conditions I, II, and III, the safety factors calculated by the thrust method and M–P method vary. The minimum safety factors are 2.67, 2.58, and 2.52, respectively, all meeting the stability requirements. For the XL2 section, the safety factors under different conditions are 2.00, 1.93, and 1.88, all up to the standard. For the XL3 section, the safety factors are 1.83, 1.76, and 1.71, also meeting the requirements. For the XL4 section, the safety factors under the three conditions are 1.26, 1.24, and 1.21. The lowest safety factor of 1.21 still satisfies the standard.
In summary, all designed slope sections show good overall stability under different conditions, with safety factors meeting the standard.
- (4)
- Slope Angle Optimization
Based on limit equilibrium analysis, the slope in the strongly weathered layer of the XL3 Section has low stability and potential for angle optimization. Optimization focused on the overall slope, adjusting it by 1°~2° each time. The goal was to determine the maximum feasible angle that meets the safety factor requirements of the relevant technical specifications for two load combinations []. The boundary conditions were set as follows: the two side boundaries are total head boundaries below the water table and impermeable boundaries above; the lower boundary is impermeable; the top boundary is impermeable above the original water level after excavation and a seepage boundary below. Local search was used to find the most dangerous sliding surface of the slope. The physical and mechanical parameters of the rock and soil are given in Section 3.2. The slope angle was optimized using limit equilibrium analysis of the design Section. The optimal angle meeting the specification requirements under all three load combinations was chosen as the solution. As the safety factor of the XL3 Section was found to be non-compliant, it was optimized using the aforementioned method.
The slope angle of the strongly weathered layer in the XL3 Section was optimized to 37°, meeting safety requirements. Re-analysis of the overall slope stability using the M–P method and thrust imbalance method showed a minimum safety factor of 1.20. Results are in Figure 20 and Table 7. The local slope angle of the strongly weathered layer in the XL3 Section of the mine’s open-pit slope was reduced from 38° to 37°.


Figure 20.
Local stability calculation of XL3 Section (strong weathered slope Angle 37°).

Table 7.
Optimization of local slope Angle of Strongly weathered Layer in Section XL3 (37°).
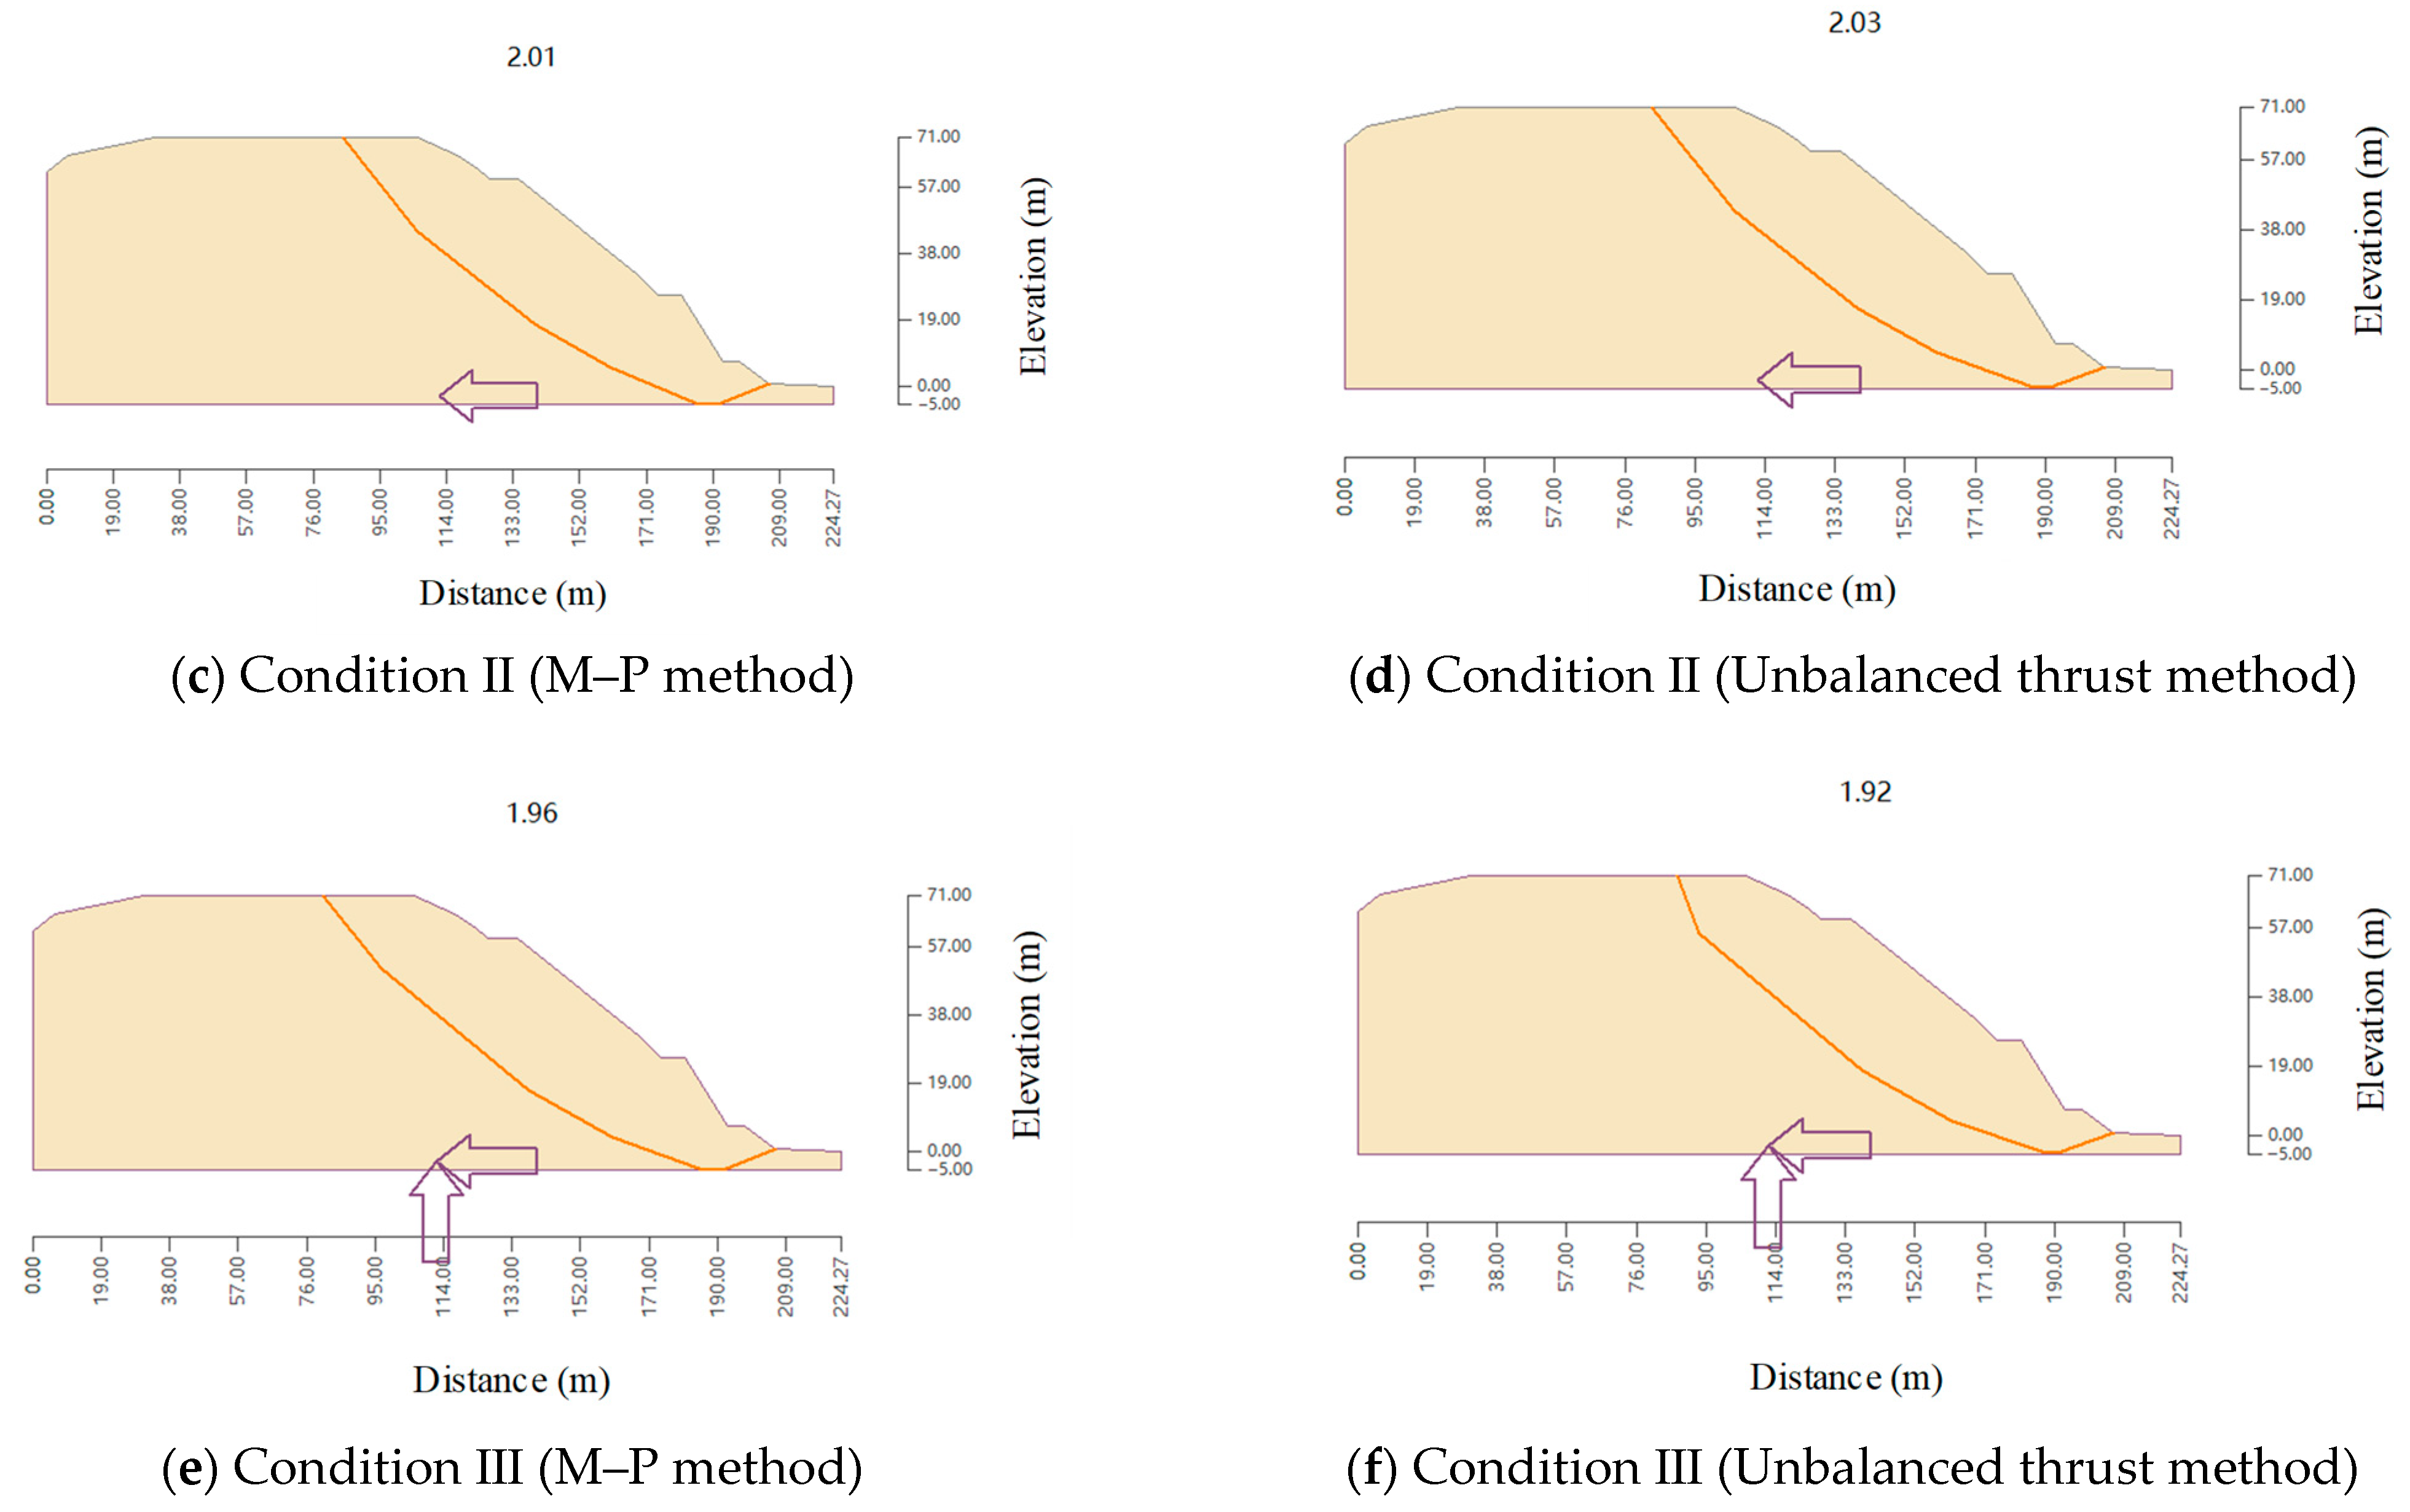
4.6. Current Slope Stability Calculation
Since there is a large amount of rock debris in the existing slope from L1 to L4, the composite failure mode can be analyzed, and the safety factor can be calculated by using M-P method and unbalanced thrust transfer method. The calculation results are shown in Figure 21, Figure 22, Figure 23 and Figure 24 and Table 8.


Figure 21.
L1-Section calculation results.


Figure 22.
L2-Section calculation results.

Figure 23.
L3-Section calculation results.

Figure 24.
L4-Section calculation results.

Table 8.
Overall stability analysis and calculation results of each existing slope section.
4.7. Pyramidal Analysis
- (1)
- Calculation Theory
When analyzing, it is assumed that water can flow freely in discontinuities below the groundwater level, ignoring restrictions like ice blocks. Water pressure acts on the sliding surface’s normal direction, opposite to the normal pressure. If the wedge height yw above the point of maximum water pressure Pmax is ≥ Z/2, Z/2 is used. If yw < Z/2, a different calculation applies, as shown in Equation (5):
where L is the length of the intersection line between the sliding surface A1 and A2; a1 is the inclination angle of the rock slope; δ is the inclination angle of the sliding surface intersection line.
The formula for calculating the hydrostatic force acting on sliding surface 1 and sliding surface 2 is as follows in Equation (6):
where is the maximum water pressure on the sliding surface intersection line; is the degree of water heaviness; is The area of the waterlogged part of the sliding surface 1; is the area of the water-soaked part of the slip surface 2.
According to the above formula, the wedge failure calculation and analysis of unstable structural surface combinations in A, B, C and D zones are carried out.
- (2)
- Selection of Calculation Parameters
In accordance with the relevant technical specifications [,], the standard values for the shear strength of slope rock mass structural surfaces can be determined as per Table 9. After blasting and excavation, the structural surfaces of the strongly and moderately weathered granite in the mining area are relatively well-developed. In combination with the historical conditions of structural surfaces after slope excavation, the structural surfaces of the mining slope rock mass are classified as semi-hard rock type. In accordance with Table 9, the effective stress parameters (c′ and ′) for the structural surfaces were selected as a cohesion value of 13 kPa and an internal friction angle value of 9°.

Table 9.
Standard value of shear strength of structural surfaces in slope rock mass.
- (3)
- Analysis of Calculation Results
Using the GEO5 software, calculations were conducted on combinations of structural surfaces prone to wedge failure, as listed in Table 10. The wedge analysis determined the relationship between the resisting force and the sliding force on the slope sections and the dominant structural surfaces. The wedge failure safety factor is the ratio of the resisting force to the sliding force. In simple terms, a ratio exceeding 1 implies resisting force exceeds sliding force, making wedge failure less likely. The schematic diagram of wedge-shaped fracture is shown in Figure 25.

Table 10.
Rock mass structure surface parameters.

Figure 25.
Schematic diagram of SectionWedge failure.
Wedge analyses were performed on the unstable structures of the designed slope Sections XL1 and XL4. The calculation results are shown in Table 11. Results show that under three conditions, self-weight and groundwater, self-weight and groundwater and blasting vibration, and self-weight and groundwater and seismic action, the safety factor of the unstable structural surfaces meets the requirements. However, as the structural surfaces of XL4 are more developed, it is recommended to use safety measures such as rock bolts, removal of loose rocks, and drainage ditches to ensure the stability of the XL4 slope.

Table 11.
SectionWedge failure settlement results.
5. Three-Dimensional Stability Analysis of Slope
5.1. A Numerical Analysis Model Is Established
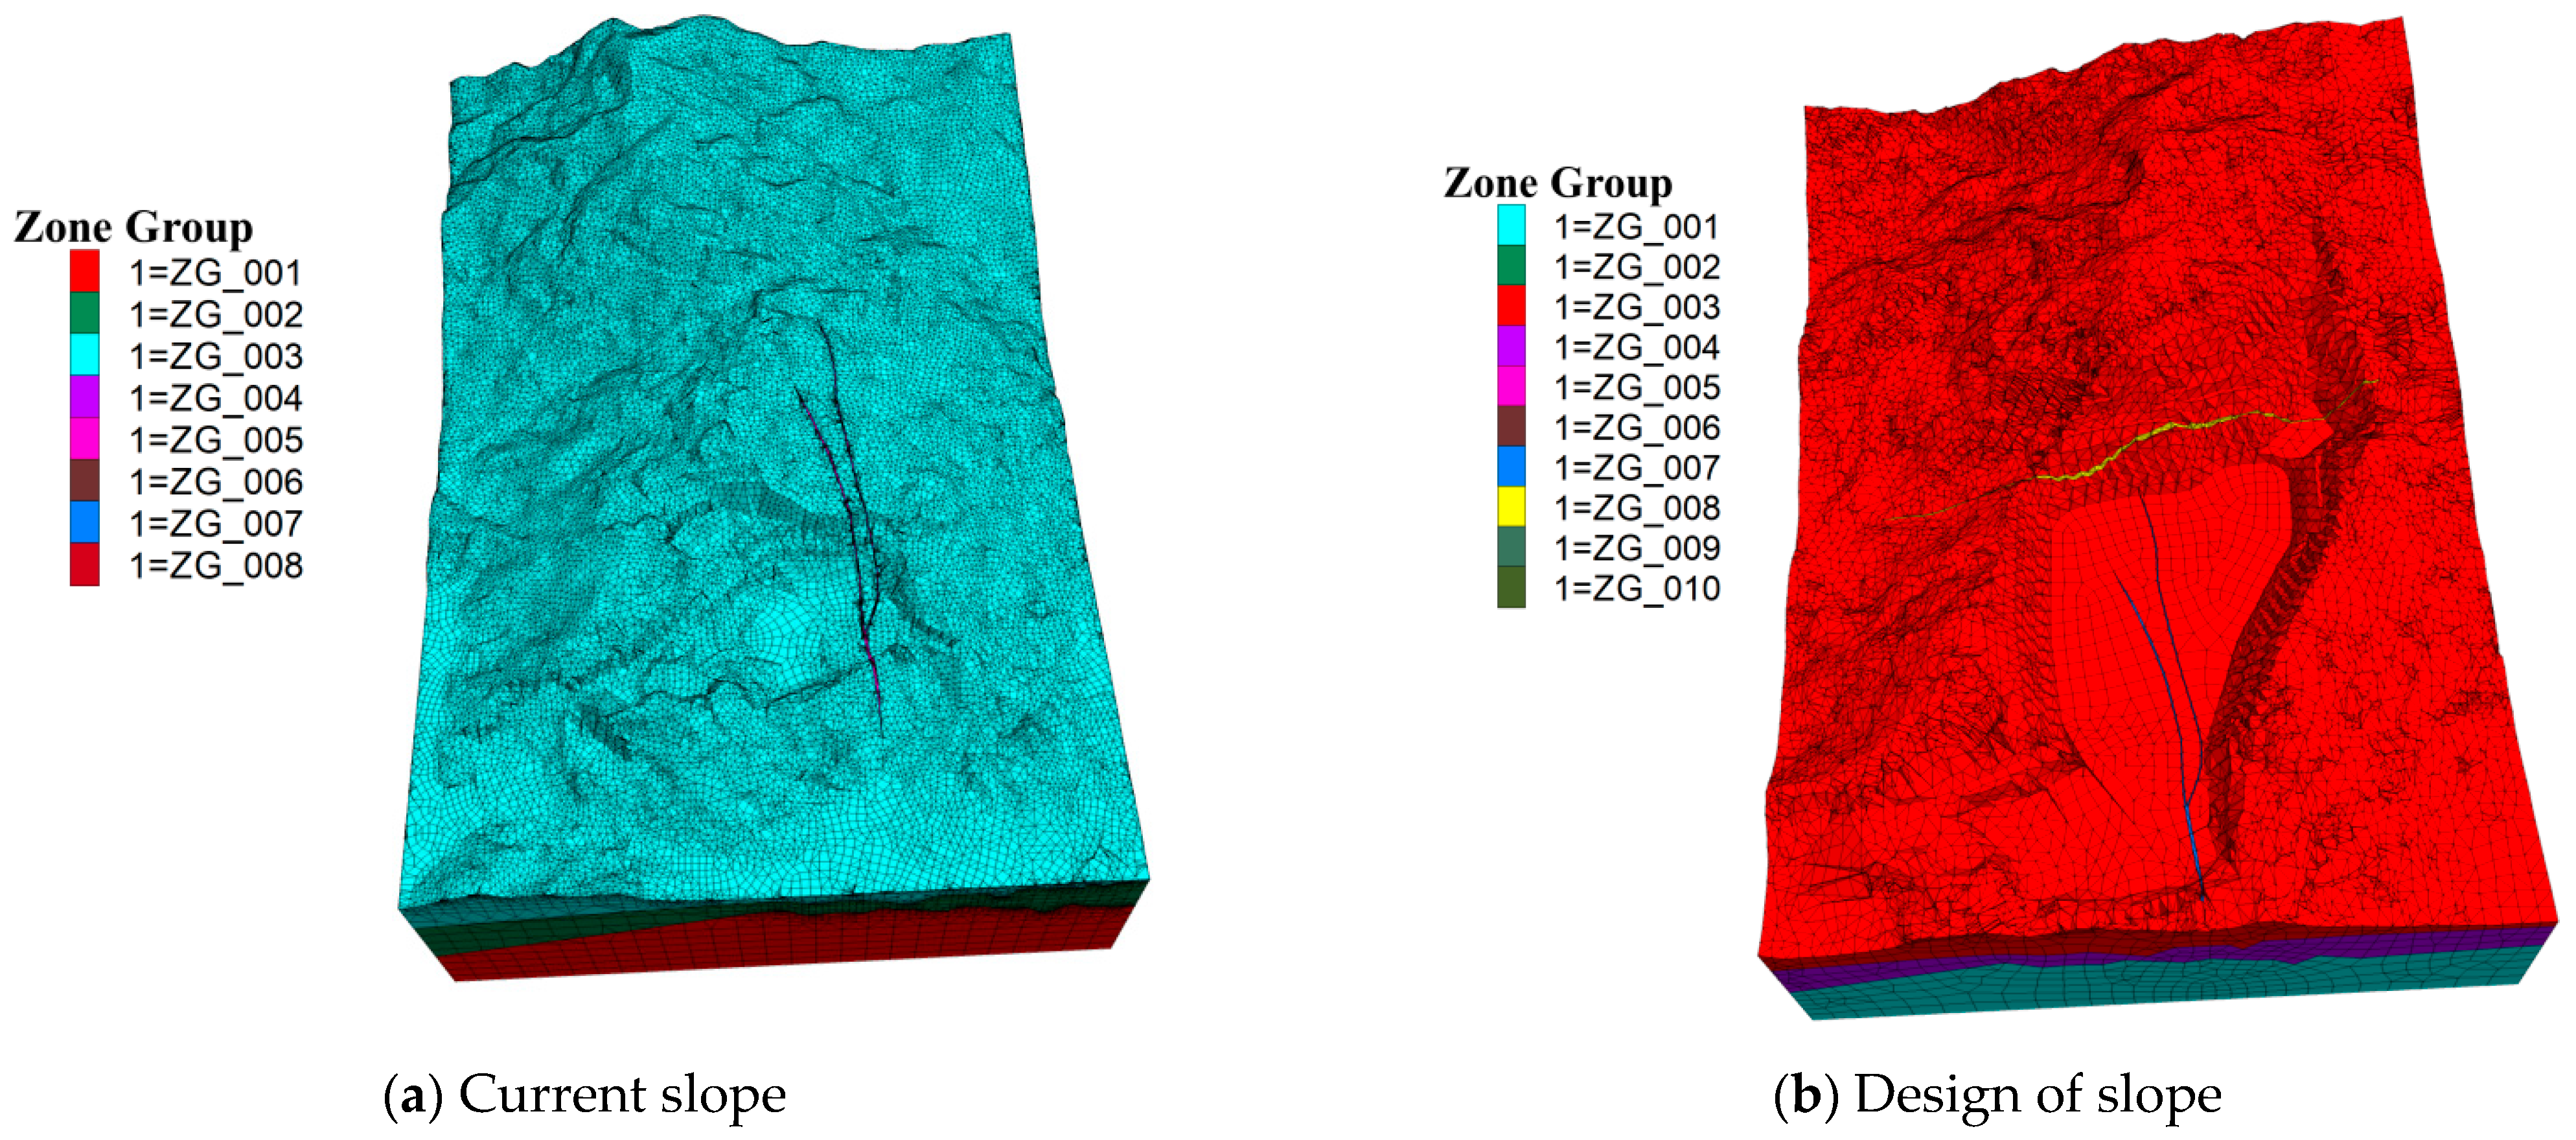
To scientifically evaluate the stability of the open-pit mine, a highly realistic 3D numerical model was constructed using Flac3D 6.0 and based on the geological prototype. Given the complex rock mass structure and limited survey data, the actual slope was reasonably generalized during modeling. Geological entity modeling integrated data from mine surface surveys, drill core analysis, and final pit design. Rhinoceros software (V7.0) was used for surface reconstruction to generate solid models. The Griddle plugin discretized the domain into tetrahedral elements. Element density was controlled by local refinement: dense meshes (element size ≤ 3 m) near the pit and at stratum interfaces, and sparse meshes (element size ≥ 10 m) in surrounding rock. The initial boundary conditions applied normal constraints to the model sides and base: x-displacement was constrained at the left and right interfaces, y-displacement at the front and back interfaces, and z-displacement at the base. All calculation models used the Mohr–Coulomb criterion []. The model calculation is shown in Figure 26.

Figure 26.
Numerical model grid division.
Based on the test results of the various strata at the site, the indoor test data, and the empirical values of each soil and rock layer in the project area, the main parameter values of each soil and rock layer are shown in Table 3. The faults are relatively fragmented, and the parameters of strongly weathered and fully weathered granite are adopted for calculation.
5.2. Statistical Analysis of Working Condition and Scheme Design
The three-dimensional calculation conditions were set as follows:
- (1)
- Self-weight and groundwater: The initial water table was built from engineering survey data. The final slope surface was set as a zero-hydraulic-head boundary. The pore water pressure field under seepage equilibrium was solved to perform self-weight stress and stability calculations, showing the mechanical effect of groundwater on the final slope.
- (2)
- Self-weight, groundwater, and blasting vibration: As the Early Cretaceous granite (with a saturated uniaxial compressive strength of >60 MPa) in the mining area requires blasting for extraction, on the basis of Condition 1, the dynamic vibration load from blasting was added. This quantified how blasting affects the coupled seepage-stress field.
5.3. Analysis of Slope Calculation Results Under Current Situation
- (1)
- Analysis of slope force deformation and failure characteristics under self-weight and groundwater conditions
The results are shown in Figure 27. Under loads mainly from rock self-weight, the slope’s maximum principal stress is tensile, reaching 0.92 MPa. The existing slope deformation is mainly in the mid-lower part of the western high slope, with a maximum of 2.04 mm.

Figure 27.
Cloud calculation of slope under self-weight and groundwater action.
- (2)
- Analysis of Slope Stress, Deformation, and Failure Characteristics under Blasting Loads
Figure 28a shows the maximum principal stress distribution on the slope under self-weight, groundwater, and blasting effects. The results show that the slope surface is mainly under tensile stress, with a maximum of 1.24 MPa. Figure 28b shows the three-dimensional deformation distribution of the slope under self-weight, groundwater, and blasting vibration. The existing slope deformation is mainly in the mid-lower part of the western high slope. Due to blasting, the maximum slope deformation increases to 3.18 mm.

Figure 28.
Cloud calculation diagram of slope force deformation and failure characteristics under blast load.
5.4. Analysis of Force Deformation and Failure Characteristics of Slope Design
- (1)
- Analysis of slope force deformation and failure characteristics under self-weight and groundwater conditions
As shown in Figure 29a, under loads primarily from rock self-weight, the maximum principal stress on the slope is mainly tensile, reaching 0.10 MPa. Figure 29b illustrates the 3D deformation distribution of the slope. Deformation is mainly concentrated in the mid-lower parts of the designed slopes in areas B and C, with the fault located in the center of the deformation zone, and the maximum deformation is 3.78 mm.

Figure 29.
Cloud diagram of force deformation and failure characteristics of slope under self-weight and groundwater condition.
- (2)
- Analysis of force deformation and failure characteristics of slope under blast load
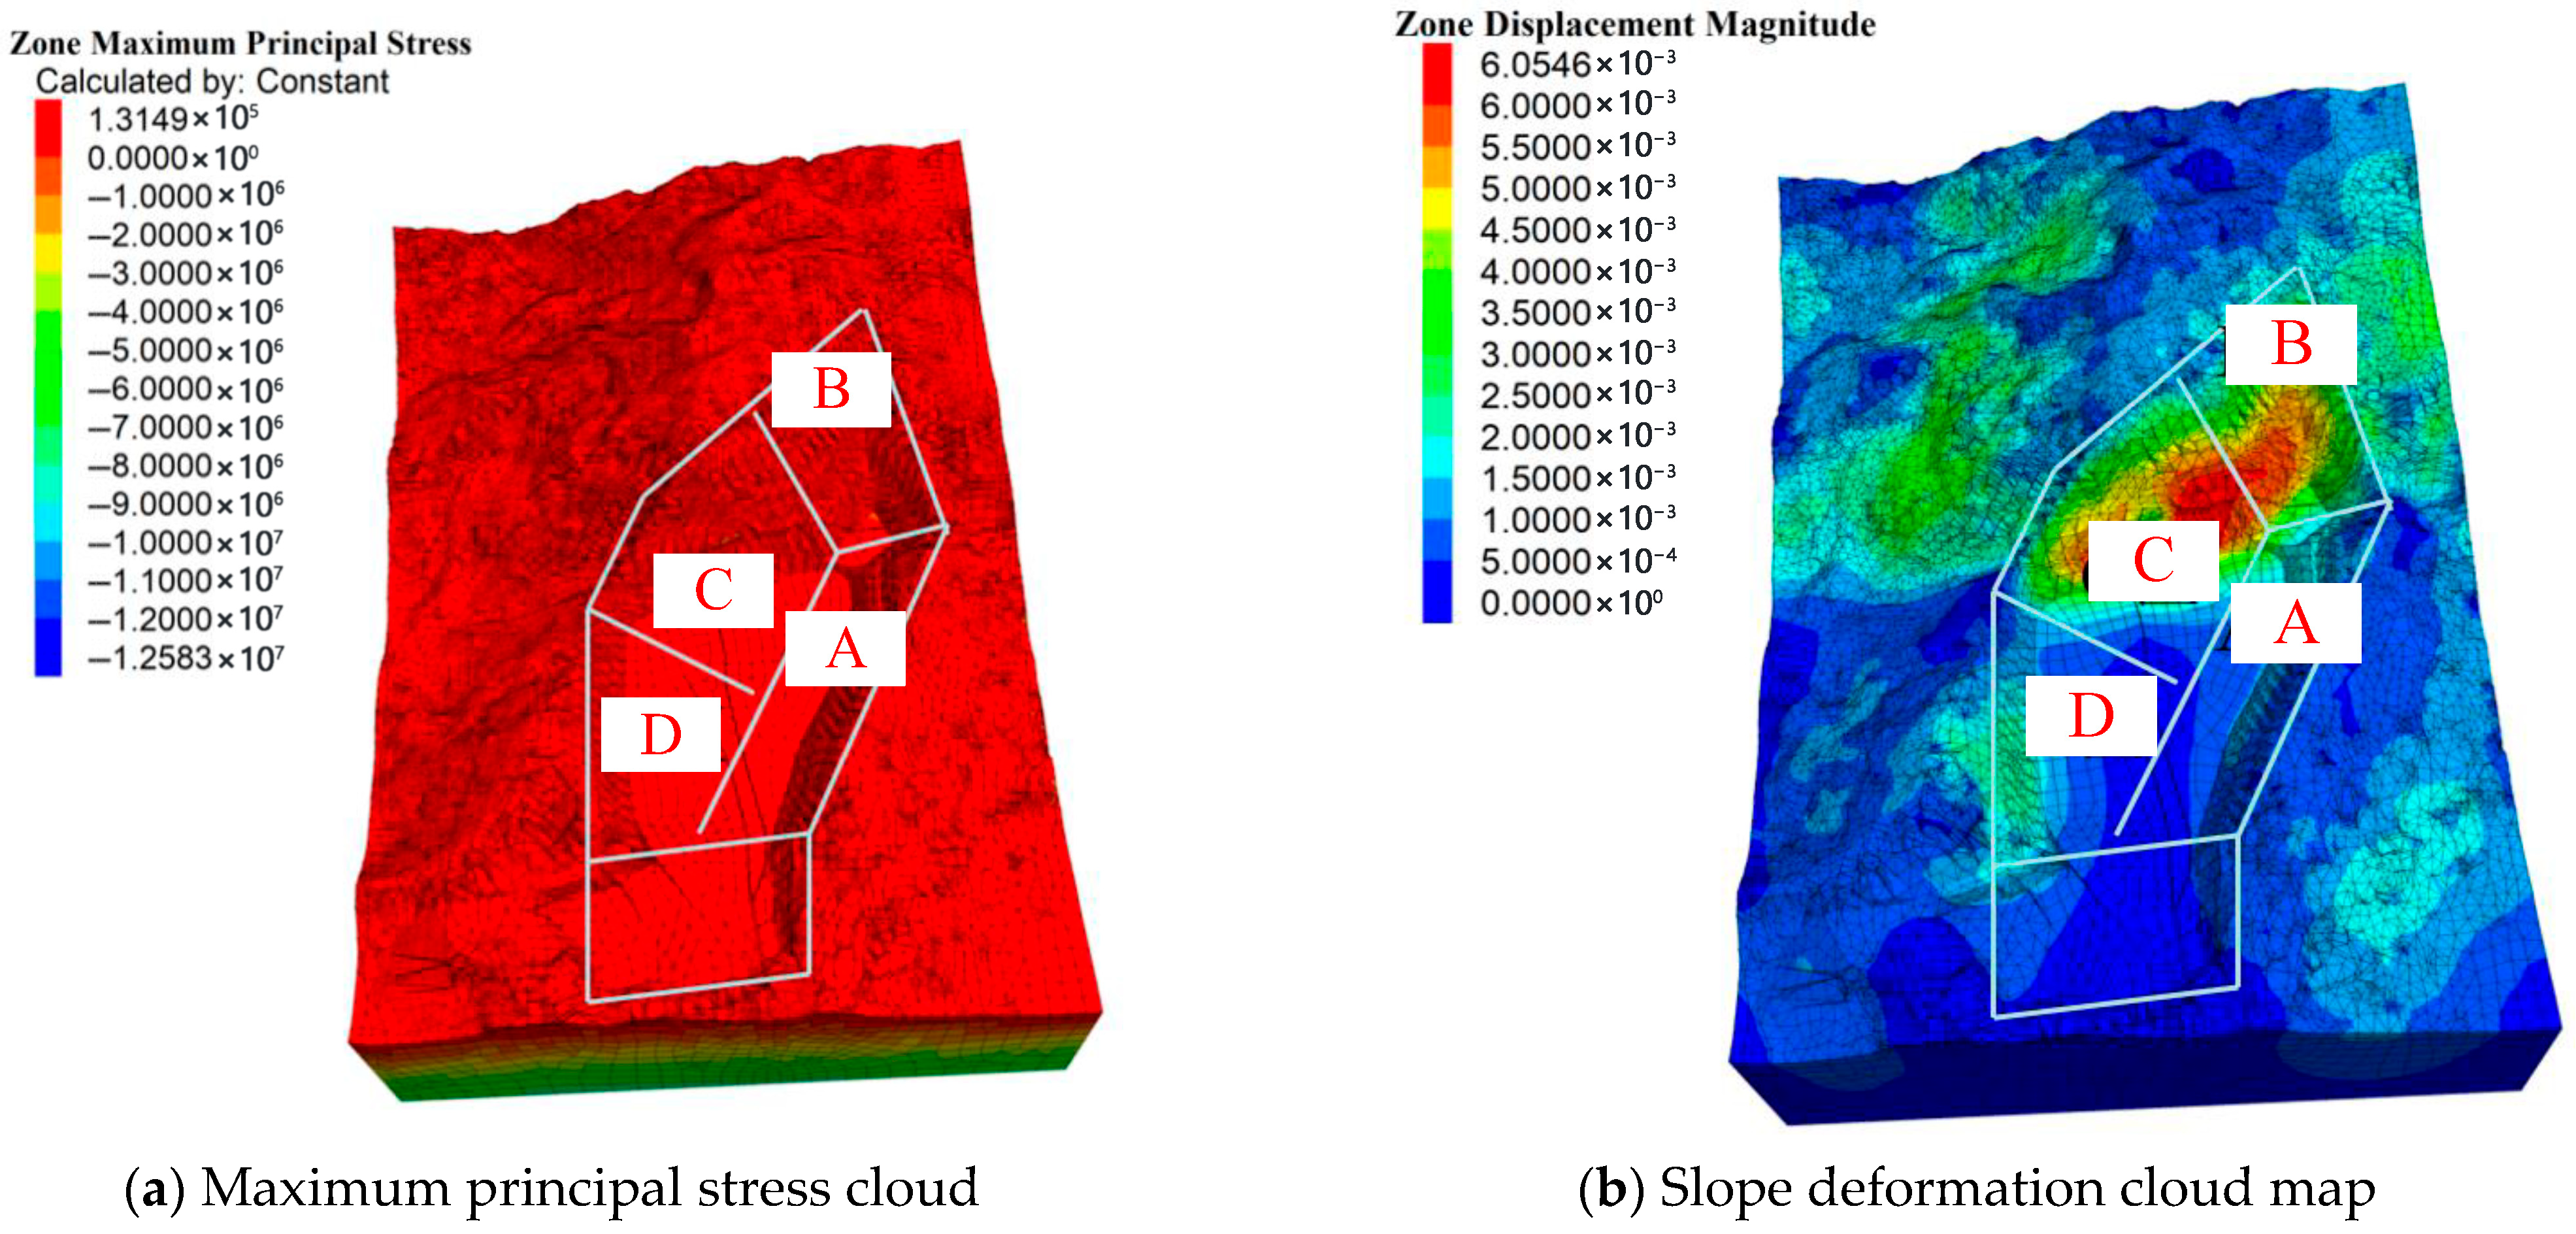
Figure 30a shows the maximum principal stress distribution on the slope under self-weight, groundwater, and blasting effects. The slope surface is predominantly under tensile stress, with a maximum of 0.13 MPa. Figure 30b presents the 3D deformation distribution of the slope under self-weight, groundwater, and blasting vibration. Deformation is mainly concentrated in the mid-lower parts of the designed slopes in areas B and C, with the fault at the center of the deformation zone. Due to blasting, the maximum slope deformation increases to 6.05 mm.

Figure 30.
Analysis of force deformation and failure characteristics of slope under blast load.
Through 3D slope stability analysis, the following conclusions were obtained: The deformation zones of existing slopes are mainly concentrated in the middle-lower sections of the western high slopes. Blast activities have significantly increased tensile stress on the slope surfaces, leading to greater deformation and substantial impacts. The design deformation zones primarily occur in the middle-lower sections of slopes B and C, with the fault located at the core of the deformation zone.
6. Landscape Slope Risk Control Measures
6.1. Slope Reinforcement
The choice of reinforcement measures depends on key parameters such as engineering geological structure, hydrogeological characteristics, rock mass mechanical properties, landslide patterns and scales, and slope service life. Industry practice indicates that the reinforcement of slopes in metal and non-metal mines mainly follows four technical approaches: slope cutting and loading reduction, counter-pressure at the slope foot, rock mass strength improvement, and the construction of retaining structures. From the perspective of mechanical mechanisms, the essence of reinforcement lies in enhancing the shear strength parameters of potential sliding masses. Only the slope cutting method reduces gravitational loads to decrease driving forces. Drainage measures have a dual effect: they enhance rock mass effective stress (thereby increasing resisting forces) through matrix suction and significantly weaken the softening effect of pore water pressure on structural surfaces. The applicability and mechanisms of these methods are detailed in Table 12.

Table 12.
Reinforcement methods for open slope landslides.
6.2. Management Optimization
- (1)
- Geological Dynamic Control Mechanism
Conduct integrated engineering geological and hydrogeological investigations in real time based on the rock mass exposed in the open-pit mine. Update geological information iteratively to build a predictive model for the evolution of slope rock mass structure. This model guides the optimization of mining processes and provides geological decision-making support for preventing potential landslides. This mechanism requires dynamic verification of the accuracy of geological models as mining progresses, with a focus on monitoring changes in weak interlayers, structural surface attitudes, and groundwater seepage paths.
- (2)
- Multi-Source Monitoring Coordinated System
Establish a monitoring network that integrates groundwater level dynamics (water pressure and flow), blasting vibration effects, and slope displacement. Analyze the data comprehensively to reveal the deformation patterns of the slope under hydrological and mechanical coupling effects. Monitoring management requires a professional team and intelligent instruments, and strictly follows standardized testing procedures, including cycles, analysis methods, and result application systems. Blasting monitoring data is directly fed back into the blasting parameter optimization system to control vibration hazards, while displacement monitoring identifies stability warnings through sudden changes in time-history curves.
- (3)
- Full-Process Slope Control in Mining
Process Compliance Control: Strictly follow the designed mining methods, sequences, and scales. Prohibit over-digging and under-digging that may destroy the rock mass structure. When geological conditions change, adjust processes dynamically based on monitoring data in collaboration with technical departments.
Blasting Precision Management: Use a pre-split blasting-buffer charging-micro-differential initiation technology chain (in compliance with GB6722 control standards). Optimize the blast hole parameters and single-stage charge quantities based on vibration monitoring feedback. Coordinate the spatial and temporal relationships between bench blasting and production blasting to mitigate vibration propagation effects.
Tiered Maintenance System: Routine maintenance includes slope inspections (removal of dangerous rock masses, the cleaning of drainage ditches, and repair of protective layers). Additional rockfall interception facilities are installed in high-risk areas. Special maintenance includes implementing drainage engineering in areas with abnormal water level rises and adopting integrated technologies of slope reduction, counter-pressure, and retaining structures for sections with sudden deformation changes to ensure safe operation throughout the slope’s lifecycle.
7. Discussion
This study demonstrates the value of an integrated multi-method approach for assessing open-pit slope stability, synergizing geological surveys, laboratory testing, limit equilibrium analysis, and 2D/3D numerical simulations. The complementary use of these methods overcomes inherent limitations of single-technique applications, especially in complex geological settings with faults and variable weathering profiles.
Compared to conventional studies that often rely on isolated methodologies [,], our coupled framework provides a more holistic understanding of deformation mechanisms. For instance, while limit equilibrium methods efficiently identified overall safety factors, numerical simulations explicitly revealed localized failure mechanisms, such as wedge-type instabilities in benched sections and composite sliding along weathered zones—addressing known gaps in pre-defined failure surface assumptions []. Furthermore, 3D analysis captured spatial deformation patterns, particularly in the mid-lower western slope and fault zones, which 2D models might overlook.
A key finding is the critical influence of material heterogeneity and environmental coupling on slope performance. For example, the strongly weathered layer in section XL3 significantly reduced slope stability, necessitating a design adjustment from 38° to 37°, consistent with studies emphasizing weathering impact []. Moreover, rainfall and blasting vibrations were found to synergistically increase tensile stress and accelerate deformation, supporting claims that dynamic–hydrological coupling is essential in slope assessments [,].
The proposed mitigation strategies, including slope angle reduction, bolting, and drainage, are consistent with established practices but are now better justified through multi-method validation. However, their efficacy highly depends on site-specific conditions. For instance, drainage measures are less effective in low-permeability layers, and rock bolting requires competent rock mass conditions.
While real-time monitoring is recommended for dynamic risk management, integrating multi-source data (e.g., groundwater, vibration, displacement) remains challenging. Future studies should incorporate machine learning and IoT-based monitoring systems to enhance predictive capacity and operational safety.
In conclusion, this integrated approach not only improves the accuracy of stability evaluations but also provides actionable insights for designing safer and more efficient mining slopes. It underscores the necessity of combining diverse methods to address the complex and variable nature of open-pit mining geomechanics.
8. Limitations
Despite achieving certain results in optimizing open-pit mine slope stability and risk prevention, this study has the following limitations:
- (1)
- Complex Geological Conditions: The mining area has complex geological conditions with significant variations in rock mass properties, strong joint and fracture development, and weak structural surfaces like faults. These conditions pose challenges for slope stability analysis, and the limitations of geological exploration may affect the accuracy of the analysis.
- (2)
- Limitations of Analytical Methods: Each analytical method has its limitations. Limit equilibrium methods assume homogeneous rock and soil masses and cannot account for heterogeneity and nonlinearity. Numerical simulation methods require extensive input parameters and have strict requirements for model establishment and boundary conditions. Results from different methods may vary and need to be analyzed comprehensively.
- (3)
- Accuracy and Timeliness of Monitoring Data: The accuracy and timeliness of monitoring data are crucial for slope risk prevention. However, monitoring data may have errors due to equipment precision and environmental interference. Real-time data transmission and processing also have delays, which may affect the timeliness and accuracy of slope stability assessments.
- (4)
- Economic Costs of Risk Prevention Measures: The selection of risk prevention measures must consider economic costs. Some effective measures may be too expensive and exceed the project budget. A balance between safety and cost-effectiveness is needed.
9. Conclusions
Based on the existing technical data of the mining area, combined with field investigations, sampling, laboratory rock mechanics testing, and rock mass quality classification results, this study employs stereographic projection analysis, wedge failure analysis, two-dimensional limit equilibrium method, and three-dimensional numerical simulation to complete the stability analysis and slope angle optimization study for the open-pit mine slopes. A preliminary monitoring scheme for the mine slopes is also designed. The main research findings are as follows:
- (1)
- In mine slopes, circular and compound failures are the main types, with local areas prone to wedge failures. The existing L1-L4 bench slopes may experience wedge failures. To ensure safety, it is recommended to promptly remove surface loose rocks and implement safety measures such as concrete hardening and rock bolt reinforcement.
- (2)
- Through overall stability calculations of the designed pit slopes under three working conditions scenarios, the overall slope safety factors meet the specification requirements. However, the safety factor for the localized highly weathered layer in Section XL3 does not satisfy the requirements. After optimizing the slope angle of the highly weathered layer in the designed slope Section XL3 from 38° to 37°, its safety factor meets the specification requirements.
- (3)
- Stability analysis of the existing slopes using the limit equilibrium method indicates that the safety factors for slopes L1 to L4 meet the specification requirements. Wedge analysis results for the designed slope Sections XL1 and XL4 show that the safety factors for unstable structural planes within the designed slopes satisfy the requirements under all three scenarios: self-weight combined with groundwater, self-weight alone, and self-weight combined with groundwater, blasting vibration, and seismic loading. However, factors such as blasting and rainfall will continuously reduce the strength of the slope rock mass. Collapse risks in areas with well-developed fractures still require attention. Measures such as concrete hardening and rock bolting should be implemented when necessary to ensure slope safety.
- (4)
- The following evaluation conclusions are obtained through three-dimensional slope stability analysis and calculations: The deformation zones in the existing slopes are mainly concentrated in the middle-lower sections of the high slopes on the western side. The deformation zones in the designed slopes are primarily located in the middle-lower sections of slopes in Zones B and C, with faults situated at the center of the deformation belts. Rainfall, blasting, and seismic action significantly increase the tensile stress on the slope surfaces, leading to increased deformation and exerting a substantial influence. Special attention to risks and enhanced real-time monitoring are required during the excavation of the middle-lower sections of slopes in Zones B and C.
- (5)
- This research provides an integrated multimethodology framework for slope stability assessment that effectively combines traditional analytical methods with advanced 3D numerical modeling. The study’s most notable contribution is the development of a practical approach for identifying critical stability thresholds in complex geological settings, particularly for highly weathered rock formations. The optimization strategy for slope angles in specific geological sections and the implementation recommendations for monitoring and reinforcement measures provide valuable guidance for similar mining operations.
- (6)
- Future research will focus on developing real-time monitoring systems incorporating IoT sensors and wireless communication technology to continuously track slope deformation, groundwater variations, and blasting impacts. We also plan to establish a machine learning-based early warning system that integrates multi-source monitoring data for predictive stability assessment. Additionally, further studies will investigate long-term weathering effects on rock mass properties and the efficiency of various reinforcement strategies under different geological conditions.
- (7)
- In terms of engineering suggestions, the excavation techniques should be optimized by adopting staged excavation with step heights and widths that match the geological conditions to minimize localized stress concentration. For stabilization/remedial works, besides the concrete hardening and rock bolting mentioned above, the implementation of advanced geotechnical structures like soil nail walls or micropile retaining walls should be considered in high-risk zones. Furthermore, the establishment of an efficient drainage system to reduce water pressure on the slopes is essential for maintaining stability. The reinforcement measures should be dynamically adjusted based on real-time monitoring data to ensure the safety of the slopes throughout the mining process.
Author Contributions
Writing and editing, H.C.; Software, B.W.; Methodology Z.D. All authors have read and agreed to the published version of the manuscript.
Funding
This research was funded by the Doctoral research startup fund project of East China University of Technology (No. DHBK2019011) and Open Fund from Engineering Research Center for Digital Risk Control of Underground Engineering of Jiangxi Province (No. JXDFJJ2024-001).
Data Availability Statement
The data that support the findings of this study are available from the corresponding author upon reasonable request.
Acknowledgments
This research would not have been possible without the dedicated efforts and collaborative input of the entire team. We extend our sincere appreciation to Zhongsi Dou for his valuable advice and insightful suggestions, which greatly enhanced the methodological development of this study. We also thank Baoliang Wang for his active role in software development and constructive discussions throughout the project. The collective contributions were instrumental in achieving our research objective of optimizing slope stability in open-pit mines.
Conflicts of Interest
The authors declare no conflicts of interest.
References
- Li, S.; Su, W.; Yin, T.; Dan, Z.; Peng, K. Research Progress and Typical Case of Open-Pit to Underground Mining in China. Appl. Sci. 2025, 15, 8530. [Google Scholar] [CrossRef]
- Kolapo, P.; Oniyide, G.O.; Said, K.O.; Lawal, A.I.; Onifade, M.; Munemo, P. An Overview of Slope Failure in Mining Operations. Mining 2022, 2, 350–384. [Google Scholar] [CrossRef]
- Badakhshan, N.; Shahriar, K.; Afraei, S.; Bakhtavar, E. Evaluating the Impacts of the Transition from Open-Pit to Underground Mining on Sustainable Development Indexes. J. Sustain. Min. 2023, 22, 155–168. [Google Scholar] [CrossRef]
- Li, R.; Guo, Y.; Zhou, W.; Lu, X.; Zhang, Z.; Tian, Y.; Qi, X. Freeze–Thaw Damage Characteristics of Soil–Rock Mixtures in Open-Pit Coal Mines and Stability Analysis of Slopes in Discharge Sites Based on Partial Flow Code. Appl. Sci. 2024, 14, 11585. [Google Scholar] [CrossRef]
- Fredrick, K.O.; Mwakumanya, M.A.; Tole, M.P. Slope Stability Analysis at Soapstone Mining Sites in Nyamarambe, Kisii County, Kenya. Int. J. Geogr. Geol. Environ. 2023, 5, 95–110. [Google Scholar] [CrossRef]
- Li, X.; Li, Q.; Hu, Y.; Teng, L.; Yang, S. Evolution Characteristics of Mining Fissures in Overlying Strata of Stope after Converting from Open-Pit to Underground. Arab. J. Geosci. 2021, 14, 2795. [Google Scholar] [CrossRef]
- Dintwe, T.K.M.; Sasaoka, T.; Shimada, H.; Hamanaka, A.; Moses, D. Evaluating the Influence of Underground Mining Sequence under an Open Pit Mine. J. Min. Sci. 2022, 58, 35–43. [Google Scholar] [CrossRef]
- Rafiei Renani, H.; Martin, C.D. Slope Stability Analysis Using Equivalent Mohr–Coulomb and Hoek–Brown Criteria. Rock Mech. Rock Eng. 2020, 53, 13–21. [Google Scholar] [CrossRef]
- Azarafza, M.; Akgün, H.; Ghazifard, A.; Asghari-Kaljahi, E.; Rahnamarad, J.; Derakhshani, R. Discontinuous Rock Slope Stability Analysis by Limit Equilibrium Approaches—A Review. Int. J. Digit. Earth 2021, 14, 1918–1941. [Google Scholar] [CrossRef]
- Zhao, X.; Yu, W.; Zhao, Y.; Fu, S. Numerical Estimation of Shaft Stability and Surface Deformation Induced by Underground Mining Transferred from Open-Pit Mining in Jinfeng Gold Mine. Minerals 2023, 13, 196. [Google Scholar] [CrossRef]
- Li, X.; Wang, Y.; Hu, Y.; Zhou, C.; Zhang, H. Numerical Investigation on Stratum and Surface Deformation in Underground Phosphorite Mining under Different Mining Methods. Front. Earth Sci. 2022, 10, 831856. [Google Scholar] [CrossRef]
- Siddique, A.; Tan, Z.; Tan, N.; Ahmad, H.; Li, J.; Liu, J.; Khurram, S.H.; Jiang, Y.; Zeng, N. Remote Sensing and Numerical Simulation for Slope Stability in Open-Pit Mining: Case Study of Sijiaying Iron Ore Mine, China. Geotech. Geol. Eng. 2025, 43, 290. [Google Scholar] [CrossRef]
- Szmigiel, A.; Apel, D.B.; Pourrahimian, Y.; Dehghanpour, H.; Pu, Y. Exploring Machine Learning Techniques for Open Stope Stability Prediction: A Comparative Study and Feature Importance Analysis. Rock Mech. Bull. 2025, 4, 100146. [Google Scholar] [CrossRef]
- Baskari, T.L. Study on Rheological Constitutive Model of Cililin Volcanic Clay, Indonesia in Relation to Long-Term Slope Stability. GeoMate 2021, 21, 40–47. [Google Scholar] [CrossRef]
- Ding, Q.-L.; Peng, Y.-Y.; Cheng, Z.; Wang, P. Numerical Simulation of Slope Stability during Underground Excavation Using the Lagrange Element Strength Reduction Method. Minerals 2022, 12, 1054. [Google Scholar] [CrossRef]
- Nguyen, P.M.V.; Marciniak, M. Stochastic Rock Slope Stability Analysis: Open Pit Case Study with Adjacent Block Caving. Geotech. Geol. Eng. 2024, 42, 5827–5845. [Google Scholar] [CrossRef]
- Li, S.; Zhao, Z.; Hu, B.; Yin, T.; Chen, G.; Chen, G. Three-Dimensional Simulation Stability Analysis of Slopes from Underground to Open-Pit Mining. Minerals 2023, 13, 402. [Google Scholar] [CrossRef]
- Karir, D.; Ray, A.; Kumar Bharati, A.; Chaturvedi, U.; Rai, R.; Khandelwal, M. Stability Prediction of a Natural and Man-Made Slope Using Various Machine Learning Algorithms. Transp. Geotech. 2022, 34, 100745. [Google Scholar] [CrossRef]
- Teng, L.; He, Y.; Wang, Y.; Sun, C.; Yan, J. Numerical Stability Assessment of a Mining Slope Using the Synthetic Rock Mass Modeling Approach and Strength Reduction Technique. Front. Earth Sci. 2024, 12, 1438277. [Google Scholar] [CrossRef]
- Sdvyzhkova, O.; Moldabayev, S.; Bascetin, A.; Babets, D.; Kuldeyev, E.; Sultanbekova, Z.; Amankulov, M.; Issakov, B. Probabilistic Assessment of Slope Stability at Ore Mining with Steep Layers in Deep Open Pits. Min. Miner. Depos. 2022, 16, 11–18. [Google Scholar] [CrossRef]
- Rajan, K.C.; Aryal, M.; Sharma, K.; Bhandary, N.P.; Pokhrel, R.; Acharya, I.P. Development of a Framework for the Prediction of Slope Stability Using Machine Learning Paradigms. Nat. Hazards 2025, 121, 83–107. [Google Scholar] [CrossRef]
- Casale, M.; Dino, G.A.; Oggeri, C. Blasting of Unstable Rock Elements on Steep Slopes. Appl. Sci. 2025, 15, 712. [Google Scholar] [CrossRef]
- Du, S.-G.; Saroglou, C.; Chen, Y.; Lin, H.; Yong, R. A New Approach for Evaluation of Slope Stability in Large Open-Pit Mines: A Case Study at the Dexing Copper Mine, China. Env. Earth Sci. 2022, 81, 102. [Google Scholar] [CrossRef]
- Wang, T.; Yuan, L.; Bi, M. Finite Element Analysis of Slope Stability of Fushun West Open-Pit Mine. Teh. Vjesn. 2024, 31, 1968–1974. [Google Scholar] [CrossRef]
- Li, Q.; Song, D.; Yuan, C.; Nie, W. An Image Recognition Method for the Deformation Area of Open-Pit Rock Slopes under Variable Rainfall. Measurement 2022, 188, 110544. [Google Scholar] [CrossRef]
- Li, S.; Yu, L.; Dan, Z.; Yin, T.; Chen, J. The Recent Progress China Has Made in Mining Method Transformation, Part I: Shrinkage Method Transformed into Backfilling Method. Appl. Sci. 2024, 14, 10033. [Google Scholar] [CrossRef]
- Chung, J.; Asad, M.W.A.; Topal, E. Timing of Transition from Open-Pit to Underground Mining: A Simultaneous Optimisation Model for Open-Pit and Underground Mine Production Schedules. Resour. Policy 2022, 77, 102632. [Google Scholar] [CrossRef]
- Jiang, J.; Lu, Y.; Wang, D.; Han, X. Slope Stability Calculation Method for Highwall Mining with Open-Cut Mines. Sci. Rep. 2022, 12, 209. [Google Scholar] [CrossRef]
- McQuillan, A.; Bar, N. The Necessity of 3D Analysis for Open-Pit Rock Slope Stability Studies: Theory and Practice. J. S. Afr. Inst. Min. Metall. 2023, 123, 63–69. [Google Scholar] [CrossRef]
- Sarpong, S.O.; Olaleye, B.M.; Kunkyin-Saadaari, F.; Agyei, G. Slope Stability Assessment of Some Waste Rock Dumps at a Typical Gold Mine in Ghana. Niger. J. Technol. 2023, 42, 83–91. [Google Scholar] [CrossRef]
- GB/T 50218-2014; Standard for Engineering Classification of Rock Mass. Ministry of Housing and Urban-Rural Development of the People’s Republic of China, China Planning Press: Beijing, China, 2014.
- GB 51016-2014; Technical Specification for Slope Engineering of Non-Coal Open-Pit Mines. Ministry of Housing and Urban-Rural Development of the People’s Republic of China, China Planning Press: Beijing, China, 2014.
- Wang, X.; Hu, X.; Liu, C.; Niu, L.; Xia, P.; Wang, J. Research on Reservoir Landslide Thrust Based on Improved Morgenstern-Price Method. J. Earth Sci. 2024, 35, 1263–1272. [Google Scholar] [CrossRef]
- Chen, W.-S.; Dai, J.-N.; Jiang, M.-L.; Li, Y.-H.; Liang, Y. Imbalance thrust force method for transferring the maximum thrust force. Chin. J. Geotech. Eng. 2022, 44, 181–186. [Google Scholar] [CrossRef]
- Zhang, F.; Pei, H. Stability analysis of shallow slopes under rainfall infiltration considering tensile strength cut-off. Comput. Geotech. 2024, 171, 106327. [Google Scholar] [CrossRef]
- Zhang, L.; Jiang, X.; Sun, R.; Gu, H.; Fu, Y.; Qiu, Y. Stability analysis of unsaturated soil slopes with cracks under rainfall infiltration conditions. Comput. Geotech. 2024, 165, 105907. [Google Scholar] [CrossRef]
- GB 50021-2016; Code for Investigation of Geotechnical Engineering. Ministry of Housing and Urban-Rural Development of the People’s Republic of China, China Building Industry Press: Beijing, China, 2016.
- GB 50007-2011; Code for Design of Building Foundation. Ministry of Housing and Urban-Rural Development of the People’s Republic of China, China Building Industry Press: Beijing, China, 2011.
- Niu, G.; Kong, L.; Miao, Y.; Li, X.; Chen, F. A Modified Method for the Fredlund and Xing (FX) Model of Soil-Water Retention Curves. Processes 2023, 12, 50. [Google Scholar] [CrossRef]
- Li, C.; Yuan, J.; Cui, J.; Shan, Y.; Yu, S. Mohr–Coulomb-Model-Based Study on Gas Hydrate-Bearing Sediments and Associated Variance-Based Global Sensitivity Analysis. J. Mar. Sci. Eng. 2025, 13, 440. [Google Scholar] [CrossRef]
Disclaimer/Publisher’s Note: The statements, opinions and data contained in all publications are solely those of the individual author(s) and contributor(s) and not of MDPI and/or the editor(s). MDPI and/or the editor(s) disclaim responsibility for any injury to people or property resulting from any ideas, methods, instructions or products referred to in the content. |
© 2025 by the authors. Licensee MDPI, Basel, Switzerland. This article is an open access article distributed under the terms and conditions of the Creative Commons Attribution (CC BY) license (https://creativecommons.org/licenses/by/4.0/).