Abstract
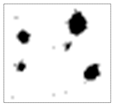
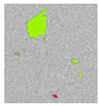
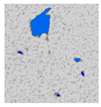
The determination of uncertainty in porosity analysis based on X-ray computed tomography (XCT) images is currently the focus of research. This study aims to contribute to that by investigating the variation in porosity analysis resulting only from the segmentation and data analysis and by focusing on metal parts produced by different additive manufacturing processes, partially fabricated with intended porosity. Samples manufactured from aluminum, titanium alloy and nickel-chromium-based feedstock by liquid metal jetting (LMJ), laser-based powder bed fusion (PBF-LB) and directed energy deposition (DED) were scanned by XCT. The reconstructed volumes were distributed to four operators with different experience levels using Avizo, Dragonfly, Image J/Fiji, IPSDK Explorer, and VG Studio Max for porosity analysis. It was found that for all parts, the majority of operators chose a global manual threshold for image segmentation. Depending on the characteristics of the pores in the investigated samples, relative standard uncertainties up to 12% and 38% were observed for the LMJ and PBF-LB parts. For the part produced by DED, which showed the lowest overall porosity, relative standard uncertainties between 70% and 89% were observed for different image qualities; all were affected by the presence of artefacts investigated on purpose.
1. Introduction
X-ray computed tomography (XCT) allows for the non-destructive inspection of parts and has become of particular interest for the investigation of components produced by additive manufacturing (AM). The layer-wise build-up enables complex geometries with internal features, but often is accompanied by increased microstructural discontinuities in the fabricated part compared to traditional manufacturing processes. Pores in the material are a typical phenomenon that can lead to component failure. As a non-destructive means of detection within the frame of quality assurance, porosity analysis based on XCT data has become a popular tool for the identification and quantification of pores in AM parts [1,2].
Metal-based additive manufacturing processes, in particular, have found their way into industry, while the process-related formation and nature of pores is an ongoing subject of research. Parts produced by laser-based powder bed fusion (PBF-LB), Directed Energy Deposition (DED) and Liquid Metal Jetting (LMJ) were available for this study, and their porosity has been investigated based on XCT data.
In PBF-LB, which is the most commonly used metal additive manufacturing process [3,4], powder is applied onto a build plate layer by layer while selectively melted by a laser. The main types of pores, as summarized by Snell et al. [5], are gas, keyhole or lack of fusion pores. Small, spherical gas pores can result from entrapped gas in the powder or be formed during the melting process. Keyhole pores, resulting from excessive energy input during melting, are larger, of circular shape as well, but typically elongated in the vertical direction and located at the melt pool bottom. A lack of input energy, in turn, can lead to voids in the structure, as the material is not melted completely. The lack of fusion defects show an irregular shape and a large size, typically related to the melt pool size [5].
Sola and Nouri [6] collected common sources of porosity along with pore characteristics and sizes for certain examples related to PBF-LB. Stated pore sizes range from spherical pores smaller than 5 µm, resulting from reactions between surface moisture and metal or void pockets between powder particles, spherical pores > 10–20 µm due to excessive energy at the bottom of a track (key hole) and initial pores < 250 µm but prone to coalescence and resulting from feedstock oxidization [6].
Both PBF-LB and DED are, depending on the build parameters used, considered capable of producing metal parts of high densities [3]. In the DED process, metal powder or wire is fed into a focused energy source, where a small melt pool is formed and the material is deposited layer by layer [3]. Porosity, mainly gas and lack of fusion pores, has also been observed in parts produced by DED, hindering the process’s adoption in demanding industrial sectors such as aerospace [7]. In the review of Armstrong et al., printed parts by DED with 99.5% density [4] were reported.
LMJ represents another metal-based AM approach, which has gained increasing interest in recent years [8,9,10,11]. In LMJ, metal wire is typically used as feedstock [8], which is molten and applied via drop-on-demand (DOD) or continuous mode on a substrate. Watkins et al. [8] reported large interconnected pores in samples printed by LMJ-DOD from tin. Porosities between 0.1% and 13% were observed, depending on the infill pattern used for manufacturing.
In AM, the presence of pores depends on the process used, the feedstock, and the chosen manufacturing parameters. Also, the size and shape of pores can vary strongly. For the non-destructive 3D investigation and quantification of pores present in a part based on XCT, several basic steps, as presented in Figure 1, are part of the imaging and analysis process [12,13].

Figure 1.
Basic process steps from XCT image acquisition to data analysis are visualized with their output using BPMN (business process model and notation) symbols.
An XCT scan detects the number of X-rays that have not been absorbed by the test object and then generates an image from this information. The projections created by the scan are transformed into a 3D volume by reconstruction. Afterwards, the volume can be processed and optimized in order to remove artefacts or to smooth the image to enhance the image quality and to facilitate the subsequent analysis. The 3D volume, consisting of stacked cross-sectional slices, which in turn are composed of voxels each assigned with a specific gray value, needs to be segmented in order to define object and background in the dataset [1]. Segmentation represents an important step, well known to affect the subsequent data analysis and the quantification of features such as voids and pores [12,13].
A variety of algorithms are available to solve this task, and according to Heinzl et al. [13], the segmentation methods can be basically divided into threshold-based, boundary-based, or region-growing methods. When materials can be distinguished by their gray values, a global or local threshold can be used to separate the materials. Typical algorithms to define global thresholds are, for example, Otsu’s method or the ISO50 approach, which both calculate the threshold based on two peaks in the histogram. While for ISO50, the threshold is placed exactly in the middle of the peaks, Otsu maximizes the separability of gray value classes. Boundary-based thresholds take into account relative differences of gray values of voxels, considering the neighborhood to identify borders between components. Region growing approaches start from one or several regions, where starting points are seeded manually or automatically. The region is growing within a homogeneous area. An example of the region-growing segmentation method is the watershed transform. Over- and under-segmentation of features are the typical challenges in segmentation [13].
A comprehensive review on 3D segmentation algorithms for CT imaging with focus on the medical field is given by Carvalho et al. [14], considering also combinations of segmentation methods and neural networks using a procedure of training and testing. Further algorithms can be used for the extraction of features or the determination of surface [13]. The connected components analysis, for example, extracts the separate connected regions of a segmented image to perform statistical analysis [13,14]. Within the frame of porosity analysis, global thresholding, due to its simplicity, is a typical method [12].
Global thresholding can be performed automatically (common methods are, for example, ISO50 and Otsu’s thresholding), semi-automatic or manually (operator-dependent, based on the visual segmentation feedback of an XCT data slice). Even though automatic thresholding reduces the impact of the operator on the result of the analysis, manual thresholding is still a simple and common approach. The success of automatic thresholding depends on the characteristics of the histogram and can be challenging in rather unimodal gray value distributions, as a result of low porosity, for example [12].
Jaques et al. [12] worked on the investigation of uncertainty of porosity measurements and identified several sources potentially leading to variations in porosity determination. Scanning, reconstruction, filtering of data, segmentation and the way the actual analysis is performed—every step of the process chain can influence the result of porosity analysis. The nature of the sample, the equipment, environmental conditions, chosen data corrections or algorithms can affect the analysis as well as the experience of the operator in setting up the equipment and evaluating the data. Segmentation of the data is known to have a major impact on the result [12].
There are no uniform recommendations regarding the use of segmentation algorithms, and the optimum choice can depend on the quality of the dataset to be investigated. Despite the lack of standardized workflows, porosity determination based on XCT data is widely used. Of interest is typically the pore quantity, size, morphology and spatial distribution, i.e., their location in the sample. Common related metrics are the total porosity rate, the largest pore size or the pore distribution. In addition, sphericity and the aspect ratio are possible descriptors for the pore morphology. While the aspect ratio indicates the elongation of pores, the sphericity quantifies the deviation of a pore from an ideal sphere, based on its determined volume and surface [2,15].
Determination of the uncertainty of porosity analysis is the focus of research [12]. Du Plessis et al. [16], for example, performed a round robin test, which aimed to have porosity analysis performed on the same samples (metal, produced by AM) by different operators. A protocol [2] was shared to be followed by the participants, including suggestions for scanning parameters and image analysis steps, as well as the analysis software.
In contrast, the aim of this study is to contribute to the determination of uncertainty by investigating the variation in the result of porosity analysis performed by different operators without applying protocols and by focusing on the end of the process chain, including segmentation and data analysis. Operators using different common analysis software products were invited to analyze the same reconstructed data. Thereby, error sources related to scanning and reconstruction procedures are excluded, and deviations resulting from the segmentation procedure and the data analysis, depending on each operator’s experience, come into focus.
This study presents the methods chosen by the operators to perform the porosity analysis and evaluates the deviation in the results regarding overall porosity, pore size and pore distribution. In addition, pore morphology detected in the metallic samples produced by three different additive manufacturing processes is discussed. Materials and methods are presented in the following, including the scanning and reconstruction procedure as well as the method applied for the comparison of the results obtained by the analyses performed in this study. This is followed by a presentation of the results, including representative XCT images of the scanned samples, the particular segmentation and analysis approach chosen by each operator and a comparison of approaches and results that are discussed afterwards.
2. Materials and Methods
Three metallic parts produced by different AM approaches at Lawrence Livermore National Laboratory (LLNL) were available for porosity analysis. The parts have been scanned, and the reconstructed data were distributed to four operators who did the analysis according to their own discretion, without following any pre-defined protocol. The samples, scans and reconstruction data are presented in the following subsections.
2.1. Samples
The samples available for this study are of cylindrical shape with similar outer diameters of about 1 cm and varying heights as visible from Figure 2a–c.
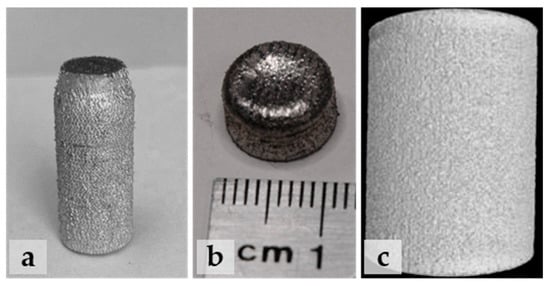
Figure 2.
Shapes of the tested samples made by Liquid Metal Jetting from Aluminum (LMJ-Al (a)), by Directed Energy Deposition from Inconel (DED-Inc (b)) and by Laser-based Powder Bed Fusion from Titanium alloy (PBF-Ti, (c)).
The sample in Figure 2a was produced by Liquid Metal Jetting (LMJ) using an ElemX™ Molten Metal Jetting System with an Aluminum (4008) welding wire. The part was manufactured as part of a separate study to print intentional porosity and then post-processed by hot-isostatic pressing. In Figure 2b, a part manufactured by Directed Energy Deposition (DED) on a FormAlloy X2/L2 from a nickel-chromium-based alloy (IN625) is visible. The machine uses a powder-based feedstock, which is deposited with a laser beam. The third image in Figure 2c presents the rendered volume of a sample made from Titanium 5553 alloy by laser-based powder bed fusion on a GE Additive M2 as part of an intentional porosity study as well [17]. It represents the central area of a cylindrical fatigue test sample that has been scanned and investigated for this study.
2.2. XCT Scan and Reconstruction
The metallic samples were scanned using a Nikon MCT225 system with a tungsten target, and a PerkinElmer AN 1620 CS detector with a matrix of 2000 × 2000 pixels and a pixel pitch of 200 µm. Table 1 provides an overview of the different scan settings applied. The samples were scanned with a tube voltage between 200 kV and 220 kV, a current between 23 µA and 30 µA, resulting in a power between 5 W and 6 W. The isotropic voxel size was ~6 µm. Pre-filters were used to reduce beam hardening artefacts.

Table 1.
Scan parameter applied to the test samples.
Different acquisition modes have been applied, including the standard or stop-start acquisition (for LMJ-Al), where the data is captured step-by-step. A stop/start with slight rotational platform shift was available, which allows minimizing ring artefacts (MRA) in trade off for increased scanning time. As ring artefacts emerge from defective or incorrectly normalized detector elements (pixels) [18], this mode represents a hardware-based correction for defective pixels by translating the rotational platform with the part perpendicular to the X-ray beam during acquisition in a way that the part is projected on different regions on the detector.
In addition, a Fast CT mode is available, defined as continuous in the table as the data are collected without interruption (on the fly), which decreases scan time but can contain ring artefacts [19]. The PBF-Ti sample was scanned in MRA mode, while on the DED-Inc, different acquisition modes (MRA and continuous) were combined with different pre-filters (0.1 mm Sn and 0.25 mm Cu) to optimize the scan and to evaluate whether this has any impact on the porosity analysis. Gray values, exposure times, frames per projection, Source-to-Object-Distance (SOD), Source-to-Detector-Distance (SDD) and the scan duration are listed in Table 1 as well. In addition, for all measurements, the gain was 24 dB, the number of projections was 3141, and the magnification was 33.3.
The scanned data were reconstructed with the proprietary Nikon CT Pro 3D software. Beam-hardening correction was applied to the data to reduce cupping effects, and noise reduction was performed on the DED-Inc data.
In order to reduce processing time for the analysis, the central regions have been extracted from the total scanned volume and exported as 16-bit image slices (TIFF files). Figure 3 visualizes the extracted sub-volumes for the DED-Inc (a) and the PBF-Ti (b) sample.
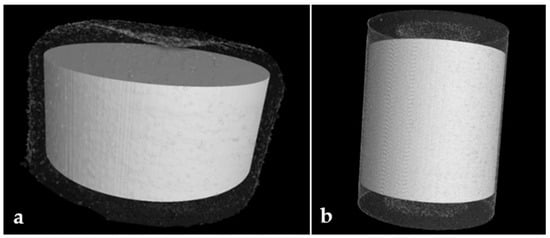
Figure 3.
Visualization of extracted regions in the DED-Inc (a) and the PBF-Ti (b) parts.
From the LMJ-Al sample, which was the longest sample, a region with the same dimensions as chosen for the PBF-Ti sample was extracted in its central region. The extracted volumes have dimensions of ~9 × 4 mm for the DED-Inc part and ~9 × 9 mm for both the PBF-Ti and the LMJ-Al sample.
2.3. Porosity Analysis
The extracted volumes have been shared as TIFF files with four operators who analyzed the parts for their porosity using different software products. All operators used the same reconstructed datasets and did the analysis without following any predetermined protocol. The only agreement was to remove small pores below 8 voxels in size. Afterwards, the determined percentage of porosities, the maximum pore sizes, and the distribution of pore sizes were compared, as well as the methods used to obtain the results. The different segmentation approaches chosen by the operators are described and accompanied by a representative slice visualizing the segmentation result. Therefore, the image slice in the middle of each stack (slice 750 for the LMJ-Al and PBF-Ti parts and slice 333 for the DED-Inc parts) was captured by the operators for a visual comparison.
Porosity (P) is defined as the ratio of the volume (V) of free space (pores) in the material and the total material, i.e., the volume of material and pores [12]:
The maximum pore can be given based on the Equivalent Sphere Diameter ESD, which can be calculated based on the identified pore volume according to [20]:
As the morphology of pores can be of interest in parts produced by AM, aspect ratio and sphericity are presented based on one exemplary analysis result. The sphericity (ψ) describes the pore’s geometric deviation from a sphere, depending on its volume (V) and the surface area (SA) [20]:
The aspect ratio (AR) represents the elongation of a pore and is calculated for each pore as the ratio of the length of the minor to the major axis. An uncertainty estimation of the porosity rates (P) resulting from the multiple determinations of the same sample by the different operators is provided, based on the standard uncertainty [21] and on the proposition of Us by Jaques et al. [12]:
The uncertainty Us corresponds to the experimental variance of the observations (s2 or u2) defined in the guide to the expression of uncertainty in measurement (GUM) [21].
3. Results
In the following, the images obtained from the different samples are presented, followed by the description of the approaches and segmentation methods chosen by each operator to conduct the porosity analysis. Finally, the results are compared regarding the chosen segmentation methods, the determined overall porosity, pore size, number of pores, uncertainty and pore morphology.
3.1. Scanned Samples
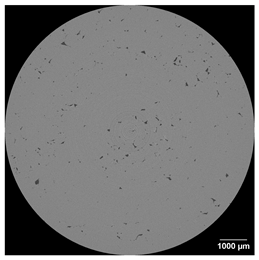
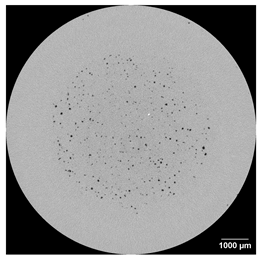
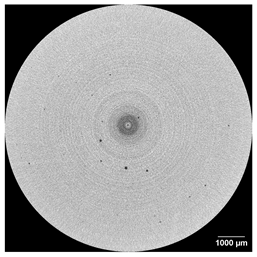
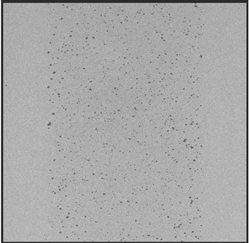
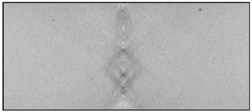
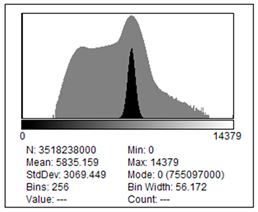
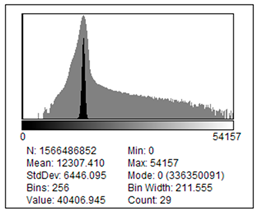
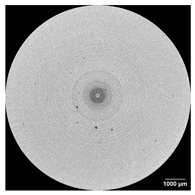
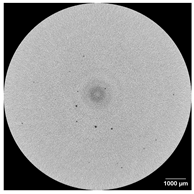
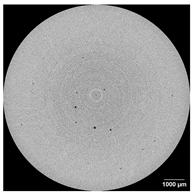
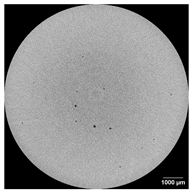
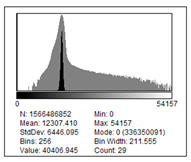
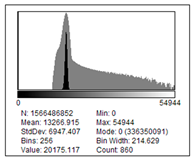
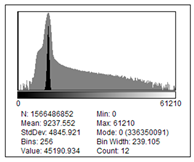
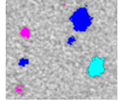
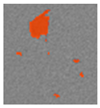
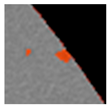
In Table 2, a representative slice of the volume in top and lateral view is presented for each sample, as well as the corresponding histogram. From the images, pores with different characteristics are visible. For the LMJ-Al sample, the pores are irregularly shaped and distributed throughout the entire investigated volume. The pores visible in the PBF-Ti part appear more circular and are located in the center, while the outer edge appears dense. This result was intentional during the manufacturing of the sample. The DED-Inc sample appears rather dense in comparison with occasional, isolated circular-shaped pores. In addition, a pronounced ring artefact is visible in the top view of this part and an additional artefact in the lateral view.

Table 2.
Representative tomographic slice of each sample in top and lateral view, along with the corresponding histogram derived from ImageJ/Fiji.
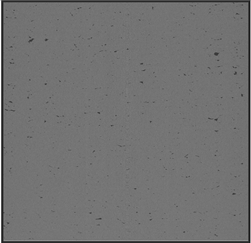
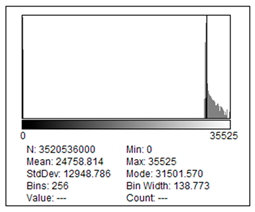
The DED-Inc sample has been investigated in different scan configurations. In addition to the scanning in continuous mode with a 0.1 mm Sn pre-filter, the part has also been scanned in MRA mode. Both modes were also investigated with a 0.25 mm Cu pre-filter. Representative slices of the different scan settings are presented in Table 3.

Table 3.
Representative tomographic slice of the DED-Inc sample in top and lateral view with different acquisition modes (continuous and MRA) and different applied pre-filter (0.1 mm Sn and 0.25 mm Cu), along with the corresponding histogram derived from ImageJ/Fiji.
The images show a clear reduction of the ring artefacts in MRA mode compared to the continuous mode. The additional diamond-shaped artefact visible in the images with the 0.1 mm Sn filter, which is presumably related to a defect on the filter, also appears slightly reduced in MRA mode. Using the 0.25 mm Cu filter, such an artefact was not visible.
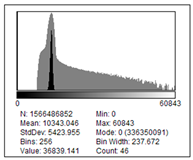
The histograms in Table 2 show two pronounced peaks for the LMJ-Al part and only one for the other parts, probably due to the lower amount of porosity in the samples. The histograms related to the different scanning modes of the DED-Inc part in Table 3 show, in addition, a reduced number of dark gray values with a reduction of artefacts (MRA mode) in the reconstructed images.
3.2. Porosity Analysis Approaches
In this section, the different segmentation approaches chosen by the operators using different software products are described. Threshold values and related porosity values are summarized in Table A1 in Appendix A, while the related visual example of each segmentation result is given in Section 3.3.1.
3.2.1. Operator 1—Avizo
The samples were investigated using Avizo 3D 2024.2. A manual interactive threshold was chosen based on the visual evidence. The border kill option was applied for the PBF-Ti and DED-Inc sample in order to remove particles in contact with the border of the image. The option was not active for the LMJ-Al part. In an additional data processing post thresholding, all features (holes and pores) < 8 voxels were removed.
For the DED-Inc part, a beam hardening correction was applied before evaluation of porosity, as well as a vertical slice grayscale correction (z drop), which mitigates artefacts related to irregular brightness in the images.
For the LMJ-Al part, the data were filtered in order to remove artificial porosity caused by ring artefacts at the center of the sample. All pores with a calculated center within 125 µm and 100 µm from the center over the full height of the sample were ignored.
3.2.2. Operator 2—Dragonfly
Porosity analysis of the samples was performed using the Dragonfly 3D world software version 2424.1. The TIFF files were imported, and the voxel size was stated under image spacing. To calculate the amount of porosity, two Regions of Interest (ROIs) were created. One ROI has been defined that contains both the material of the cylinder and the pores, serving as the reference, and a second ROI containing only the pores.
By comparing the reference ROI with the pores ROI, the volumetric percentage of the overall porosity in the whole sample is provided. The value is recorded after excluding pores smaller than 8 voxels. For further statistical analysis of the pores, they need to be considered separately, which is achieved by creating a multiROI (6-connected). In this multiROI, various measurements can be conducted. For this study, volume, surface, equivalent spherical diameter, sphericity, and aspect ratio were of main interest.
For the LMJ-Al sample, the ROI for the reference (material + pores) was defined by applying the upper Otsu (gray value range: 3720.03–14,379), while the ROI defining the pores was defined using semi-automated, automated and manual approaches. For the semi-automated approach, the upper and the lower Otsu (upper + lower Otsu) were chosen to segment the pores. Dragonfly also offers an automated porosity segmentation, where either the Basic Otsu method, the Advanced Otsu method or the Sobel Threshold can be chosen. The Basic Otsu method, as described by Dragonfly [22], is considered fast and detects the largest pores but not smaller ones. The Advanced Otsu is considered fast as well and reliable to capture smaller pores than the Basic Otsu. With the Sobel Threshold, also the smallest pores shall be identified [22]. The porosity was evaluated based on a manual threshold as well. The procedure was repeated five times (from importing the data to the measurements computation) in order to evaluate the standard deviation in percentage of overall porosity.
Table 4 provides a detailed view of the segmentation results achieved with the different methods. Therefore, two pores as highlighted in Figure 4 were chosen in the image slice in the center of the part (slice 750) and compared (Table 4). The semi-automated approach using the upper + lower Otsu segments inner pores, as well as pores connected to the outside. With the automated approaches, the pore connected to the outside was not considered, and the number of voxels defined as pore increased from Basic Otsu over Advanced Otsu to the Sobel Threshold. With the latter, also material around the bigger pore was identified (over segmentation), while the smallest pores were not. This might be related to the edge-based nature of this algorithm, which seems to be more responsive to straight edges rather than to round curvatures of pores.

Table 4.
Results of (semi-)automated and manual segmentation methods applied to the LMJ-Al sample with Dragonfly.
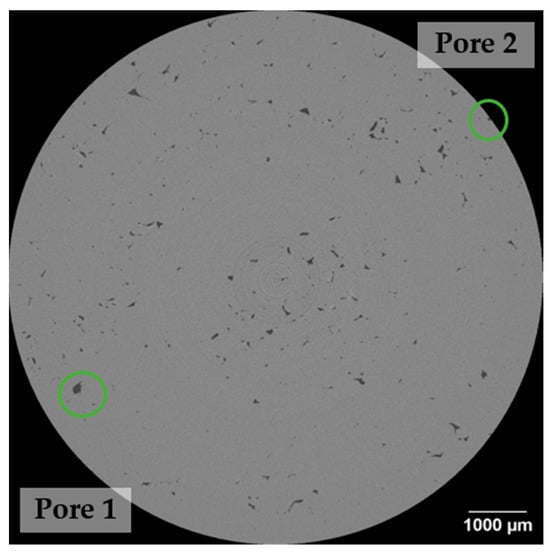
Figure 4.
Highlighted pores in the LMJ-Al sample used for comparison of segmentation results.
The gray level threshold for the upper + lower Otsu was 3720.03–6316.14, and the manual threshold was chosen based on the visual feedback (values stated in Table A1, Appendix A). The porosity based on the segmentation with a manual threshold ranged between 1.1% and 1.3% with a mean of 1.21% for five investigations. As visible in Table 4, both central holes and holes connected to the exterior are well defined, but the edge also seems to be segmented (Pore 2).
For the PBF-Ti part, window leveling was adjusted from a preset of 0–35,525 to 31,252.21–31,652.19 in order to visualize pores. Segmenting the PBF-Ti and DED-Inc samples with the upper + lower Otsu or the automated methods (basic/advanced Otsu and Sobel Threshold) did not deliver reliable results. With upper + lower Otsu, the samples were clearly over-selected, leading to porosities > 40%, while for the automated approaches, no visual feedback was noticed, and the values were similar for the PBF-Ti and the four different scans on the DED-Inc sample. For the Basic Otsu, either no value or a value of 0.00001% porosity was calculated, while for the Advanced Otsu, a value of 0.47% was given for all DED-Inc parts and the PBF-Ti part. With the Sobel Threshold, 0.48% porosity for the DED-Inc parts and 0.49% for the PBF-Ti part was determined. Thus, the PBF-Ti and DED-Inc data were investigated using a manual threshold. The procedure has been repeated three times.
The graph in Figure 5 visualizes the porosity rates determined with the different segmentation approaches for the LMJ-Al part. The automated methods span a range from 0.05% to 1.83% total porosity, reflecting the information that the Basic Otsu does not consider smaller pores, while the Advanced Otsu and Sobel Threshold do with increasing extent. The manual and the semi-automated approach are well between the results achieved with the Advanced Otsu and the Sobel Threshold. The semi-automated approach, which was chosen because of the reasonable visual feedback, is within the standard deviation of the manual thresholding.
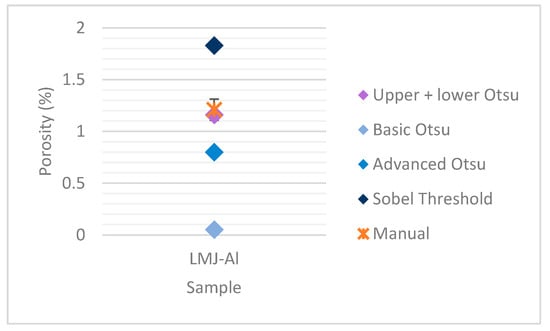
Figure 5.
Porosity rates determined on the LMJ-Al part with Dragonfly using automated approaches (square, shades of blue), semi-automated approach (square, violet) and manual thresholding (cross, orange). The manual results are represented as a mean of five repetitions with standard deviation.
The manual and the semi-automated approach delivered a convincing visual feedback. Thus, the result based on the repetitive manual thresholds was chosen for comparison with the results of the other operators, as the result of the semi-automated approach lies within its standard deviation.
3.2.3. Operator 2—ImageJ/Fiji
To determine the overall porosity of the data available as TIFF files, the image sequence was loaded into ImageJ/Fiji 2.16.0/1.54p [23]. After adjusting the scale, a global threshold has been defined via the threshold option. For the LMJ-Al part, the default method was chosen, which corresponds to a modified IsoData algorithm [24], and the same auto value, computed based on the whole stack, has been applied to all slices. The segmented slices were converted to a binary image. An ROI has been defined around the outer contour of the sample (on a slice without pores connected to the outside). The histogram option in the Analyze menu allows determining the total number of black and white pixels within the ROI of the total stack, which in turn allows calculating the overall porosity. With this approach, pores < 8 voxels were not removed for the determination of the overall porosity. From the investigations of the datasets with Dragonfly, the deviation of the overall porosity with and without having pores < 8 voxels removed was only ~0.01%.
For a statistical evaluation of the pores, the single pores need to be identified and labeled. The particle size analyzer does that for each slice in 2D. The 3D Object counter considers the 3D pores and works well for small datasets up to ~2 GB, but failed for the 1500-slice stacks. Thus, the Particle Analyser of the BoneJ [25] plugin (7.0.24) was used for the statistical analysis of the pores. The plugin labels single unconnected particles/pores and analyzes them separately. Connected-components labelling is performed, and particles are joined using a three-pass non-recursive approach, mapping and merging neighborhoods [26].
Therefore, the binary image was inverted to have the pores in white and the material and background in black. For the analysis, pores with volumes < 8 voxels were excluded. The equivalent spherical diameter has been calculated according to formula 2 from the resulting pore volumes.
For the scans of the PBF-Ti and the DED-Inc part, the procedure was the same apart from the thresholding. Here, global manual thresholds were applied, selecting the material to get a binary image with black pores.
A manual threshold was also applied to the LMJ-Al part as a comparison for the default threshold. Manual thresholding was repeated three times.
The three repeated manual thresholds were applied, focusing once on including pores and as few pixels from the surrounding material as possible, and once focusing on including most of the pores, even the smallest, even though the number of pixels related to the surrounding material increased then. The third one was chosen in between.
3.2.4. Operator 3—IPSDK Explorer
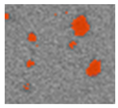
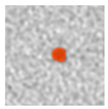
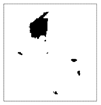
Operator 3 performed the porosity analysis on the test parts using IPSDK Explorer 4.1 from Reactiv’IP. For the LMJ-Al part, a global manual threshold was chosen, while for the other parts, the TopHat 3D option of the software was applied on the gray scale image (Figure 6a) using a closing of 12. Via the top-hat transform, a structural element (a sphere was chosen in this case) is used and compared to the features in the image. Every feature smaller than the sphere and darker than the surrounding is identified and removed from the image (closing, resulting in Figure 6b). The so-called black top-hat transform is the difference between the original image and its closing (subtracting Figure 6a from Figure 6b results in Figure 6c), by which only the black objects in the image are kept. The closing of 12 defines the radius of the basic element, i.e., the sphere, which is 12 pixels. The radius is chosen based on the largest objects that are desired to be detected. The bigger this value is set, the larger the extracted objects. On the identified local minima, highlighted in Figure 6c, a threshold has been applied (Figure 6d) to calculate the porosity. This threshold can either be set manually or automatically based on the maximum gradient around the porosity. For the Inconel part, the threshold was set manually, and for titanium, both approaches were applied, and the automatic value was finally chosen.

Figure 6.
Closing (a) of the original image, the original image (b), the highlighted local minima (c) and identified pores after manual thresholding (d) using the PBF-Ti part.
The Connected Component 3D option in the Advanced Morphology menu then allows labeling the single pores (connexity 6 was used), while the Remove small shapes 3D option allows removing smaller objects (<8 pixels in this case). Pores connected to the edge were not excluded. Based on this procedure, the resulting percentage of porosity is reported in Table A1.
3.2.5. Operator 4—VG Studio Max
Porosity analysis has been performed using VG Studio Max version 2022.3. After loading the TIFF stack, an advanced (classic) surface determination approach was applied, including manual material and air definitions (air selected from an area in a pore away from the center to avoid image artefacts, and material corresponding to the maximum of the histogram peak). Remove particles and all voids (starting contour healing) was activated with a search distance of 0.02 mm as preset in the software. This means all voids within the material and noise outside the material do not get a surface.
For porosity analysis, the VGDefX algorithm was used with the analysis mode void, which detects voxels with gray values lower than the surrounding material. Material was defined manually, and the void max. was chosen according to the ISO50 value. This value defines the maximum gray value of the seed voxels. For the analysis parameter, the noise reduction was chosen low for the LMJ-Al and DED-Inc parts, and high for the PBF-Ti sample. Size was chosen as a probability criterion, which gives more weight to larger voids for the growth of defects and the calculation of probability. The option internal cleaning, small was chosen for all investigations, which includes also small indications, separated by the surface determination from the material. The surface sealing was set to on, 4 for the LMJ-Al and the PBF-Ti parts, while off for the DED-Inc part. The surface sealing option allows defining whether defects connected to the surrounding air will be neglected (off) or considered (on) for the calculation. The software also offers an option to disregard artifacts like center or ring artifacts, but the option was not used. Check neighborhood was activated, and pores < 8 voxels were excluded.
3.3. Comparison of Results
The segmentation methods described in the previous section led to the results presented and compared in the following. The chosen algorithms for segmentation, as well as a visualization of the segmentation results, are presented, followed by an evaluation of the porosity rate, including the maximum pore size and pore distribution. Finally, the pore morphology in the different samples produced by AM processes is discussed.
3.3.1. Segmentation
The diagrams in Figure 7 visualize the distribution of segmentation approaches and algorithms that were used to segment pores from material in the different samples. For every part, 60% of the operators relied on manual segmentation methods, while 40% used semi-automated segmentation procedures. Fully automated methods were not chosen. In 80% of the investigations for each part, the chosen algorithms were threshold-based. These were either manual or automated global thresholds, accompanied by user-dependent filtering or image optimization. For the DED-Inc part, only manual-based thresholds were used; for the PBF-Ti, the operator using IPDSK Explorer used an automatic threshold, and for the LMJ-Al part, an automated threshold was used only with ImageJ/Fiji. In addition, the operator working with VG Studio Max chose a region-based algorithm for the segmentation of each part, corresponding to the 20% in the diagram.
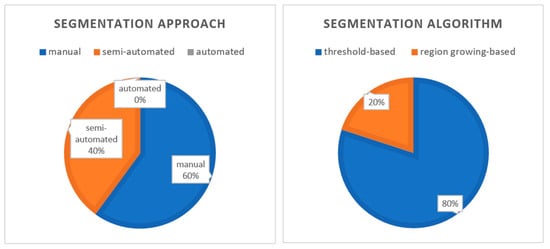
Figure 7.
Distribution of segmentation approaches and algorithms used by the operators for the porosity analysis.
For a visual comparison of the segmentation results, the same central slice was saved in each analysis. A small excerpt of the slice, according to the highlighted areas in Figure 8, is presented in Table 5 for each investigation. For the LMJ-Al part, the focus was on an internal and an external pore. For the investigations using Dragonfly and ImageJ/Fiji, the slice related to the manual threshold that gave the median porosity value of the repetitions is presented. For ImageJ/Fiji, both the binary image resulting from the global manual threshold and the image with the identified and labelled pores (excluding pores < 8 voxels) are shown.
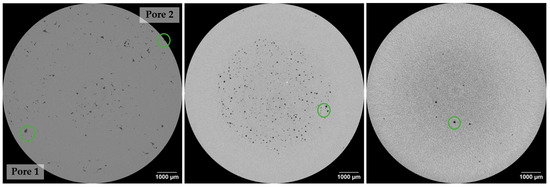
Figure 8.
Central slices of the LMJ-Al, PBF-Ti and DED-Inc (MRA 0.25 Cu) part with highlighted pores that are used for comparison in Table 5.

Table 5.
Slices showing segmented pores as achieved with the different methods.
The visualized segmentation results show that within the focus area, all approaches identified the pores similarly, even the smaller ones in the LMJ-Al and PBF-Ti samples. What differs is the inclusion of pores located at the edge of the part (LMJ-Al, Pore 2), which were not considered by operator 4 with VG Studio Max, but were included by the other operators. The patches related to Pore 1 and 2 of the LMJ-Al part for OP1 look slightly different, as the provided central slice 750 was actually the central slice + 1 in this case because the counter of slices started with 0 instead of 1.
3.3.2. Porosity
Figure 9 shows the obtained porosity rates by the different operators for the three samples and the data obtained based on the different scanning modes on the DED-Inc sample. For the LMJ-Al part, the analysis with Image J/Fiji has been done with two approaches. Once, with the automatic threshold as the method of choice, and, in addition, with three manual thresholds for comparison. The mean of the manual segmentations is displayed in a square turned by 90° for comparison. The same applies to the PBF-Ti part, where OP3 with IPSDK applied both a manual and an automatic threshold, while the automatic was the method of choice, and the manual is displayed for comparison, again with a rotated square. Repeated manual thresholds were performed by OP2 using Dragonfly and ImageJ/Fiji. They are displayed with standard deviation.
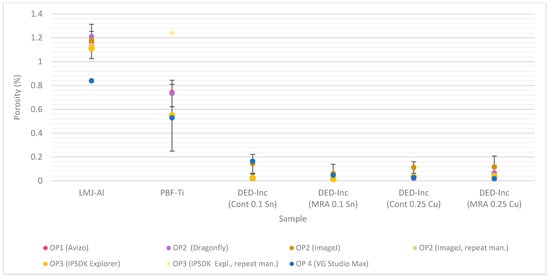
Figure 9.
Overall determined porosity rate in the samples obtained from the different segmentation approaches chosen by the operators.
The highest porosity, with a mean of 1.1% has been identified in the LMJ-Al part, followed by a mean porosity of 0.7% for the PBF-Ti part and a mean porosity of 0.05% for the DED-Inc part (MRA 0.25 mm Cu). The results related to the different scanning modes are in a similar range.
For all samples, most of the porosity results are within the range of the standard deviation of the repeated segmentation with a manual global threshold using ImageJ/Fiji and Dragonfly. For the LMJ-Al part, only the value obtained with VG Studio Max is below this range. This is related to the fact that with the procedure chosen by the operator, voids connected to the outside of the material were not included, while they were included by the other operators (compare Table 5). As the LMJ-Al part has a rather high number of pores (Figure 10a) distributed throughout the entire investigated area (as visible from the 3D visualization of the pores in Figure 11a) and several pores located at the edge, excluding them appears to have a visual effect in the results. In general, the pattern visible in the plot of the percentage of overall porosity (Figure 9) is also found similarly in the plot showing the number of pores (Figure 10a).
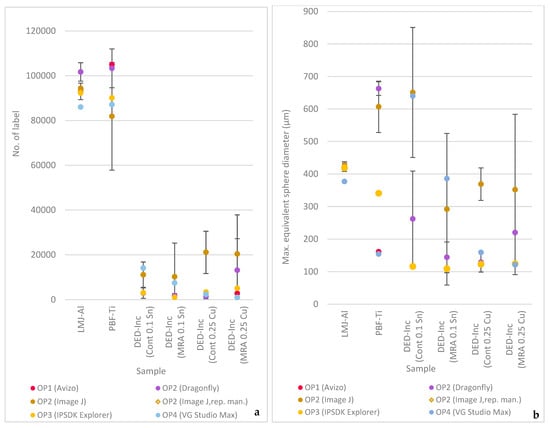
Figure 10.
Comparison of the number of pores found (a) and of the maximum equivalent spherical diameter (b).
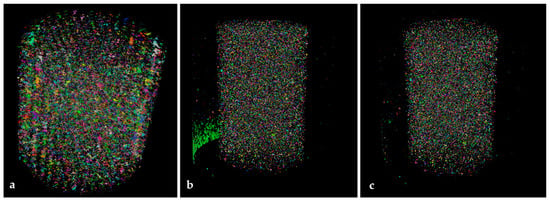
Figure 11.
Visualization (3D viewer ImageJ/Fiji) of pore distribution in the LMJ-Al part (a) and in the PBF-Ti part, including external pores (b) and excluding external pores (c).
For the PBF-Ti part, the absolute variation in the obtained overall porosity is the highest. A first evaluation by OP3 using a manual threshold led to a value of 1.2% porosity, which was reduced to 0.55% with an automated threshold approach. The investigations by OP2 using ImageJ/Fiji and OP4 using VG Studio Max provided a similar result, while the results by OP1 with Avizo and OP2 with Dragonfly are slightly higher, around 0.7%. In a similar ranking, the number of pores was identified (Figure 10a). Different is the maximum equivalent sphere diameter (ESDmax) (Figure 10b), which was highest for the manual segmentation by OP2 with ImageJ and Dragonfly, lowest for OP1 and OP4, while the result by OP 3 lies in between. The difference between the highest and lowest identified ESDmax can be explained with Figure 11b,c. Figure 11b shows the 3D visualization of pores determined by OP2 using ImageJ/Fiji without excluding pores at the edge, and Figure 11c shows the result with pores at the edge excluded. Highlighted in green in Figure 11b is an area at the edge of the part that is related to the fact that the evaluated data represent a sub-volume from the complete dataset, as has been visualized in Figure 3. Selecting the sub-volume, irregularities related to the surface roughness were taken into account in this particular area of the part. For the approaches with Dragonfly and ImageJ/Fiji, this defect area was included in the analysis, while OP1 and OP4 with Avizo and VG Studio excluded pores on the edge, which excludes most of the defect area. Repeating the analysis by OP2 with pores at the edge excluded reduced ESDmax from around 600 µm to around 160 µm, which is then in alignment with the result obtained by OP1 (Avizo) and OP4 (VG Studio). The same is true for OP3; after excluding the defect area, the ESDmax reduced to 152 µm.
Noteworthy for the evaluation of the PBF-Ti part is also that the repeated manual thresholds chosen for this part by OP2 with ImageJ/Fiji and Dragonfly show the lowest range compared to the other parts. Thus, the threshold values differ only slightly, but this already leads to high variations in the porosity value and in the number of detected pores. Figure 12 presents the original central slice (a) of the PBF-Ti part compared to the slice with the lowest (b) and highest (c) chosen threshold (by OP2 with ImageJ/Fiji), which leads to an increased number of visible pores and also noise. This can result from the large range of pore sizes present in the part, as visible from Figure 12a. The part contains both big, pronounced spherical pores, but in addition, many small pores, apparently near the limit of resolution of the chosen scan settings. This leads to a higher variation in gray values due to a partial volume effect, less pronounced peaks in the histogram and an increased sensitivity regarding the chosen threshold.
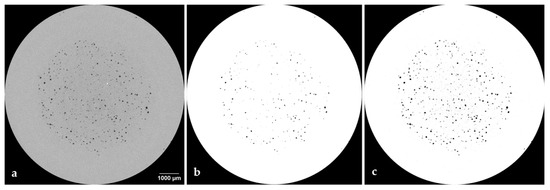
Figure 12.
Central slice (750) with the lowest and highest manual threshold chosen in ImageJ/Fiji.
The analyses on the DED-Inc samples in different scanning modes show, independently of the scanning mode, similar variations in the obtained porosity values, number of pores and ESDmax. No significant differences are visible. Also, the MRA 0.25 mm Cu scanning procedure, which shows an improved quality, still includes artefacts that, in relation to the relatively low overall porosity of the sample, influence the analysis significantly. Figure 13 visualizes the pores defined with three different manual thresholds in ImageJ/Fiji. The threshold was set based on the central slice, focusing on identifying the pores with low noise visible in the image (a) and on selecting also the finest pores, even though this increased noise (c) and a value in between (b). In Figure 13c, the artefact at the bottom and additional features at the sides were selected, leading to increased porosity values. Even though from the 3D view this does not provide a representative porosity value, the result was taken into account to calculate the mean and the standard deviation, as it puts a “worst-case-frame” to the other results by covering a maximum range, and the segmentation appeared reasonable when focusing only on the central slice.

Figure 13.
Three-dimensional distribution of pores in the DED-Inc MRA 0.25 mm Cu data applying different manual thresholds that lead to an increased (from (a–c)) influence of the image artefacts visible by the increasing accumulation of pores at the bottom.
In Table 6, the mean porosity considering all provided results is presented together with the standard uncertainty (u) based on the standard deviation (absolute and relative values as percent related to the mean porosity) and the estimated variance (u2).

Table 6.
Mean porosity with standard uncertainty (u) and estimated variance (u2).
In addition, Figure 14 visualizes the mean porosity with the corresponding standard uncertainty, reflecting the previously described observations. The highest porosity is observed in the part produced by liquid metal jetting, followed by the part produced by laser-based powder bed fusion, while the parts produced by Directed Energy Deposition show the lowest porosity values.
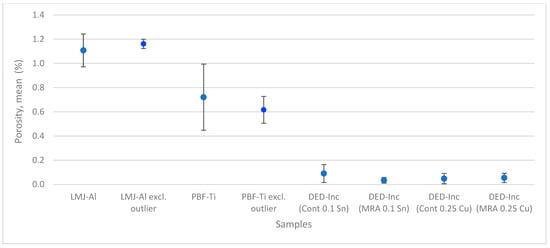
Figure 14.
Mean overall porosity displayed with standard uncertainty (±u).
The absolute standard uncertainty and estimated variance are highest for the PBF-Ti part, followed by the LMJ-Al part and the DED-Inc parts. Relative values show the highest scattering for the DED-Inc parts with a relative standard uncertainty up to 89% and moderate scattering up to 12% and 38% for the LMJ-Al and PBF-Ti parts, respectively. For the LMJ-Al and the PBF-Ti part, the calculations have been repeated without considering the described outliers, which lowers the relative standard uncertainty to 3% and 18%, respectively.
3.3.3. Pore Morphology
The results obtained using Dragonfly with the global manual threshold that led to the median porosity value were used to compare both the sphericity and the aspect ratio of the identified pores in the three samples. Sphericity is defined by providing an index between 0 (elongated shape) and 1 (perfect sphere) derived from the ratio between the pore’s identified volume and surface area. The result is visualized in the graph in Figure 15a. The pores of the LMJ-Al part are presented in gray, the PBF-Ti part in red and the DED-Inc part in blue. As expected from the XCT images, the LMJ-Al part shows a higher number of elongated pores compared to the PBF-Ti and DED-Inc part, representing irregular voids between deposited droplets that are also visible in the 3D visualization of the pores in Figure 11a. The Inconel part, on the other hand, has the biggest fraction of spherical-shaped pores with values close to 1, while the PBF-Ti part also contains pores with rather spherical shapes. This corresponds to the impression gained from the CT slices. A distribution of pore sizes is visible in the graph as well. The majority of pores are below 50 µm for the DED-Inc part, while some spherical-shaped, larger pores up to 130 µm and one up to 170 µm are observed. For the LMJ-Al and the PBF-Ti part, a higher number of pores was found (compare Figure 10a), where the majority of both samples is below 100 µm. The LMJ-Al part, in addition, contains big, less spherical pores up to 430 µm. From Figure 15b, it is visible that for the LMJ-Al part, the smaller pores show a tendency to higher aspect ratios, indicating elongated shapes, while the biggest pores show low aspect ratios. Thus, they are not spherical but expand with similar dimensions. Wang et al. [15] provided a graphical overview of possible pore structures and their related aspect ratios and sphericity.

Figure 15.
Pore morphology described by the sphericity vs. the equivalent sphere diameter (ESD) (a), the aspect ratio vs. the ESD (b) and the sphericity vs. the aspect ratio (c) for the LMJ-Al sample presented in gray, for PBF-Ti in red and for DED-Inc in blue.
Figure 15 shows, in addition, the relation between sphericity and aspect ratio (AR) of the pores, showing rather spherical pores with more uniform dimensions (low ARs) for the DED-Inc and PBF-Ti parts and for the LMJ-Al part, a greater number of less spherical and elongated shapes. These observations are in line with typical process characteristics, as described in the introduction.
4. Discussion
Porosity analysis was performed on the reconstructed XCT data of three different samples produced by additive manufacturing, partially produced with intentional porosity. The histograms of the data showed two pronounced peaks related to pores and material for the LMJ-Al part and a rather unimodal distribution for the PBF-Ti and DED-Inc data, due to an increased portion of smaller pores near the detection limit (PBF-Ti) or a total low number of pores (DED-Inc).
The evaluation of the procedures chosen by the different operators to segment the reconstructed volume data showed that a global manual threshold based on visual evidence was the method of choice. While the use of automated methods increases repeatability of the analysis, the application of a manual threshold is still a simple and fast method, providing prompt feedback to the operator. It requires, however, a detailed description of the procedure in order to ensure repeatability, as it has been emphasized, for example, by Jaques et al. [12]. Excluding pores at the edge, for instance, can influence the result if there is a high proportion of open pores at the part surface, as observed for the LMJ-Al part. Also, irregularities as observed in the PBF-Ti part related to the creation of the sub-volume can influence the results based on this option. A 3D visualization of the identified pores can be useful.
Besides manual segmentation methods, semi-manual segmentation was used. Fully automated approaches or segmentation tools based on artificial intelligence and machine learning, as offered by some of the software applications, were not chosen. Reasons mentioned were mainly related to time constraints, increased requirements for the computing equipment, as well as unfamiliarity with these tools.
The determined porosity showed a value of about 1.1% for the LMJ-Al part, around 0.7% for the PBF-Ti part, and a range from 0.03% to 0.09% for the DED-Inc part. This essentially corresponds to the typical literature values reported in the introduction. For example, for the LMJ process, porosities up to 13% have been reported with larger and interconnected pores compared to metal parts produced by PBF or DED, which are usually capable of producing parts with higher densities. For parts produced by DED, a 99.5% typical density was reported, which corresponds to the porosity range detected in this study for the DED-Inc part. The PBF-Ti part was intentionally built with a high amount of porosity, resulting in a level of porosity more in the range of the LMJ-Al part. Predominantly, spherical pores instead of elongated, irregular ones were observed, which is visible not only from the CT images but also confirmed by the evaluation of the pore morphology considering sphericity and aspect ratio. Pores < 8 voxels were excluded from the investigation. Thus, the minimum equivalent sphere diameter considered for the analysis was about 15 µm. The highest fraction of spherical pores was observed in the DED-Inc part, followed by the PBF-Ti part and the LMJ-Al part, with the smallest fraction of spherical pores. Pore sizes increased from DED-Inc (ESDmax~130 µm) up to LMJ-Al, showing the biggest pores up to 430 µm.
The focus of this study, however, was to quantify the deviation in the overall porosity determined by the different operators using different software tools and segmentation approaches. Therefore, standard uncertainty (u) and estimated variance (u2) as suggested by Jaques et al. for a single dataset with multi-segmentation were calculated, taking into account all the results obtained by the operators. For the DED-Inc parts and the different scan settings, the estimated variance ranges between 0.001 and 0.005, corresponding to relative standard uncertainties between 70% and about 89%, respectively. The high variability in standard uncertainty for the investigated DED-Inc sample is related to the low total number of pores in combination with pronounced image artefacts that influenced the results. For the LMJ-Al part, the identified relative deviations were lowest. All operators found nearly the same results in this sample, as it has a high number of well-delimited pores, which are rather voids between deposited material and thus irregularly shaped and of large size. These pore characteristics lead to well-defined peaks in the histogram and good detectability with the chosen segmentation methods.
The highest u2 was identified for the PBF-Ti sample with 0.07, which corresponds to a standard uncertainty of 0.27, corresponding to ~38% of Pmean. Not considering outliers, u could be reduced to 3.3% and 17.9% for the LMJ-AL and PBF-Ti part, respectively.
For comparison of the identified uncertainties to variations in porosity found by other authors, three studies shall be mentioned. In 2019, a round robin was conducted by du Plessis et al. [16], where Ti6Al4V parts produced by PBF-LB were scanned and evaluated for their porosity by different partners according to a protocol and suggested scan parameters. They reported problems in obtaining similar quantitative values for the absolute porosity percentage and the maximum pore size. Measurement of porosity percentage in a cube that contained small-sized pores in a small quantity differed in a range from 0.004% to 0.030% while the mean porosity was 0.02%. It was stated that evaluations of small levels of porosities in terms of pore size and number of pores are likely to be influenced more easily by slight differences in background image noise, or that smaller pores present can be smaller than the scan resolution. The range (max–min) of the reported porosity values was 0.026% and the standard deviation corresponds to about 40% of the mean porosity.
Another study by Ledwaba et al. [27] stated a relative error (SD/mean 100) for a manual threshold repeated 10 times on a dataset obtained from a Ti6Al4V sample produced by PBF-LB of 25% with a mean porosity of about 5%. Baveye et al. [28] investigated the operator-dependent variability of the thresholding step already in 2010 based on soil images, focusing on 2D. Three different images were analyzed by 13 experts, which led to a relative error of up to 38%.
In the examples found in the literature, the deviation in porosity analysis was expressed in standard deviation rather than in variance. Considering the relative standard uncertainty based on the ratio of mean porosity and standard deviation, including all results obtained by the different operators in the present study, the LMJ-Al part and the PBF-Ti part with a relative standard uncertainty of 12% and 38%, respectively (not excluding outliers), are in the range of the presented earlier studies. For the DED-Inc scans, due to the pronounced image artefacts that were investigated on purpose in combination with the low overall porosity, the relative standard uncertainty rose to 89%.
5. Conclusions
The comparison of the results of porosity analysis performed by different users on the same reconstructed datasets gained from metal parts produced by additive manufacturing showed more or less pronounced deviations, depending on the pore characteristics of each investigated sample and the image quality. For the reported mean porosities, it was found that the part with the highest amount of porosity, the lowest portion of small pores and the absence of pronounced image artefacts led to the smallest deviation in the determined porosity. A wider pore distribution, including a higher fraction of small pores near the resolution limit and the presence of irregularities near the surface, increased the variability in the results. High variations were observed for a low total number of pores in combination with image artefacts. Here, additional image processing is required, whose application in turn depends on the operator’s experience.
In addition, the different segmentation and analysis approaches chosen by each operator have been described. A segmentation via a global manual threshold adjusted according to the visual feedback was predominantly used by the operators.
Each software offers a bunch of possibilities to perform the segmentation and pore analysis, and this study presented the individual approaches of four users. As a future prospect and in an attempt to increase reproducibility of results, it might be of interest to repeat the investigation with a focus on the use of the machine-based learning tools each software provides for segmentation.
Author Contributions
Conceptualization, A.-F.O. and A.E.W.-H.; methodology, A.-F.O., A.E.W.-H. and J.W.; investigation, A.-F.O., A.E.W.-H., J.W. and L.B.; writing—original draft preparation, J.W.; writing—review and editing, all authors. All authors have read and agreed to the published version of the manuscript.
Funding
This research received no external funding.
Data Availability Statement
The data presented in this study are available on request.
Acknowledgments
This study was initiated at Lawrence Livermore National Laboratory (LLNL) in California between A-F. Obaton, who was a guest researcher there from May 2023 until May 2024, and A. Wilson-Heid, who was a post-doc at LLNL during that time. The parts were manufactured and scanned with an MTC225 Nikon system at LLNL. The porosity analysis generated for this paper using Dragonfly software was performed on version 2024.01 provided by Comet Technologies Canada Inc., Montreal, Canada; software available at https://dragonfly.comet.tech/. The porosity analysis generated for this paper using IPSDK Explorer software was performed with version 4.1 provided by Reactiv’IP, France; software available at https://www.reactivip.com/.
Conflicts of Interest
Authors Laurent Bernard and Joseph Baptista were employed by the Reactiv’IP. The remaining authors declare that the research was conducted in the absence of any commercial or financial relationships that could be construed as a potential conflict of interest.
Appendix A
Table A1 summarizes the chosen segmentation approaches with corresponding thresholds and the related results in terms of overall porosity, the total number of identified pores (labels), as well as mean and maximum equivalent sphere diameter (ESD). The asterisk (*) indicates the setting of repetitions using a global manual threshold that led to the median porosity value and was used for the visualized segmentation result in Table 5. An “m” behind the threshold values indicates that not the pores but the material has been selected within this threshold.

Table A1.
Chosen segmentation algorithm, threshold and related overall porosity values, number (no.) of identified pores (labels), and mean and maximum equivalent sphere diameter (ESD). The asterisk (*) indicates which setting of repetitions was used for the visualized segmentation result in Table 5.
| Segmentation | Porosity (%) |
No. of Labels | ESD (µm) |
Slice Presented | |||||
|---|---|---|---|---|---|---|---|---|---|
| OP/SW | Algorithm | Threshold | Repeat | Mean (±SD) | Max | Mean | |||
| LMJ-Al | OP1 Avizo | Global manual threshold | 1500–6250 | 1.17 | 94,117 | 423 | 36.5 | ||
| OP2 Dragonfly | Global manual threshold | 2864–6187 | 1.12 | 1.21 ± 0.10 | 98,144 | 407 | 35.9 | ||
| 745–6359 | 1.25 | 103,320 | 431 | 36.2 | * | ||||
| 1432–6416 | 1.30 | 105,232 | 436 | 36.2 | |||||
| 630–6416 | 1.30 | 105,232 | 436 | 36.2 | |||||
| 917–6130 | 1.08 | 96,459 | 405 | 35.7 | |||||
| OP 2 ImageJ/Fiji | Global threshold, (Default, Iso based) | 6259–65,535 (m) | 1.18 | 94,376 | 427 | 36.6 | |||
| Global manual threshold | 6090–65,535 (m) | 1.06 | 1.14 ± 0.11 | 90,297 | 415 | 36.2 | |||
| 6146–65,535 (m) | 1.09 | 91,549 | 418 | 36.3 | |||||
| 6372–65,535 (m) | 1.27 | 97,195 | 436 | 36.8 | |||||
| OP3 IPSDK Explorer | Manual | 6171 | 1.11 | 92,249 | 419 | 36.4 | |||
| OP4 VG Studio | VGDefX | 5785.3 | 0.84 | 85,997 | 377 | 34.7 | |||
| PBF-Ti | OP1Avizo | Global manual threshold | 0–31,454 (with border kill) | 0.74 | 104,922 | 161 | 36.0 | ||
| OP2 Dragonfly | Global manual threshold | 943.95–31,460 | 0.85 | 0.73 ± 0.11 | 112,341 | 685 | 36.2 | ||
| 1078.72–31,440.84 | 0.63 | 95,038 | 643 | 34.9 | |||||
| 0.54–31,450 | 0.72 | 102,545 | 662 | 35.6 | * | ||||
| OP 2 ImageJ/Fiji | Global manual threshold | 31,395–65,535 (m) | 0.31 | 0.53 ± 0.28 | 61,636 | 540 | 31.9 | ||
| 31,458–65,535 (m) | 0.85 | 108,497 | 695 | 36.2 | |||||
| 31,416–65,535 (m) | 0.43 | 75,471 | 586 | 33.3 | * | ||||
| OP3 IPSDK Explorer | 3D top-hat (Closing 12), subtract, manual threshold | ≤ 127 | 1.24 | 119,810 | 168 | 40.3 | |||
| 3D top-hat (Closing 12), subtract, automatic threshold | ≤160 | 0.55 | 90,115 | 341 | 34.4 | ||||
| OP4 VG Studio | VGDefX | 31,432.3 | 0.53 | 87,070 | 154 | 34.4 | |||
| DED-Inc (MRA 0.25 Cu) | OP1 Avizo | Global manual threshold | 0–11,143 (with border kill) | 0.03 | 2830 | 124 | 28.4 | ||
| OP2 Dragonfly | Global manual threshold | 0.93–11,393 | 0.04 | 0.07 ± 0.06 | 8346 | 169 | 23.4 | * | |
| 0.93–11,151 | 0.02 | 2176 | 125 | 28.7 | |||||
| 0.93–11,635 | 0.14 | 28,973 | 367 | 23.0 | |||||
| OP 2 ImageJ/Fiji | Global manual threshold | 10,509–65,535 (m) | 0.01 | 0.12 ± 0.09 | 646 | 114 | 37.4 | ||
| 11,627–65,535 (m) | 0.14 | 26,630 | 364 | 23.0 | * | ||||
| 11,684–65,535 (m) | 0.19 | 33,883 | 578 | 22.9 | |||||
| OP3 IPSDK Explorer | 3D top-hat (Closing 12), subtract, manual threshold | 2623–15,141 | 0.04 | 5126 | 124 | 24.6 | |||
| OP4 VG Studio | VGDefX | 10,920 | 0.02 | 1031 | 121 | 35.3 | |||
References
- Baumgärtner, B.; Hussein, J.; Hausotte, T. Investigation of the Shape and Detectability of Pores with X-Ray Computed Tomography. J. Manuf. Mater. Process. 2023, 7, 103. [Google Scholar] [CrossRef]
- Du Plessis, A.; Sperling, P.; Beerlink, A.; Tshabalala, L.; Hoosain, S.; Mathe, N.; Le Roux, S.G. Standard Method for microCT-Based Additive Manufacturing Quality Control 1: Porosity Analysis. MethodsX 2018, 5, 1102–1110. [Google Scholar] [CrossRef] [PubMed]
- Svetlizky, D.; Das, M.; Zheng, B.; Vyatskikh, A.L.; Bose, S.; Bandyopadhyay, A.; Schoenung, J.M.; Lavernia, E.J.; Eliaz, N. Directed Energy Deposition (DED) Additive Manufacturing: Physical Characteristics, Defects, Challenges and Applications. Mater. Today 2021, 49, 271–295. [Google Scholar] [CrossRef]
- Armstrong, M.; Mehrabi, H.; Naveed, N. An Overview of Modern Metal Additive Manufacturing Technology. J. Manuf. Process. 2022, 84, 1001–1029. [Google Scholar] [CrossRef]
- Snell, R.; Tammas-Williams, S.; Chechik, L.; Lyle, A.; Hernández-Nava, E.; Boig, C.; Panoutsos, G.; Todd, I. Methods for Rapid Pore Classification in Metal Additive Manufacturing. JOM 2020, 72, 101–109. [Google Scholar] [CrossRef]
- Sola, A.; Nouri, A. Microstructural Porosity in Additive Manufacturing: The Formation and Detection of Pores in Metal Parts Fabricated by Powder Bed Fusion. J. Adv. Manuf. Process. 2019, 1, e10021. [Google Scholar] [CrossRef]
- Zhang, K.; Chen, Y.; Marussi, S.; Fan, X.; Fitzpatrick, M.; Bhagavath, S.; Majkut, M.; Lukic, B.; Jakata, K.; Rack, A.; et al. Pore Evolution Mechanisms during Directed Energy Deposition Additive Manufacturing. Nat. Commun. 2024, 15, 1715. [Google Scholar] [CrossRef]
- Watkins, N.N.; Traxel, K.D.; Wilson-Heid, A.E.; Reeve, T.C.; Silva, C.M.; Jeffries, J.R.; Pascall, A.J. Process-Structure-Property Relationships for Droplet-on-Demand Liquid-Metal-Jetted Parts. Addit. Manuf. 2023, 73, 103709. [Google Scholar] [CrossRef]
- Ansell, T.Y. Current Status of Liquid Metal Printing. J. Manuf. Mater. Process. 2021, 5, 31. [Google Scholar] [CrossRef]
- Traxel, K.D.; Elton, E.S.; Petersen, A.M.; Silva, C.M.; Perron, A.; Jeffries, J.R.; Pascall, A.J. Processing and Microstructure of a Cu-Al-Fe-Mn Alloy via Droplet-on-Demand Additive Manufacturing. Mater. Des. 2024, 237, 112544. [Google Scholar] [CrossRef]
- Kirchebner, B.; Traxel, K.D.; Wilson-Heid, A.E.; Elton, E.S.; Pascall, A.J.; Jeffries, J.R. Molten Metal Jetting for Repairing Aluminum Components. Addit. Manuf. Lett. 2024, 11, 100259. [Google Scholar] [CrossRef]
- Jaques, V.A.J.; Plessis, A.D.; Zemek, M.; Šalplachta, J.; Stubianová, Z.; Zikmund, T.; Kaiser, J. Review of Porosity Uncertainty Estimation Methods in Computed Tomography Dataset. Meas. Sci. Technol. 2021, 32, 122001. [Google Scholar] [CrossRef]
- Heinzl, C.; Amirkhanov, A.; Kastner, J. Processing, Analysis and Visualization of CT Data. In Industrial X-Ray Computed Tomography; Carmignato, S., Dewulf, W., Leach, R., Eds.; Springer International Publishing: Cham, Switzerland, 2018; pp. 99–142. ISBN 978-3-319-59571-9. [Google Scholar]
- Carvalho, L.E.; Sobieranski, A.C.; Von Wangenheim, A. 3D Segmentation Algorithms for Computerized Tomographic Imaging: A Systematic Literature Review. J. Digit. Imaging 2018, 31, 799–850. [Google Scholar] [CrossRef] [PubMed]
- Wang, D.; Han, H.; Sa, B.; Li, K.; Yan, J.; Zhang, J.; Liu, J.; He, Z.; Wang, N.; Yan, M.; et al. A Review and a Statistical Analysis of Porosity in Metals Additively Manufactured by Laser Powder Bed Fusion. Opto-Electron. Adv. 2022, 5, 210058. [Google Scholar] [CrossRef]
- Du Plessis, A.; Le Roux, S.G.; Waller, J.; Sperling, P.; Achilles, N.; Beerlink, A.; Métayer, J.-F.; Sinico, M.; Probst, G.; Dewulf, W.; et al. Laboratory X-Ray Tomography for Metal Additive Manufacturing: Round Robin Test. Addit. Manuf. 2019, 30, 100837. [Google Scholar] [CrossRef]
- Wu, Z.; Patridge, J.P.; Juhasz, M.J.; Ashby, A.; Calta, N.P. Multi-Layer in-Situ Photodiode Assisted Flaw Detection and Fatigue Assessment in Laser Powder Bed Fusion. In Proceedings of the TMS 2025 Annual Meeting & Exhibition (TMS2025), Las Vegas, NV, USA, 23–27 March 2025. [Google Scholar]
- Wedekind, M.; Castillo, S.; Magnor, M. Feature-Sensitive Ring Artifact Correction for Computed Tomography. J. Nondestruct. Eval. 2023, 42, 5. [Google Scholar] [CrossRef]
- Nikon Metrology. X-Tek X-Ray and CT Inspection—Inspect-X 5.2-Getting Started Guide XTM0548-A1.
- Houghton, J.E.; Behnsen, J.; Duller, R.A.; Nichols, T.E.; Worden, R.H. Particle Size Analysis: A Comparison of Laboratory-Based Techniques and Their Application to Geoscience. Sediment. Geol. 2024, 464, 106607. [Google Scholar] [CrossRef]
- JCGM 100:2008; Evaluation of Measurement Data—Guide to the Expression of Uncertainty in Measurement. 2008. [CrossRef]
- Du Plessis, A. Application Note: Dragonfly Basic Automated Porosity Analysis for Additively Manufactured Parts. Available online: https://dragonfly.comet.tech/getmedia/c6d4a904-9ace-46dd-b0a7-08bfe56999b9/DF_Application_Note_Additive_Manufacturing_Automated_Porosity_Analysis.pdf?disposition=attachment (accessed on 23 April 2025).
- Schindelin, J.; Arganda-Carreras, I.; Frise, E.; Kaynig, V.; Longair, M.; Pietzsch, T.; Preibisch, S.; Rueden, S.; Saalfeld, S.; Schmid, B.; et al. Fiji: An open-source platform for biological-image analysis. Nat. Methods 2012, 9, 676–682. [Google Scholar] [CrossRef]
- Ferreira, T.; Rasband, W. ImageJ User Guide ImageJ/Fiji 1.46r 2012. Available online: https://imagej.net/ij/docs/guide/ (accessed on 25 November 2024).
- Doube, M.; Kłosowski, M.M.; Arganda-Carreras, I.; Cordelières, F.P.; Dougherty, R.P.; Jackson, J.S.; Schmid, B.; Hutchinson, J.R.; Shefelbine, S.J. BoneJ: Free and Extensible Bone Image Analysis in ImageJ. Bone 2010, 47, 1076–1079. [Google Scholar] [CrossRef]
- Doube, M. BoneJ Particle Analyser 2004–2025. Available online: https://bonej.org/particles (accessed on 29 November 2024).
- Ledwaba, T.; Steenkamp, C.; Moore, K.; Kouprianoff, D.; Du Plessis, A. X-Ray Computed Tomography-Based Porosity Segmentation in Additive Manufacturing: Comparison of Traditional and AI Approaches. MATEC Web Conf. 2024, 406, 05011. [Google Scholar] [CrossRef]
- Baveye, P.C.; Laba, M.; Otten, W.; Bouckaert, L.; Dello Sterpaio, P.; Goswami, R.R.; Grinev, D.; Houston, A.; Hu, Y.; Liu, J.; et al. Observer-Dependent Variability of the Thresholding Step in the Quantitative Analysis of Soil Images and X-Ray Microtomography Data. Geoderma 2010, 157, 51–63. [Google Scholar] [CrossRef]
Disclaimer/Publisher’s Note: The statements, opinions and data contained in all publications are solely those of the individual author(s) and contributor(s) and not of MDPI and/or the editor(s). MDPI and/or the editor(s) disclaim responsibility for any injury to people or property resulting from any ideas, methods, instructions or products referred to in the content. |
© 2025 by the authors. Licensee MDPI, Basel, Switzerland. This article is an open access article distributed under the terms and conditions of the Creative Commons Attribution (CC BY) license (https://creativecommons.org/licenses/by/4.0/).
