Abstract
Recognition of flanges on LNG (“Liquefied Natural Gas”) vessels and distance determination are key prerequisites for automated docking of an unloading arm, and in complex environments, flange detection faces challenges such as low accuracy and large distance measurement errors. Therefore, an improved lightweight high-precision approach based on YOLOv8s that integrates the C2f_Ghost module, a CBAM, and Concat_BiFPN was proposed. In addition, a monocular ranging algorithm based on pixel width and coordinate transformation was introduced to estimate the 3D coordinates of a flange. Specifically, the original Bottleneck in the C2f module was replaced by the Ghost module, which combines dynamic convolution and dynamic depth-separable convolution to enhance feature representation while reducing model complexity. A CBAM was introduced in the middle layer of the backbone module to improve the model’s focus on key features with minimal parameter increases, and Concat_BiFPN was used in the neck to facilitate cross-scale feature fusion. To ensure the reproducibility of the experiments, this study primarily employed a fixed random seed (0), and experimental validation analysis was conducted on a flange dataset. The results show that for the improved model, mAP@0.5 reached 97.5% and mAP@0.5:0.95 reached 82.3% with a parameter size of 9.34 M, representing improvements in accuracy of 0.6% and 13.4%, respectively, and a reduction in the parameter size of 16.2% compared with the original YOLOv8s. The average ranging errors of the X-axis, Y-axis, and Z-axis were 2.43%, 2.77%, and 0.71%, respectively. Therefore, the combination of the two algorithms significantly improves the detection and ranging accuracy of flanges in complex environments.
1. Introduction
In recent years, global energy demand has continued to grow at a rate of nearly 1.2% per year, and LNG has been widely used as a new clean energy source [1,2,3]. As a country with large energy demands, China’s annual imports are growing, so ship-to-shore docking work involving LNG ships has become an inevitable trend. An LNG unloading arm is an important hub connecting a ship and a receiving station, and after many years of development, the structure of the current technology is relatively mature, but the manual docking method is still used [4]. Due to the complex environment of a ship’s flange, as shown in Figure 1, relying only on the human eye to judge the target position and drive the unloading arm during the docking process can lead to inaccurate flange position information. This inaccuracy may cause contact between the unloading arm’s three-dimensional joints and the deck, resulting in sparks and serious accidents.
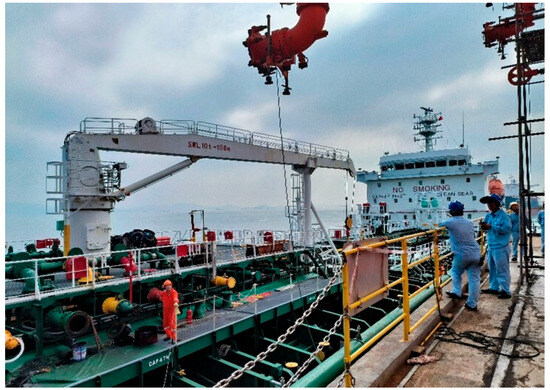
Figure 1.
LNG ship flange environment.
In addition, under the impetus of intelligent construction, it is very important to design a technology that can realize automatic docking using algorithmic control code. Accurate flange identification and position information estimation are important prerequisites for the realization of this technology. Currently, identification of the flange and acquisition of 3D coordinates face the following challenges due to the working environment of the flange: First of all, because the ship is located in the sea, detection of the flange on the ship is affected by the light intensity, berth height, fog, and other factors; this may result in impaired detection and a misdiagnosis of the situation. Secondly, the intricacies of shipboard pipelines increase the range of flange detection, leading to larger errors when obtaining information related to the coordinates of a particular flange that needs to be docked. Third, the increased complexity of the working environment leads to increased computational resources, higher equipment requirements, and difficulties in the use of algorithms. Due to the above problems, the current algorithms related to target detection and ranging are limited. Therefore, in the related improvement work, we focus on the above problems to improve the accuracy and speed of target detection and distance judgment by constructing a real detection model environment.
Due to the rapid development of computer hardware and the breakthroughs of deep learning algorithms, deep learning is superior to traditional processing in the field of image processing, so it is widely used to direct target detection [5,6,7]. In the field of deep learning for target detection, there are two types of target detection algorithms: two-stage algorithms, represented by R-CNN, Fast R-CNN, Faster R-CNN, and SPP-Net, and single-stage algorithms, represented by YOLO, SSD, EfficientDet, RetinaNet, etc. Both types of algorithms have their advantages and disadvantages, and single-stage algorithms are more suitable for this study since automated docking requires real-time detection of the target. YOLO, as a currently popular algorithm, has attracted much attention. SUN et al. [8] proposed combining the two attention mechanisms of a CBAM and SE to achieve accurate detection of surface rust on power equipment by improving the YOLOv5s algorithm. Zhu et al. [9] proposed utilizing the parameterized backbone network of HGNetv2, as well as the introduction of a variable kernel convolution module (C2f-AKConv) in combination with a new detection head module, DCNV4-Dyhead, which further improves the accuracy of detection of people in underground mines to ensure their safety. Miao et al. [10] replaced C2f with the C2f_Ghost module and introduced the EMA attention mechanism in the feature extraction phase to achieve a substantial reduction in the number of model parameters; their method can be used to detect mine fires efficiently in real time. Li et al. [11] proposed an enhanced detection algorithm, MGS-YOLO, based on YOLOv5; it can reduce the number of network parameters without losing prediction accuracy and can realize efficient real-time detection of ships. Wang et al. [12] replaced the trunk of the YOLOv8 model with a lightweight detection head (AsDDet) and replaced C2f with C2f-SE to achieve real-time detection of the presence of pests and diseases in mango trees. Wang et al. [13] designed a lightweight feature fusion framework based on YOLOv4. This framework effectively mitigates the semantic confusion problem in the process of feature fusion. It improves the feature extraction capability of the network. Luo et al. [14] proposed integration of the Ghost module and the efficient multiscale attention module within the YOLOv8 module, a modification that has been demonstrated to enhance the accuracy of traffic sign recognition. Han et al. [15] proposed a visual localization method for pedestrians in underground tunnels that combines deep learning. This method integrates a CNN detection algorithm with monocular ranging technology to achieve 3D spatial localization of pedestrians in tunnels.
Vision-based ranging algorithms can be categorized into monocular ranging and binocular (multi)-ranging according to the number of cameras. In recent years, research related to monocular ranging algorithms in the field of visible light has been relatively mature [16,17], and these algorithms have found widespread applications in intelligent driving and face recognition due to their large perceptual viewpoints and flexible perceptual characteristics [18,19,20]. Deep learning target detection technology has been integrated with monocular ranging algorithms [21,22], which has significant advantages for identifying targets and judging their distances in complex environments. Yang et al. [23] proposed improving a monocular ranging algorithm through the size of the pixel width and obtain accurate distances to power equipment. The extant studies in this area all employ YOLOv8 as a baseline, which demonstrates superior performance through the enhanced anchor-free architecture and the dynamic allocation mechanism, which are further optimized in terms of accuracy, speed, and efficiency.
Deep learning and ranging algorithms have certain advantages for identifying and locating targets in complex environments. This study proposes an enhancement to the YOLO version of the YOLOv8s model and uses the improved model in combination with an improved algorithm based on monocular ranging via the pixel width size, reflecting the feasibility of engineering applications. These model improvements solve the problems of the traditional model, such as high computation requirements, poor recognition accuracy, and distance recognition difficulties caused by measuring the target from different shooting angles. The specific research activities undertaken are illustrated in Figure 2, and the principal contributions are as follows:
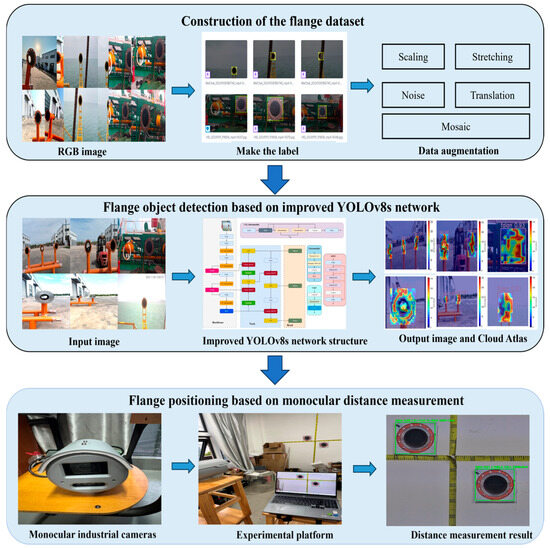
Figure 2.
Overall research framework.
- Capturing flange images, constructing a dataset, labeling the dataset with Roboflow software, training the model to learn, and turning on multiple data enhancements to expand the diversity of the dataset.
- Introducing the Ghost module, which is a combination of dynamic convolution and dynamic depth-separable convolution. It replaces the Bottleneck in the C2f component of the backbone. This reduces the number of model parameters and improves the diversity and accuracy of feature extraction.
- The CBAM attention mechanism is located in the middle two layers of the backbone, which enhances the feature expression ability of the middle layer; improves model generalization and recognition accuracy; and at the same time, avoids defects such as the excessive parameter volume caused by the overall addition, which leads to information redundancy and overfitting of the model.
- Introducing a weighted BiFPN to replace the PAN-FPN structure in the neck for bi-directional enhancement of multiple features, reducing redundant connections and maintaining high efficiency of target feature fusion while having low computational costs.
- Adopting a monocular ranging algorithm based on the target pixel width to realize acquisition of the three-dimensional coordinates of the target. This approach mitigates the risk of difficulty in distance recognition due to the shooting angle and improves the accuracy of ranging.
2. Related Work
2.1. Flange Data Acquisition
To ensure the accuracy of target recognition, the collected flange dimensions were the real docking target dimensions of an unloading arm. To increase the diversity of the environment where the target flange was located, collection of raw image data of the flange target was mainly accomplished through the use of cell phones and monocular cameras mounted on columns in three different scenarios, such as at the Shandong Guanzhuo Heavy Industry Science and Technology Company Limited, the experimental platform at the wharf in Huizhou, and an actual industrial transportation ship camera mounted on a column. As demonstrated in Figure 3, the collected images were in jpg format, and the images were collected in three scenarios with different angles, distances, light, occlusions, and other factors. This approach enriched the dataset scenarios to fully simulate the complexity of the real environment and improved the generalizability of the model training. Consequently, the model will be more effective for real-time target flange detection and position acquisition by a monocular camera in future auto-docking processes. Approximately 1500 images were captured in three scenarios: strong light, backlight, and normal lighting conditions. The camera angles included upward shots, downward shots, and frontal shots. To ensure balanced distribution within the dataset, the scenarios yielded 600, 450, and 450 images, respectively, with identical lighting conditions and shooting angles, further enhancing data representativeness.
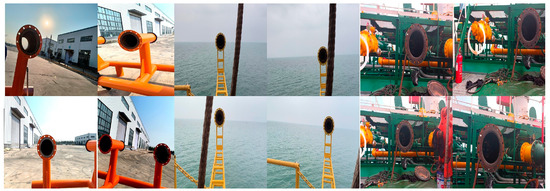
Figure 3.
Flange image data acquisition.
2.2. Constructing and Processing the Dataset
A total of 1500 flange images from the three scenarios were selected as the sample dataset, and annotation of the flanges was completed using Roboflow. In total, 75% of the dataset was used as the training set, 15% was used as the validation set, and 10% was used as the test set and was made into the type of dataset adapted by YOLOv8. In order to study the generalization of the model in use and adapt the model to different environments, the Mosaic data enhancement strategy was turned on when YOLOv8s was used for training to process the flange images in the three scenarios with saturation, color, brightness, flipping, stretching, panning, noise, scaling, etc. The splicing operation was carried out randomly, which enriched the combination of samples needed for detection. Meanwhile, random scaling added a lot of small targets to the sample dataset, which greatly improved the robustness of the network structure. Augmentation was limited to the training phase; neither the validation set nor the test set contained augmented samples.
2.3. Improving the YOLOv8s Model
The main architecture of YOLOv8 consists of the following key components: (1) A backbone (feature extraction network): The CSPNet architecture was introduced to enhance gradient retention and reduce computation, and the focus layer was introduced to reduce the image size and increase the resolution of the feature layer. (2) A neck (feature fusion): This part mainly serves as a bridge between the backbone and the head and is responsible for fusion and enhancement of features extracted from the backbone. To improve the accuracy of target recognition and the effect of feature fusion, this part adopts the concepts of PANet and an FPN. (3) A head (prediction layer): This part utilizes an anchor-free prediction method and combines a loss function to optimize bounding box regression and classification. This approach utilizes a prediction-based method, which involves a combination of the loss function to optimize the bounding box regression and classification.
Compared to other versions in the YOLOv8 series (YOLOv8n, YOLOv8m, YOLOv8l, and YOLOv8x), YOLOv8s has inferior detection accuracy compared to the large-scale models for multiscale and small targets. But it achieves a moderate balance between accuracy and inference speed, which ensures accuracy, a faster inference speed, and lower computational requirements, making it suitable for most target detection scenarios, especially those involving real-time monitoring and edge devices. Based on the research object of the shipboard pipeline flange, its recognition accuracy affects the subsequent actions of the unloading arm to realize the automatic docking function, so in order to improve the overall computational speed and target recognition accuracy, the original network structure of YOLOv8s was partially improved in order to meet the actual needs of the improved structure, as shown in Figure 4.
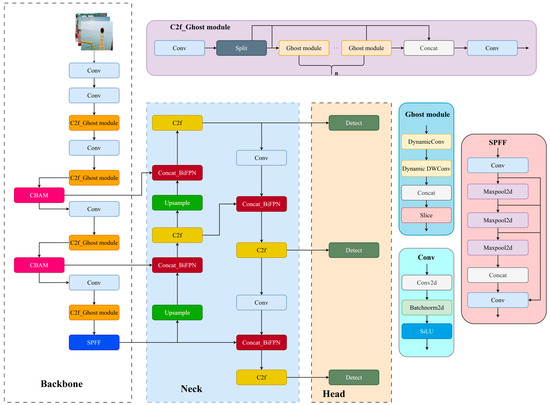
Figure 4.
Improved YOLOv8s model.
2.4. C2f_Ghost Module
The C2f_Ghost module used in this study is a custom module that essentially replaces the Bottleneck structure of the original YOLOv8 C2f module with a composite module that integrates dynamic convolution, GhostNet’s lightweight ideas, and depth-separable convolution. In this module, traditional convolution is replaced with a more expressive and efficient combination of structures, as shown in Figure 5.
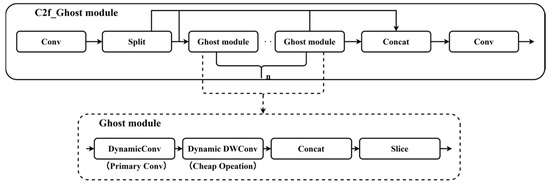
Figure 5.
C2f_Ghost module model structure.
This structure adheres to the design concept of GhostNet and first uses dynamic convolution as the primary convolution for some channels to generate the main features, which enables the convolution kernel to adaptively adjust according to different inputs and process the features of different target morphologies and difficulties. Consequently, this enhances the model’s ability to deal with different target morphologies and complex scenarios and improves the accuracy and robustness of feature extraction. Secondly, based on the features generated by the previous processing, as the input for the next stage, the depth-separable form of dynamic DWConv is used to complete the Cheap Operation, which further reduces the computational overhead, brings about channel-level adaptive enhancement, and improves the generalization ability of the model. This design is adaptive, expressive, lightweight, and efficient, making it especially suitable for complex target detection tasks in resource-constrained scenarios.
2.5. Introducing CBAM
Introduction of an attention mechanism into the main part of the original model structure has been widely used as a measure to strengthen the expression of key target features, to improve the ability to recognize small targets, and to improve robustness in complex environments. A CBAM, as an attention mechanism combining channel and spatial attention, not only considers the importance of the channel level but also enhances the feature representation of the spatial dimension through the spatial attention module, which is mostly favored for its flexibility and efficiency and the relative simplicity of the structure, although the amount of computation is increased accordingly. To achieve accurate detection and localization of flanges, it is essential to integrate both spatial and channel attention mechanisms. Therefore, a Convolutional Block Attention Module (CBAM) was deemed suitable for this task. However, considering that incorporating a CBAM into all layers of the backbone would significantly increase the number of parameters, it was selectively applied to the middle two layers. This strategy not only addresses the issue of excessive model complexity but also enhances the network’s ability to focus on target regions while suppressing redundant and irrelevant features. As a result, the representational capacity of mid-level features is improved, thereby enhancing flange recognition performance under complex environmental conditions. The architecture of the CBAM is illustrated in Figure 6.
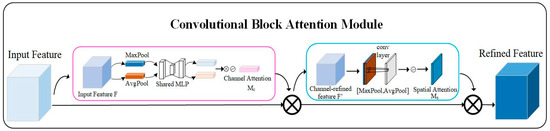
Figure 6.
Convolutional attention module (CBAM).
As illustrated in Figure 6, the channel attention mechanism module is designed to enhance the model to learn the feature information of some channels by pooling the input features and using the compression of the spatial dimensions. Subsequently, the results of global pooling and average pooling are inputted into the multilayer perceptual machine to learn the features of the channel dimensions and the importance of each channel. Ultimately, the results obtained by the MLP are subjected to the “+” operation and mapping by the Sigmoid activation function to get the channel attention output weight value (), which is calculated as follows:
where is the Sigmoid activation function; is the second fully connected layer weight matrix; is the first fully connected layer weight matrix; is the mapping feature after average pooling in the spatial dimension; and , , and are the mapping features after maximum pooling in the spatial dimension.
The spatial attention mechanism module’s working principle entails the initial execution of global and average pooling on the input features. Subsequently, the pooled results are spliced according to the channel in the convolution operation. Ultimately, the spatial attention output weight value () is obtained through Sigmoid activation function mapping, which is calculated by the following formula:
where is the spatial attention output weight value, is the convolutional transport filter for a 7 × 7 convolutional kernel, is the feature mapping after average pooling in the channel dimension, and is the feature mapping after maximum pooling in the channel dimension.
As a module composed of two attention mechanisms, channel and spatial, feature processing is carried out as follows: the input feature (, where and are the numbers of pixels in the width and height directions of the feature map, respectively, and is the number of channels) is first processed by the channel attention module to perform a one-dimensional convolution operation with and multiplication with the original feature map () to get feature map . Then, the result is processed by the spatial attention module to perform a two-dimensional convolution operation with and multiplication with feature map to get feature map . The calculation method is shown below:
where is the original feature map of the input, is used to perform the channel attention operation, is the feature map obtained from channel attention processing, is used to perform the spatial attention operation, and is the feature map obtained from spatial attention processing.
2.6. Introducing Concat_BiFPN
The Concat of the original model of YOLOv8s is simply direct splicing of different feature maps using the PAN-FPN structure, without any processing such as weighting, attention, scale matching, and so on. Concat_BiFPN introduces a feature weighting mechanism before feature splicing by referring to the BiFPN structure of EfficientDet, which is a further improved feature fusion module based on the traditional FPN/PAN. It contains both the top-down and bottom-up features of an FPN and a PAN, and at the same time removes some redundant connections; strengthens the features, many times in both directions, which greatly improves the processing of feature fusion; and maintains the high efficiency of the target feature fusion.
Figure 7a employs a top-down path + lateral connections working principle that reinforces the semantic information of the underlying features and ignores the feedback of the underlying spatial information to the higher levels. In Figure 7b, the FPN top-down path is retained and a bottom-up path is added, and the combination of the top and bottom paths results in more adequate information flow, but there is increased computational complexity and many instances of upsampling and downsampling may result in the loss of some information. In Figure 7c, the structural improvement of weighted feature fusion and cross-layer connection simplification on the basis of FPN+PAN makes feature fusion more efficient and removes some redundant connections, which balances accuracy and speed better than Figure 7a,b.
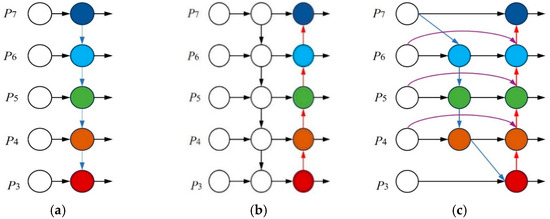
Figure 7.
Feature networks. (a) FPN, (b) PAN, and (c) BiFPN.
2.7. Monocular Ranging and Localization Models
This study proposes a solution to the issue of elevated error arising from the camera angle during target recognition ranging. The proposed approach utilizes a monocular camera ranging scheme, employing the target pixel width to calculate the distance. The monocular camera ranging algorithm is derived from the imaging principle of the camera, as illustrated in Figure 8. Monocular ranging is achieved through the description of the relationship between points in three-dimensional space and points in the camera image by means of the principle of small-hole imaging [24,25], thereby satisfying the requirement for the ranging of objects in the world coordinate system [26,27]. Four coordinate systems are established in the small-hole imaging model, which are the world coordinate system , camera coordinate system , pixel coordinate system , and imaging coordinate system . It is hypothesized that the flange is a point (P) in space with coordinates in the world coordinate system, in the camera coordinate system, and and in the pixel coordinate system and imaging coordinate system, respectively. The only relationships between the camera coordinate system and the world coordinates are translation and rotation, so the relationship between the two coordinate systems can be expressed as follows:
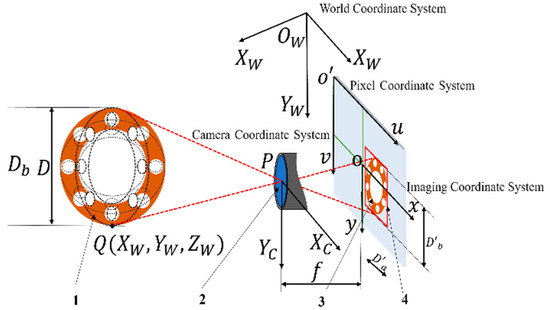
Figure 8.
Camera imaging principle. 1—original flange, 2—camera, 3—flange imaging, 4—YOLO algorithm detection frame.
In Equation (5), matrix is a rotation matrix and matrix is a translation matrix. This transformation matrix maps any point (P) in the world coordinate system to the camera coordinate system. The rotation matrix () is a 3 × 3 orthogonal matrix whose elements () are determined by the camera’s pitch, yaw, and roll angles relative to the world coordinate system. The translation vector () contains the coordinates of the camera’s optical center in the world coordinate system. This rigid transformation forms the foundation for all subsequent coordinate derivations.
The mapping relationship between the imaging plane of the camera and the focal plane of the camera can be expressed as follows:
In Equation (6), are the coordinates of the P-point in the imaging coordinate system, are the coordinates of the P-point in the camera coordinate system, and f is the camera’s focal length.
The relationship between the world coordinate system and the imaging coordinate system can be obtained by associating Equations (5) and (6):
Equation (7) establishes the complete mapping relationship between point P in the world coordinate system and its projection point (p) on the imaging plane. This relationship incorporates both external parameters (matrices and ) and internal parameters (focal length ()). represents the depth value of point P in the camera coordinate system, serving as a critical intermediate variable. To infer 3D world coordinates from 2D image points, this unknown depth () must be eliminated. This requires introducing additional constraints, such as the target being located on a known plane.
In order to simplify the monocular ranging model, when monocular camera installation is carried out so that the optical axis of the camera lens and the ground remain parallel to the target plane and the camera’s focal plane in the calibration work, i.e., the camera coordinate system and the world coordinate system only exist in a translational relationship, the rotation matrix () becomes a 3 × 3 unit matrix (I). To simplify the calculation, the positional relationship between the camera coordinate system and the world coordinate system can be made to exist only in the direction of the Z-axis with translation. Then, the translation matrix () can be obtained, where d is the distance between the camera and the target. Substituting matrix and matrix into Equation (7) yields the following:
Since the target plane is perpendicular to the optical axis of the camera, can be obtained as follows:
Equation (9) represents an ideal model derived using a series of simplifying assumptions. Its core principle is the similarity triangle relationship derived from the pinhole imaging principle, assuming the optical axis is parallel to the target plane. As shown in Figure 8, a point (P) in space, the camera’s optical center (), and the image point (p) form a set of similar triangles. Therefore, the coordinates in the image coordinate system are linearly proportional to the coordinates in the world coordinate system, with a proportionality constant of . This simplification is crucial for enabling monocular ranging but introduces corresponding assumption errors (Section 2.8).
According to Equation (9), in the x-axis direction, for example, according to , the world coordinate system and the imaging coordinate system satisfy the similarity triangle relationship, so the width in the imaging coordinate system and the corresponding width in the world coordinate system also satisfy the similarity triangle relationship between the two. That is, the ratio of the pixel width to the actual width is , which leads to the following relation:
In Equation (10), denotes the pixel width of the target, and signifies the actual width of the target.
As shown in Figure 9, the target object to be docked by the LNG unloading arm is a round-hole flange, and since the pipe flanges on board are fixed, but there are many pipe flanges on the deck of the ship, it is not certain whether the specific position of the flange to be docked is in the plane of the camera each time, but even if the position is shifted, it is still shown as an ellipse in the imaging plane, and the pixel width of the long axis of the ellipse is equal to the pixel width of the diameter of the target round-hole flange. According to Equation (10), the distance between the circular-hole flange target and the camera imaging coordinate system can be calculated as follows:
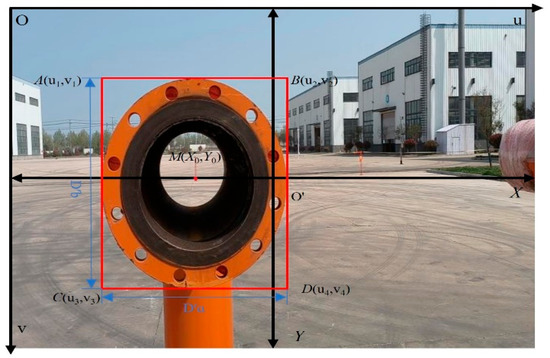
Figure 9.
Principle of coordinate transformation.
In Equation (11), denotes the camera’s focal length, signifies the actual diameter of the circular-hole flange, and represents the pixel width of the circular-hole flange diameter in the pixel coordinate system. Since it is necessary to use the geometric parameters of the YOLO algorithm detection frame to reflect the pixel width of the diameter of the circular-hole flange, the flange is more accurately labeled using the Roboflow labeling tool before training the YOLO algorithm so that the target detection frame is more closely aligned with the outer edges of the flange and the accuracy of the computation of the central flange coordinates is increased. As shown in No. 4 in Figure 8, since the pixel width of the long axis of the ellipse is equal to the pixel width of the diameter of the target circular-hole flange, , , are the length and width of the pixels of the detection frame of the YOLO algorithm.
Equation (11) is the core monocular ranging formula employed in this study. Its physical significance lies in the fact that when the actual physical dimension () of a target is known, the pixel width () it occupies in the image decreases as the distance (d) increases. Therefore, by precisely measuring , the distance () can be back-calculated. The accuracy of this formula heavily relies on the precision of two parameters: (1) The camera’s focal length (), which is obtained through high-precision camera calibration. Although we employed the Zhang Zhengyou calibration method, calibration residuals remained, which systematically affected the measurement results across all distances. (2) The target pixel width (), which is directly provided by the object detection algorithm. Positioning errors in YOLO bounding boxes (typically several pixels) directly cause measurement errors in d. These errors scale proportionally to the square of the distance (d) (as shown in Equation (15)), meaning that longer distances make the ranging system more sensitive to pixel-level inaccuracies.
As shown in Figure 9, the YOLO algorithm is capable of providing coordinates A, B, C, and D of the four pixel points of the detection frame tangential to the round-hole flange relative to the pixel coordinate system. In order to calculate the coordinates of the center of the circular-hole flange with respect to the world coordinate system, it is first necessary to convert the pixel coordinate system of the four coordinates into the imaging coordinate system, find the coordinates of the center of the circle, and find the actual coordinates according to the relationship obtained from Equation (10). They can be obtained from the coordinate transformation relation:
As illustrated in Equation (12), the variables and represent the pixel coordinate system’s horizontal and vertical coordinates, respectively. The variables and denote the imaging coordinate system’s horizontal and vertical coordinates. The variable represents the total width of the pixel, while denotes the total length of the pixel.
Coordinates , B, , and and the center of the circle, designated as M, can be derived from Equation (12) with respect to the imaging coordinate system. These coordinates are expressed as , B, , , and , respectively.
Substituting coordinates , B, , and of the pixel points into Equation (9) yields the distance ().
The ratio of the unit pixel width to the actual distance () is calculated as follows:
The center of the circular-hole flange in the world coordinate system () can be calculated by the coupling Equations (14) and (15).
2.8. Error Analysis and Uncertainty Discussion
The measurement errors in this system primarily originate from the following three aspects:
- System parameter errors: The calibration residuals of the camera’s focal length () and principal point , along with the manufacturing and measurement tolerances of the flange’s actual diameter (), are directly incorporated into the calculation formula as systematic errors. These affect the accuracy of the distance () and the scaling factor ().
- Random detection error: Pixel-level positioning jitter in YOLO model bounding boxes constitutes the primary source of random error. This error directly impacts measurements of pixel width () and center coordinates, with its influence significantly increasing as the distance (d) increases. It is the main cause of coordinate errors in and .
- Model assumption error: The practical situation where the camera’s optical axis is not perfectly parallel to the target plane slightly violates the parallel assumption in the core derivation, leading to systematic underestimation of distance (). Additionally, residual errors from lens distortion correction introduce nonlinear coordinate transformation deviations.
In summary, the measurement uncertainty of this system results from the combined effects of the aforementioned error sources. The errors observed in the subsequent experimental results, particularly the relatively large errors along the X and Y axes, are comprehensive manifestations of these factors. In engineering applications, these uncertainties can be mitigated through higher-precision calibration and optimized detection models and by limiting the measurement distance range.
3. Experiments
3.1. Experimental Parameter Settings
The training platform used the Windows 11 operating system. The equipment utilized was manufactured by Lenovo in Beijing, China. The CPU was an Inter(R)Core(TM)i7-14650HX, the GPU was an NVIDIA GeForce RTX 4060 Laptop GPU, the development environment was Python 3.12, the resolution of the input images was 640 × 640, the initial learning rate was 0.001, the final learning rate coefficient was 0.01, the L2 regular term was added to prevent overfitting, the weight decay was 0.0005, the momentum was set to 0.937, Mosaic enhancement efficiency was always on, and the Mixup enhancement probability was 0.2 for robustness. The images were randomly rotated by ±15° and translated by ±10% in the X and Y directions. The scaling factor was 0.5, the shear angle was ±2°, the horizontal flip probability was 0.5, the training batch size was set to 16, and the number of iterations was set to 150. Our optimization primarily involved module replacement and additions, without modifying the backbone network width or other fundamental structures. The activation function employed was SiLU (Swish), the default setting for the YOLOv8 series. To ensure reproducibility, most models were trained five times using a fixed random seed (0). Due to computational resource constraints, the training set was divided into three portions (75/15/10). Five separate experiments were conducted for both the original and improved models using different random seeds (seed = 0, 7, 42, 123, and 150) to obtain standard deviations, thereby validating model stability. During inference, the confidence threshold and NMS intersection-over-union threshold were set to 0.25 and 0.5, respectively.
3.2. Evaluation Metrics
To assess the effects of improving the model’s performance in terms of both its light weight and high precision, this study focused on the performance of the improved model in terms of the parameters, recall, mAP@0.5, mAP@0.5:0.95, and other metrics. In deep neural networks, a model’s number of parameters represents the total number of trainable parameters in the network. It is one of the core metrics of the network’s complexity and computational overhead. The larger the number of parameters, the higher the demand of the model on the resources of storage and arithmetic, which are limited when models are deployed in resource-constrained edge devices, so appropriately reducing the number of parameters can accelerate the inference speed and improve the unloading arm’s ability to complete the target recognition grasping work involving the flange on the ship.
Recall is a key metric in target detection evaluation, as it can show the proportion of successful detections of all targets that were actually present. Since most LNG ships have pipeline flanges, the higher the recall, the lower the chance of missing the target flange, which is more conducive to later selection of flange targets that need to be docked, and recall can be a good measure of the model’s coverage ability, which is a reflection of the model’s generalization. The calculation is shown in Equation (17). TP is the number of positive samples that were correctly predicted, and FP is the number of positive samples that were incorrectly predicted.
mAP@0.5 is a core measure of a model’s accuracy in detecting targets. It integrates the accuracy and completeness of the detected results. It is mainly indicated in the IOU of 0.5 for target detection evaluation, which is often used as the basic evaluation of target detection accuracy due to broader detection labeling, which is based on “target detected”. mAP@0.5:0.95 indicates that the IOU sets thresholds from 0.5 to 0.95 in 0.05 increments. It then calculates the APs separately and averages them. This is a more comprehensive measure of the model’s performance under different positioning accuracy requirements. It is also used as the official evaluation standard for the official COCO dataset and is mostly used for tasks requiring higher accuracy or more fine-grained localization capabilities, as well as for evaluations of target detection accuracy in the context of multi-target complexity, and is able to accurately measure the ability of a model to ‘detect a target and locate it accurately’. In order to realize target detection and localization and ranging functions, this study considered two kinds of performance indicators for detection of target recognition accuracy. Both can detect this ability but also look at positioning accuracy and can comprehensively judge the quality of a model. The calculation methods for the two evaluation indexes are shown in Equations (18) and (19). In these equations, N represents the number of detection target categories; represents the average precision of category ; and and represent the precision and recall of category , respectively.
3.3. Ablation Experiments
To verify the effect of the added improvement modules on the overall model accuracy, ablation experiments with three improvement modules were performed on the original YOLOv8s model. The comparison curves obtained from training on the self-constructed flange dataset are shown in Figure 10a–d. The results are shown in Table 1. All results in Table 1 were obtained using a fixed random seed to ensure comparability between the ablation experiments, and “√” indicates that the module was selected. When compared to the baseline YOLOv8s model (method A), introducing the C2f_Ghost module resulted in an 11.8% increase in map0.5:95 and a 15.4% decrease in the parameters. After introducing the CBAM, map0.5:95 increased by 11.6%. After introducing Concat_BiFPN, map0.5:95 increased by 2.1% and recall increased by 2%. This indicates that these methods can contribute to different aspects of the model’s detection performance.
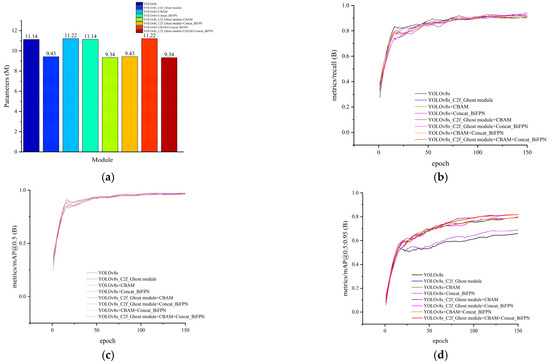
Figure 10.
Comparisons of indicators before and after model improvement. (a) Comparison of model parameter, (b) recall vs. number of iterations, (c) mAP@0.5 vs. number of iterations, and (d) mAP@0.5:0.95 vs. iteration count.

Table 1.
Results of ablation experiments.
To further verify the facilitating effect of individual-module coupling, a comparison of the training results of multiple-module coupling was conducted. The results show that the performance of multiple modules was better after coupling than the performance when adding a single module. In addition, the two aspects of the model’s light weight and high precision were considered comprehensively, and the model containing the C2f_Ghost module, the CBAM, and Concat_BiFPN (method H) had the best results, with a 0.6% increase in mAP@0.5, a 13.4% increase in mAP@0.5:0.95, a 16.2% decrease in the number of parameters, and a 1.2% increase in recall compared to the original YOLOv8s model. This shows that using the C2f_Ghost module to replace the original C2f greatly reduced the number of parameters while improving target recognition accuracy. However, introducing the CBAM attention mechanism increased the number of parameters. To prevent overfitting, only the middle layer used the CBAM, which reduced the increase in the parameters and improved accuracy. Concat_BiFPN improved the generalization ability and avoided model misdetection without increasing the parameters.
To ensure the comparability of the ablation experiments, the results in Table 1 were obtained using a fixed random seed. To account for variability, we retrained Method A (i.e., the YOLOv8s model) and Method H (i.e., the improved model) using five random seeds (0, 7, 42, 123, and 150), and the means ± standard deviations are reported in Table 2. The results show that while recall and mAP@0.5 remained broadly comparable within the range of variability, the improved model (H) consistently achieved higher and more stable performance for mAP@0.5:0.95. This demonstrates that the proposed improvements effectively enhance high-precision localization performance while maintaining the model’s lightweight advantages (the parameters were reduced from 11.14 M to approximately 9.5 M). The slight discrepancy between Table 1 (9.34 M) and Table 2 (9.51 M) stems from implementation differences: the values in Table 1 were manually calculated based on the model architecture, while those in Table 2 were automatically computed using the torchsummary library, which includes all trainable parameters (e.g., bias terms and normalization layer parameters). This minor discrepancy does not affect the core conclusion of this paper that the improved model significantly reduces the number of parameters. In addition, FPS values were measured on the RTX 4060 Laptop GPU and are reported in Table 2 as reference indicators. However, these results were affected by runtime fluctuations and should not be considered representative of edge device performance.
Table 2.
Comprehensive performance evaluations of models based on different random seeds (means ± standard deviations).
3.4. Model Comparison Experiments
To verify the effectiveness of the proposed improved model, using a fixed seed, we compared the improved YOLOv8s model with other versions of the YOLO model in terms of the number of parameters, precision, and recall using the same dataset and the same training strategy. The results of comparisons of the various indicators are shown in Figure 11a–d, and the data are shown in Table 3.
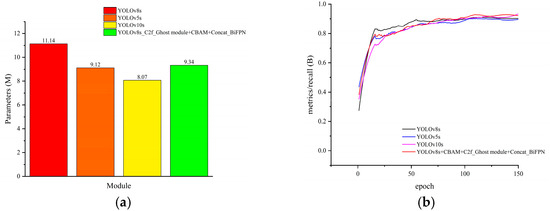
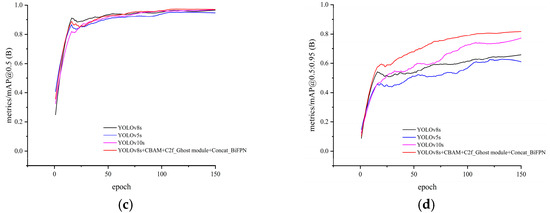
Figure 11.
Comparisons of training metrics for different models. (a) Comparison of model parameters, (b) recall vs. number of iterations, (c) mAP@0.5 vs. number of iterations, and (d) mAP@0.5:0.95 vs. iteration count.
Table 3.
Comparative experimental results of different models.
As illustrated in Table 3, the YOLOv5s model was only improved in terms of its light weight and was inferior to the YOLOv8s model in terms of precision as well as recall, whereas the YOLOv10s model structure was improved by 9.1% compared to the YOLOv8s model structure, the mAP@0.5:0.95 was increased by 9.1%, and the number of parameters was reduced by 27.5%, making this model more lightweight. At the same time, the target positioning accuracy was greatly improved. The improved YOLOv8s model structure had greater improvements than the YOLOv10s model structure in many aspects, except for parameterization, which was slightly lower than that of the YOLOv10s model structure relative to the YOLOv8s model. The enhanced model structure fulfills the lightweight improvement strategy while concomitantly enhancing model accuracy. This is achieved by incorporating considerations of target detection performance and practical deployment requirements. Consequently, this model is better suited for identifying and localizing flanges in complex onboard environments, exhibiting considerable engineering application potential.
3.5. Visualizing the Results
To further validate the optimization effectiveness of the YOLOv8s model architecture, Grad-CAM technology was introduced to enhance the model’s object detection representation capabilities across diverse scenarios. Relevant visualization results are shown in Figure 12. Grad-CAM provides a more intuitive representation of the image regions the model focuses on during object detection, effectively addressing issues related to false positives and false negatives during localization. Heatmap diagrams generated using the improved model demonstrate that, even after lightweight optimization, the model can still accurately pinpoint target areas. This proves that the algorithmic model structure maintains its perceptual capabilities while reducing parameter counts, achieving dual enhancements to its lightweight design and accuracy to meet practical application requirements.
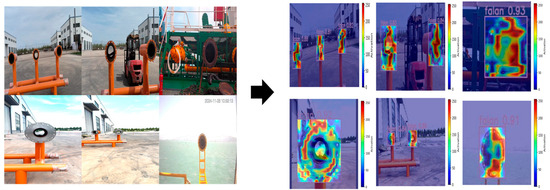
Figure 12.
Target detection + Grad-CAM.
3.6. Ranging and Localization Model Experiment
The present study sought to verify the accuracy and precision of two models, the improved model and the original model, for target recognition using the monocular ranging algorithm. To this end, experiments related to monocular ranging were carried out, as illustrated in Figure 13. A zoom camera was employed with a focal length of 13 mm. Calibration was performed using Zhang Zhengyou’s calibration method, incorporating a model that includes radial distortion (K1, K2, and K3) and perfect tangential distortion (P1 and P2). The calibrated average reprojection error was 0.15 pixels, directly quantifying the calibration accuracy and model fit. The experimental circular flange had a diameter of 290 mm. To ensure the accuracy of the experimental data, the experiments were performed many times at a distance of 3 m–4.8 m. A monocular camera was utilized for target identification and distance detection. The different models were compared using the monocular ranging algorithm by measuring the error between the 3D coordinates and the actual coordinates. The measurement results are shown in Table 4 and Table 5.
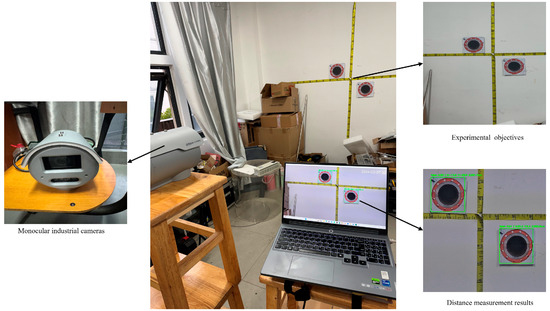
Figure 13.
Experimental platform.
Table 4.
Experimental results (YOLOv8s).
Table 5.
Experimental results (Improved YOLOv8s).
By analyzing Table 4 and Table 5, it can be observed that within the ranging distance of 3 m to 4.8 m, the improved YOLOv8s model achieved average ranging errors of 2.43% ± 0.83% (X-axis), 2.77% ± 1.02% (Y-axis), and 0.71% ± 0.31% (Z-axis). To further evaluate statistical significance, Welch’s t-tests were conducted between the original YOLOv8s model and the improved model. It should be noted that statistical significance depends not only on the sample size but also on the magnitude of the improvement relative to the variability. With the same number of measurements, the X-axis error rate decreased from 3.57% to 2.43%. This reduction was large relative to the standard deviation and therefore reached statistical significance (t = 2.89, p = 0.0098 < 0.05). In contrast, the Y-axis error decreased from 3.50% to 2.77%, but due to larger variability, it did not reach statistical significance with the limited sample size (t = 1.43, p = 0.170). The Z-axis error decreased from 0.93% to 0.71%. As the error was already small and the improvement was only about 0.2 percentage points, it was more difficult to achieve statistical significance with the small sample size (t = 1.28, p = 0.218). Nevertheless, since LNG unloading arm docking operations typically require a positioning error of less than 3%, the mean errors of all three axes remained within the engineering tolerance. Therefore, even though some of the improvements did not reach strict statistical significance, the proposed model enhancements still provide practically meaningful and reliable ranging accuracy for engineering applications.
According to the Z-axis data in the above table, the error rate curve is shown in Figure 14. With an increase in the measurement distance, the error generated was greater. The main reason was that the target should have been detected in real time, and a camera resolution that was too high led to delays in obtaining the target information. Thus, the camera resolution selected for the experiment may have been insufficient, and when the measurement distance increased, the target of the experiment became smaller in the image on the screen. However, a lack of resolution will lead to an overall change of the pixel width of unknown magnitude, which will lead to error. According to Equation (11), it can be seen that and are fixed values, and the distance is inversely proportional to the pixel width. When the distance is larger, the pixel width (D’) is smaller and the error of target detection is larger. Consequently, when using monocular ranging, it is imperative to ensure that the ranging target is situated within the designated distance interval to optimize acquisition of high-precision target coordinate information.
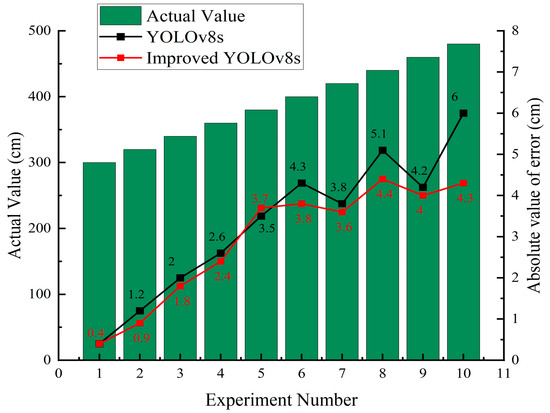
Figure 14.
Absolute error difference.
3.7. Model Generalizability Validation Analysis
To further validate the robustness and engineering adaptability of the proposed improved YOLOv8s model in real environments, field tests were conducted by simulating the working environment in which an LNG unloading arm is located. This environment contains some errors in target distance measurement due to seashore lighting variations (e.g., glare and backlighting), increased background complexity (e.g., dock structure interference), and camera angle deviations. By building a typical operation platform that would be used during the docking process of an LNG unloading arm, as shown in Figure 15, we analyzed the effects of lighting conditions on recognition detection to test the degree of model generalization.
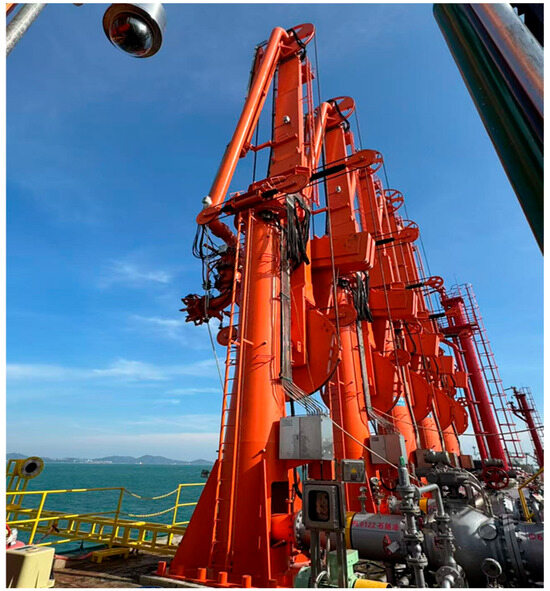
Figure 15.
Real docking platform.
Due to limited space, it was not easy to perform data measurement in the XY direction of the target, and there was some danger, so we only collected the ranging results of the two models in the Z-axis direction under different illumination conditions for comparative analysis. We only needed to extend the experimental platform outward in the Z-axis direction and did not need to shake the platform left or right, so the risk of the experiments was greatly reduced. Due to resource constraints, only a few sets of data were collected to verify and compare the generalization results of the two models in a real environment. The experimental results are shown in Table 6.
Table 6.
Results in different lighting conditions.
When analyzing the experimental data in Table 6 and comparing the experimental curves in Figure 16, it can be seen that the error rate of the improved YOLOv8s model in the Z-axis direction was much lower than that of the traditional YOLOv8s model under different lighting conditions and with complex backgrounds. It is evident that the improved model is more applicable to real working scenarios and that its degree of generalization is much higher than that of the traditional model. Therefore, its application in the automatic docking of an LNG unloading arm can greatly improve its docking accuracy and working efficiency.
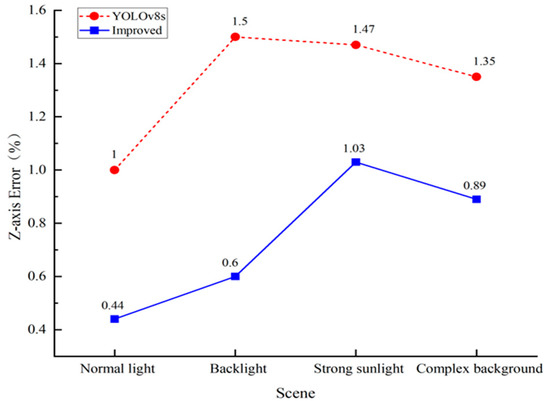
Figure 16.
Z-axis error rate comparison.
4. Conclusions
Accurate identification and positioning of LNG vessel flanges are critical for achieving automated unloading arm docking and enhancing port operation safety and efficiency. To address challenges such as low detection accuracy and significant ranging errors in complex environments, this study proposes an enhanced YOLOv8s model. This model integrates C2f_Ghost module, CBAM, and Concat_BiFPN technologies, combined with a monocular ranging algorithm based on pixel width, achieving high-precision detection and localization of flange targets.
The main contributions and methods of this study can be summarized as follows: (1) We constructed a maritime flange dataset covering diverse lighting conditions, angles, and complex scenarios, laying the foundation for model training and validation. (2) We implemented multiple lightweight and accuracy-enhancing improvements to the YOLOv8s model. We introduced the C2f_Ghost module in the backbone, integrating dynamic convolutions and depth-separable convolutions to reduce the parameters while enhancing feature expression. We added CBAM attention in the intermediate layers to boost focus on key features with a minimal parameter cost. In the neck section, a Concat_BiFPN structure with weighted feature fusion replaced the native PAN-FPN to strengthen cross-scale feature integration. (3) A monocular ranging algorithm based on the relationship between the target pixel width and coordinate transformation was proposed to estimate the three-dimensional spatial coordinates of the flange.
The experimental results demonstrate that the method proposed in this study effectively balances model accuracy and complexity: (1) Detection performance: The improved YOLOv8s model achieved mAP@0.5 and mAP@0.5:0.95 values of 97.5% and 82.3%, respectively, using a fixed random seed, which were improvements of 0.6% and 13.4% compared to the original model. Simultaneously, the model’s parameter count decreased by 16.2% (to 9.34 million), while its recall improved by 1.2%, demonstrating significant gains in detection accuracy and the model’s lightweight design. (2) Localization performance: Combined with a monocular ranging algorithm, the improved model achieved average ranging error rates of 2.43%, 2.77%, and 0.71% along the X, Y, and Z axes, respectively. These values represent significant reductions compared to the original model and satisfy the practical engineering requirement that measurement errors must not exceed 3%. (3) Generalization capability: To prevent overfitting due to the limited dataset, data augmentation was employed. Comparative experiments were conducted on the improved model and the original model using multiple random seeds, and the results are shown in Table 2. The improved model demonstrated better stability and robustness, with a significant reduction in the standard deviation of its mAP@0.5:0.95 metric, proving the potential applicability of this method in real-world scenarios.
However, this study has certain limitations. Due to the relatively small dataset and its focus solely on single object detection tasks, we did not employ k-fold cross-validation for comprehensive validation, which may have led to statistically overestimated model performance. Additionally, the model validation experiments were conducted on a laptop equipped with an RTX 4060 GPU. Due to unstable frame rates, the frame rate (FPS) data provided is for reference only and should not be used as a metric for evaluating edge device deployment performance. The lightweight models were only validated by combining the GPU memory usage with the parameter count. Deployment verification on embedded devices has not yet been conducted. It should also be noted that the ranging accuracy may decrease at long distances due to pixel resolution limitations.
Future work will focus on the following directions: (1) further expanding the dataset’s size and diversity and adopting more rigorous evaluation methods, such as k-fold cross-validation, to provide comprehensive performance metrics (e.g., means and standard deviations); (2) exploring multi-camera information fusion techniques to enhance positioning accuracy and system robustness in complex scenarios; and (3) deploying the optimized model on embedded edge devices for real-world online testing and performance refinement, ultimately advancing the engineering application of fully automated LNG unloading arm docking technology.
Author Contributions
S.S. participated in the algorithm improvement study, conducted the related experiments, completed the overall concept, and wrote the manuscript. W.F. and R.L. completed the revision and touched up the manuscript. W.W. and L.X. provided writing instruction. G.L. touched up the images in a relevant way. All authors have read and agreed to the published version of the manuscript.
Funding
This research received no external funding.
Institutional Review Board Statement
Not applicable.
Informed Consent Statement
Not applicable.
Data Availability Statement
The dataset used in this study contains 1500 annotated images covering three scenes (a factory, a dock platform, and a ship). It was generated and fully annotated in the Roboflow platform. As it is dedicated to this study, this dataset has not been created or published elsewhere and is available upon reasonable request from the corresponding author.
Acknowledgments
This research did not receive any specific grants from funding agencies in the public, commercial, or not-for-profit sectors. We thank the editor-in-chief of the journal and the reviewers for their useful feedback, which improved this paper.
Conflicts of Interest
Author Rongsheng Lin was employed by the company Jurong Energy (XinJiang) Co., Ltd. The remaining authors declare that the research was conducted in the absence of any commercial or financial relationships that could be construed as a potential conflict of interest.
References
- Zou, C.; Lin, M.; Ma, F.; Liu, H.; Yang, Z.; Zhang, G.; Yang, Y.; Guan, C.; Liang, Y.; Wang, Y.; et al. Progress, Challenges and Countermeasures of China’s Natural Gas Industry under the Carbon Neutral Target. Pet. Explor. Dev. 2024, 51, 418–435. [Google Scholar] [CrossRef]
- Song, K.; Liu, Q.; Du, Y.; Liu, X. Analysis of the development status and prospect of China’s gas industry under the “dual-carbon target”. Shandong Chem. Ind. 2022, 51, 97–99. [Google Scholar]
- Gao, Y.; Wang, B.; Hu, M.; Gao, Y.; Hu, A. Review of China’s natural gas development in 2023 and outlook for 2024. Nat. Gas Ind. 2024, 44, 166–177. [Google Scholar]
- Sun, C.; Zhang, J. Analysis of the development status and prospect of LNG industry. Tianjin Sci. Technol. 2017, 44, 94–96. [Google Scholar]
- Cai, J.; Mao, Z.; Li, J.; Wu, X. A review of deep learning based target detection algorithms and applications. Netw. Secur. Technol. Appl. 2023, 11, 41–45. [Google Scholar]
- Ming, Z.Q.; Zhu, M.; Wang, X.; Cheng, J.; Gao, C.; Yang, Y.; Wei, X. Deep learning-based person re-identification methods: Asurvey and outlook of recent works. Image Vision. Comput. 2022, 119, 104394. [Google Scholar] [CrossRef]
- Wei, W.Y.; Yang, W.; Zuo, E.; Qian, Y.; Wang, L. Person re-identification based on deep learning An overview. J. Vis. Commun. Image Represent. 2022, 82, 103418. [Google Scholar] [CrossRef]
- Sun, W.; Zhang, J.; Liao, W.; Guo, Y.; Li, T. Detection of Corrosion Areas in Power Equipment Based on Improved YOLOv5s Algorithm with CBAM Attention Mechanism. In 6GN for Future Wireless Networks. 6GN 2023; Li, J., Zhang, B., Ying, Y., Eds.; Lecture Notes of the Institute for Computer Sciences, Social Informatics and Telecommunications Engineering; Springer: Cham, Switzerland, 2024; Volume 553. [Google Scholar] [CrossRef]
- Zhu, Y.S.; Wang, X.; Tang, C.H.; Liu, C.Y. Improved RAD-YOLOv8s deep learning algorithm for personnel detection in deep mining workings of mines. J. Real-Time Image Process. 2025, 22, 121. [Google Scholar] [CrossRef]
- Miao, Z.; Zhou, H.; Wang, Q.; Xu, H.; Wang, M.; Zhang, L.; Bai, Y. Improved mine fire detection algorithm for YOLOv8n. Min. Res. Dev. 2025, 45, 200–206. [Google Scholar] [CrossRef]
- Qian, L.; Zheng, Y.; Cao, J.; Ma, Y.; Zhang, Y.; Liu, X. Lightweight ship target detection algorithm based on improved YOLOv5s. J. Real-Time Image Process. 2024, 21, 3. [Google Scholar] [CrossRef]
- Wang, J.; Wang, J. A lightweight YOLOv8 based on attention mechanism for mango pest and disease detection. J. Real-Time Image Process. 2024, 21, 136. [Google Scholar] [CrossRef]
- Wang, J.B.; Wu, Y.X. Safety helmet wearing detection algorithmof improved YOLOv4-tiny. Comput. Eng. Appl. 2023, 59, 183–190. [Google Scholar] [CrossRef]
- Luo, Y.; Ci, Y.; Jiang, S.; Wei, X. A novel lightweight real-time traffic sign detection method based on an embedded device and YOLOv8. J. Real-Time Image Process. 2024, 21, 24. [Google Scholar] [CrossRef]
- Han, J.; Yuan, J.W.X.; Lu, Y. Pedestrian visualpositioning algorithm for underground roadway based on deep learning. J. Comput. Appl. 2019, 39, 688. [Google Scholar] [CrossRef]
- Zhao, C.; Sun, Q.; Zhang, C.; Tang, Y.; Qian, F. Monocular depth estimation based on deep learning: An overview. Sci. China Technol. Sci. 2020, 63, 1612–1627. [Google Scholar] [CrossRef]
- Shen, C.; Zhao, X.; Liu, Z.; Gao, T.; Xu, J. Joint vehicle detection and distance prediction via monocular depth estimation. IET Intell. Transp. Syst. 2020, 14, 753–763. [Google Scholar] [CrossRef]
- Wang, X.; Zeng, P.; Cao, Z.; Bu, G.; Hao, Y. A Monocular Vision Ranging Method Related to Neural Networks. In Advances and Trends in Artificial Intelligence. Theory and Applications; Fujita, H., Wang, Y., Xiao, Y., Moonis, A., Eds.; IEA/AIE 2023; Lecture Notes in Computer Science; Springer: Cham, Switzerland, 2023; Volume 13925. [Google Scholar] [CrossRef]
- Liu, Y.; Chen, X. Monocular meta-imaging camera sees depth. Light Sci. Appl. 2025, 14, 5. [Google Scholar] [CrossRef]
- Liu, Q.; Pan, M.; Li, Y. Design of vehicle monocular ranging system based on FPGA. Chin. J. Liq. Cryst. Disp. 2014, 29, 422–428. [Google Scholar]
- Yuan, K.; Huang, Y.; Guo, L.; Chen, H.; Chen, J. Human feedback enhanced autonomous intelligent systems: A perspective from intelligent driving. Auton. Intell. Syst. 2024, 4, 9. [Google Scholar] [CrossRef]
- Chen, H.; Lin, M.; Xue, L.; Gao, T.; Zhu, H. Research on location method based on monocular vision. J. Phys. Conf. Ser. 2021, 1961, 012063. [Google Scholar] [CrossRef]
- Yang, F.; Wang, M.; Tan, T.; Lu, X.; Hu, R. Improved algorithm for monocular ranging of infrared imaging of power equipment based on target pixel width recognition. J. Electrotechnol. 2023, 38, 2244–2254. [Google Scholar] [CrossRef]
- Zeng, S.; Geng, G.; Zou, L.; Zhou, M. Real spatial terrain reconstruction of first person point- of-view sketches. Opt. Precis. Eng. 2020, 28, 1861–1871. [Google Scholar]
- Kim, S.M.; Lee, J.S. A comprehensive review on Compton camera image reconstruction: From principles to AI innovations. Biomed. Eng. Lett. 2024, 14, 1175–1193. [Google Scholar] [CrossRef] [PubMed]
- Han, Y.; Zhang, Z.; Dai, M. Monocular vision system for distance measurement based on feature points. Opt. Precis. Eng. 2011, 19, 1110–1117. [Google Scholar] [CrossRef]
- Vince, J. Coordinate Systems. In Foundation Mathematics for Computer Science; Springer: Cham, Switzerland, 2024. [Google Scholar] [CrossRef]
Disclaimer/Publisher’s Note: The statements, opinions and data contained in all publications are solely those of the individual author(s) and contributor(s) and not of MDPI and/or the editor(s). MDPI and/or the editor(s) disclaim responsibility for any injury to people or property resulting from any ideas, methods, instructions or products referred to in the content. |
© 2025 by the authors. Licensee MDPI, Basel, Switzerland. This article is an open access article distributed under the terms and conditions of the Creative Commons Attribution (CC BY) license (https://creativecommons.org/licenses/by/4.0/).