Abstract
The new generation of Eurocode standards has prompted enquiries regarding the major distinctions from the current version, particularly in relation to the application of the N2 method. A substantial change has been made to the definition of elastic spectra. The new spectra are defined through a series of fixed, probabilistically determined points, yet they remain rooted in a probabilistic approach. Three building types—multi-storey reinforced concrete (RC) frames, steel moment frames, and steel braced frames—were analysed in accordance with ground accelerations of 1, 2, and 3 m/s2, as well as across five soil types (A–E). Variations in target displacements between soil types, particularly A, B, and D, are notable in the results. For accelerations of 2 and 3 m/s2, steel structures demonstrate consistent displacements, whereas RC frames exhibit values that are up to 20% higher, particularly on soils C and E. For soils A and B, the distribution of inter-storey drift remains consistent. Nevertheless, in the case of 1 m/s2, the utilisation of next-generation spectra results in an average 46% decrease in inter-storey drifts. The significance of adapting design methods to the updated Eurocode provisions is underscored by these findings, which emphasise the substantial influence of soil type on building response and safety performance, particularly under increased seismic demands.
1. Introduction
In accordance with Eurocode 8 [], four methodologies are recommended for structural analysis: (i) the “lateral force method of analysis” for structures with a dominant first mode of vibration; (ii) “modal response spectrum analysis”, which is also valid for structures with higher mode effects; III. nonlinear static (pushover) analysis; and IV. nonlinear time history (dynamic) analysis. In practice, nonlinear time history dynamic analysis is the least focused on of these methods, while relatively straightforward response spectrum analysis methods are widely accepted and employed. One of the proposed methods is the nonlinear static (pushover) method, which is detailed in []. Eurocode 8-1 [] presents and delineates the nonlinear static (pushover) method, which has been implemented on nearly every building type [,,].
A prior study [] provides a comprehensive description of all methods previously listed, categorising them according to the method of seismic analysis and the appropriate seismic loading on structures. Furthermore, methods are classified as either linear force-based or nonlinear displacement-based, and they are also classified as static or dynamic loading. The pushover analysis that was employed in this study is a nonlinear displacement-based method that employs static loading. Pushover analysis is inherently beneficial; however, when combined with the target displacement determination outlined in Annex B of Eurocode 8 [], it provides a valuable perspective on the behaviour of buildings under varying seismic load levels. By numerous authors [,,,,,,], target displacement has been extensively investigated within the N2 method.
The distinctions between the new [] and existing Eurocode standards [] have been a topic of discussion since the announcement of the new generation. Significant distinctions include the definition of elastic spectra and the determination of target displacement. A detailed procedure for the definition of the new-generation spectra is provided in [,,]. As outlined in the European standard EN 1998-1, the conventional method of quantifying the amplification of seismic forces is no longer dependent on peak ground acceleration (PGA). Instead, it currently implements a two-tiered framework that is predicated on spectral ordinates denoted by Sα and Sβ to characterise the seismic input. The seismic hazard values for each location in a specific territory are depicted on maps, and earthquake return periods are determined by two parameters: the selected limit state and the selected consequence class for buildings. The introduction of nine earthquake return periods (currently, there have been only two) necessitates the creation of eighteen maps. Additionally, the surface magnitude Ms is discontinued, and a new moment magnitude, Mw, is introduced. The definition of elastic spectra is still determined using a probabilistic approach; however, the spectra of the new generation are fixed at several probabilistically determined points, including the spectral values “on the plateau” for T = 1s and for T = 0 = TA. The behaviour factor q is utilised to construct reduced or designed spectra, which are maintained but determined in a manner that differs from the current norm. Additionally, four limit states have been introduced in place of the two limit states that were previously existing: the pre-collapse state (NC), significant damage state (SD), limited damage state (DL), and small damage state (OP). The existing HR EN 1998-3, which is a document that defines state assessments and rehabilitation of buildings after construction, has already defined three limit states (NC, SD, DL).
This research presents a comparison of elastic spectra and the differences that result from the application of these spectra within the N2 method. As there is currently no national annexe that would define the open questions of the norm, this comparison will not be entirely accurate. Consequently, certain simplifications and assumptions will be employed for the comparison. Additionally, to the best of the authors’ knowledge, the new standard has been subjected to testing and examination by a restricted number of researchers. These studies included the observation of two-dimensional RC frames [], an analysis of the seismic performance of multi-storey RC buildings based on various seismic design approaches [], and the design of bracing elements within braced frames []. The primary objective of the work presented in this paper is to compare the elastic spectra when defined according to the current and new generations of seismic norms, determine the target displacement for various building types, and investigate the impact of altered elastic spectra and target displacement on the overall results, including inter-storey drifts for the same building under the same seismic load level and on the same foundation soil.
This study is among the first to systematically investigate the influence of the next-generation Eurocode elastic spectra within the N2 method for multiple structural systems—reinforced concrete frames, steel moment frames, and steel braced frames—subjected to varying seismic intensities and soil conditions. The work addresses a current knowledge gap created by the absence of a national annexe for the updated standard, providing early, evidence-based insight into how the revised spectral definitions and target displacement procedures may affect displacement demands, inter-storey drift, and overall structural performance.
2. Description of Elastic Spectra
The elastic spectrum was compared to the spectra designed according to the current valid norm in order to ensure a valid comparison. The spectrum was designed according to the new generation of Eurocode 1998-1 (Figure 1). Primarily, the seismic hazard described in the spectral orders Sα and Sβ must be ascertained in relation to the structure’s location, observed limit state (LS), and consequence class (CC). One can observe that the return period for seismic action is contingent upon the CC and LS, resulting in nine distinct return periods, as opposed to the two utilised in the current norm. Peak ground acceleration is no longer employed; consequently, seismic maps with new data will be required. Further, the values of periods on the abscissa are dependent on the acceleration and are displayed in a logarithmic scale. In addition, the classification of the site, specifically the foundation soil, deviates slightly from the current standard. If a shallow rock formation is not established, the type of material beneath the foundation is determined at a minimum depth of 30 m in order to classify the building’s location. Consequently, it is imperative to first ascertain the depth of the hard material (rock) at the location of each building and to identify the shear wave velocity profile vs, which is regarded as the most dependable predictor of seismic action characteristics at stable locations.
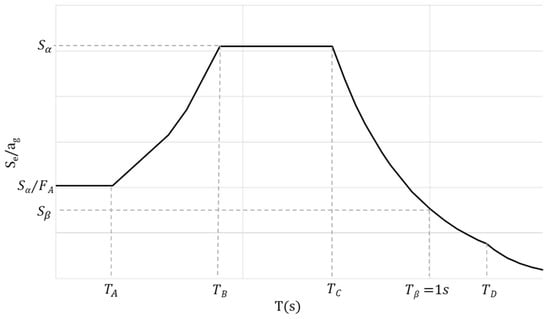
Figure 1.
Elastic spectra according to new generation of EN 1998-1-1 presented in logarithmic scale.
Except in special cases, when the soil at the location of the building is not stable, the standard categorisation of the site (A to F) is based on the following two parameters: (i) H800, the depth of hard material (e.g., rock), which is identified for the case when the speed of propagation of shear waves vs is greater than 800 m/s, and (ii) vs,H, the average speed of shear waves to depth H. Depth H is taken to be 30 m if H800 > 30 m, in which case vs,H is marked vs,30. If depth H800 < 30 m then H = H800.
New-generation spectra are still provided in the form of pseudo-absolute acceleration response spectra. However, new spectra are anchored with two parameters, as opposed to the current norm of representing the spectra with a single parameter, peak ground acceleration (PGA). The first parameter is the spectrum value at the plateau Sα, and the second parameter is the spectrum value Sβ, which anchors the value for a period of 1 s (Equations (2) and (3)).
Determining the maximum acceleration and the spectral acceleration is one of the most important steps for forming a new spectrum. For example, the peak ground acceleration determined for the case-study building described in the following chapters can be classified as representing a moderate earthquake area. Therefore, the acceleration value of 4 is taken into account. The value of for areas of moderate seismic activity is calculated according to the expression , which corresponds to a value of 1.2 . The performance factor is 1, which means that the previously defined accelerations and correspond to the values of and . The spectra also require definition of the zero period , which is 0.02 s, value , and period value for .
The period TC is calculated for the value of the first mode of vibration (Equation (1)), which serves to define the period TB = 0.1 s for TC⁄χ > 0.1 s. According to the table from [], the values Fα = 1.925 and Fβ = 2.96 were determined, and the value 1.0 was chosen for FT.
In order to determine the difference in elastic spectra according to the new generation and currently valid EN 1998-1-1 norm, spectra for all site categories were constructed and are shown in Figure 2a,b. For the currently valid spectra (Figure 2a, Figure 3a and Figure 4a), spectra were constructed for ag = 1, 2, and 3 m/s2, and for the new-generation spectra (Figure 2a, Figure 3a and Figure 4a), they were constructed for spectral ordinates Sα = 2.5; 5.0; 7.5 m/s2. It is proposed that Sα values will be close to 2.5 ag.
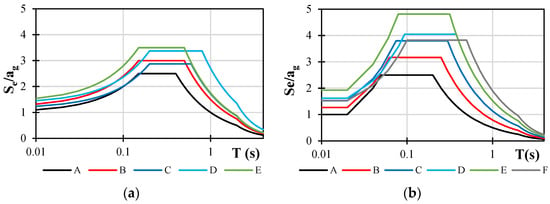
Figure 2.
Elastic spectra according to (a) currently valid norm EN 1998-1, ag = 1.0 m/s2, Type 1 (Ms > 5.5), and (b) new generation of EN 1998-1-1, Sα = 2.5 m/s2; all shown in logarithmic scale.
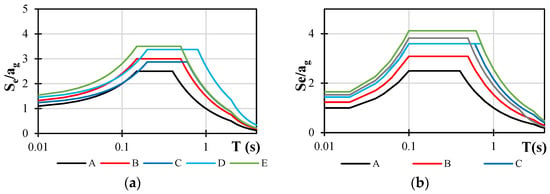
Figure 3.
Elastic spectra according to (a) currently valid norm EN 1998-1, ag = 2.0 m/s2, Type 1 (Ms > 5.5), and (b) new generation of EN 1998-1-1, Sα = 5 m/s2; all shown in logarithmic scale.
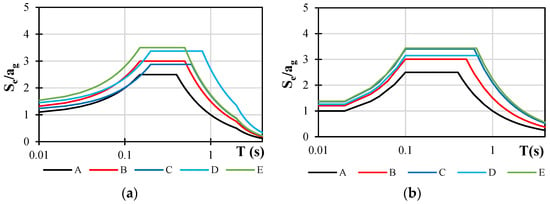
Figure 4.
Elastic spectra according to (a) currently valid norm EN 1998-1, ag = 3.0 m/s2, Type 1 (Ms > 5.5), and (b) new generation of EN 1998-1-1, Sα = 7.5 m/s2; all shown in logarithmic scale.
Elastic spectra designed according to the currently valid norm present identical curves for all acceleration levels when presented in Se/ag format. Spectra designed according to the new-generation norm show period dependency on the spectral ordinate Sα. Therefore, elastic spectra were constructed for all three magnitudes of acceleration. Table 1, Table 2, Table 3 and Table 4 show all spectra values calculated according to the current and new generations of norm. Upon observing the new-generation spectra, it is crucial to observe the acceleration dependency of the TB and TC values.

Table 1.
Parameters according to currently valid EN 1998-1-1.

Table 2.
Parameters according to new generation of EN 1998-1-1, Sα,475 = 2.5 m/s2.

Table 3.
Parameters according to new generation of EN 1998-1-1, Sα,475 = 5.0 m/s2.

Table 4.
Parameters according to new generation of EN 1998-1-1, Sα,475 = 7.5 m/s2.
3. Comparison of Spectra According to Current and New Generations of 1998-1-1
Reduced spectra in accordance with the new generation of EN 1998-1 [] and design spectra in accordance with the current valid norm EN 1998-1[1] were used to illustrate their comparison (Figure 5, Figure 6 and Figure 7). In order to facilitate this comparison, it was determined that the behaviour factor would be set at 3.5 for all observed cases. In a manner similar to that in the preceding section, the spectra of lower PGA levels exhibit greater disparities, whereas the spectra of higher PGA levels exhibit superior matching.

Figure 5.
(a) Design spectra according to currently valid norm EN 1998-1 and (b) reduced spectra according to new generation of EN 1998-1-1; ag = 1 m/s2.
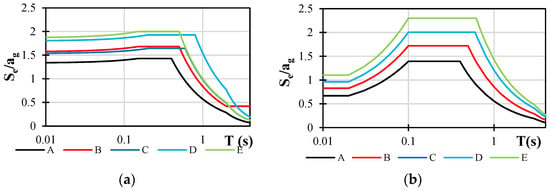
Figure 6.
(a) Design spectra according to currently valid norm EN 1998-1 and (b) reduced spectra according to new generation of EN 1998-1-1; ag = 2 m/s2.
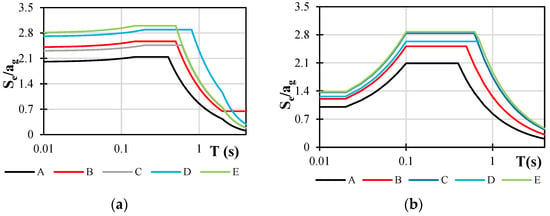
Figure 7.
(a) Design spectra according to currently valid norm EN 1998-1 and (b) reduced spectra according to new generation of EN 1998-1-1; ag = 3 m/s2.
Soil class C exhibits greater discrepancies between the new and current valid spectra, whereas the soil classes A and B exhibit significant overlap. In summary, the new generation of norms will result in a higher seismic demand in nearly all cases, with the exception of structures that are extraordinarily rigid, in which case the current norm’s demands are higher.
4. Implementation of the Standard N2 Method
The N2 method commences with the definition of the multi-degree-of-freedom (MDOF) system. The pushover analysis is the subsequent step, which involves the application of a monotonically increasing load to the nonlinear MDOF system to establish the building’s force–displacement relationship. The capacity curve of the building is also referred to as the force–displacement relationship. The target displacement, which is considered to represent the seismic demand on the structure, is determined using the capacity curve. The target displacement is determined by overlapping the capacity curve of the building and the designed spectra for the acquired seismic load. Equation (4) is employed to establish a connection between spectral acceleration Sa and spectral displacement Sd.
The ductility coefficient, μ, is defined as the ratio of the largest displacement to the yielding displacement. The reduction coefficient, Rμ, is taken into account due to hysteretic energy consumption. T is the natural period of vibration of the structure in the observed direction. The literature [,,] demonstrates that the reduction coefficient is determined in a unique manner for each type of building.
The capacity curve is obtained as a result of the plastification of the structural elements in the plastic hinges during the pushover analysis. The capacity curve is approximated to a bilinear curve in order to transition from the MDOF system curve to a single-degree-of-freedom (SDOF) system, as illustrated in Figure 8.
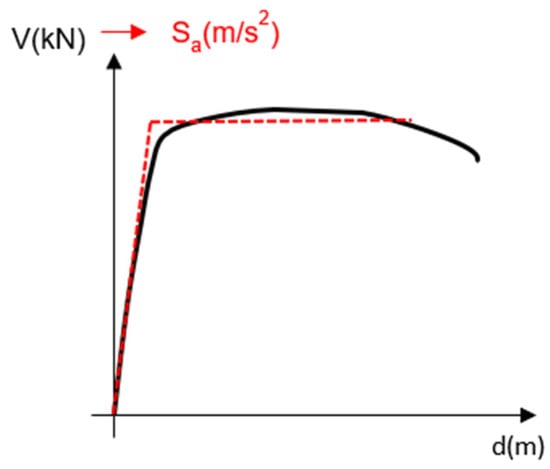
Figure 8.
Transformation from capacity curve to bilinear curve of SDOF system.
Additionally, the equivalent SDOF system’s period of vibration is determined by utilising Equation (5). In this equation, the mass of the equivalent SDOF system is denoted by m*, while the base shear force and displacement are represented by D*y and F*y while the system is yielding.
The mass of the SDOF system is determined using Equation (6), where for each level of the observed MDOF system, mi represents the mass and Φi is the displacement vector. The transformation coefficient Γ (Equation (9)) is employed to calculate the displacement D* and the base shear force F* (Equations (7) and (8)) for the equivalent SDOF system, where Dt and V represent the peak displacement and base shear force of the MDOF system, respectively.
Ultimately, the target displacement of the MDOF system is determined by multiplying the target displacement of the SDOF system by the transformation coefficient Γ. The code determines the target displacement for all acceleration levels observed, allowing for the easy plotting and assessment of inter-storey drifts and damage levels.
5. Case Study
Two types of structural systems with three types of buildings were used to evaluate the spectra of the new generation using the N2 method in this research. The N2 method was implemented by comparing the target displacements obtained within both the current and new generations of the norm, as well as the inter-storey drifts for the corresponding target displacements.
5.1. A 3D Steel-Frame Building (X—Moment-Resisting Frames, Y—Braced Frames)
The first case-study building is a 3D steel-frame building designed by Castro [] and Elghazouli et al. [], which was seismically designed according to force-based guidelines.
The chosen building has a residential purpose, which means that the consequence class for this building according to the new spectrum is CC2. For this class, it is necessary to check the limit state of significant damage (SD), which would correspond to the current state of significant damage (SD) and a return period of acceleration of 475 years. It is still unclear whether the currently available seismic acceleration maps will be able to be used for the new spectra, but in the absence of new ones, in this step, one can rely on the existing information. Thus, the acceleration for a return period of 475 years will correspond to the region of moderate seismic acceleration.
The case-study building is a five-storey steel residential building composed of three-bay frames spaced at nine meters as shown in Figure 9. Moment-resisting frames are spaced in the longitudinal direction, and braced frames are spaced in the transverse direction. The structure is located in Europe and founded on a rock site (soil type A according to Eurocode 8 []). The seismic characterization is based on a single parameter, the peak ground acceleration (PGA), which is assumed as 0.3 g. The design was performed according to European provisions (i.e., Eurocodes 3 [], 4 [], and 8 []). European steel cross-sections were adopted for the columns (HEB) and for the beams (IPE). All elements were made of steel grade S275.
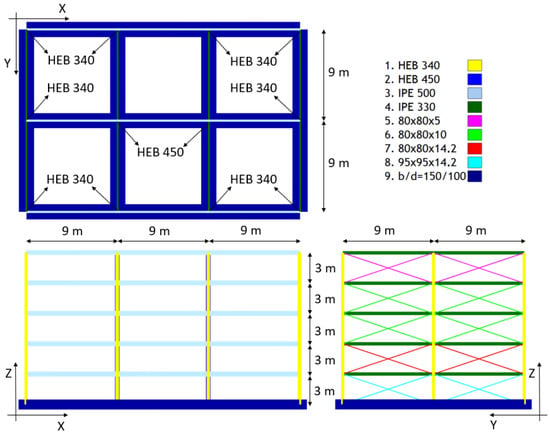
Figure 9.
Graphical representation of steel case-study building.
The loads considered in the building design include the structure’s self-weight and the weight of the floor layers at 2 kN/m2. An additional imposed load of 3 kN/m2 was applied. Wind and snow effects were neglected. In the numerical model, the vertical loads were converted into equivalent lumped masses at the joints, representing 100% of the permanent load and 30% of the variable load, in accordance with Eurocode 8 provisions for participating seismic mass. The behaviour factor (q) for the design, corresponding to multi-storey moment frames with high ductility, was taken as 6.5. Numerical models were created using SAP2000 v21.0.2 [].
Structural nonlinearity was assigned to the building with models of plastic hinges in columns and beams, modelled in accordance with Eurocode 8-part 3 []. The yield moment (My) and plastic moment (Mp) were determined and assigned to each section separately. The moment–rotation relationship used for the plastic hinges was chosen to have a trilinear shape. All assigned hinge properties are given in Table 5. It was regulated that longitudinal force in the columns did not affect the load capacity ; therefore, all joints were made by taking into account only biaxial bending.

Table 5.
Plastic hinge properties.
When the braces of a braced frame are considered, plastic hinges have defined compressive and tensile limits for longitudinal force and deformation limits for tensile force Δt and compressive force Δc. Before the pushover analysis, a modal analysis was conducted. The first mode of vibration was in the X direction (1.114 s), and the second one was in the Y direction (0.526 s). The third period of vibration was torsional 0.408 s. It is important to emphasise that rigid diaphragms were assigned to each floor of the structure. At the centre of the building, i.e., the centre of gravity of the mass, additional nodes were added, which were used to assign horizontal forces representing the seismic loads for implementing the pushover analysis.
Pushover analysis is performed for both translational directions of a building separately. Since the building has hinges assigned in both directions, nonlinearity in the capacity of the building is expected. Pushover analysis requires definition of the vertical distribution of horizontal forces, which is the important step. It was decided to use a distribution corresponding to the modal shape of the building in the direction of interest and the storey mass. The first mode of vibration (1.114 s) was found in the X direction, while the second one (0.526 s) was in Y. The mass of every storey was determined to be 290 t.
Figure 10b shows the result of the pushover analysis for both directions. These capacity curves need to be idealised to match the corresponding single-degree-of-freedom (SDOF) system, so that they can be subsequently used in the N2 method’s steps.
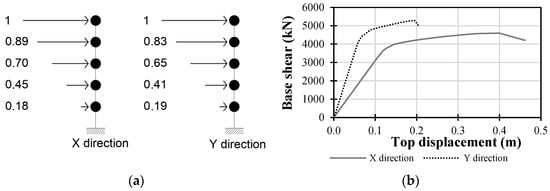
Figure 10.
Vertical distribution of lateral forces for pushover analysis (a) and capacity curves for X and Y (b) directions for steel-frame building.
5.2. ISPRA Building
The experimental full-scale model in Figure 11 is of a four-storey frame structure designed according to the previous version of Eurocode 2 and 8 [], of 12.5 m total height, where the bottom storey height is 3.5 m and the heights of the other three storeys are 3 m. The structure has three frames and, thus, two bays in both the X and Y directions. The raster of bays in the X direction is 4 and 6 m, and the raster of both bays in the Y direction is 5 m, in which a directional load is applied. Both columns and beams have rectangular cross-sections, where the columns’ dimensions are 40/40 cm, except column D, which is 45/45 cm, and the beams’ dimensions are 30 cm width and 45 cm height. The thickness of the slab is 15 cm. The materials used in the construction were concrete C25/30 and B500 Tempcore reinforcing steel with a characteristic yield strength of 500 MPa.
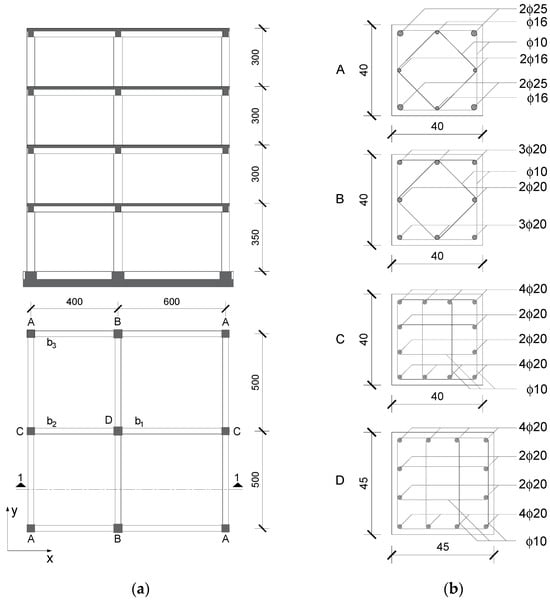
Figure 11.
(a) The four-storey reinforced concrete structure (dimensions in cm); (b) reinforcement of columns (dimensions in cm) at the base [].
Columns were reinforced with 8–12 mm bar (Figure 12). The total reinforcement ratio varied from 1% to 1.9%. The longitudinal reinforcement diameter in the columns ranged from ϕ16 in upper storeys to ϕ20 or ϕ25 on the bottom and in some cases in the first storey. In the critical regions of columns, ϕ10/10 stirrups were used. For the longitudinal reinforcement in beams, ϕ14 bars in combination with ϕ12 bars were used (Figure 11).

Figure 12.
Typical reinforcement in beams (dimensions in cm) in first storey: location b1, location b2, and location b3 [].
A pushover analysis of the ISPRA numerical model was conducted by SeismoStruct (2022) [], in which the behaviour of concrete elements was simulated with force-based plastic hinge (FBPH) elements with plastic hinges at the ends of the elements using Mander’s model of confined concrete from Mander et al. [] and the Menegotto–Pinto model [] for reinforcing steel. The values of concentrated masses were obtained from the self-weight of the structure; a permanent load of 2 kN/m2, which represented floor finishings and partitions; and a live load, also of 2 kN/m2.
As it was done for the steel building, the pushover analysis was conducted separately for each translational direction of the building. A crucial step in the pushover analysis was defining the vertical distribution of horizontal force, and it was decided that using the distribution corresponding to the modal shape of the building in the specific direction of interest and the storey mass would be appropriate. In the Y direction, the first mode of vibration was found to be 0.414 s, while in the X direction, it was 0.413 s. Figure 13b illustrates the outcomes of the pushover analysis for both directions.

Figure 13.
Vertical distribution of lateral forces for pushover analysis (a) and capacity curves for X and Y (b) directions.
6. Discussion and Results
6.1. N2 Method Target Displacement
The N2 method was employed to determine the target displacement values for each case, utilising the data presented in the previous chapters. The target displacement is determined by the building’s capacity curve and overlapping spectra in the acceleration–displacement format (Figure 14). Target displacement provides information on the design or damage control of a building in the event of a specific peak ground acceleration.
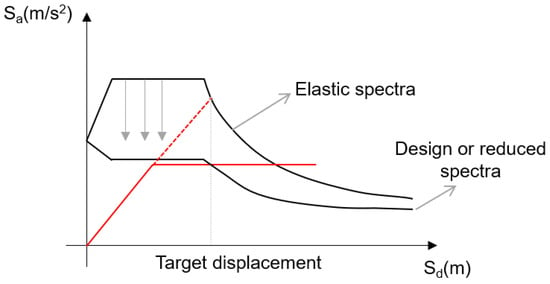
Figure 14.
N2 method target displacement definition.
Target displacement was determined for three different peak ground acceleration levels: 1 m/s2, 2 m/s2, and 3 m/s2. Displacement was compared (Figure 15, Figure 16 and Figure 17) for different soil types and also for when the new generation of EN 1998-1-1 was used as well as the currently valid EN 1998-1-1 norm.
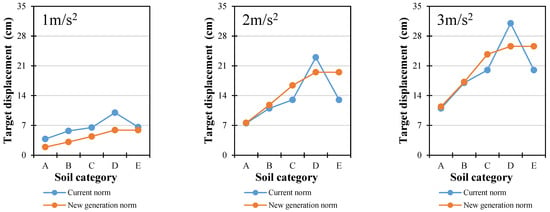
Figure 15.
Comparison of target displacement for steel-framed building (X direction).
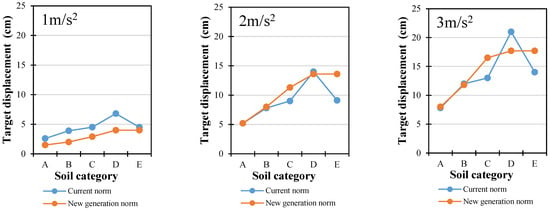
Figure 16.
Comparison of target displacement for steel-braced building (Y direction).
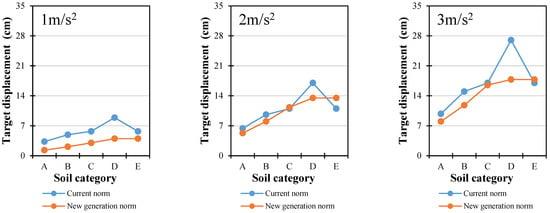
Figure 17.
Comparison of target displacement for RC-framed building (X direction).
The graphs of target displacement show certain differences when the new-generation and currently valid EN 1998-1-1 spectra are compared. At a lower seismic intensity of 1 m/s2, the currently valid norm produces higher target displacement values for all soil types and all three building types (steel-framed, steel-braced, and RC-framed). The largest differences occur for soil types A, B, and D (41–61%), which is attributed to these stiffer soils having shorter predominant periods that place the structures within the short-to-medium period range of the spectrum, where the current norm yields higher spectral ordinates than the new-generation spectra. For the softer soil E, the difference is smaller (11–30%) because both spectra provide similar ordinates in the relevant period range. These higher displacement values for the current norm could lead to larger inter-storey drifts, as examined in the next section.
At higher seismic intensities of 2 m/s2 and 3 m/s2, the trend changes for soil types A and B. The current norm yields target displacements that are almost identical to those from the new-generation spectra for steel buildings and around 20% larger for RC-framed buildings. The difference in RC frames is due to their longer fundamental periods, which interact differently with the spectrum shape, producing slightly higher demands under the current norm.
For soil types C and E, which are softer and have longer predominant periods, the structural response shifts into regions of the spectrum where the new-generation spectra have higher spectral ordinates than the current norm. This results in target displacements up to 50% greater for steel buildings under the new spectra. In RC frames on these soils, the values are almost the same for both norms because the period elongation, combined with higher ductility, balances out the spectral differences.
6.2. N2 Method Inter-Storey Drifts
Complete information regarding the building state cannot be obtained from the previously studied target displacement. Consequently, Figure 18 and Figure 19 illustrate the distribution and comparison of inter-storey drifts for each target displacement, which is divided by soil type and level of acceleration. In order to evaluate the impact of various spectra on various structural systems, inter-storey drifts are presented for three types of structures: steel moment-resisting frames, steel braced frames, and RC frames. Braced frames exhibit behaviour that is comparable to that of shear walls, while moment-resisting frames function exclusively as frames.
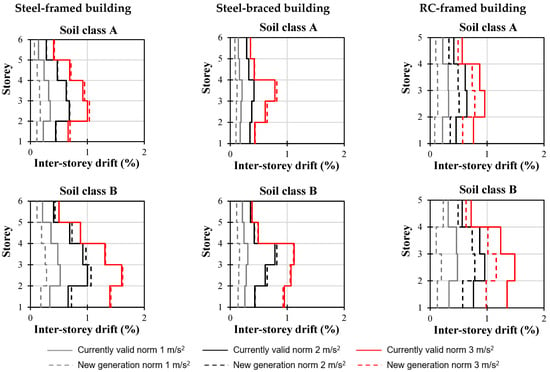
Figure 18.
Inter-storey drifts for three building types; soil types A and B; and 1, 2, and 3 m/s2 ground accelerations.
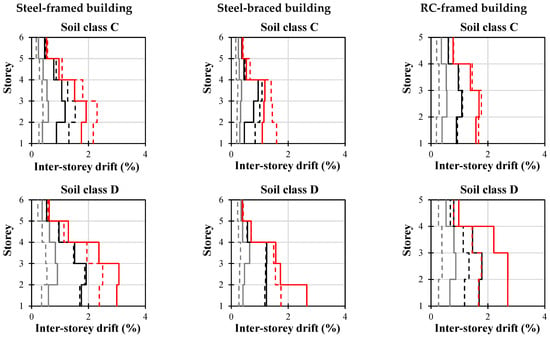
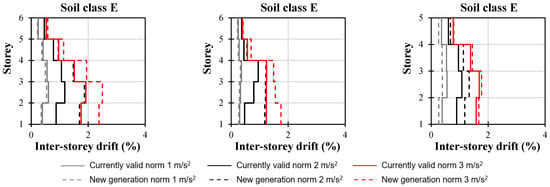
Figure 19.
Inter-storey drifts for three building types; soil types C, D, and E; and 1, 2, and 3 m/s2 ground accelerations.
Soil classes A and B are the only ones depicted in Figure 18 for three building types and for ground accelerations that increase incrementally. The grey-coloured lines illustrate the initial distinctions in inter-storey drifts. Solid lines denote inter-storey drifts in accordance with the current valid norm, while dashed lines denote the results for the new generation of the norm. The distribution of drift for soil types A and B is consistent in the majority of cases. The maximum drifts are observed in the second storey of both framed structures and in the third storey of the braced frames.
The inter-storey drift position is only visible for braced frames in the C, D, and E soil classes (Figure 19), specifically from the third to the first storey for 3 m/s2 ground accelerations.
The maximum inter-storey drifts are compared in Figure 20, Figure 21 and Figure 22. The application of the new-generation norm spectra resulted in an average of 46% lower values of inter-storey drift for ground acceleration values as low as 1 m/s2. According to their drift values and performance levels, this disparity is not negligible. It appears that the same building, under identical conditions, will exhibit a “better” or more acceptable performance level in accordance with the new-generation norm []. In all three cases, the performance level of the various building types varied from limited safety to severe collapse, with the largest differences being primarily attributed to soil type D for larger values of ground acceleration (3 m/s2).
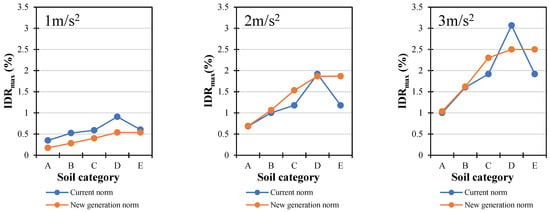
Figure 20.
Comparison of maximum drifts for steel-framed building (X direction).
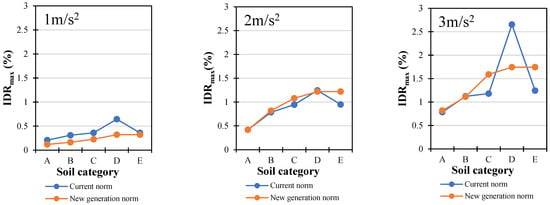
Figure 21.
Comparison of maximum drifts for steel-braced building (Y direction).
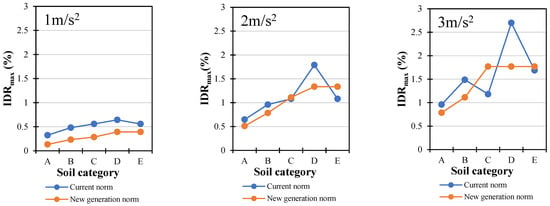
Figure 22.
Comparison of target displacement for RC-framed building (X direction).
7. Conclusions
This study implemented the N2 approach to conduct a comprehensive analysis and evaluation of the new-generation elastic and design response spectra of Eurocode 8, in comparison to the current valid standard. The examination concentrated on three distinct types of structures: steel-framed buildings, RC-framed buildings, and steel-braced-framed buildings. Target displacements and inter-storey drifts were assessed for three ground accelerations (1, 2, and 3 m/s2) and five soil types (A–E).
- When the current standard was implemented for all soil types and all three building types, the target displacement for an acceleration of 1 m/s2 was generally higher. The largest disparities occurred for soil types A, B, and D, ranging from 41% to 61%. For accelerations of 2 m/s2 and 3 m/s2, steel buildings showed nearly identical target displacements across soils, while RC-framed buildings showed values approximately 20% higher for soils A and B. Only soils C and E exhibited significantly higher target displacement values—up to 50%—for steel buildings; RC frames remained almost unaffected.
- The distribution of inter-storey drifts was generally consistent for soils A and B. Braced frames experienced the largest drifts in the third storey, while the second level of both framed building types recorded the largest drifts.
- The comparison of maximum inter-storey drifts showed that using next-generation spectra resulted in an average 46% reduction in drift values at 1 m/s2. This difference is substantial with respect to performance levels, especially in cases where structures shift from restricted safety to severe collapse. At higher ground accelerations (3 m/s2), soil type becomes the dominant factor influencing performance.
The observed soil-dependent variations are primarily linked to differences in soil stiffness and its influence on the fundamental period of the structure. Softer soils (C and E) tend to lengthen structural periods, shifting the response into regions of the spectrum with higher spectral displacement demands. This effect is more pronounced for heavier, more flexible RC frames, which experience amplified displacements under long-period spectral peaks. Conversely, stiffer soils (A and B) limit period elongation, keeping structures within the plateau range of the spectrum, resulting in more uniform drift distributions. Steel structures, due to their lighter mass, higher ductility, and faster post-yield stiffness degradation control, are less sensitive to soil-induced period shifts, particularly under higher seismic intensities.
The results of this study have direct relevance for seismic design under the next-generation Eurocode. At lower seismic intensities, the adoption of updated spectra can significantly reduce inter-storey drifts, improving serviceability performance. However, for higher intensities and softer soils, RC frames may experience notably greater displacement demands, requiring careful consideration in design and retrofitting strategies. By quantifying these effects across structural types and soil classes, this work provides actionable guidance for engineering practice and contributes to the evidence base needed to calibrate national provisions before full implementation of the new standard.
Author Contributions
Conceptualisation, A.B. and T.K.Š.; methodology, A.B., T.K.Š. and M.Č.; software, A.B. and T.K.Š.; formal analysis, A.B. and T.K.Š.; investigation, A.B., T.K.Š. and M.Č.; resources, A.B., T.K.Š. and M.Č.; writing—original draft preparation, A.B., T.K.Š. and M.Č.; writing—review and editing, A.B., T.K.Š. and M.Č.; visualisation, A.B. and T.K.Š. All authors have read and agreed to the published version of the manuscript.
Funding
This research received no external funding.
Data Availability Statement
The original contributions presented in this study are included in the article. Further inquiries can be directed to the corresponding author.
Conflicts of Interest
The authors declare no conflict of interest.
Correction Statement
This article has been republished with a minor correction to the Data Availability Statement. This change does not affect the scientific content of the article.
References
- CEN 2005b; Eurocode 8: Design of Structures for Earthquake Resistance—Part 3: General Rules, Seismic Actions and Rules for Buildings, Design Code EN 1998-3. European Committee for Standardisation: Brussels, Belgium, 2005.
- Fajfar, P. A Nonlinear Analysis Method for Performance-Based Seismic Design. Earthq. Spectra 2000, 16, 573–592. [Google Scholar] [CrossRef]
- Bhatt, C.; Bento, R. Assessing the seismic response of existing RC buildings using the extended N2 method. Bull. Earthq. Eng. 2011, 9, 1183–1201. [Google Scholar] [CrossRef]
- Narjabadifam, P.; Mollaei, S.; Noroozinejad Farsangi, E.; Babaei, M.; Mousavi, N. Comparative probability-based seismic safety assessment of base-isolated buildings: A case study. Adv. Civ. Archit. Eng. 2024, 15, 33–49. [Google Scholar] [CrossRef]
- Mekki, M.; Elachachi, S.; Breysse, D.; Nedjar, D.; Zoutat, M. Soil-structure interaction effects on RC structures within a performance-based earthquake engineering framework. Eur. J. Environ. Civ. Eng. 2014, 18, 945–962. [Google Scholar] [CrossRef]
- Fischinger, P. N2—A method for non-linear seismic analysis of regular buildings. In Proceedings of the Ninth World Conference in Earthquake Engineering, Tokyo-Kyoto, Japan, 2–9 August 1988. [Google Scholar]
- Fajfar, P.; Gašperšič, P. The N2 method for the seismic damage analysis of RC buildings. Earthq. Eng. Struct. Dyn. 1996, 25, 31–46. [Google Scholar] [CrossRef]
- Fajfar, P.; Kilar, V.; Marusic, D.; Perus, I.; Magliulo, G. The extension of the N2 method to asymmetric buildings. In Implications of Recent Earthquakes on Seismic Risk; Tokyo Institute of Technology: Meguro, Japan, 2002. [Google Scholar]
- Kreslin, M.; Fajfar, P. The extended N2 method considering higher mode effects in both plan and elevation. Bull. Earthq. Eng. 2012, 10, 695–715. [Google Scholar] [CrossRef]
- Brandis, A.; Kraus, I.; Petrovčič, S. Nonlinear Static Seismic Analysis and Its Application to Shallow Founded Buildings with Soil-Structure Interaction. Buildings 2022, 12, 2014. [Google Scholar] [CrossRef]
- FprEN 1998-1-1:2024; Eurocode 8: Design of Structures for Earthquake Resistance Part 1-1: General Rules and Seismic Action, CEN. European Committee for Standardization: Bruxelles, Belgium, 2023.
- Labbé, P.; Paolucci, R. Developments Relating to Seismic Action in the Eurocode 8 of Next Generation; Springer International Publishing: Cham, Switzerland, 2022; pp. 26–46. [Google Scholar]
- Labbé, P. Outlines of the revision of the Eurocode 8, part 1-generic clauses. In Proceedings of the 16th European Conference on Earthquake Engineering, Thessaloniki, Greece, 18–21 June 2018; pp. 18–21. [Google Scholar]
- Saraiva Esteves Pacheco De Almeida, J.; De Visscher, S.; Varum, H.; Correia, A.A. The second generation of Eurocode 8: Comparison between the new displacement-based and force-based design approaches for RC MRFs. In Proceedings of the 3rd European Conference on Earthquake Engineering and Seismology, Bucharest, Romania, 4–9 September 2022. [Google Scholar]
- Čaušević, M.; Mitrović, S.; Bulić, M. Determination of Seismic Load for Buildings using Different Response Spectra and Application on Different Methods of Analysis. Cogent Eng. 2023, 10, 2220494. [Google Scholar] [CrossRef]
- Costanzo, S.; D’Aniello, M.; Landolfo, R. Nonlinear Static Response of Low-Moderate Ductile Chevron Concentrically Braced Frames Designed According to Eurocode 8. Buildings 2023, 13, 120. [Google Scholar] [CrossRef]
- Castro, J.M.D.F. Seismic Behaviour of Composite Moment-Resisting Frames. Ph.D. Thesis, Imperial College London (University of London), London, UK, 2006. [Google Scholar]
- Elghazouli, A.; Castro, J.; Izzuddin, B. Seismic performance of composite moment-resisting frames. Eng. Struct. 2008, 30, 1802–1819. [Google Scholar] [CrossRef]
- CEN 2005a; Eurocode 3: Design of Steel. Structures, Part 1-1. European Committee for Standardization: Brussels, Belgium, 2005.
- CEN 2004; Eurocode 4: Design of Composite Steel and Concrete Structures—Part 1-1: General Rules and Rules for Buildings. European Committee for Standardization: Brussels, Belgium, 2004.
- CSI. SAP2000 Integrated Software for Structural Analysis and Design; Computers and Structures Inc.: Berkeley, CL, USA, 2013. [Google Scholar]
- Donea, J.; Magonette, G.; Negro, P.; Pegon, P.; Pinto, A.V.; Verzeletti, G. Large-Scale Testing at the ELSA Reaction Wall in Support of Eurocode 8; Elnashai, A.S., Ed.; European Seismic Design Practice; Balkema: Rotterdam, The Netherlands, 1995; pp. 19–26. [Google Scholar]
- SeismoStruct—A Computer Program for Static and Dynamic Nonlinear Analysis of Framed Structures. Available online: www.seismosoft.com (accessed on 20 June 2025).
- Mander, J.B.; Priestley, M.J.N.; Park, R. Theoretical stress-strain model for confined concrete. J. Struct. Eng. 1988, 114, 1804–1826. [Google Scholar] [CrossRef]
- Menegotto, M.; Pinto, P.E. Method of analysis of cyclically loaded RC plane frames including changes in geometry and non-elastic behavior of elements under normal force and bending. In Proceedings of the IABSE Symposium on Resistance and Ultimate Deformability of Structures Acted on by Well Defined Repeated Loads, Lisbon, Portugal, 1973; IABSE: Zürich, Switzerland, 1973. [Google Scholar]
- Ghobarah, A.; Aly, N.M.; El-Attar, M. Performance Level Criteria and Evaluation. In Proceedings of the International Workshop on Seismic Design Methodologies for the Next Generation of Codes, Bled, Slovenia, 24–27 June 1997; pp. 207–215. [Google Scholar]
Disclaimer/Publisher’s Note: The statements, opinions and data contained in all publications are solely those of the individual author(s) and contributor(s) and not of MDPI and/or the editor(s). MDPI and/or the editor(s) disclaim responsibility for any injury to people or property resulting from any ideas, methods, instructions or products referred to in the content. |
© 2025 by the authors. Licensee MDPI, Basel, Switzerland. This article is an open access article distributed under the terms and conditions of the Creative Commons Attribution (CC BY) license (https://creativecommons.org/licenses/by/4.0/).