Featured Application
This paper presents an original numerical–analytical methodology for predicting the distribution of temperature fields and quantifying the influence of temperature on the contact forces and the stress–strain state of key elements of the cycloidal reducers.
Abstract
The design of cycloidal reducers requires a detailed knowledge of the intensity and character of load, as well as the maximum von Mises stresses on critical components. In the available literature, the load distribution and the stress–strain state of the cycloidal reducer elements are typically determined based on factors such as cycloidal disc tooth profile modifications, contact deformations, and internal clearances, whereas the influence of thermal stresses is most often neglected. To address this research gap, an innovative numerical–analytical methodology has been developed, which, for the first time, enables the prediction of the distribution of temperature fields and the quantification of the influence of temperature on the contact forces and the stress–strain state of key elements of the cycloidal reducer. Furthermore, the proposed methodology can be adapted for application within a broader context of mechanical engineering. From a practical perspective, it is expected to be beneficial to companies engaged in the design of power transmission gearboxes, as valuable practical guidelines for engineering applications are provided. This study also provides new insights into the dominant sources of heat generation and offers a clearer understanding of how thermal energy is transferred from internal heat sources to the outer surface of the housing.
1. Introduction
The cycloidal reducer represents a highly complex mechanical system in terms of geometry, kinematic structure, and dynamic behavior. Its complexity is clearly illustrated in Figure 1, which shows a typical configuration of a single-stage cycloidal drive with its main components: two cycloidal discs, several rollers (ring gear and output), an eccentric bearing, an output mechanism, and a housing.
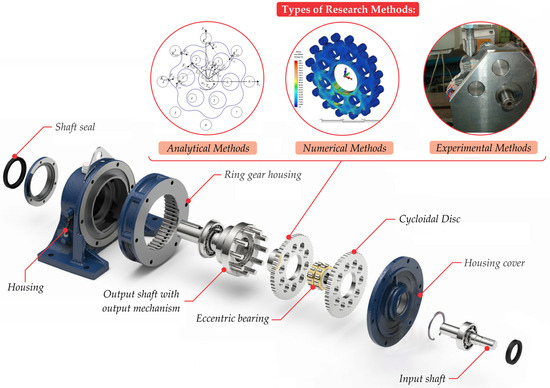
Figure 1.
Typical structure of a cycloidal reducer and commonly used methods for load analysis.
A thorough understanding of load conditions in such systems is of crucial importance. It enables accurate dimensioning of vital components, reliable efficiency evaluation, fatigue analysis, structural optimization, dynamic behavior assessment, as well as noise and vibration analysis, and analysis of stress and deformation distributions.
For this reason, the defining of load conditions in cycloidal reducers has been the focus of numerous studies worldwide. At present, contact forces on the vital elements of these power transmission systems can be determined by means of analytical, numerical, and experimental methods. Among the analytical approaches, the works of Kudryavtsev [1] and Lehmann [2] are particularly notable. Kudryavtsev developed the first analytical method for calculating contact forces, analyzing the theoretical meshing case in which all rollers (ring gear and output) make contact with the cycloidal disc, with half of them transmitting the load. Such a configuration represents a statically indeterminate system. Lehmann, on the other hand, proposed a highly complex and comprehensive model which, when implemented using appropriate software, can be fully automated. A common feature of both methods is the neglect of clearances, as well as the assumption that the bodies in contact are perfectly rigid and that the cycloidal discs contain no holes.
In recent decades, numerous analytical models have been proposed to calculate contact forces while accounting for internal clearances. These models have primarily focused on the forces between the cycloidal disc teeth, the ring gear rollers, and the output rollers. Li et al. conducted an evaluation of contact forces while considering the influence of clearances. Their analysis was based on a planar load model and assumed a uniform load distribution between the two cycloidal discs [3]. Since the elements in contact are deformable bodies, minimal clearances are eliminated, which increases the number of the load-transmitting elements. Ren et al. defined a new modified cycloidal disc tooth profile, which produced lower contact forces [4]. In his analysis of load distribution in cycloidal reducers, Xu considered the effect of friction and arrived at several important conclusions. He found that the number of ring gear rollers transmitting load depends solely on the degree of the cycloidal disc tooth profile modification and not on the clearance between the output rollers and the disc. Conversely, the number of the output rollers transmitting load depends only on the clearance between them and the disc, and not on the degree of the tooth profile modification. Furthermore, for the same clearance values, the number of the load-transmitting rollers increases with an increase in the input torque [5]. Artyomov et al. investigated how the contact area dimensions and contact force magnitudes are influenced by clearances, the stiffness of the elements in contact, and operating conditions. They demonstrated that reducing the stiffness coefficient of the contacting elements increases the size of the contact zone and the number of elements in contact but decreases the values of contact forces [6]. Bednarczyk investigated how the distributions of clearances and contact forces, as well as variations in eccentricity, affect the efficiency of the cycloidal reducer [7,8]. Zhang et al. developed a three-dimensional model for load analysis in cycloidal reducers with a modified cycloidal disc tooth profile [9]. This model included longitudinal profile modifications, which were an innovation compared to prior studies. Jiang et al. introduced a new tooth profile modification concept, which resulted in lower contact forces [10]. A significant contribution to the analysis of load distribution in cycloidal reducers was made by Tchufistov et al., who identified the eccentric bearing as the most critical element in terms of the service life of the reducer [11,12]. They also analyzed the output forces as functions of contact deformations.
Contact forces in cycloidal reducers can also be determined using numerical methods, as demonstrated by numerous studies over the past decades. Incorporating initial assumptions in various software tools (MSC Patran/Nastran, Ansys, Femap, Abaqus, etc.), a wide range of numerical models has been developed for load analysis in cycloidal reducers. Most of these numerical models confirm the results obtained analytically. One of the earliest three-dimensional models was developed by Thube and Bobak [13]. Their model included only one cycloidal disc, while external loads were defined as time-varying quantities. Krol defined a numerical model of a cycloidal reducer with two cycloidal discs and obtained a range of valuable results [14]. Jang et al. analyzed the stress–strain state of a cycloidal reducer with an internal cycloidal profile instead of ring gear rollers [15]. When this cycloidal reducer was compared to an involute reducer having the same operating characteristics, it was concluded that the stress and strain distribution was significantly more favorable in this specific design. It is important to mention the research performed by Jiang et al., who developed analytical expressions for calculating contact forces in cycloidal discs with modified tooth profiles, both in the absence and presence of clearances [10]. These analytical results were subsequently verified by numerical analysis. A particularly interesting study was conducted by Zakharov et al., who investigated the non–uniform load distribution between cycloidal discs with identical transmission ratios [16]. They concluded that the primary cause of this non-uniformity is the spacing between the cycloidal discs, which should be minimized.
Thermal behavior analysis of cycloidal reducers has not been the subject of extensive research to date. Mihaillidis investigated the procedure for determining flash temperatures in cycloidal reducers [17]. Zah et al. studied thermal stability, particularly focusing on finding the operating temperature under thermal equilibrium conditions [18]. Hu analyzed thermal deformations in RV reducers, concluding that they were negligible as long as operating temperatures remained below 85 °C [19]. Vasić et al. investigated the thermal stability of cycloidal reducers and developed an analytical model for determining partial power losses and the intensity of thermal sources [20,21].
As can be noticed, in the available literature, the influence of thermal stresses on the values of contact forces has remained unexplored. While this influence may be negligible under normal operating conditions and nominal loads, the question of what occurs under conditions of prolonged and intensive overloading remains open. For this reason, the main objective of this study is the development of an innovative numerical–analytical methodology, which, for the first time, enables the prediction of the distribution of temperature fields and the quantification of the influence of temperature on the contact forces and the stress–strain state of key elements of the cycloidal reducer. Moreover, in addition to advancing scientific knowledge, the developed methodology is expected to have wide practical application in the field of power transmission design.
2. Materials and Methods
2.1. Numerical–Analytical Methodology
This chapter presents a numerical–analytical methodology designed to predict the distribution of temperature fields and to quantify their influence on the contact forces and the stress–strain state of vital elements. The numerical part of the study was performed using the commercial software ANSYS Workbench 2019 R2, and it consisted of three analyses (Figure 2). In the first part, a structural analysis was performed in the Static Structural module based on a three-dimensional geometric model of a single-stage cycloidal reducer under known external loads. This yielded the values of the forces in the contacts between the cycloidal discs, ring gear rollers, and output rollers (involved in load transfer), as well as the corresponding stress values. The second analysis was performed in the Transient Thermal module, which enabled thermal analysis in the time domain. In this phase, the input data from the first analysis (3D geometry and material properties) were used. The intensities of thermal sources (power losses), which had been previously determined analytically using Matlab 2017, were also included. As a result, the thermal state of the model, i.e., the distribution of temperature fields, was obtained. The third (final) analysis was carried out in the Static Structural module. Utilizing input data from the initial analysis combined with the thermal conditions obtained from the second analysis, the comprehensive contact forces and the stress–strain state of vital elements of the cycloidal reducer were determined under the combined influence of external and thermal loads.
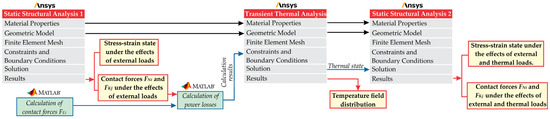
Figure 2.
Schematic representation of the research methodology.
2.1.1. Geometric Model and Material Properties
The three-dimensional geometric model of the cycloidal reducer used in this study has the same dimensions as the tested single-stage cycloidal reducer of classical design (Sumitomo, Düsseldorf, Germany) described in detail in [20]. Its basic characteristics are presented in Table 1 and Table 2.

Table 1.
Geometric characteristics of the tested cycloidal reducer.
Table 2.
Bearing specifications.
In order to reduce the model complexity and computational time, some elements were modelled as a single element. Additional simplification was achieved by removing small parts such as bolts, washers, keys, and shaft radial seals.
The reducer housing is made of cast iron GG25, while all other components are manufactured from steel 100Cr6 and steel C45. The mechanical properties of these materials are presented in Table 3. To further simplify the model, all these materials were assumed to be isotropic and homogeneous, meaning that they have the same properties in all directions.
Table 3.
Material properties of the cycloidal reducer components.
The cycloidal reducer was lubricated using Unirex N2 grease (ExxonMobil, Houston, TX, USA). The key properties of the Unirex N2 grease are presented in Table 4. Since the lubricant is squeezed and churned during operation, it was modeled as an integral component occupying the free geometric space within the housing.
Table 4.
Main characteristics of the lubricant.
2.1.2. Finite Element Mesh
Due to the differences in dimensions and shapes of the individual elements, a non-uniform mesh was used. It was composed of 639,674 nodes and 198,814 interconnected finite elements, with an average element size ranging from 0.8 to 1.5 mm (Figure 3).
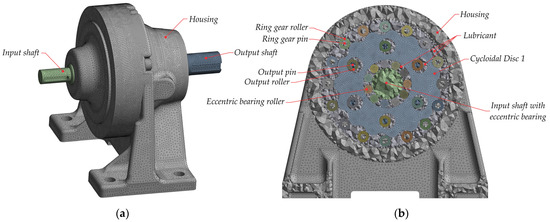
Figure 3.
Finite Element meshing model: (a) total mesh result; (b) mesh in specific regions.
The finite element type used was SOLID186, which is a higher-order, three-dimensional (volumetric) element defined by 20 nodes [22]. In cases where the SOLID186 element could not be fully adapted to the geometry, the software automatically generated tetrahedral (Tet10), prismatic (Prism15), or pyramidal (Pyramid13) versions of the element. The characteristics of these element types are presented in Table 5.
Table 5.
Characteristics of the SOLID186 element and its degenerated forms.
2.1.3. Constraints and Boundary Conditions in Static Structural Analysis
To ensure that contact conditions reflect the real operating conditions, all the contacts were defined as frictional contacts, while the rotational motions between the elements were defined using revolute joints. The first rotational motion was defined between the cycloidal disc 1 and the eccentric bearing, which was modelled together with the input shaft as a single component. Similarly, the second rotational motion was defined between the cycloidal disc 2 and the eccentric bearing. The third rotational motion was defined using a pinned support, with the outer surface of the input shaft sleeve selected as the reference surface.
Since the primary objective of the structural analysis was to determine the contact forces and the stress–strain state of the components, a driving torque was simulated at the input shaft, while appropriate degrees of freedom were removed from the other components. This primarily refers to the output mechanism on which a fully fixed support was applied so that all translational and rotational offsets were constrained. This approach was chosen because the response of the output mechanism to the applied driving torque generates contact forces between the following:
- ▪
- The teeth of the cycloidal disc and the ring gear rollers (normal contact force );
- ▪
- The output rollers and the holes in the cycloidal disc (output contact force).
The distribution of these contact forces on the first cycloidal disc at the drive angle β = 0° is shown in Figure 4a. The same contact forces, rotated by 180°, act on the second cycloidal disc, which is also rotated 180° relative to the first disc, as shown in Figure 4b.
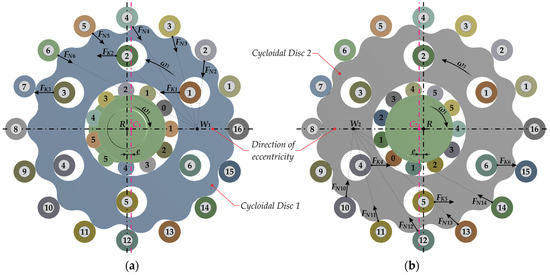
Figure 4.
Distribution of the contact forces at the drive angle β = 0° on: (a) cycloidal disc 1; (b) cycloidal disc 2.
Axial translational offset was also constrained for the cycloidal discs, ring gear rollers, and output rollers. Components such as the housing, lubricant, and the input and output shaft bearings were excluded from the Static Structural analysis to reduce the model complexity and computation time.
To account for the presence of gaps, it is assumed that two-thirds of the ring gear rollers participate in the load transmission (one-third of the ring gear rollers per a cycloidal disc) [23]. The contacts transmitting load are defined as closed, with no penetration, while the contacts that are not transmitting load are defined as contacts with gaps. Thus, 20% of the ring gear rollers per cycloidal disc, located closest to the direction of eccentricity, are excluded from the load transmission process.
The convergence criterion in this analysis was based on the force convergence method, with a specified tolerance of 0.5%.
2.1.4. Constraints and Boundary Conditions in Transient Thermal Analysis
In order to define the boundary conditions in transient thermal analysis, it is essential to identify the dominant mechanisms of heat transfer from the internal thermal sources to the external surface of the housing. This analysis is highly complex due to the compact design of the cycloidal reducer and a large number of constituent components.
In general, part of the heat generated at the contact surfaces between mechanical elements is retained within those elements. Another part of the heat is transferred via conduction to adjacent internal elements. The remaining heat is transferred through the lubricant to the internal walls of the housing due to its interaction with all internal components.
Although the heat transfer from the internal components to the lubricant is, by nature, a convective process, it is approximated here as conductive. The same approximation is applied for the heat transfer from the lubricant to the internal housing walls. This modelling approach is justified because these are compact power transmissions with limited space for lubricant flow, with the effects of natural convection within the housing significantly weaker compared to conductive heat transfer [24]. This is especially evident in grease-lubricated cycloidal reducers. Thus, this model considers conductive heat transfer from the thermal sources to the housing, while the heat transfer from the external surface of the housing to the ambient air occurs through convection and radiation.
All of the previously defined mechanisms of heat transfer from the internal thermal sources to the external housing surface and the ambient air are summarized in Table 6.
Table 6.
Dominant heat transfer mechanisms in transient thermal analysis.
The heat transfer coefficient from the external surface of the housing to the ambient air is described in detail in reference [20], while the thermal loads, which represent analytically determined power losses (Section 2.1.5), are applied as heat fluxes. Also, to ensure compatibility when importing the temperature fields into the second structural analysis, the same mesh configuration as in the first structural analysis was used, and the convergence criterion was based on the temperature convergence method, with a specified tolerance of 0.5 °C.
2.1.5. Power Loss Calculation
Determining the distribution of the temperature field requires a precise knowledge of the intensity of thermal sources, i.e., the power losses that occur in loaded zones as a result of friction on the contact surfaces of the meshed elements.
Power losses in gear transmissions can be classified into two categories: load-dependent and load-independent losses (index L0) [25,26]. Load-dependent losses increase proportionally with the transmitted torque, whereas load-independent losses are not directly affected by it. Nevertheless, an increase in torque leads to elevated operating temperatures, which alter lubricant characteristics such as density and viscosity. These changes subsequently influence the load-independent losses. In the case of cycloidal reducers, the dominant sources of such losses are the interactions between the lubricant and the cycloidal discs , as well as between the lubricant and the bearing components
Power losses can be further classified based on the contacts between mechanical components (Figure 5). These losses arise as a result of the friction between: the cycloidal discs and the rollers (ring gear rollers and output rollers , the pins and the rollers (ring gear rollers and output rollers ), the bearing elements (eccentric bearings, input and output shaft bearings), and the radial shaft seals. Mathematical models used to estimate these losses are described in detail in [20]. Below are only their basic expressions.
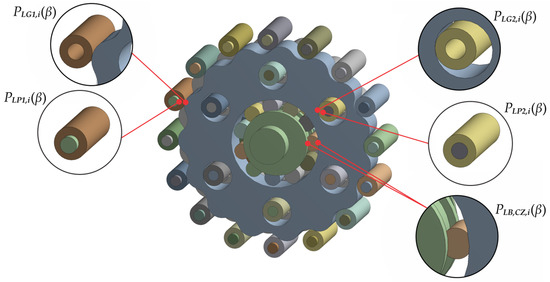
Figure 5.
Areas of mechanical power losses.
The power loss between the i-th ring gear roller and a cycloidal disc tooth and the power loss between the j-th output roller and the holes in the cycloidal disc at a corresponding drive angle of the cycloidal disc , is calculated using the following expressions:
where is the contact force on the current contact surface between the cycloidal disc teeth and the ring gear rollers, is the contact force on the current contact surface between the output rollers and the holes in the cycloidal disc, is the rolling friction coefficient between the ring gear rollers and the cycloidal disc teeth, is the rolling friction coefficient between the output rollers and the holes in the cycloidal disc, denotes the diameter of the ring gear rollers, is the diameter of the output rollers, is the angular velocity of the ring gear rollers, and is the angular velocity of the output rollers.
The power loss between the i-th ring gear roller and the pin , and the power loss between the j-th output roller and the pin , at a corresponding drive angle of the cycloidal disc is calculated using the following expressions:
where is the sliding friction coefficient between the ring gear rollers and their pins, is the sliding friction coefficient between the output rollers and their pins, is the diameter of the central pin, and is the diameter of the output pin.
The power loss between i-th rolling body of the eccentric bearing and the corresponding rolling raceways , at a certain drive angle is calculated using the following expression [27]:
where is a factor dependent on the bearing type and the direction of the load, is the load transmitted by the i-th rolling element, is the mean diameter of the bearing, is the angular velocity of the input shaft, a is the angular velocity of the output shaft.
The power losses resulting from the interaction of the lubricant with the cycloidal disc, , and the losses due to the interaction of the lubricant with bearing elements, as well as the mechanical power losses associated with the input and output shaft bearings , , , and , are not included in this analysis.
2.2. Model Validation
In order to verify the validity of the proposed numerical–analytical methodology, the values of the contact forces were calculated analytically without the effects of thermal stresses. Experimental measurements of the temperature field distribution were also conducted.
2.2.1. Analytical Validation of Contact Forces Without the Effects of the Thermal Stresses
The normal contact forces and the output contact forces were calculated using the Lehmann model [2], which has been recognized as the most appropriate analytical approach for this type of validation, with thermal effects being neglected. The fundamental expressions of this model are presented in algorithmic form in Figure 6.
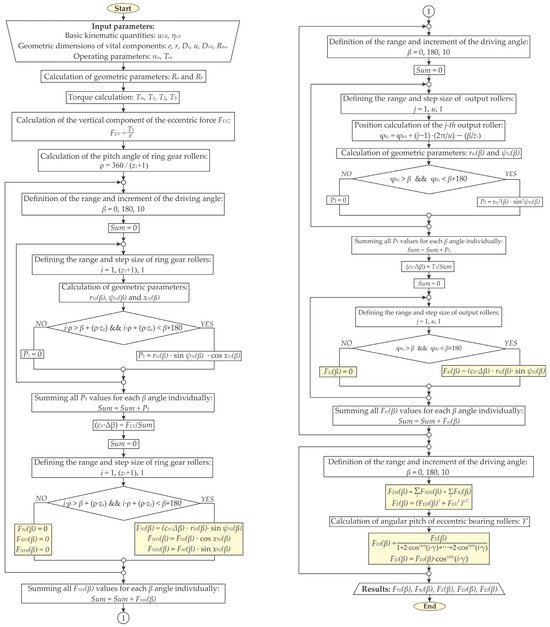
Figure 6.
Algorithm for calculating contact forces without the effects of thermal stresses.
Due to the large number of contact zones in cycloidal reducers and the time-dependent nature of the contact forces with respect to the rotation angle of the cycloidal disc, the calculations were carried out using Matlab 2017 software package.
2.2.2. Experimental Validation of Temperature Field Distribution
The test bench, depicted in Figure 7, is equipped with a Brushless DC (BLDC) motor (Ningbo Volcano Electric, Ningbo, China) as the driving unit, a magnetic brake (Chain Tail, Taichung City, Taiwan) for applying a controlled load, the cycloidal reducer under investigation (Sumitomo, Düsseldorf, Germany), an intermediate shaft, and claw-type couplings.
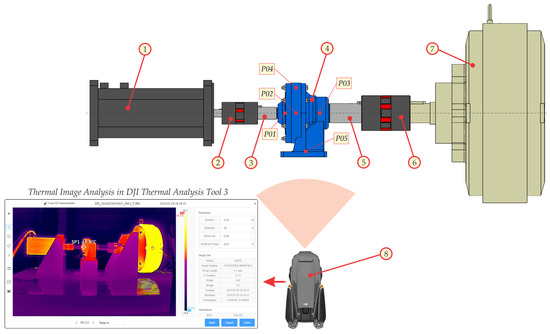
Figure 7.
Test bench: (1) BLDC motor, (2) shaft coupling, (3) input intermediate shaft, (4) cycloidal reducer, (5) output intermediate shaft, (6) shaft coupling, (7) magnetic powder brake, and (8) thermal imaging camera.
The external surface temperature of the reducer housing was monitored by means of an infrared camera (DJI Matrice 30T, DJI Technology, Nanshan, China) mounted in front of the test bench. The obtained infrared thermal (IRT) images are stored in the thermal camera’s internal memory. Subsequent image processing, including color palette adjustments, target distance, air humidity, emissivity, and reflectivity coefficients, was performed using the DJI Thermal Analysis Tool 3 software package.
The emissivity coefficient was determined by comparing the temperatures obtained from thermal imaging with those measured using a non–contact digital thermometer. Its value was 0.95.
To enable a more accurate comparison between the measured and simulated results, five measurement points were defined in the DJI Thermal Analysis Tool 3. Their layout is shown in Figure 7. The point P01 is located on the housing cover, in the input bearing zone. The point P02 is positioned on the central axis of the housing. The point P03 is in the output bearing zone, while the point P04 is located in the upper section of the housing. Finally, the point P05 is placed at the bottom of the foot mount.
3. Results and Discussion
This chapter presents the results obtained using analytical, numerical, and experimental methods. All the tests were conducted at the driving torque (which corresponds to a nominal load of ) and at an input rotational speed of 1450 . Other parameters used for testing are provided in Table 7.
Table 7.
Values of basic calculation parameters.
3.1. Contact Forces
A comparative analysis of the numerically and analytically determined contact forces without the effects of thermal stresses, at the drive angle , is presented in Figure 8. Taking the allowable deviation into account, the numerically obtained values show very good agreement with the analytically calculated results. The average deviation for the normal contact forces is 15.1% (maximum 21.2%), while for the output contact forces , the average deviation is 10.2% (maximum 22.5%). An uneven load distribution between the cycloidal discs and the corresponding rollers is observed. The contact forces between the ring gear rollers and the teeth of the cycloidal disc 2 are approximately 5–6% higher compared to those between the ring gear rollers and the teeth of the cycloidal disc 1. The same trend is observed in the contact forces between the output rollers and the holes in the cycloidal disc, where the difference ranges between 6 and 7%.
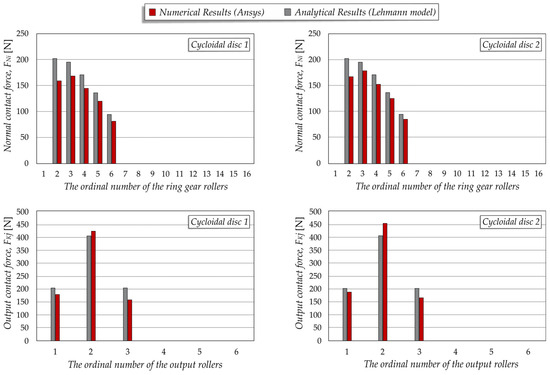
Figure 8.
Comparison of analytically and numerically obtained values of contact forces without effects of thermal stresses.
3.2. Power Losses
To facilitate drawing conclusions about the distribution of power losses among the key elements of the cycloidal reducer, the average values of the calculated partial power losses—that is, the intensities of the local heat sources—are presented in Figure 9. These values correspond to the drive angle ranging from 0° to 180°. The highest power losses occur in the contacts between the output rollers and the pins, while slightly lower losses are observed in the contacts between the rolling bodies of the eccentric bearing and the corresponding raceways. It was also observed that the power losses associated with the output rollers ( and ) are significantly higher than the losses associated with the ring gear rollers ( and ). This is primarily attributed to the fact that the output rollers are subjected to considerably higher loads and angular velocities compared to the ring gear rollers.
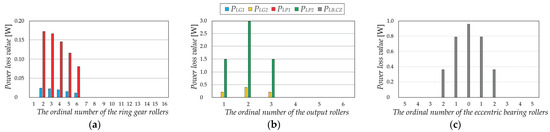
Figure 9.
Average load-dependent power losses at a drive angle β in the range from 0° to 180°: (a) power losses in the ring gear rollers, (b) power losses in the output rollers, (c) power losses in the eccentric bearing.
3.3. Temperature Field Distribution on the Outer Surface of the Housing
The temperature field distribution on the outer surface of the housing is shown in Figure 10. The maximum temperature was recorded near the input shaft bearing region. A gradual decrease in the temperature is also observed from the upper part towards the lower part of the housing, with the temperature on the input side being significantly higher than on the output side. This temperature distribution is attributed primarily to the thermal influence of the eccentric bearing, located near the input shaft, which generates a considerable amount of heat during operation.
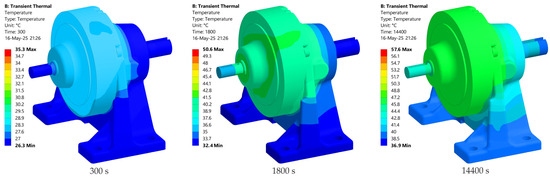
Figure 10.
Temperature field variation on the outer surface of the housing from the moment the reducer was put into operation until 14,400 s (240 min).
Figure 11 shows the temperatures at characteristic points obtained through numerical analysis (finite element method—FEM) and experimental measurements (EXP). The highest recorded relative error is 10.17%, occurring at point P03 at the instant of 14,400 s, while the lowest error of 0.75% was observed at point P04 at 300 s. Based on the comparison of the obtained results, it can be concluded that numerical simulations, with accurately defined boundary conditions, can provide preliminary predictions of the temperature field distributions on the housing of the cycloidal reducer.
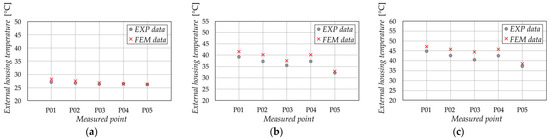
Figure 11.
Comparison of finite element method (FEM) and experimental (EXP) data: (a) 300 s, (b) 1800 s, (c) 14,400 s.
3.4. Distribution of the Temperature Fields on the Internal Elements
The distribution of temperature fields on the internal elements of the cycloidal reducer is shown in Figure 12. The highest temperature is observed in the region of the output rollers, while slightly lower values are recorded in the area of the eccentric bearing.
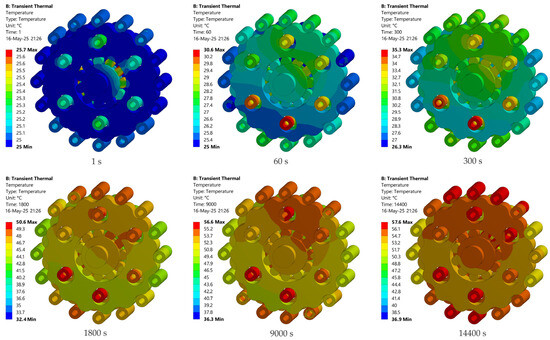
Figure 12.
Change of the temperature fields on the internal elements from the moment the reducer was put into operation until 14,400 s (240 min).
It is also noticed that the most intense temperature increase occurs during the first 1800 s of operation. The thermal stability, when the temperature fields do not change significantly over time, is established after approximately 9000 s.
It is important to emphasize that the temperature field distribution on the internal components of the cycloidal reducer could not be directly verified by experimental measurements. However, based on the confirmed distribution of temperature fields on the outer surface of the housing and the validated values of the contact forces, it is highly likely that the numerically obtained distribution of temperature fields on the internal elements is accurate and reflects the real operating conditions.
3.5. Influence of Thermal Stresses on the Contact Forces
The values of the contact forces between the teeth of the cycloidal disc and the corresponding ring gear rollers, with and without the influence of thermal stresses, are presented in Figure 13. As can be observed, the inclusion of effects of thermal stresses leads to an increase in the values of the normal contact forces by approximately 2–3%. A similar trend is observed for the output contact forces. In this case, taking the thermal stresses into account leads to an increase in contact forces by approximately 5–8%, which can be attributed to the significantly higher thermal sources in these contact zones.
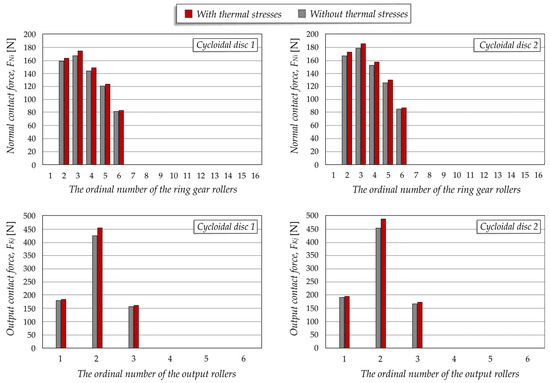
Figure 13.
Comparative presentation of the contact forces with and without the effects of thermal stresses.
3.6. Influence of Thermal Stresses on the Stress–Strain State
In order to derive conclusions regarding the influence of thermal stresses on the stress–strain state of the vital elements, a numerical structural analysis was performed both with and without the inclusion of the thermal state.
The stress–strain state of the cycloidal disc 1, caused by the contact forces resulting from the driving torque , is shown in Figure 14a. The stress–strain state of the cycloidal disc 1, as a result of the combined influence of these contact forces and the thermal stresses, is shown in Figure 14b.
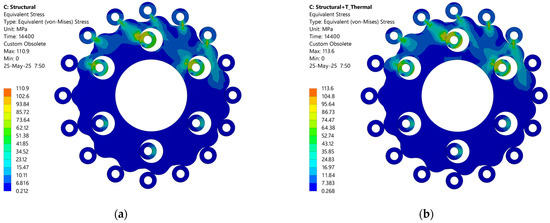
Figure 14.
Distribution of the von Mises stresses on the cycloidal disc 1: (a) without the effects of thermal stresses, (b) with the effects of thermal stresses.
The highest von Mises stress obtained in the analysis without the effects of thermal stresses is approximately 110.9 and it is found in the contacts between the output rollers and the holes in the cycloidal disc. Slightly lower von Mises stress values, ranging from 93.84 MPa to 102.6 MPa, are observed in the contacts between the ring gear rollers and the cycloidal disc teeth. This stress distribution reflects the values of the contact forces illustrated in Figure 8. It was also observed that the stresses on the rollers are higher compared to those on the cycloidal disc, which is attributed to the shape of the rollers and the direction of stress propagation.
The inclusion of thermal stresses leads to an average increase in the von Mises stress values of about 2.4%. It is important to note that the imported results from the transient thermal analysis correspond to the time instant of 14,400 s—the moment the cycloidal reducer reaches thermal stability.
The stress–strain state of the cycloidal disc 2, resulting from the driving torque , is shown in Figure 15a. The stress–strain state of the cycloidal disc 2 under the combined effects of the driving torque and thermal stresses is presented in Figure 15b. Due to the uneven load distribution between the cycloidal discs, the von Mises stresses in the contacts between disc 2 and the corresponding rollers are 4.8% higher compared to those in the contacts between the cycloidal disc 1 and the corresponding rollers. When thermal stresses are incorporated, the von Mises stress values further increase by 2.8%.
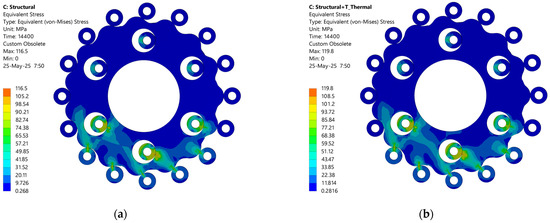
Figure 15.
Distribution of the von Mises stresses on the cycloidal disc 2: (a) without the effects of thermal stresses, (b) with the effects of thermal stresses.
For an easier interpretation of the results obtained in the structural analyses, the values of the maximum von Mises stresses and deformations are given in Table 8.
Table 8.
The obtained values of the von Mises stresses and deformations.
4. Conclusions
In this study, an innovative numerical–analytical methodology has been developed which, for the first time, enables the prediction of the distribution of temperature fields and the quantification of their influence on the contact forces and the stress–strain state of the corresponding elements. The developed methodology is of key importance for both the current and future development of cycloidal reducers, as it provides valuable practical guidelines for engineering applications and can be used in the design phase, thereby avoiding costly and time-consuming prototype testing. It is expected that its application will contribute to the optimization of geometric and operating parameters, the identification of critical thermal sources, the improvement of reliability, and the extension of the service life of this type of power transmission system. Moreover, the proposed methodology can be adapted for application within a broader context of mechanical engineering.
The main conclusions of this extensive and complex study are as follows:
- ▪
- Numerical simulations with accurately defined boundary conditions provide reliable predictions of the temperature field distribution.
- ▪
- An uneven load distribution is observed between the cycloidal discs and the corresponding rollers. In the studied case, the contact forces between the ring gear rollers and the teeth of cycloidal disc 2 are 5–6% higher compared to those between the ring gear rollers and the teeth of cycloidal disc 1. The same trend is observed in the contact forces between the output rollers and the holes in the cycloidal disc, with differences ranging from 6–7%.
- ▪
- Thermal stresses lead to an increase in the values of contact forces. In the studied case, the normal contact forces increase by 2–3% on average due to thermal stresses, while the output contact forces increase by an average of 5–8%.
- ▪
- Including thermal stresses in the analysis increases the von Mises stress values by an average of 2.4%.
- ▪
- The stresses on the rollers are higher compared to those on the cycloidal disc, which is attributed to the shape of the roller and the direction of stress propagation.
- ▪
- The von Mises stresses in the contacts between the cycloidal disc 2 and the corresponding rollers are 4.8% higher compared to those in the contacts between the cycloidal disc 1 and the corresponding rollers. This stress distribution is the result of the uneven load distribution between the cycloidal discs.
- ▪
- Infrared thermal (IRT) images show that the maximum temperature is located in the input shaft bearing region, with the temperature increasing and propagating towards the output shaft. This temperature distribution is primarily due to the close proximity of the eccentric bearing, which is one of the main heat sources in the cycloidal reducer.
In future research, further refinement of the presented methodology is planned by including power losses arising from the interaction of the lubricant with the cycloidal gear, as well as power losses resulting from the interaction of the lubricant with the eccentric bearing. In addition, it would be of interest to conduct experimental measurements of the temperature field distribution of the internal elements of the cycloidal reducer using a thermal imaging camera in combination with germanium glass. Furthermore, the present study considered only a single cycloidal reducer configuration, which limits the generalization of the conclusions. To address this, future research should incorporate a systematic exploration of key reducer parameters using a design of experiments (DoE) methodology, which would enable the acquisition of more detailed results and the formulation of more precise recommendations.
Author Contributions
Conceptualization, M.V. and M.B.; methodology, M.V., M.B., S.D. and S.T.; software, M.V., S.D. and S.T.; validation, M.V., M.B., S.D. and S.T.; investigation, M.V., M.B., S.D. and S.T.; writing—original draft preparation, M.V.; writing—review and editing, M.V. and M.B.; funding acquisition, M.B. and S.D. All authors have read and agreed to the published version of the manuscript.
Funding
This research received no external funding.
Institutional Review Board Statement
Not applicable.
Informed Consent Statement
Not applicable.
Data Availability Statement
The original contributions presented in the study are included in the article; further inquiries can be directed to the corresponding author.
Acknowledgments
The authors would like to express their sincere gratitude to Darkhan Myrzaliyev from the Faculty of Mechanical and Petroleum Engineering, Mukhtar Auezov South Kazakhstan University (Shymkent, Kazakhstan), for his support during certain stages of the development of this research work.
Conflicts of Interest
Authors Samir Dizdar and Smajo Tuka were employed by the Berdiz Consulting AB. The remaining authors declare that the research was conducted in the absence of any commercial or financial relationships that could be construed as a potential conflict of interest.
Abbreviations
The following abbreviations are used in this manuscript:
| BLDC | Brushless DC motor |
| DoE | Design of experiments |
| EXP | Experimental |
| FEM | Finite element method |
| IRT | Infrared thermal |
| Nomenclature | |
| Stiffness of the ring gear and output rollers | |
| Specific heat capacity at constant pressure of the ambient air | |
| Ring gear roller diameter | |
| Diameter of the ring gear roller pin | |
| Mean diameter of the bearing | |
| Outer diameter of the cylindrical wall | |
| Diameter of the shaft | |
| Output roller diameter | |
| Diameter of the output roller pin | |
| Eccentricity | |
| Factor dependent on the bearing type and the direction of the load | |
| Contact force between the rolling body of the eccentric bearing and the corresponding rolling raceway located on the line of action of the eccentric force | |
| Contact force between the i-th rolling body of the eccentric bearing and the corresponding rolling raceways | |
| Horizontal component of the eccentric force | |
| Vertical component of the eccentric force | |
| Contact force between the j-th output rollers and the holes in the cycloidal disc (output contact force) | |
| Contact force between the teeth of the cycloidal disc and the i-th ring gear roller (normal contact force) | |
| Horizontal component of the normal contact force | |
| Vertical component of the normal contact force | |
| Gravitational acceleration | |
| Grashof number for the cylindrical wall | |
| Grashof number for a flat vertical wall | |
| Height of the vertical wall | |
| Input speed | |
| Nusselt number | |
| Total power loss due to friction in the bearing elements (eccentric, input, and output shaft bearings) | |
| Total power loss due to interaction between the lubricant and the bearing elements | |
| Power loss due to friction between the i-th rolling body of the input shaft bearing and the corresponding rolling raceways | |
| Power loss due to friction between the i-th rolling body of the output shaft bearing and the corresponding rolling raceways | |
| Power loss due to friction between the i-th rolling body of the eccentric bearing and the corresponding rolling raceways | |
| Total power loss due to interaction between the lubricant and the cycloidal disc | |
| Total power loss due to friction between the ring gear rollers and the cycloidal disc teeth | |
| Power loss due to friction between the i-th ring gear roller and a cycloidal disc tooth | |
| Total power loss due to friction between the output rollers and the holes in the cycloidal disc | |
| Power loss due to friction between the j-th output roller and the holes in the cycloidal disc | |
| Total power loss due to friction between the ring gear rollers and the pins | |
| Power loss due to friction between the i-th ring gear roller and the pin | |
| Total power loss due to friction between the output rollers and the pins | |
| Power loss due to friction between the j-th output roller and the pin | |
| Total power loss due to friction in the radial shaft seals | |
| Prandtl number | |
| Radius of the pitch circle of the ring gear rollers | |
| Pitch circle diameter of output rollers | |
| Radius of the rolling circle | |
| Radius of the base (stationary) circle | |
| Reynolds number | |
| Distance between the line of contact of the j-th output roller and the central axis of the cycloidal disc | |
| Distance between the line of contact of the i-th ring gear roller and the central axis of the cycloidal disc | |
| Driving torque of one cycloidal disc | |
| Torque at the ring gear coming from one cycloidal disc | |
| Output torque also coming from one cycloidal disc | |
| Torque at the input shaft | |
| Torque at the output shaft | |
| Number of output rollers | |
| Transmission ratio | |
| Angle between normal force of i-th ring gear roller and vertical direction | |
| Number of cycloidal disc teeth | |
| Number of ring gear roller pairs closest to the direction of eccentricity that are excluded from the load transfer process | |
| Coefficient of heat transfer by natural convection from the external surface of the cylindrical housing wall to the ambient air | |
| Coefficient of heat transfer by natural convection from the external surface of the vertical housing wall to the ambient air | |
| Coefficient of heat transfer by radiation from the external surface of the housing to the ambient air | |
| Coefficients of heat transfer between the shafts and the ambient air | |
| Drive angle of the cycloidal disc | |
| Coefficient of volumetric expansion | |
| Equivalent thickness of the walls of the housing | |
| Small angular displacement of the cycloidal disc | |
| Emissivity coefficient of the housing surface | |
| Efficiency of the cycloidal reducer | |
| Ambient air temperature | |
| Lubricant temperature | |
| Thermal conductivity coefficient of the ambient air | |
| Dynamic viscosity of the ambient air | |
| Rolling friction coefficient between the ring gear rollers and the cycloidal disc teeth | |
| Rolling friction coefficient between the output rollers and the holes in the cycloidal disc | |
| Sliding friction coefficient between the ring gear rollers and their pins | |
| Sliding friction coefficient between the output rollers and their pins | |
| Kinematic viscosity of the ambient air | |
| Pitch angle of the ring gear roller | |
| Angular pitch of the rolling bodies of the eccentric bearing | |
| Plate inclination angle relative to the vertical plane | |
| Angle of the first output roller relative to the x-axis in the initial position | |
| Position angle of the j-th output roller relative to the x-axis in an arbitrary position | |
| Angle between the direction of action of the output contact force of the j-th output roller and the direction that connects the contact line with the central axis of the cycloidal disc | |
| Angle between the direction of action of the normal contact forces of the i-th ring gear roller and the direction that connects the line of contact and the central axis of the cycloidal disc | |
| Angular velocity of the ring gear rollers | |
| Angular velocity of the output rollers | |
| Angular velocity of the input shaft | |
| Angular velocity of the output shaft | |
| Angular velocity of the shaft |
References
- Kudryavtsev, V.N. Planetarnye Peredachi (Planetary Transmissions); Masinostroenie: Moscow–Leningrad, Russian, 1966. [Google Scholar]
- Lehmann, M. Calculation and Measurement of Forces Acting on Cycloidal Speed Reducer. Ph.D. Thesis, The Technical University of Munich, Munich, Germany, 1976. [Google Scholar]
- Li, X.; Li, C.; Wang, Y.; Chen, B. Analysis of a Cycloid Speed Reducer Considering Tooth Profile Modification and Clearance—Fit Output Mechanism. J. Mech. Des. 2017, 139, 033303. [Google Scholar] [CrossRef]
- Ren, Z.Y.; Mao, S.M.; Guo, W.C.; Guo, Z. Tooth Modification and Dynamic Performance of the Cycloidal Drive. Mech. Syst. Signal Process. 2017, 85, 857–866. [Google Scholar] [CrossRef]
- Xu, L.X. A Dynamic Model to Predict the Number of Pins to Transmit Load in a Cycloidal Reducer with Assembling Clearance. Proc. Inst. Mech. Eng. Part C J. Mech. Eng. Sci. 2019, 233, 4247–4269. [Google Scholar] [CrossRef]
- Artyomov, I.I.; Tcufistov, E.A.; Tchufistov, O.E. Analysis of Static Loading of Meshing in Planetary Cycloid Gear. IOP Conf. Ser. Mater. Sci. Eng. 2020, 734, 012056. [Google Scholar] [CrossRef]
- Bednarczyk, S. Determining Power Losses in the Cycloidal Gear Transmission Featuring Manufacturing Deviations. In Proceedings of the 14th International Scientific Conference: Computer Aided Engineering (CAE 2018), Wrocław, Poland, 20–23 June 2019. [Google Scholar]
- Bednarczyk, S.; Jankowski, L.; Krawczyk, J. The Influence of Eccentricity Changes on Power Losses in Cycloidal Gearing. Tribologia 2019, 3, 19–29. [Google Scholar] [CrossRef]
- Zhang, T.; Li, X.; Wang, Y.; Sun, L. A Semi-Analytical Load Distribution Model for Cycloid Drives with Tooth Profile and Longitudinal Modification. Appl. Sci. 2020, 10, 4859. [Google Scholar] [CrossRef]
- Jiang, N.; Wang, S.; Xie, X.; Yuan, X.; Yang, A.; Zhang, J. A Vectorial Modification Methodology Based on an Efficient and Accurate Cycloid Tooth Profile Model. Precis. Eng. 2022, 73, 435–456. [Google Scholar] [CrossRef]
- Tchufistov, E.A.; Tchufistov, O.E.; Blagojević, M.; Vasić, M. Simulation of motion in a cycloidal gear. Part I. Unloaded gear; Izvestiya vysshikh uchebnykh zavedeniy. Povolzhskiy region. Univ. Proc. Volga Reg. Tech. Sci. 2024, 72, 92–108. [Google Scholar]
- Tchufistov, E.A.; Tchufistov, O.E.; Blagojević, M.; Vasić, M. Simulation of motion in a cycloidal gear. Part II. Loaded gear; Izvestiya vysshikh uchebnykh zavedeniy. Povolzhskiy region. Univ. Proc. Volga Reg. Tech. Sci. 2025, 73, 92–105. [Google Scholar]
- Thube, S.V.; Bobak, T.R. Dynamic analysis of a cycloidal gearbox using finite element method. AGMA Tech. Pap. 2012, 1–13. [Google Scholar]
- Krol, R. Kinematics and Dynamics of two Stage Cycloidal Gearbox. AUTOBUSY–Tech. Eksploat. Syst. Transp. 2018, 220, 523–527. [Google Scholar] [CrossRef]
- Jang, D.J.; Kim, Y.C.; Hong, E.P.; Kim, G.S. Geometry Design and Dynamic Analysis of a Modified Cycloid Reducer with Epitrochoid Tooth Profile. Mech. Mach. Theory 2021, 164, 104399. [Google Scholar] [CrossRef]
- Zakharov, M.N.; Ermolaev, M.M.; Zaitseva, A.V. Nonuniform Load Distribution Between the Satellites of a Cycloid Gear. Russ. Eng. Res. 2020, 40, 720–725. [Google Scholar] [CrossRef]
- Mihailidis, A.; Athanasopoulos, E.; Okkas, E. Flash temperature in cycloid reducers. J. Balk. Tribol. Assoc. 2015, 21, 76–89. [Google Scholar]
- Zah, M.; Lates, D.; Csibi, V. Thermal calculation for planetary cycloidal gears with bolts. Acta Univ. Sapientiae-Electr. Mech. Eng. 2012, 4, 103–110. [Google Scholar]
- Hu, Y.; Li, G.; Zhu, W.; Cui, J. An Elastic Transmission Error Compensation Method for Rotary Vector Speed Reducers Based on Error Sensitivity Analysis. Appl. Sci. 2020, 10, 481. [Google Scholar] [CrossRef]
- Vasić, M.; Blagojević, M.; Banić, M.; Maccioni, L.; Concli, F. Theoretical and Experimental Investigation of the Thermal Stability of a Cycloid Speed Reducer. Lubricants 2025, 13, 70. [Google Scholar] [CrossRef]
- Blagojević, M.; Vasić, M.; Dizdar, S.; Tuka, S.; Josimović, M. The Influence of Thermal Stresses on the Load Distribution in Cycloidal Reducers. In Proceedings of the 3rd International Symposium on Industrial Engineering and Automation—ISIEA 2024, Bolzano, Italy, 19–21 June 2024. [Google Scholar]
- Pastukhov, A.; Timashov, E. Procedure for simulation of stable thermal conductivity of bearing assemblies. Adv. Eng. Lett. 2023, 2, 58–63. [Google Scholar] [CrossRef]
- Blagojević, M. Stress and Strain State of Cyclo Speed Reducers Elements Under Dynamic Loads. Ph.D. Thesis, Faculty of Engineering, University of Kragujevac, Kragujevac, Serbia, 2008. [Google Scholar]
- Miltenović, A.; Banić, M. Thermal analysis of a crossed helical gearbox using FEM. Trans. FAMENA 2020, 44, 67–78. [Google Scholar] [CrossRef]
- Linke, H.; Börner, J.; Hess, R. Cylindrical Gears: Calculation–Materials–Manufacturing; Carl Hanser Verlag GmbH & Company KG: Munich, Germany, 2016. [Google Scholar]
- Niemann, G.; Winter, H. Maschinenelemente, Band 3: Schraubrad-, Kegelrad-, Schnecken-, Ketten-, Riemen-, Reibradgetriebe, Kupplungen, Bremsen, Freiläufe, 2nd ed.; Springer: Berlin/Heidelberg, Germany, 1983. [Google Scholar]
- Schaeffler Technologies AG & Co. KG. Wälzlagerpraxis—Handbuch zur Gestaltung und Berechnung von Wälzlagerungen; Vereinigte Fachverlage GmbH: Mainz, Germany, 2015. [Google Scholar]
Disclaimer/Publisher’s Note: The statements, opinions and data contained in all publications are solely those of the individual author(s) and contributor(s) and not of MDPI and/or the editor(s). MDPI and/or the editor(s) disclaim responsibility for any injury to people or property resulting from any ideas, methods, instructions or products referred to in the content. |
© 2025 by the authors. Licensee MDPI, Basel, Switzerland. This article is an open access article distributed under the terms and conditions of the Creative Commons Attribution (CC BY) license (https://creativecommons.org/licenses/by/4.0/).