Abstract
Remaining useful life (RUL) prediction is critical for ensuring the reliability and safety of industrial equipment. In recent years, Transformer-based models have been widely employed in RUL prediction tasks for rolling bearings, owing to their superior capability in capturing global features. However, Transformers exhibit limitations in extracting local temporal features, making it challenging to fully model the degradation process. To address this issue, this paper proposes a parallel hybrid prediction approach based on Transformer and Long Short-Term Memory (LSTM) networks. The proposed method begins by applying Empirical Mode Decomposition (EMD) to the raw vibration signals of rolling bearings, decomposing them into a series of Intrinsic Mode Functions (IMFs), from which statistical features are extracted. These features are then normalized and used to construct the input dataset for the model. In the model architecture, the LSTM network is employed to capture local temporal dependencies, while the Transformer module is utilized to model long-range relationships for RUL prediction. The performance of the proposed method is evaluated using mean absolute error (MAE) and root mean square error (RMSE). Experimental validation is conducted on the PHM2012 dataset, along with generalization experiments on the XJTU-SY dataset. The results demonstrate that the proposed Transformer–LSTM approach achieves high prediction accuracy and strong generalization performance, outperforming conventional methods such as LSTM and GRU.
1. Introduction
With the continuous advancement of industrial technologies, rotating machinery has rapidly evolved toward larger scale, greater complexity, and enhanced intelligence. As a core component supporting the shaft, rolling bearings directly determine the operational reliability and safety of the entire system [,]. In practical service conditions, bearings frequently operate under high loads, elevated speeds, and corrosive environments, while also being subjected to the combined effects of severe vibration and shock, which accelerate their degradation [,]. Research indicates that approximately 30% of rotating-machinery failures originate from bearing damage [,]. Bearing faults not only lead to unplanned downtime and maintenance—thereby reducing production efficiency—but can also precipitate serious safety incidents, resulting in substantial economic and societal losses. Hence, developing scientifically rigorous models for remaining useful life (RUL) prediction of rolling bearings, coupled with real-time monitoring for dynamic condition assessment, holds both significant theoretical value and practical engineering importance [,].
Existing approaches to bearing RUL prediction can be broadly categorized into three classes: physics-based methods, statistical modeling techniques, and data-driven strategies []. Physics-based models depend on explicit degradation mechanisms, expert rules, and empirical knowledge, which limits their generality and applicability [,]. Statistical methods—while easy to implement and interpret—typically capture only the common degradation patterns among like systems, yielding narrow applicability []. In contrast, data-driven RUL prediction models have attracted considerable attention in recent years, driven by advances in sensor technology and the proliferation of industrial data. Deep learning, in particular, offers adaptive feature extraction and strong generalization capabilities, making it well-suited for modern machinery characterized by massive data volumes, complex structures, and numerous parameters [].
Shallow machine learning–based methods include statistical regression [], support vector machines [], and neural networks []. These methods are straightforward to implement and computationally efficient; however, they heavily rely on manual feature engineering and struggle to capture complex nonlinear degradation trends, limiting their generalization to diverse operating conditions.
To address this, researchers introduced convolutional neural networks (CNNs) to learn spatial representations directly from data. For instance, Sateesh et al. [] transformed vibration signals into images for CNN-based feature extraction, improving prediction accuracy; however, this approach mainly focuses on spatial textures and lacks direct modeling of temporal dependencies inherent in time series. Zhu et al. [] proposed a multi-scale CNN to capture both global and local spatial features, yet CNNs inherently struggle to model sequential patterns over time, which constrains their effectiveness for long-term degradation prediction.
To overcome temporal modeling limitations, recurrent neural networks (RNNs) and Long Short-Term Memory (LSTM) networks have been widely used. Wang et al. [] combined a convolutional autoencoder (CAE) with LSTM to enhance sequential modeling; however, standard unidirectional LSTM can only use past information, lacking awareness of future context, which may reduce accuracy under complex degradation patterns. Chang et al. [] optimized LSTM hyperparameters to improve performance, but hyperparameter tuning can be computationally intensive and dataset-specific. Dong et al. [] integrated multi-channel CNN features with bidirectional LSTM (Bi-LSTM) to capture richer temporal context, and Wang et al. [] employed separable convolutions with residual connections to deepen feature hierarchies. While these improvements strengthen temporal modeling, they increase model complexity and computational cost, which can hinder real-time applications.
More recently, the Transformer architecture [] has been adopted for its ability to capture global dependencies and enable parallel computation, leading to faster training. Zhou et al. [] applied Transformers to model long-range feature correlations, achieving accurate RUL predictions; however, Transformers typically require large training datasets to avoid overfitting and may underperform in extracting fine-grained local degradation details. To address this, Lu et al. [] combined multi-wavelet convolution with Transformers to balance local and global feature extraction, and Tang et al. [] designed a parallel structure integrating temporal convolution networks with Transformer modules, further improving stability. However, this design increases model complexity and parameter size, leading to higher computational cost and potential challenges for deployment in real-time industrial applications.
In summary, while these methods each offer advantages, they share concrete limitations: reliance on handcrafted or shallow feature extraction, difficulty balancing local transient features and global degradation trends, limited sensitivity to early fault evolution, and potential challenges in generalizing to noisy or highly variable real-world environments.
In addition to these deep learning architectures, Empirical Mode Decomposition (EMD) and its enhanced variants (e.g., EEMD, CEEMDAN) have been increasingly applied in recent years to extract multi-scale intrinsic mode functions (IMFs) from non-stationary vibration signals for bearing RUL prediction. For instance, Peng et al. [] employed EMD to derive robust RMS indicators for adaptive failure thresholding; Anil Kumar et al. [] utilized non-parametric EEMD to extract weak fault features under noisy conditions; and Zhang et al. [] integrated CEEMDAN with a hybrid CNN–LSTM framework to improve prediction accuracy. Ref. [] while these studies demonstrate the value of multi-scale feature extraction and deep learning architectures, there remains limited systematic exploration of how to effectively integrate EMD-derived multi-scale degradation features with hybrid parallel networks such as Bi-LSTM and Transformer. Such integration could jointly capture local transient behaviors and long-term global dependencies, further enhancing RUL prediction robustness and accuracy. In this study, standard EMD is chosen over its improved variants mainly because of its computational simplicity and lower parameter sensitivity, which makes it suitable for small-to-medium-scale or laboratory datasets. Although EEMD and CEEMDAN can better mitigate mode mixing, they often introduce additional noise, require complex parameter tuning, and substantially increase computational cost. Considering that this study uses publicly available laboratory datasets, where signal quality is relatively high and noise is limited, standard EMD is sufficient to extract accurate and interpretable multi-scale degradation features for subsequent prediction, while avoiding unnecessary computational overhead.
To overcome the challenges of capturing local dynamic features and modeling global dependencies in rolling-bearing RUL prediction—and to address the high dimensionality, noise interference, and feature modeling difficulties inherent in bearing vibration signals—this paper proposes an RUL prediction method based on EMD and a hybrid Transformer Bi-LSTM architecture. First, EMD adaptively decomposes the non-stationary vibration signal into a series of IMFs. Time-domain statistical indicators (e.g., kurtosis, energy, entropy) are then computed from each IMF to form representative, multi-scale degradation features. To reduce redundancy and enhance feature compactness, an autoencoder is employed for feature dimensionality reduction and reconstruction, extracting key sensitive features for subsequent prediction. The degraded features are first input to a Bi-LSTM network to model local temporal dependencies; the Bi-LSTM outputs are then fed into a Transformer module, which employs multi-head self-attention to capture global sequence relationships and reinforce perception of long-term degradation trends. During training, feature normalization is applied to improve adaptability across operating conditions, mean squared error (MSE) serves as the loss function, and the Adam optimizer updates model parameters. After training, the model is used to predict RUL on test data, and the prediction results are compared with true RUL values to evaluate accuracy and generalization.
- The overall framework of this study is illustrated in Figure 1. The main contributions are as follows: We propose an EMD-based decomposition and statistical-feature construction method that effectively captures multi-scale degradation information from non-stationary signals.
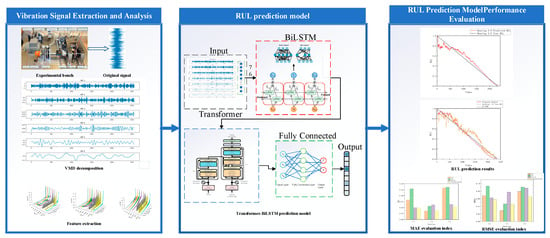 Figure 1. General framework of the thesis.
 - We develop a parallel modeling architecture combining Bi-LSTM and Transformer networks, which balances local dependency learning with global context modeling to enhance RUL prediction robustness.
- We conduct comprehensive experiments on the PHM2012 and XJTU-SY datasets. Results demonstrate that the proposed method outperforms several benchmark models in prediction accuracy, generalization capability, and stability.
2. Methods
2.1. LSTM Network
The Long Short-Term Memory (LSTM) network, originally proposed by Hochreiter et al., is a specialized form of recurrent neural network (RNN) designed to mitigate the problems of gradient vanishing and explosion, as well as to enable the learning of long-term dependencies that conventional RNNs cannot capture. The architecture of an LSTM memory cell is illustrated in Figure 2.
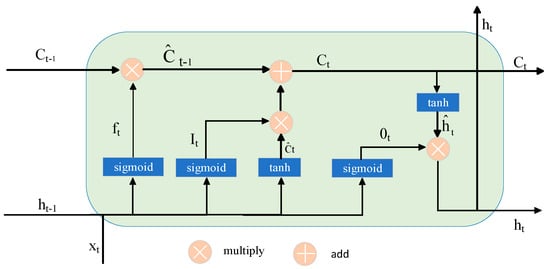
Figure 2.
LSTM Memory Cell Structure.
An LSTM employs three distinct gating mechanisms to retain long-term historical information and to mitigate the vanishing and exploding gradient problems.
- Forget Gate
The forget gate is responsible for selectively forgetting the historical information passed from the previous time step based on the current input at each time step, discarding unimportant information while retaining useful historical content. Its formulation is given by Equation (1).
In this context, represents the sigmoid activation function; denotes the weight matrix associated with the forget gate, is the corresponding bias term, while and refer to the hidden state from the previous time step and the input at the current time step, respectively.
- 2.
- Input Gate
The input gate is responsible for regulating the extent to which the current input influences the update of the memory cell. Specifically, it determines which new information should be incorporated into the cell state. The input gate consists of two components: a sigmoid layer that decides which values to update, and a tan layer that generates a candidate value vector. The corresponding mathematical formulation is given in Equations (2) and (3) [].
represents the output of the input gate, while denotes the candidate cell state. , and , correspond to the associated weight matrices and bias terms, respectively.
- 3.
- Output Gate
The output gate regulates the amount of information extracted from the memory cell to be used as the output at the current time step. It determines the final output value, which is influenced by both the current input and the previous cell state. The mathematical formulation of the output gate is given by Equations (4) and (5).
where denotes the input at time step t, represents the hidden state at time step t, and corresponds to the cell state at time step t, and are the weight matrix and bias term associated with the output gate, respectively.
The Bidirectional Long Short-Term Memory (Bi-LSTM) network is an architectural enhancement of the unidirectional LSTM. As illustrated in Figure 3, a Bi-LSTM consists of two hidden LSTM layers that share the same input but process information in opposite temporal directions. This specific structure enables Bi-LSTM to capture temporal dependencies by propagating information both forward and backward through the sequence. Unlike traditional LSTM, which can only access past information, Bi-LSTM integrates both past and future contextual information along the temporal axis, thereby providing a more comprehensive feature representation. This allows the network to better interpret sequential data and enhances its ability to extract meaningful temporal features for improved predictive performance.
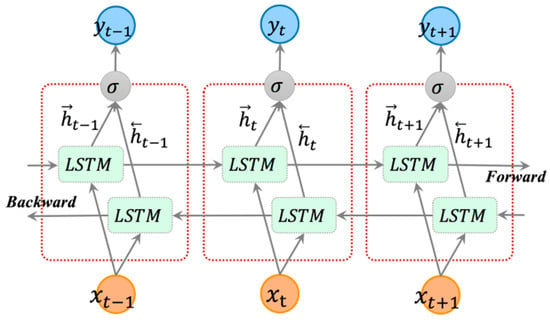
Figure 3.
Network Architecture of the Bi-LSTM.
2.2. Transformer Model
The Transformer model is a deep learning architecture based on the self-attention mechanism, first introduced by Vaswani et al. in 2017 []. It was primarily designed for natural language processing tasks such as machine translation and text generation. Unlike traditional recurrent neural networks (RNNs) and Long Short-Term Memory (LSTM) networks, the Transformer addresses the challenge of capturing long-term dependencies in sequential data through parallel computation and the self-attention mechanism. This significantly improves both training efficiency and model performance.
The multi-head attention mechanism, as depicted in Figure 4, builds upon the foundational self-attention mechanism to further augment the representational capacity of the model. Specifically, this mechanism involves projecting the input queries, keys, and values into multiple distinct subspaces, enabling parallel computation of attention weights across several attention heads. By doing so, the model is capable of capturing hierarchical information and diverse contextual dependencies within the input sequence, thereby facilitating a more comprehensive and nuanced representation of the data.
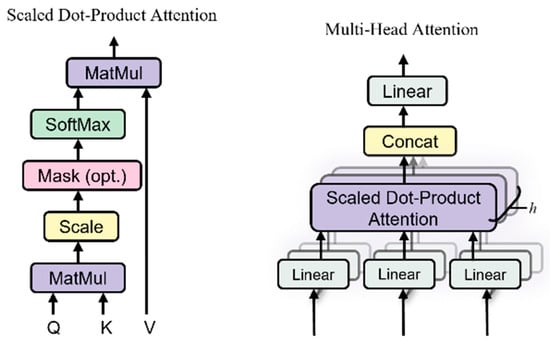
Figure 4.
Multi-Head Attention Mechanism.
The formula for computing attention in parallel is given by Equation (6) [].
In this equation, Q, K, V represent matrices composed of vectors obtained from the input data through different linear transformations. The function softmax is used as a normalization activation function, and dk denotes the dimensionality of the key vectors.
In the Transformer model, the attention mechanism enhances the model’s representational capacity by computing multiple attention heads in parallel. Specifically, the model divides the query (Q), key (K), and value (V) parameters into multiple subspaces, each of which is processed by an independent attention head. The outputs of all attention heads are then concatenated and passed through a linear transformation to produce a unified attention representation. This design improves the model’s ability to capture complex dependencies within the input sequence.
The basic architecture of the Transformer model is illustrated in Figure 5. Its core components include the “encoder” and “decoder”. The primary function of the encoder is to extract feature representations from the input sequence, while the decoder generates the target sequence based on the encoder’s output. A pivotal technique within the Transformer is the “self-attention mechanism”, which calculates the interdependencies among elements within a sequence by assigning different weights to each element. This mechanism enables the model to effectively capture both long-range and local dependencies. Furthermore, the “multi-head attention” mechanism significantly enhances the model’s representational capacity by concurrently extracting information from multiple subspaces, thereby improving the overall modeling performance.
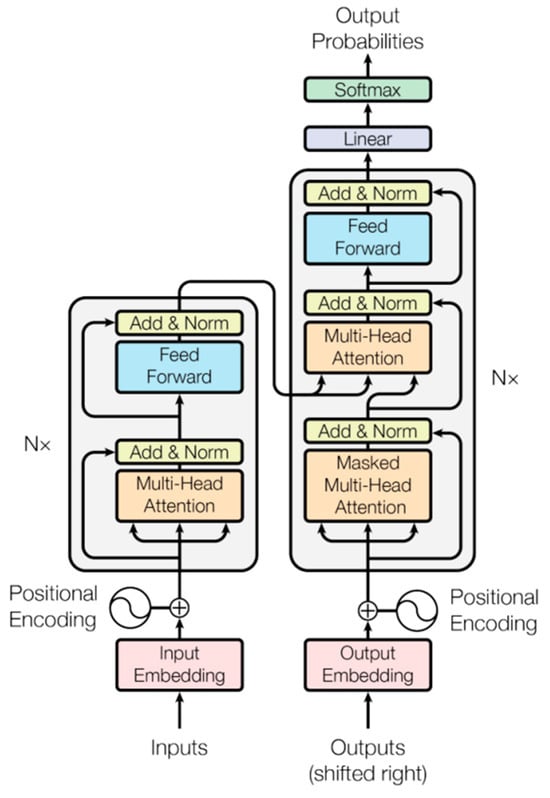
Figure 5.
Basic Architecture of the Transformer Model.
3. RUL Prediction Methods and Process
3.1. Multi-Domain Feature Fusion
The vibration signals of rolling bearings serve as an indicator of their operational condition and can be utilized to assess their health status. However, the raw vibration signals obtained directly from vibration sensors are typically high-dimensional time-series data that contain substantial noise and interference. Consequently, applying these signals directly to bearing condition assessment presents significant challenges. As a result, feature extraction techniques are commonly employed to extract representative low-dimensional features from the high-dimensional raw vibration signals, thereby facilitating a more accurate evaluation of the bearing’s health condition.
3.1.1. Empirical Mode Decomposition
Empirical Mode Decomposition (EMD) is an adaptive data processing technique introduced by Huang et al. in 1998 []. It is primarily employed in the analysis of non-stationary and nonlinear data. For complex raw signals, the inherent fluctuations exhibit nonlinear characteristics. EMD aims to decompose the raw signal into a series of intrinsic mode function (IMF) components, each representing different characteristic scales, along with a residual term. The mathematical formulation is provided in Equation (7):
- In the equation, A represents the raw signal, IMFm denotes the m-th Intrinsic Mode Function and Residual is the residual term. The EMD decomposition of a given data sequence is performed according to the following steps:
- Identify all the local extrema of the given data sequence and determine the mean envelope using Equation (8):
- 3.
- Calculate the difference between the original data and the mean envelope, denoted as p1(t):
- 4.
- If p1(t) satisfies the conditions for an IMF, then p1(t) is taken as the first IMF component q1(t); otherwise, treat p1(t) as the new original data and repeat the procedures defined in Equations (7) and (8) until the IMF conditions are satisfied.
- 5.
- Extract q1(t) from the original data x(t) to obtain the residual component u1(t):
- 6.
- Apply the above decomposition process repeatedly, following Equations (7)–(9), to obtain the second IMF component and residual. By continuing this procedure iteratively, the decomposition proceeds until the final residual component can no longer be decomposed. As a result, the original data can ultimately be expressed in the form of Equation (7).
3.1.2. Extraction of Statistical Features in the Time Domain
After performing Empirical Mode Decomposition on the raw signal, directly using the resulting intrinsic mode functions (IMFs) as features may lead to poor data representation. To overcome this, we further compute eleven time-domain statistics from the IMFs—namely mean, variance, root mean square (RMS), median, energy, peak value, kurtosis, linearity, entropy, arcsine-based feature, and arctangent-based feature. This multi-feature extraction not only enriches the information available for model training and analysis but also filters out redundant components and attenuates noise. We then employ an autoencoder to reduce the dimensionality of these eleven features, eliminating overlap and redundancy. The resulting sensitive feature set effectively captures the degradation progression of rolling bearings.
3.2. Bi-LSTM–Transformer Model
A Bi-LSTM–Transformer model is proposed, and its structural diagram is shown in Figure 6. In this model, the input data is first fed into the Bi-LSTM network, which consists of a forward LSTM and a backward LSTM model. Through the bidirectional structure, temporal dependencies within the input sequence are effectively extracted. Subsequently, the output from the Bi-LSTM is passed into the Transformer network for further processing. In the Transformer module, the data is first encoded through an input embedding layer, mapping it into a high-dimensional feature space. Then, the encoder and decoder modules model the global features of the sequence using a self-attention mechanism, capturing long-range dependencies between different positions within the sequence and emphasizing critical information in the input features. Finally, the features processed by the Transformer are mapped through a linear layer to produce the model’s prediction output.
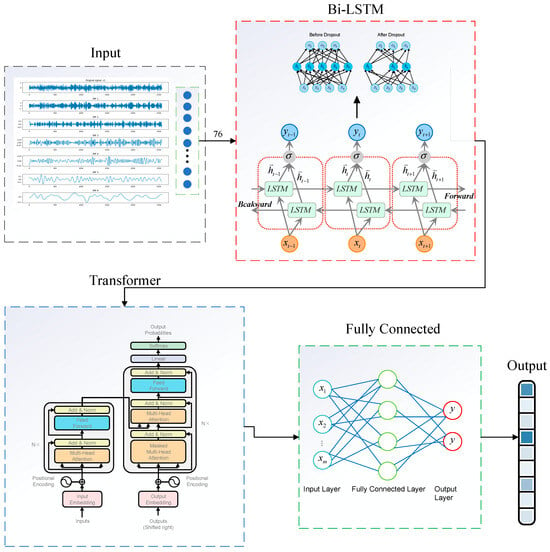
Figure 6.
Bi-LSTM Transformer Model.
By combining the strengths of Bi-LSTM and Transformer architectures, the model is capable of capturing the local dynamic relationships within the input sequence while simultaneously enhancing the modeling of global features. This dual capability significantly improves prediction performance on complex sequential data, thereby achieving superior results in RUL prediction.
The procedure for predicting the RUL of rolling bearings based on the proposed method is illustrated in Figure 7. First, the collected vibration signals are subjected to EMD to extract components of different frequency bands, and feature inputs are constructed by combining statistical feature extraction methods. Subsequently, the training dataset is normalized and fed into the Transformer–Bi-LSTM hybrid model for training. The model parameters are optimized iteratively by minimizing the loss function to improve prediction accuracy, and the optimized model is saved. For the testing dataset, the data are also normalized and then input into the pre-trained model for RUL prediction. Finally, the prediction results are smoothed and evaluated to validate the model’s performance and reliability.
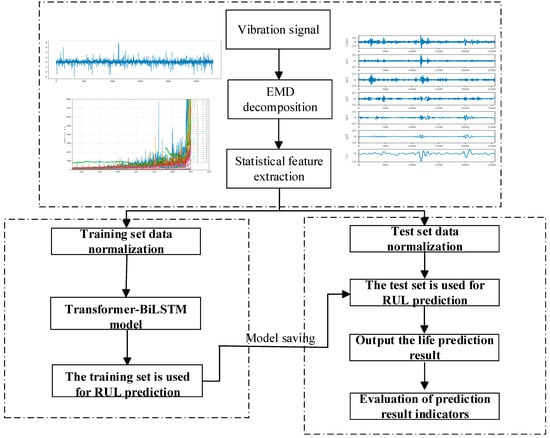
Figure 7.
Flow chart of the Remaining Useful Life Prediction Process for Rolling Bearings.
4. Application and Analysis
To validate the effectiveness of the proposed model, experiments were conducted using the PHM2012 bearing degradation dataset and the XJTU-SY bearing degradation dataset. The network model was developed in Python 3.8 using the PyTorch 2.4.1 framework with CUDA 11.8 support for GPU acceleration. Model training and testing were performed on a computer equipped with a 12th Gen Intel® Core™ i7-12700H @ 2.30 GHz processor, an NVIDIA GeForce RTX 4050 Laptop GPU, and 16 GB of RAM. All experiments were conducted under the same hardware and software environment to ensure consistency and reliability of the results.
4.1. Description of Experimental Data
In this study, two publicly available bearing degradation datasets, namely PHM2012 and XJTU-SY, were utilized to evaluate the performance of the proposed model. A detailed description of each dataset is provided below.
4.1.1. PHM2012 Degradation Dataset
The PHM2012 [] rolling bearing accelerated life test dataset was utilized in this study. This dataset was collected using the PRONOSTIA platform developed by the FEMTO-ST Institute in France. As illustrated in Figure 8, the experimental setup consists of an asynchronous motor, a rotating shaft, a speed controller, two pulley systems, and the test bearings. The horizontal and vertical vibration signals of the bearings were continuously monitored by accelerometers mounted on the bearing housing. Signal acquisition was performed every 10 s at a sampling frequency of 25.6 kHz, with each sampling session lasting 0.1 s.
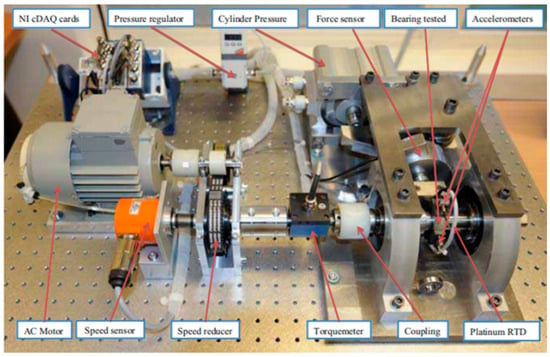
Figure 8.
Structural Diagram of the PRONOSTIA Experimental Platform.
In the PHM2012 dataset, a total of 17 full-lifecycle bearing datasets were collected under three different operating conditions, as summarized in Table 1. Specifically, Operating Condition 1 includes seven datasets, from Bearing 1_1 to Bearing 1_7; Operating Condition 2 also includes seven datasets, from Bearing 2_1 to Bearing 2_7; and Operating Condition 3 comprises three datasets, from Bearing 3_1 to Bearing 3_3. Detailed information regarding the 17 bearing datasets is provided in Table 2.

Table 1.
Extracted Statistical Time-Domain Features.

Table 2.
Dataset Division of PHM 2012.
The PHM2012 dataset contains vibration signals in both horizontal and vertical directions. However, the horizontal signals are more effective in accurately and rapidly reflecting the degradation of the bearings. Therefore, only the horizontal vibration signals are utilized for bearing life prediction in this study.
4.1.2. XJTU-SY Degradation Dataset
The XJTU-SY [] bearing dataset was used in the experiments, and the test platform is shown in Figure 9. The test bearings were LDK UER204 rolling bearings. The accelerated degradation experiments conducted in this study involved three types of faults: outer race faults, inner race faults, and cage faults. A schematic diagram comparing normal and faulty bearings is presented in Figure 10.
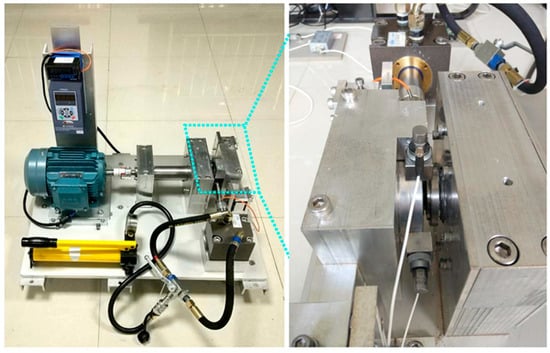
Figure 9.
Accelerated Life Test Rig for Bearing Experiments.

Figure 10.
Bearing State Schematic of the XJTU-SY Experiment.
The bearing accelerated degradation tests were performed under three different operating conditions, as summarized in Table 3. For Operating Condition 1, the rotational speed was 2100 r/min with a radial load of 12 kN; for Operating Condition 2, the speed was 2250 r/min with a radial load of 11 kN; and for Operating Condition 3, the speed was 2400 r/min with a radial load of 10 kN.

Table 3.
Dataset partitioning for the XJTU-SY bearing experiments.
In each case, five bearings were tested. The sampling frequency was set to 25.6 kHz, the sampling interval was 1 min, and the sampling duration was 1.28 s.
4.2. Data Preprocessing
In order to enhance the quality of feature extraction and mitigate the adverse effects of outliers present in the collected bearing signals, the Empirical Mode Decomposition technique is introduced. By decomposing the original vibration signals into a set of intrinsic mode functions (IMFs), EMD enables the isolation of meaningful information at various frequency scales, which is crucial for capturing localized anomalies associated with bearing faults.
For illustrative purposes, the EMD results for the Bearing 1_1 signal from the PHM2012 dataset are presented in Figure 11.
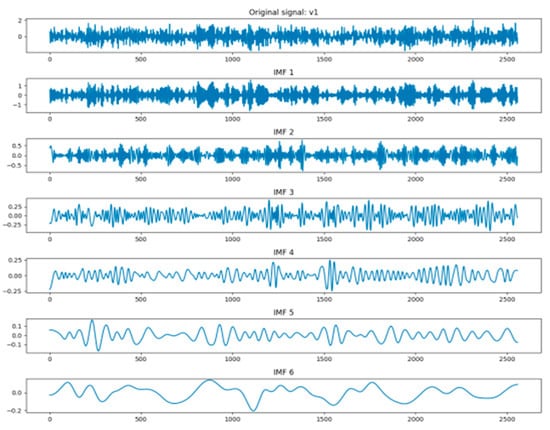
Figure 11.
Signal Decomposition Using EMD.
After performing EMD decomposition, eleven time-domain statistical features, as previously described, are extracted from each obtained IMF component. The extracted features are then normalized using min–max normalization, as shown in Equation (11).
In the normalization formula, xmax and xmin represent the maximum and minimum values of the signal, respectively, while xi denotes a specific data point. It should be noted that extreme values (outliers) in the signal may strongly affect the values of xmax and xmin, potentially leading to biased normalization results. To address this issue, common approaches include applying smoothing filters, removing obvious outliers prior to normalization, or using the 95th and 5th percentiles instead of the absolute maximum and minimum to achieve robust normalization.
As an example, the IMF components of Bearing 1_1 from the PHM dataset are decomposed, and the feature degradation time series of the IMF0, IMF2, and IMF4 components are shown in the figure. Since the original vibration signals inherently contain both positive and negative values, the statistical features, such as mean and median, will naturally exhibit negative values. Negative feature values can affect the visualization; therefore, they are not presented in the figure.
The feature degradation plots, as shown in Figure 12, demonstrate that the extracted time-domain features effectively characterize the degradation behavior of the bearing. The key features exhibit distinct and consistent trends as degradation progresses, indicating their high sensitivity and strong discriminative ability in capturing the evolution of bearing faults. Specifically, the original vibration signals are decomposed by EMD into six components: IMF0, IMF1, IMF2, IMF3, IMF4, and the residual. Each IMF captures characteristic information from a different frequency band: IMF0 and IMF1 correspond to high- and medium–high-frequency components sensitive to early-stage subtle impact features; IMF2 and IMF3 contain medium–low-frequency information reflecting mid-stage degradation and operational stability; and IMF4 together with the residual represent low-frequency trends describing the long-term degradation process. By extracting time-domain statistical features from these IMFs, the model comprehensively represents multi-scale characteristics of the bearing’s degradation, enhancing sensitivity to both local transients and global trends. These results provide an intuitive and robust feature foundation for subsequent network-based RUL prediction.


Figure 12.
Time Series Plot of Feature Degradation.
4.3. Experimental Analysis
4.3.1. Prediction Experiments on the PHM Dataset
In our experiments, the hyperparameters of the multi-head attention mechanism were set to three layers and four attention heads. When using fewer layers or heads, the model could not sufficiently capture the complex features in the data, leading to noticeably reduced prediction accuracy, although the training time was slightly shorter. Conversely, increasing the number of layers and heads beyond three and four did not further improve the prediction performance; instead, it significantly increased training time and introduced overfitting. Therefore, by balancing model expressiveness, training efficiency, and generalization capability, we finally set the number of attention layers to three and the number of attention heads to four.
The hyperparameter settings of the experimental network are listed in Table 4. Based on the hyperparameter settings listed in Table 4, the model was trained accordingly. The experiments were conducted using the dataset partitioning detailed in Table 3. The training loss curves are shown in Figure 13. Specifically, for Operating Condition 1, the training loss decreased from 0.12674 to 0.00144; for Operating Condition 2, it decreased from 0.09881 to 0.00127; and for Operating Condition 3, it decreased from 0.2553 to 0.00113. Overall, the final average training loss stabilized around 0.00128, indicating that the proposed Transformer–Bi-LSTM model achieved low prediction error and was able to effectively fit the training data.

Table 4.
Experimental Network Hyperparameters.

Figure 13.
Training Loss Curve of the Model. (a) Training Loss Curve under Operating Condition. (b) Training Loss Curve under Operating Condition 2. (c) Training Loss Curve under Operating Condition 3.
To verify that the model trained on the training dataset can be effectively applied to the testing dataset, we divided the dataset as shown in Table 5. The feature extraction layers and parameters of the Bi-LSTM–Transformer model were frozen in each of the three experiments, preserving the model’s feature extraction capability. The top layers of the model were then retrained. This approach aims to validate the transferability and generalization ability of the learned feature representations. After 100 additional training epochs on the testing dataset, the results are shown in Figure 14. The experimental prediction results demonstrate that the proposed Transformer–Bi-LSTM model can accurately capture the degradation trends of bearings. The predicted RUL curves exhibit a strong consistency with the ground truth, thereby validating the effectiveness and reliability of the proposed approach.

Table 5.
Data Partitioning of the PHM Experimental Dataset.
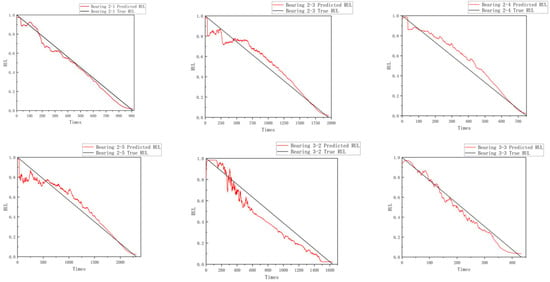
Figure 14.
Prediction Results on the PHM Test Dataset.
4.3.2. Comparative Experiments
In this chapter, the data under operating PHM Condition 1 is utilized for prediction, and the prediction accuracy of the proposed model is compared with that of several baseline networks, including RNN, GRU, LSTM, and Bi-LSTM.
To evaluate the prediction performance, the root mean square error (RMSE) and mean absolute error (MAE) between the predicted RUL and the actual RUL are adopted as the evaluation metrics. Lower values of these indicators indicate higher prediction accuracy. The calculation formulas are given in Equations (12) and (13).
To illustrate the advantage of adopting a bidirectional Long Short-Term Memory (Bi-LSTM) architecture over a one-way LSTM, we conducted a comparative experiment on the PHM1-1 bearing. In this experiment, the combined time-domain features extracted from all IMFs components of Bearing 1_1 were used as input. As shown in Table 6 and Figure 15, the Bi-LSTM achieved lower prediction errors compared to the one-way LSTM. This confirms the effectiveness of the bidirectional approach in capturing temporal dependencies within degradation signals, whereas a one-way LSTM is less capable of fully modeling complex sequential patterns.

Table 6.
Prediction metrics of LSTM and Bi-LSTM on Bearing 1_1.
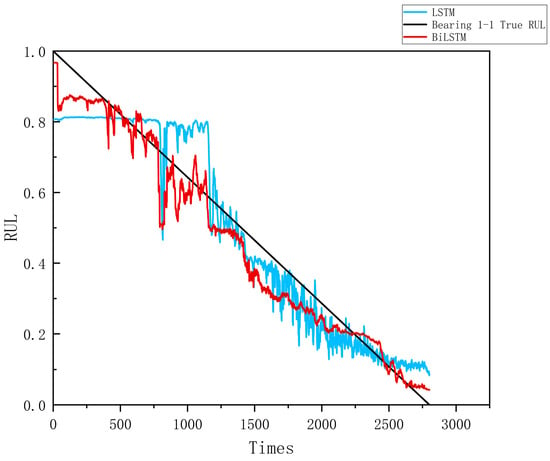
Figure 15.
Comparison of prediction performance between LSTM and Bi-LSTM on Bearing 1_1.
In the experiments, Bearing 1_2 and Bearing 1_4 were used as the training set, while Bearing 1_1, Bearing 1_3, and Bearing 1_5 were used for testing. The prediction results are presented in Table 7 and Figure 16. The experimental results demonstrate that the proposed Bi-LSTM–Transformer model outperforms other models in terms of both MAE and RMSE across all test sets, achieving an average MAE of 0.0469 and RMSE of 0.0563. These results indicate that the model offers superior accuracy and stability in predicting the remaining useful life (RUL) of rolling bearings. To further illustrate the prediction performance, Figure 17 compares the proposed model with the conventional Bi-LSTM model. As shown in the figure, the Bi-LSTM–Transformer model exhibits more stable and accurate predictions than the traditional Bi-LSTM approach.

Table 7.
Performance Evaluation Metrics of Different Models.
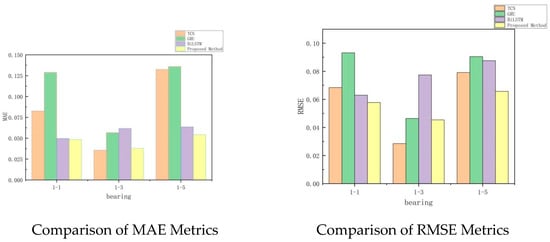
Figure 16.
Comparison of Evaluation Metrics for Different Models.

Figure 17.
Comparison of RUL Prediction Results Between the Proposed Method and Bi-LSTM.
4.3.3. Generalization Experiment on the XJTU-SY Dataset
In this study, the experimental data were partitioned based on the operating conditions of the XJTU-SY dataset, as detailed in Table 8. For Condition 1, Bearing 1_2 and Bearing 1_5 were selected as the training set, while Bearing 1_1, Bearing 1_3, and Bearing 1_4 were used as the validation set. Under Condition 2, the training set consisted of Bearing 2_2 and Bearing 2_5, with Bearing 2_1, Bearing 2_3, and Bearing 2_4 forming the validation set. For Condition 3, Bearing 3_4 and Bearing 3_5 were used for training, and Bearing 3_1, Bearing 3_2, and Bearing 3_3 served as the validation set. All experiments were conducted on the same hardware platform, and the hyperparameter settings used are summarized in Table 2. The experimental results are presented in Figure 18. The prediction results indicate that the proposed model also achieves promising performance on the XJTU dataset. The MAE and RMSE values of the experiment are summarized in Table 9 below. The results show that the model maintains low error levels in both mean absolute error (MAE) and root mean square error (RMSE), demonstrating its excellent predictive capability on this dataset. This suggests that the model not only achieves high prediction accuracy on the original dataset but also generalizes well to industrial data with different sources and characteristics, effectively capturing the degradation trend of bearings with strong robustness.

Table 8.
Data Partitioning of the XJTU-SY experimental Dataset.
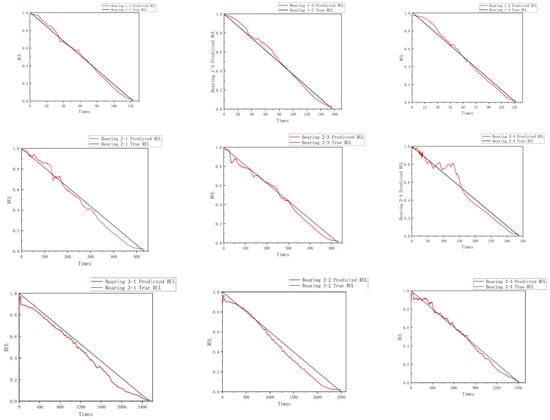
Figure 18.
RUL Prediction Results of Bearings from the XJTU-SY Dataset.

Table 9.
Evaluation Metrics of Experimental Results on the XJTU-SY Dataset.
To further evaluate the effectiveness and robustness of the proposed Transformer–Bi-LSTM model on the XJTU-SY dataset, additional comparative experiments were performed under Operating Condition 2. In particular, the prediction performance of the proposed approach was benchmarked against several baseline models, including TCN, GRU, and Bi-LSTM. This comparative analysis aims to demonstrate the advantages of the proposed method in accurately capturing degradation trends and improving RUL prediction accuracy.
Table 10 and Figure 19 and Figure 20 report the comparative prediction results of the proposed method against TCN, GRU, and Bi-LSTM under Operating Condition 2 of the XJTU-SY dataset. It can be observed that the proposed method consistently achieves lower MAE and RMSE values across all test bearings, thereby demonstrating enhanced predictive accuracy and robustness.

Table 10.
Comparison of evaluation metrics for different models on the XJTU-SY dataset.

Figure 19.
Comparison of model prediction results on the XJTU-SY dataset.
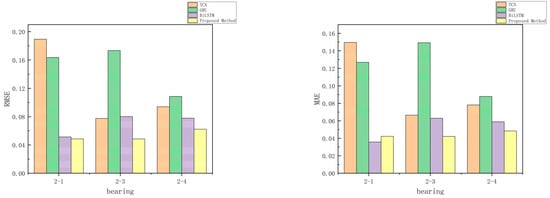
Figure 20.
Comparative evaluation metrics of different models on the XJTU-SY dataset.
Specifically, the proposed method attains an MAE of 0.0423 and RMSE of 0.0486 for Bearing 2-1; an MAE of 0.0422 and RMSE of 0.0485 for Bearing 2-3; and an MAE of 0.0484 and RMSE of 0.0623 for Bearing 2-4. In all cases, both metrics are markedly lower than those obtained by the other models.
Overall, the proposed method achieves an average MAE of 0.0443 and an average RMSE of 0.0531 across the test bearings, outperforming the baseline models and confirming its superior capability in accurately modeling degradation patterns and predicting the remaining useful life of rolling bearings.
5. Conclusions
This paper proposes a remaining useful life prediction method for rolling bearings based on Empirical Mode Decomposition and a Transformer–Bi-LSTM hybrid network.
(1) The method integrates Bi-LSTM and Transformer architectures and directly feeds vibration signals—preprocessed through EMD-based statistical time-domain feature extraction and min–max normalization—into the model.
(2) By applying EMD and extracting time-domain features, the method effectively reduces the dimensionality of complex high-dimensional signals and suppresses noise interference. The Bi-LSTM network captures local temporal patterns, while the Transformer models global dependencies. Their combination significantly improves prediction accuracy and stability.
(3) The proposed model is validated on both the PHM2012 and XJTU-SY bearing datasets. Under variable load conditions, the model achieves an average MAE of 0.0469 and RMSE of 0.0563 on the PHM2012 dataset. On the XJTU-SY dataset, it attains an average MAE of 0.0374 and RMSE of 0.0442, demonstrating excellent accuracy and generalization capability.
(4) In future work, the model will be further validated and evaluated using real-world industrial vibration data to assess its practical applicability and enhance robustness under noisy or variable operating conditions.
6. Discussion
While the proposed method shows promising results on publicly available laboratory datasets, it also exhibits several limitations. First, this study uses standard Empirical Mode Decomposition (EMD) to extract multi-scale features. Although EMD is computationally efficient and suitable for relatively clean signals, it can suffer from mode mixing when processing complex or noisy vibration data, potentially affecting feature stability. Advanced methods, such as EEMD and CEEMDAN, can alleviate mode mixing but require careful parameter tuning and introduce higher computational cost.
Empirical wavelet transform (EWT) has recently been demonstrated to effectively mitigate mode mixing and preserve signal morphology in noisy environments []. We performed preliminary tests on the same vibration signal segments and observed that EMD processing took approximately 5 s per segment, whereas EWT required about 35 s, resulting in a significant increase in computational time. Due to the significantly higher computational complexity of EWT compared to EMD, fully adopting EWT-based preprocessing methods would substantially increase the computational cost of model training and result generation. Considering the computational resources and time constraints of this study, this approach was not implemented in the current work and will be further explored in future research.
Additionally, detailed analysis reveals that the model tends to show higher prediction errors during the early stages of degradation, when signal changes are subtle, and near rapid degradation phases or sudden failures, where the degradation pattern shifts abruptly. We believe these discrepancies arise because time-domain statistical features may be less sensitive to early weak degradation signals, and the hybrid Transformer–Bi-LSTM architecture may struggle to adapt quickly to sharp transitions.
In future work, we plan to explore and compare improved decomposition techniques, design features or attention mechanisms that better capture early and sudden degradation trends, and validate the model on more complex, real-world datasets to enhance robustness and generalization.
Author Contributions
Conceptualization, B.L. and X.Y.; Methodology, C.J.; Software, Y.Y.; Validation, C.J. and B.L.; Formal analysis, B.L.; Resources, Y.Y. and L.Q.; Data curation, B.L. and X.Y.; Writing—original draft, C.J., B.L., Y.Y., X.Y. and X.C.; Writing—review & editing, B.L.; Supervision, R.T.; Project administration, C.J. and Rang Tu; Funding acquisition, C.J. All authors have read and agreed to the published version of the manuscript.
Funding
This research was funded by the National Key Research and Development Program of China, project “Modular Integrated Building Intelligent Construction Key Technologies and Application Demonstration,” grant number 2023YFC3806600.
Institutional Review Board Statement
Not applicable.
Informed Consent Statement
Not applicable.
Data Availability Statement
The original contributions presented in this study are included in the article. Further inquiries can be directed to the corresponding author.
Conflicts of Interest
Author Yanli Yang was employed by the company Hebei XuanGong Machinery Development Co., Ltd. The remaining authors declare that the research was conducted in the absence of any commercial or financial relationships that could be construed as a potential conflict of interest.
References
- Khan, S.; Yairi, T. A review on the application of deep learning in system health management. Mech. Syst. Signal Process. 2018, 107, 241–265. [Google Scholar] [CrossRef]
- Xu, J.P.; Wang, Y.S.; Xu, L. PHM-oriented integrated fusion prognostics for aircraft engines based on sensor data. IEEE Sens. J. 2014, 14, 1124–1132. [Google Scholar] [CrossRef]
- Lei, L.Y.; Li, X.; Wen, J.; Miao, J.H.; Wang, H.; Chen, H. Data amplification for bearing remaining useful life prediction based on generative adversarial network. Wirel. Commun. Mob. Comput. 2022, 4, 4628462. [Google Scholar] [CrossRef]
- Li, Q.C.; Ding, X.X.; He, Q.B.; Huang, W.B.; Shao, Y.M. Manifold sensing-based convolution sparse self-learning for defective bearing morphological feature extraction. IEEE Trans. Ind. Inform. 2021, 17, 3069–3078. [Google Scholar] [CrossRef]
- Lu, X.C.; Xu, W.Y.; Jiang, Q.S.; Shen, Y.H.; Xu, F.Y.; Zhu, Q.X. Category-aware dual adversarial domain adaptation model for rolling bearings fault diagnosis under variable conditions. Meas. Sci. Technol. 2023, 34, 095104. [Google Scholar] [CrossRef]
- Yang, G. Practical Techniques for Fault Diagnosis of Rolling Bearings; China Petrochemical Press: Beijing, China, 2012; pp. 20–39. [Google Scholar]
- Islam, M.M.; Kim, J.-M. Reliable multiple combined fault diagnosis of bearings using heterogeneous feature models and multiclass support vector machines. Reliab. Eng. Syst. Saf. 2019, 184, 55–66. [Google Scholar] [CrossRef]
- Zhang, Y.; Zhang, M.; Wang, Y.; Xie, L. Fatigue life analysis of ball bearings and a shaft system considering the combined bearing preload and angular misalignment. Appl. Sci. 2020, 10, 2750. [Google Scholar] [CrossRef]
- Wang, C.; Jiang, W.; Yang, X.; Zhang, S. RUL Prediction of Rolling Bearings Based on a DCAE and CNN. Appl. Sci. 2021, 11, 11516. [Google Scholar] [CrossRef]
- Lei, Y.; Li, N.; Gontarz, S.; Lin, J.; Radkowski, S.; Dybala, J. A Model-Based Method for Remaining Useful Life Prediction of Machinery. IEEE Trans. Reliab. 2016, 65, 1314–1326. [Google Scholar] [CrossRef]
- Yu, G.; Li, C.; Zhang, J. A New Statistical Modeling and Detection Method for Rolling Element Bearing Faults Based on Alpha–Stable Distribution. Mech. Syst. Signal Process. 2013, 41, 155–175. [Google Scholar] [CrossRef]
- Wu, Q.; Zhang, C.S. Cascade fusion convolutional long-short time memory network for remaining useful life prediction of rolling bearing. IEEE Access 2022, 8, 32957–32965. [Google Scholar] [CrossRef]
- Zong, M.; Shufan, M.; Wei, C. A remaining useful life prediction method of rolling bearings by RSA-BAF combined with Copula Entropy feature selection. Expert Syst. Appl. 2025, 275, 127100. [Google Scholar]
- Yiran, R.; Jianhua, L.; Mejed, J.; Baili, Z. An AC Contactor Remaining Useful Life Prediction Method based on Degradation Event Analysis. In Proceedings of the 2023 6th International Symposium on Autonomous Systems (ISAS), Nanjing, China, 23–25 June 2023. [Google Scholar]
- Yan, M.; Wang, X.; Wang, B.; Chang, M.; Muhammad, I. Bearing remaining useful life prediction using support vector machine and hybrid degradation tracking model. ISA Trans. 2020, 98, 471–482. [Google Scholar] [CrossRef] [PubMed]
- Liu, R.; Yang, B.; Hauptmann, A.G. Simultaneous bearing fault recognition and remaining useful life prediction using joint-loss convolutional neural network. IEEE Trans. Ind. Inform. 2019, 16, 87–96. [Google Scholar] [CrossRef]
- Ding, H.; Yang, L.; Cheng, Z.; Yang, Z. A remaining useful life prediction method for bearing based on deep neural networks. Measurement 2021, 172, 108878. [Google Scholar] [CrossRef]
- Zhu, N.; Chen, N.; Pene, W. Estimation of bearing remaining useful life based on multiscale convolutional neural network. IEEE Trans. Ind. Electron. 2018, 66, 3208–3216. [Google Scholar] [CrossRef]
- Wang, H.; Peng, M.; Miao, Z.; Liu, Y.K.; Ayodeji, A.; Hao, C. Remaining useful life prediction techniques for electric valves based on convolution auto encoder and long ort term memory. ISA Trans. 2021, 108, 333–342. [Google Scholar] [CrossRef]
- Chang, Z.; Yuan, W.; Huang, K. Remaining useful life prediction for rolling bearings using multi-layer grid search and LSTM. Comput. Electr. Eng. 2022, 101, 108083. [Google Scholar] [CrossRef]
- Dong, S.; Xiao, J.; Hu, X.; Fang, N.; Liu, L.; Yao, J. Deep transfer learning based on Bi-LSTM and attention for remaining useful life prediction of rolling bearing. Reliab. Eng. Syst. Saf. 2023, 230, 108914. [Google Scholar] [CrossRef]
- Wang, B.; Lei, Y.; Li, N.; Yan, T. Deep separable convolutional network for remaining useful life prediction of machinery. Mech. Syst. Signal Process. 2019, 134, 106330. [Google Scholar] [CrossRef]
- Devlin, J.; Chang, M.W.; Lee, K.; Toutanova, K. Bert: Pre-training of deep bidirectional transformers for language understanding. In Proceedings of the 2019 Conference of the North American Chapter of the Association for Computational Linguistics: Human Language Technologies, Minneapolis, MN, USA, 2–7 June 2019; p. 2. [Google Scholar]
- Zhetao, Z.; Lu, L.; Xiao, S.; Kai, C. Remaining useful life prediction method of rolling bearing based on transformer model. J. Beijing Univ. Aeronaut. Astronaut. 2023, 49, 430–443. [Google Scholar]
- Lu, Y.; Cheng, S.; Zhu, D.; Zhao, D.; Gao, Q. Remaining Useful Life Prediction of Rolling Bearings Based on Multi-wavelet-time Convolution Transformer. Meas. Sci. Technol. 2025, in press. [Google Scholar] [CrossRef]
- Tang, Y.; Liu, R.; Li, C.; Lei, N. Remaining useful life prediction of rolling bearings based on time convolutional network and Transformer in parallel. Meas. Sci. Technol. 2024, 35, 126102. [Google Scholar] [CrossRef]
- Tajiani, B.; Vatn, J. Adaptive remaining useful life prediction framework with stochastic failure threshold for experimental bearings under contaminated conditions. Int. J. Syst. Assur. Eng. Manag. 2023, 14, 1756–1777. [Google Scholar] [CrossRef]
- Kumar, A.; Berrouche, Y.; Zimroz, R.; Vashishtha, G.; Chauhan, S.; Gandhi, C.P.; Tang, H.; Xiang, J. Non-parametric ensemble empirical mode decomposition for extracting weak features to identify bearing defects. arXiv 2023, arXiv:2309.06003. [Google Scholar] [CrossRef]
- Zhang, Y.; Zhang, J.; Xu, H.; Xie, H.; Ding, H. Residual Life Prediction of Rolling Bearings Based on a CEEMDAN Algorithm Fused with CNN–Attention-Based Bidirectional LSTM Modeling. Processes 2024, 12, 8. [Google Scholar] [CrossRef]
- Nectoux, P.; Gouriveau, R.; Medjaher, K.; Ramasso, E.; Chebel-Morello, B.; Zerhouni, N.; Varnier, C. Pronostia: An experimental platform for bearings accelerated degradation tests. In Proceedings of the IEEE International Conference on Prognostics and Health Management, PHM’12, Denver, CO, USA, 18–21 June 2012; pp. 1–8. [Google Scholar]
- Yao, X.J.; Zhu, J.J.; Jiang, Q.S.; Yao, Q.; Shen, Y.H.; Zhu, Q.X. RUL prediction method for rolling bearing using convolutional denoising autoencoder and bidirectional LSTM. Meas. Sci. Technol. 2023, 35, 015302. [Google Scholar] [CrossRef]
- Vaswani, A.; Shazeer, N.; Parmar, N.; Uszkoreit, J.; Jones, L.; Gomez, A.N.; Polosukhin, I. Attention is all you need. arXiv 2017, arXiv:1706.03762. [Google Scholar]
- Huang, N.E.; Shen, Z.; Long, S.R.; Wu, M.C.; Shih, H.H.; Zheng, Q.; Yen, N.-C.; Tung, C.C.; Liu, H.H. The empirical mode decomposition and the Hilbert spectrum for nonlinear and non-stationary time series analysis. Proc. R. Soc. A 1998, 454, 903–995. [Google Scholar] [CrossRef]
- Bengio, Y.; Simard, P.; Frasconi, P. Learning long-term dependencies with gradient descent is difficult. IEEE Trans. Neural Netw. 1994, 5, 157–166. [Google Scholar] [CrossRef]
- Lei, Y.G.; Han, T.Y.; Wang, B.; Li, N.P.; Yan, T.; Yang, J. XITU-SY rolling element bearing accelerated life test datasets: A tutorial. J. Mech. Eng. 2019, 55, 1–6. [Google Scholar]
- Elouaham, S.; Dliou, A.; Nassiri, B.; Zougagh, H. Combination method for denoising EMG signals using EWT and EMD techniques. In Proceedings of the IEEE International Conference on Advances in Data-Driven Analytics and Intelligent Systems (ADACIS), Marrakesh, Morocco, 23–25 November 2023; pp. 1–6. [Google Scholar] [CrossRef]
Disclaimer/Publisher’s Note: The statements, opinions and data contained in all publications are solely those of the individual author(s) and contributor(s) and not of MDPI and/or the editor(s). MDPI and/or the editor(s) disclaim responsibility for any injury to people or property resulting from any ideas, methods, instructions or products referred to in the content. |
© 2025 by the authors. Licensee MDPI, Basel, Switzerland. This article is an open access article distributed under the terms and conditions of the Creative Commons Attribution (CC BY) license (https://creativecommons.org/licenses/by/4.0/).