Article

Characteristics of Overlying Rock Breakage and Fissure Evolution in the Mining of Extra-Thick Coal Seams in Anticline Structural Area

1
State Key Laboratory for Fine Exploration and Intelligent Development of Coal Resources, China University of Mining and Technology, Xuzhou 221116, China
2
School of Mines, China University of Mining and Technology, Xuzhou 221116, China
*
Author to whom correspondence should be addressed.
Appl. Sci. 2025, 15(16), 8812; https://doi.org/10.3390/app15168812 (registering DOI)
Submission received: 7 July 2025 / Revised: 4 August 2025 / Accepted: 7 August 2025 / Published: 9 August 2025
(This article belongs to the Special Issue Novel Research on Rock Mechanics and Geotechnical Engineering)

Abstract

To reveal the fracture mechanism of overburden aquifers during mining under anticlinal structural zones in western mining areas, this study takes Panel 1309 of the Guojiahe Coal Mine as the engineering background and employs field investigations, physical similarity simulation, and numerical simulation methods to systematically investigate the overburden fracture and crack evolution laws during extra-thick coal seam mining in anticlinal zones. The research results demonstrate the following: (1) The large slope angle of the anticlinal zone and significant elevation difference between slope initiation points and the axis constitute the primary causes of water inrush-induced support failures in working face 1309. The conglomerate of the Yijun Formation serves as the critical aquifer responsible for water inrush, while the coarse sandstone in the Anding Formation acts as the key aquiclude. (2) Influenced by the slope angle, both overburden fractures and maximum bed separation zones during rise mining predominantly develop toward the goaf side. The water-conducting fracture zone initially extends in the advance direction, when its width is greater than its height, and changes to a height greater than its width when the key aquifer fractures and connects to the main aquifer. (3) The height of the collapse zone of the working face is 65 m, and the distribution of broken rock blocks in the collapse zone is disordered; after the fracture of the water-insulating key layer, the upper rock layer is synchronously fractured and activated, and the water-conducting fissure leads to the water-conducting layer of the Yijun Formation. (4) Compared to the periodic ruptures of the main roof, the number of fractures and their propagation speed are greater during the initial ruptures of each stratum. Notably, the key aquiclude’s fracture triggers synchronous collapse of overlying strata, generating the most extensive and rapidly developing fracture networks. (5) The fracture surface on the mining face side and the overlying strata separation zone jointly form a “saddle-shaped” high-porosity area, whose distribution range shows a positive correlation with the working face advance distance. During the mining process, the porosity variation in the key aquiclude undergoes three distinct phases with advancing distance: first remaining stable, then increasing, and finally decreasing, with porosity reaching its peak when the key stratum fractures upon attaining its ultimate caving interval.

1. Introduction

Coal is the main energy source in China. With the depletion of resources in the eastern region, its mining has developed to the depth, and the center of production has shifted to the west [1,2]. The roof water surges caused by frequent mining activities have become one of the major mine disasters in western mining areas, which seriously threaten the safe and efficient production of coal mines [3,4].
For the mechanism of mine roof water accidents, relevant experts and scholars have carried out a lot of research and obtained many useful conclusions. Shi et al. [5] conducted research based on theoretical analyses of bending failure and shear failure mechanisms, combined with characteristic observations of water inflow variations during mining operations. Their work revealed the causative mechanisms behind the development of three distinct fracture types in the roof strata of Jurassic coal seam working faces in the Ordos Basin: splitting zone fractures, fracture line types, and tectonic-induced fractures that propagate toward roadways. Miao et al. [6] identified inadequate safety coal pillar dimensions as the critical factor inducing fracture connectivity through supplementary exploration borehole pumping tests. Their aquiclude leakage self-sealing aperture experiments further determined the direct cause of water inrush-induced support failure: interconnected water-conducting fracture channels compromised the aquiclude’s capacity to withstand outburst pressure from high-pressure water–sand mixtures in the fifth aquifer, ultimately triggering support collapse. Zheng et al. [7] elucidated, through numerical simulations, that the water-conducting fracture zone exhibits a “step-like” developmental pattern during coal extraction, with fracture morphology transitioning from vertical to horizontal orientation. Near coal seam boundaries, strain progressively diminishes, while instability in the primary key stratum significantly impacts underlying goaf areas. This ultimately leads to either closure of interlayer voids or redistribution of water-conducting fracture networks, consequently triggering water inrush incidents at the working face. Shi et al. [8] systematically analyzed multiple Bed-Separation Water Inrush (BSWI) incidents at the Cuimu Coal Mine to characterize BSWI patterns. Their integrated investigation of hydrogeological conditions, hydrochemical signatures, in situ water-conducting fracture zone detection, and groundwater monitoring identified several prerequisite conditions for BSWI occurrence. The study established that water inrush disasters only develop when the overlying aquiclude simultaneously meets three critical requirements: sustainable water recharge sources, an adequate water accumulation period, and functional water-conducting pathways. Li et al. [9] revealed the generation mechanism of water emergence accidents in three aspects, namely the relationship between the aquifer and the water-conducting fissure zones, the off-platform space, and the quarrying pressure, by means of on-site measurements, numerical simulations, and other research methods. Three aspects reveal the mechanism of a water breakout accident. Scientific monitoring, evaluation and early warning of sand breakage induced by mining can help to reduce the generation of water surge disasters [10]. Xiao et al. [11] constructed a prediction model for evaluating the risk level of water surges on the roof slab from the comprehensive analysis of the nature of the aquifer, the breakage of the roof slab, and the geological structure. Chen et al. [12] established a set-pair variable weight-forward association cloud prediction model to forecast primary water inrush windows and seepage channels in coal seam roofs. The model’s predicted preferential water inrush zones demonstrated strong spatial alignment with actual water burst locations. Based on region-specific inrush characteristics, the study formulated targeted treatment strategies and proposed a precision grouting control technology for source sealing through aquifer reinforcement. SUN et al. [13] embedded modified rock mass mechanical parameters into the numerical model, integrating microseismic monitoring with numerical simulation. Focusing on characteristic phenomena during water inrush—including the release of aquifer static pressure, sudden flow velocity increase at water gushing locations, and rising fluid con-centration—the study utilized pressure, velocity, and porosity variations within water-conducting fracture zones as monitoring indicators to predict and prevent groundwater influx. Zhang et al. [14] proposed a comprehensive evaluation and prediction model integrating the respective advantages of the analytic hierarchy process and gray relational analysis to assess roof water inrush risks during shallow coal seam mining. Jiang et al. [15] established a mechanical–structural model for roof water inrush with sandstone thickness as the primary controlling geological factor, deriving the calculation formula for water-rich intensity (F-zh) in overlying strata of mining areas. Building upon this model, they analyzed the positional relationship between “fractured arches” and aquifers based on the disturbance height of “fractured arch” development, subsequently proposing a novel evaluation method using the roof water inrush risk coefficient (T-W). Xie et al. [16] integrated geological and hydrogeological data from the mining area, selecting five evaluation indicators: core recovery rate of the Zhidan Formation, lithologic combination index, thickness of key aquifers, static water pressure head, and lithologic structure index. They calculated indicator weights using the Attribute Hierarchy Model (AHM) and coefficient of variation method, introducing subjective–objective preference coefficients to determine comprehensive indicator ranking. Through improvements to the Catastrophe Progression Method, the team established a water inrush risk zoning prediction model based on the enhanced methodology.
High-level bed separation water inrush induces intense ground pressure manifestations, including roof collapse, roof caving, rib spalling, and support crushing, posing severe threats to coal mine safety [17,18,19]. Liu et al. [20,21] investigated the mechanisms of water inrush-induced support failures in anticlinal and synclinal zones during coal mining, specifically examining the influence of confined aquifers on overburden movement and structural stability. Their research revealed that confined water acts as both a load-transfer medium in overlying strata and a dual-function agent: while reducing the load-bearing capacity of sub-key strata, it simultaneously imposes additional loads on composite sub-key strata formations. Wang et al. [22,23] studied the relationship between aquifer water level changes and overburden movement/roof weighting in water inrush-induced support failures under unconsolidated confined aquifers. Their research showed that the greater the water level drop and the faster the decline rate, the more severe the roof weighting becomes, correspondingly increasing the risk of support failure. Zhou et al. [24] addressed the conflict between aquifer water inrush prevention and rock burst control by developing a dual-level fracturing technology, combining high-level roof pre-splitting with low-level rock fracturing for pressure relief, thereby achieving safer coal extraction. Wang et al. [25] identified that in pre-draining-induced pressure relief zones, the combined action of gravitational stress, mining-induced stress, and drainage-transmitted stress generates superimposed stresses exceeding the critical threshold for rock bursts, constituting the primary triggering mechanism. Tien Trung Vu et al. used the UDEC numerical simulation method to analyze the rock displacement induced by mining, and their study on the 31,104 longwall face of the Nui Beo coal mine in Vietnam showed that the total height of the rock displacement zone could be up to 63 m, the surface influence area was about 160 m, and the roof collapse angle was 52° when mining the No. 11 coal seam [26]. Azamat Matayev et al. concluded that the characteristics of rock movement under deep-mining conditions are closely related to the method of support and that the height of the fallout zone in a coal mine in Kazakhstan was 125 m in the case of fill mining and up to 280 m in the case of avalanche mining [27].
However, previous studies of overburden breaks and fissure development patterns have considered the horizontal coal seam [20], and China’s western coal mining regions predominantly feature fold structures [28], where complex terrain conditions frequently lead to water inrush-induced support failures in working faces. Characterized by thick coal seams and intensive mining operations, these areas exhibit particularly complex water inrush mechanisms when aquifers fracture under such conditions. Consequently, research on overburden structural failure and fracture evolution patterns under anticlinal structures remains limited. This study, using the Guojiahe Coal Mine as an engineering case, employs field investigations, physical similarity modeling, and numerical simulations to comprehensively investigate both macroscopic overburden failure and microscopic fracture evolution. The findings provide significant theoretical and practical guidance for preventing and controlling water inrush support failures in anticlinal zones.

2. Engineering Background

2.1. Mining Conditions and Support Crushing Incidents

The Guojiahe Coal Mine is located in Baoji City, Shaanxi Province, and is one of the key production mines in the Huanglong coalfield, a billion-ton-level large-scale coal base. The mine field features relatively developed fold structures and multiple aquifers, resulting in abundant groundwater resources [20,21]. During mining in Panel I of the mine, water inrush and support collapse frequently occur, leading to safety accidents and low productivity.
Taking working face 1309 as an example, the working face measures 225 m in length with an advance length of 2339 m, primarily mining the No. 3 coal seam that averages 10.03 m in thickness, 6° in dip angle, and 567.5 m in burial depth, utilizing the fully mechanized top-coal caving method. Figure 1a shows the curve of water level change in the Yijun group: when the water level decreases, it represents the occurrence of sudden water pressure frame accident. Figure 1b shows the geological structures and locations of water inrush-induced support failures in this working face. The working face intersects four anticlines and four synclines, arranged perpendicular to the fold structures axial traces. The mining operations involve alternating between rise and downdip mining configurations, as detailed in Table 1.
The locations of the blue lines in Figure 1 are the locations where the pressurized frame accidents occurred. It can be seen through Figure 1 that all four support collapse incidents occurred in anticline zones with significant elevation differences between slope transition points and fold structures axial traces, primarily during rise mining operations, and were consistently accompanied by simultaneous water inrush events. This demonstrates a correlation between anticline structures and the occurrence of water inrush-induced support failures in Panel 1309.

2.2. Identification of Key Aquifers and Impermeable Layer in Overlying Strata

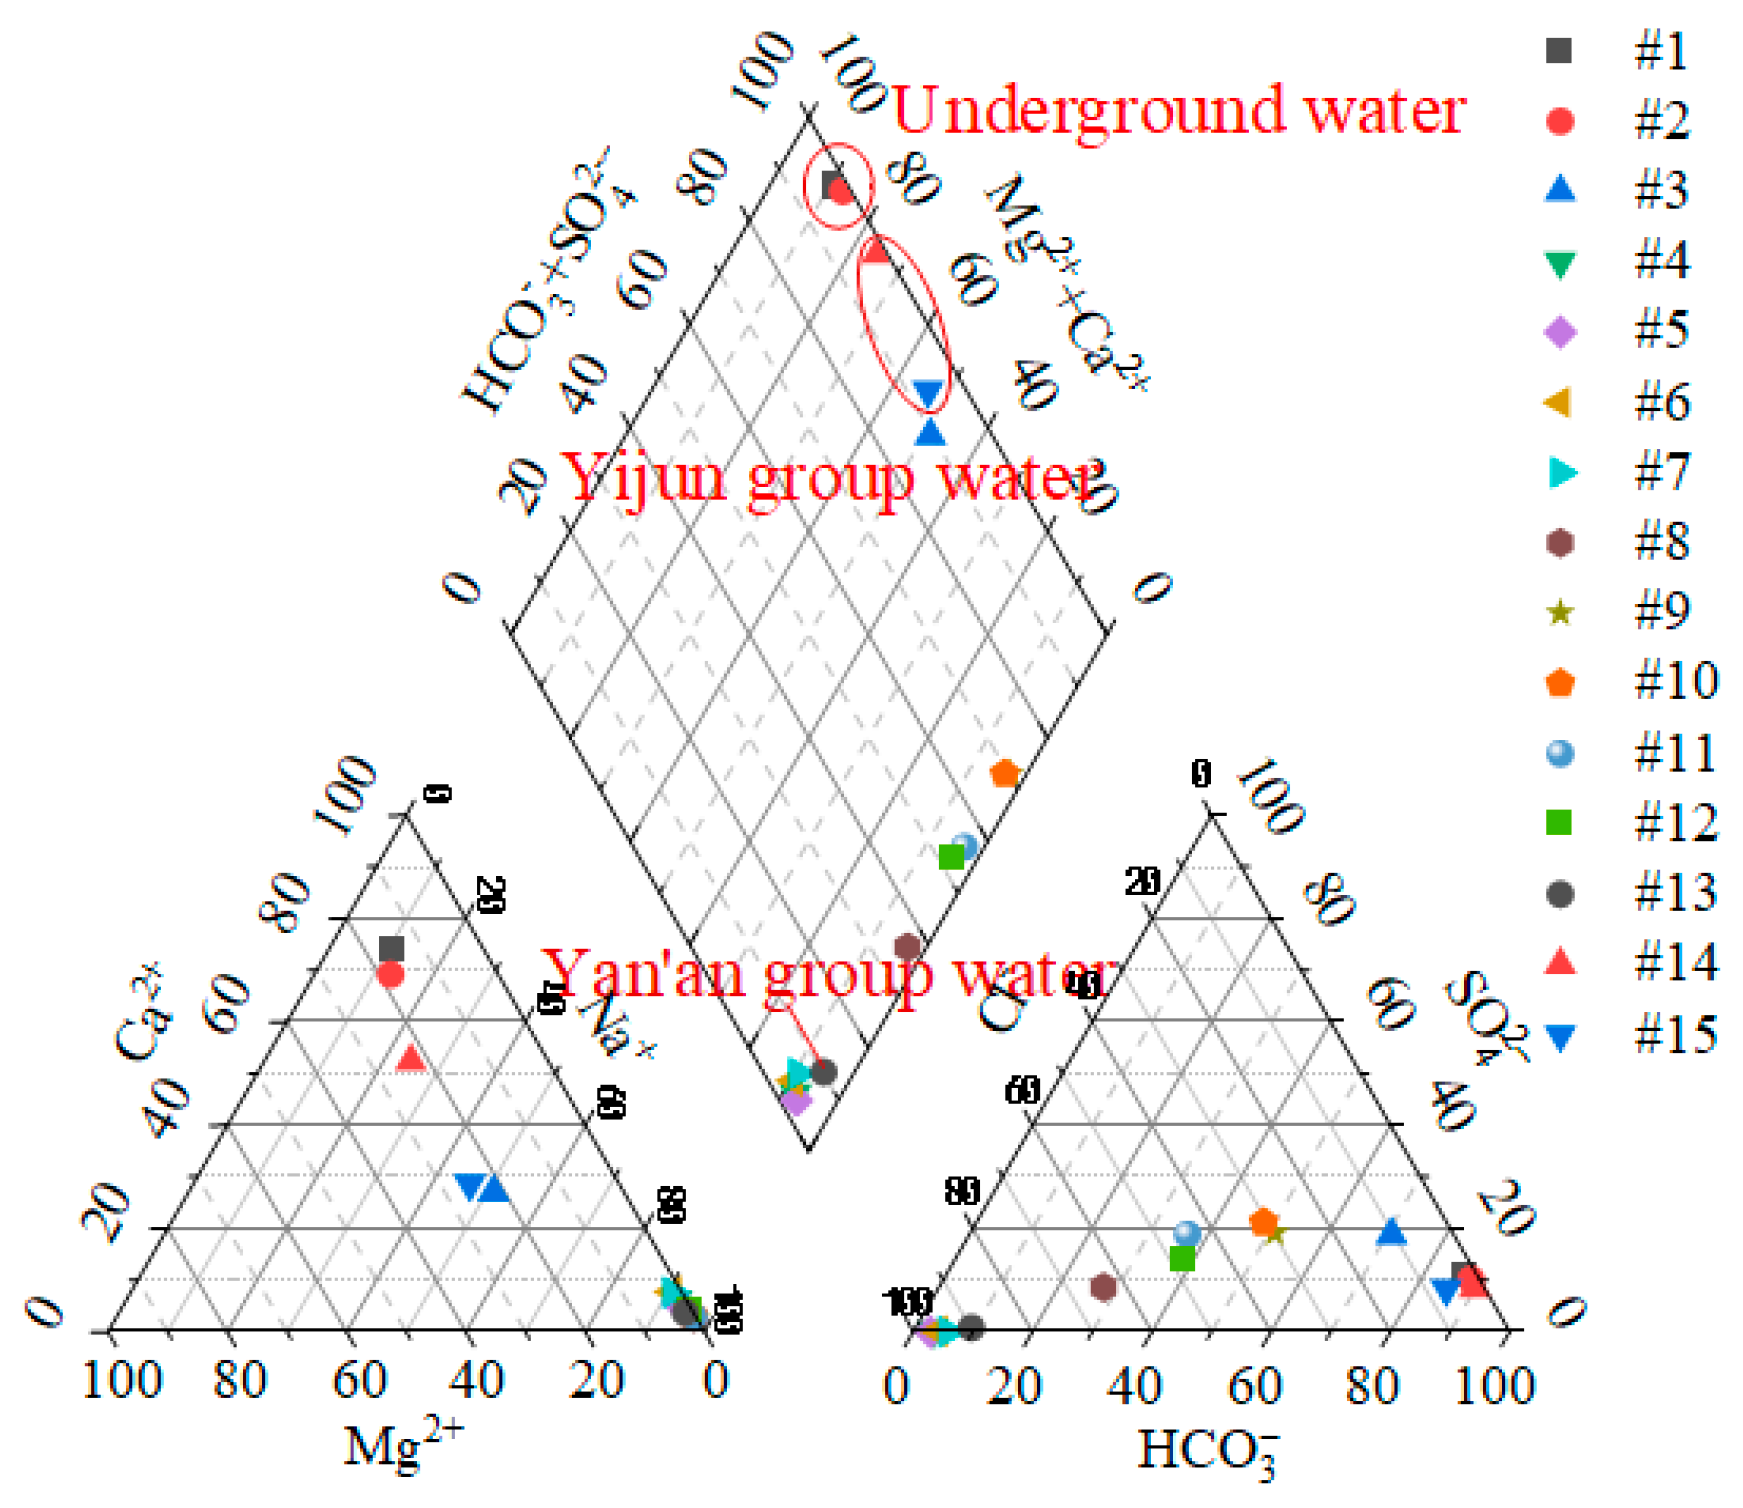
Due to the existence of multi-layer aquifers in the overlying rocks of the working face, in order to determine the water source of the water breakout in the working face and the key aquifer that led to the pressurized rack accident, we tested the water quality using on-site measurements, sample collection, and other methods. During the occurrence of the first water surge pressurized racking accident in the 1309 working face, water quality testing was carried out, respectively, on the roof water of the roof slab surge, the roof water of the relief holes and aquifers, and the surface water, and the test results are shown in Table 2, and according to the results of the water quality testing, the water quality Piper diagram shown in Figure 2 was drawn. In the process of deep hole drilling, the optimization of the damper structure design based on the dry friction effect can effectively improve the damping performance [29,30], inhibit the vibration of drilling tools, further optimize the drilling efficiency, and avoid the risk of overloading [31].
The analysis of water quality data shows that the water quality of the Yijun Formation is close to that of surface water, which indicates that the aquifer of the Yijun Formation is strongly recharged by surface water. The water quality of the Yan’an Formation differs greatly from that of the Yijun Formation, and the two are far apart in the water quality Piper diagram. The chemical type of the top slab water is between Yijun Formation water and Yan’an Formation water, which is due to the dissolution and filtration of soluble salt minerals in the formation by the Yijun Formation water flowing through the Yan’an Formation rock layer and the mixing of Yijun Formation water and Yan’an Formation water. Therefore, the water source of roof water breakout is mainly Yijun Formation water, supplemented by Yan’an Formation water, and Aquifer II, composed of the Yijun Formation rock layer, is the key aquifer leading to the water breakout of the working face and the pressure frame.
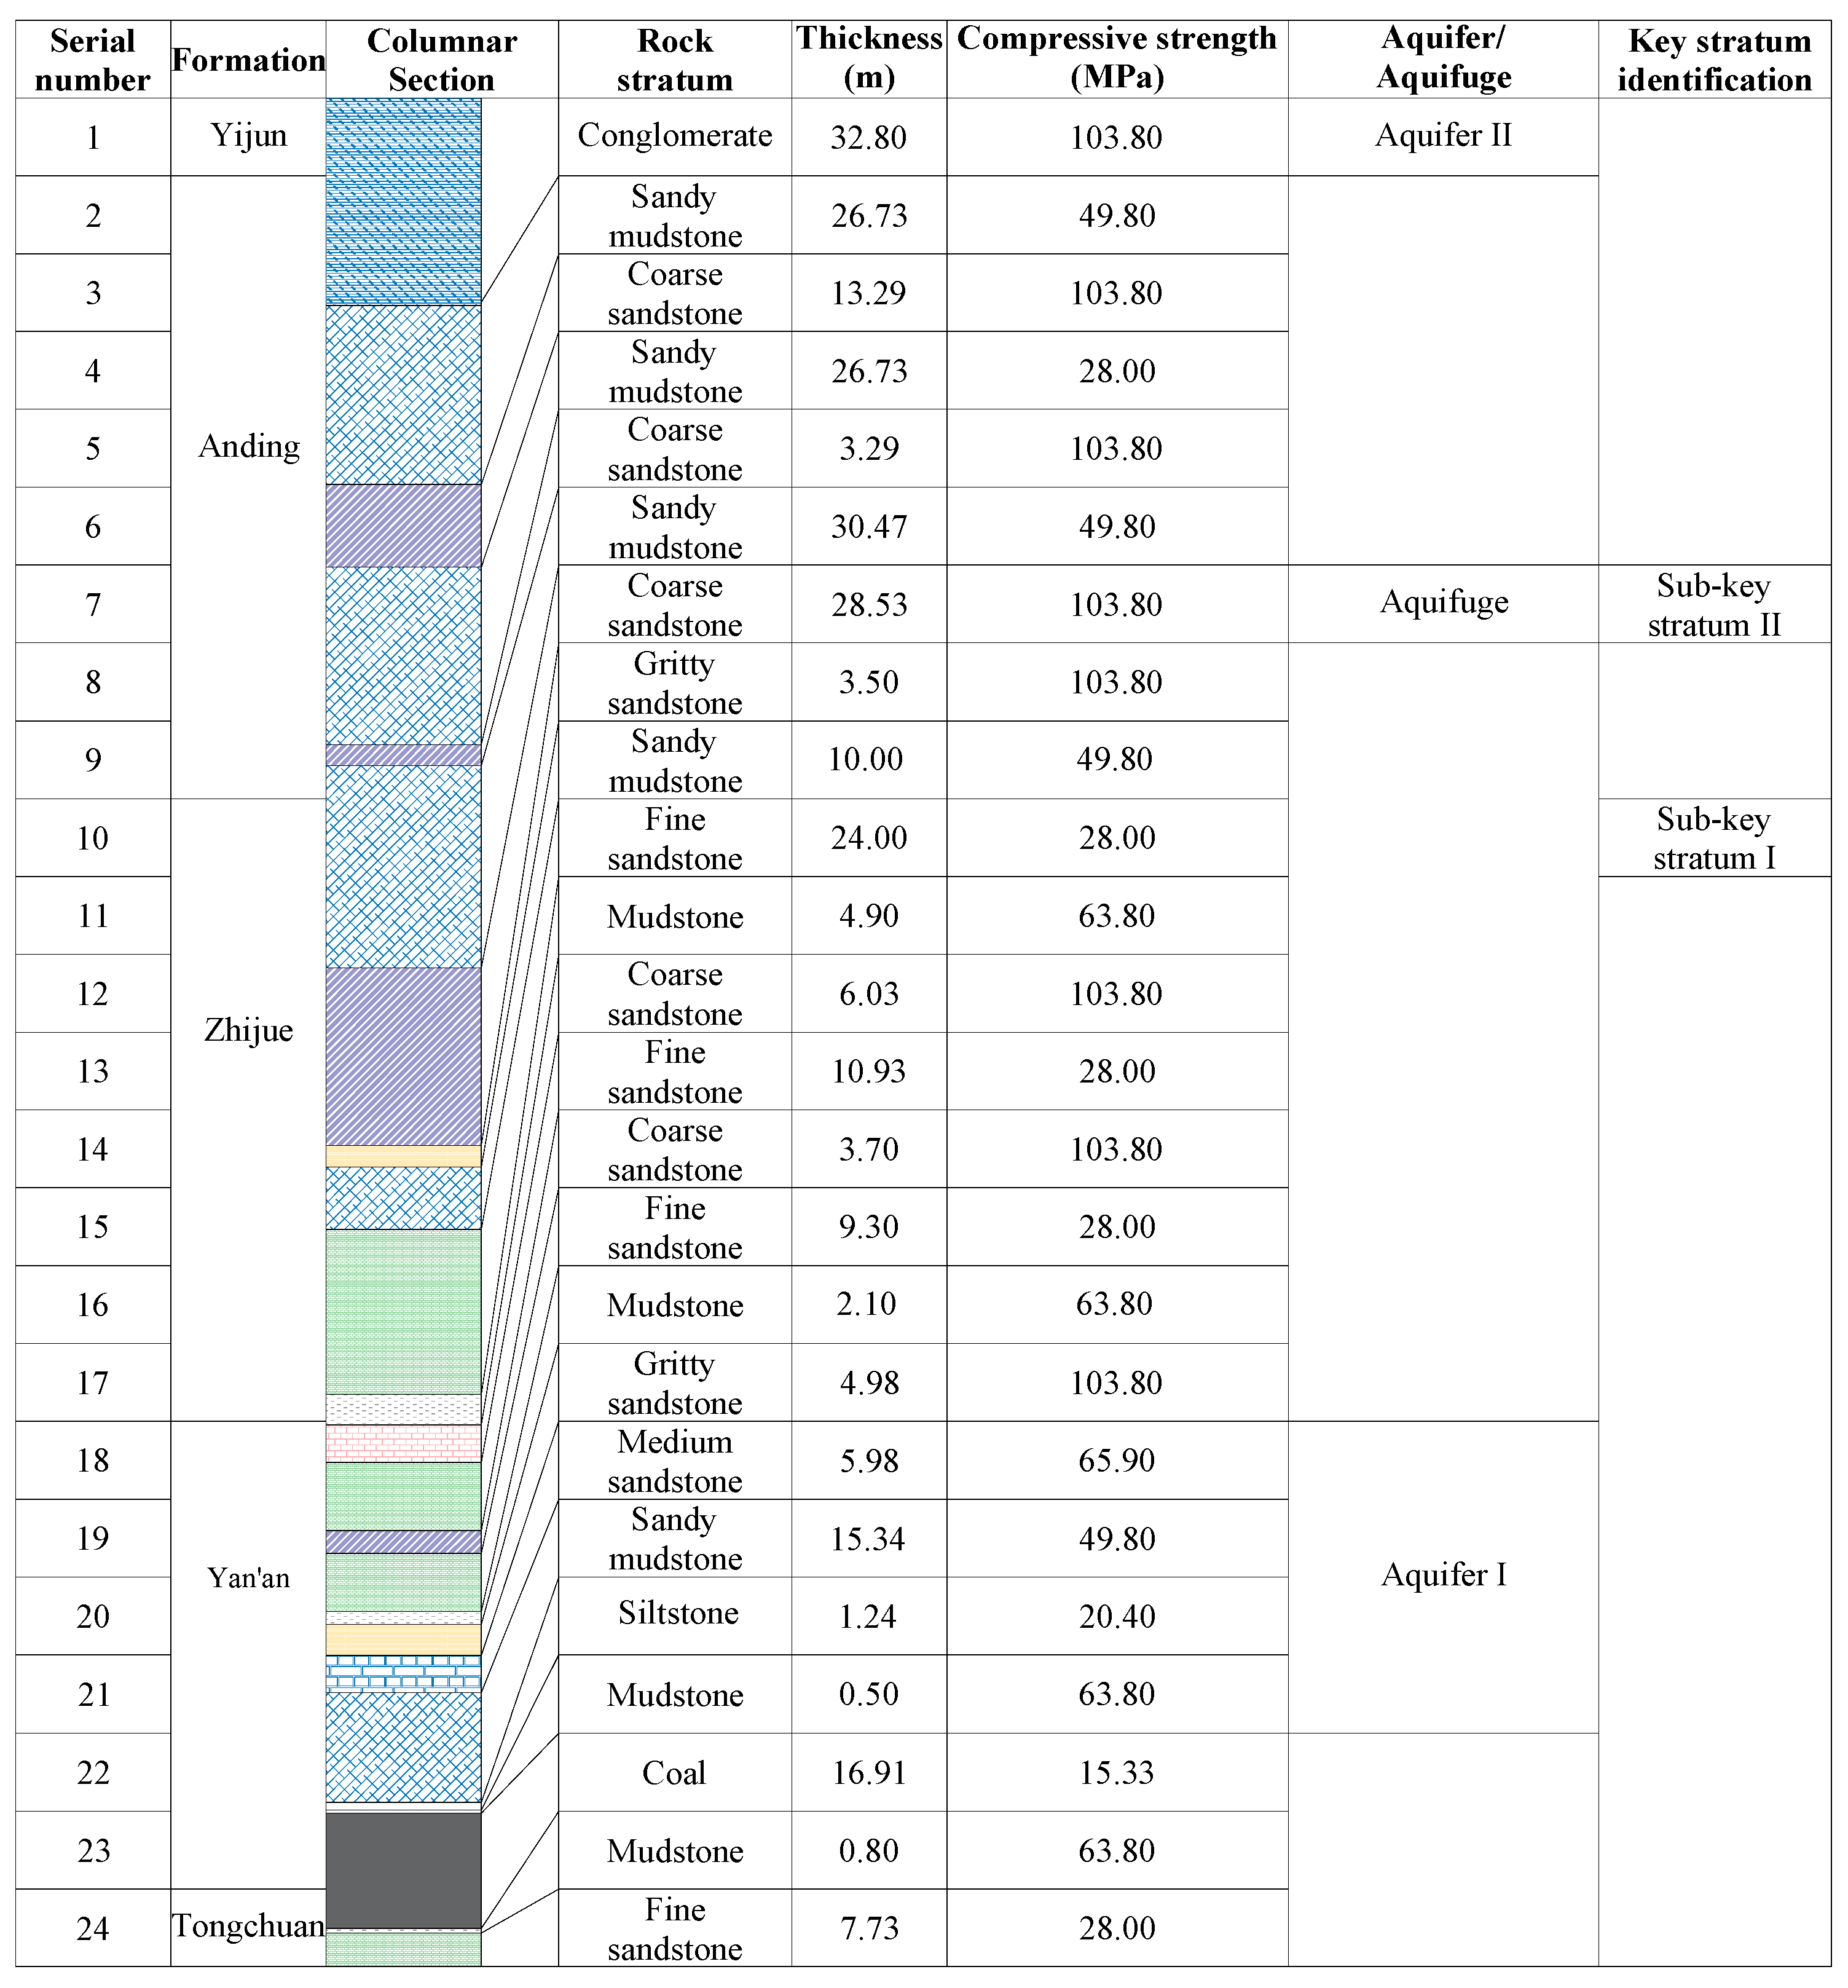
The parameters of the overlying strata above the working face are illustrated in Figure 3. Based on the key stratum identification method [32], two sub-key strata exist within the 231.54 m vertical span between the working face and Aquifer II:
(1) Sub-key Stratum I: Composed of fine-grained sandstone from the Zhijue Formation, with a thickness of 24 m and located 65 m above the working face;
(2) Sub-key Stratum II: Consisting of coarse-grained sandstone from the Anding Formation, measuring 28.53 m thick and positioned 102.5 m above the working face.
Sub-key Stratum II controls the 129.04 m rock mass beneath the Yijun Formation aquifer. Its fracture-induced instability would directly cause water-conducting fractures to penetrate the Yijun Formation aquifer, making it the critical aquiclude.

3. Destabilization Law of Overburden Rock Breakage in Mining of Extra-Thick Coal Seams in Dorsal Tectonic Zone

3.1. Experimental Program

A physically similar material model was built with the geological conditions of the 1309 working face in the Guojiahe Coal Mine as a prototype, as shown in Figure 4. A plane stress model frame with a model size of 2.2 m × 0.3 m × 2.24 m (length × width × height) was used for the experiment, and the simulation object was the 336 m rock stratum from the direct bottom of the working face to the upper part of the working face, with a horizontal length of 330 m, which included a 70 m horizontal coal seam, 240 m inclined coal seam (elevation angle of 11°), and 20 m backslope axial part. The geometrical similarity ratio and bulk weight similarity of the simulation experiment are 150 and 1.67, respectively, and according to the similarity theory [33,34], the model motion time similarity ratio, stress similarity ratio, and mass similarity ratio can be determined to be 12.25, 250, and 5.64 × 10⁶, respectively.
In this experiment, river sand, calcium carbonate, and gypsum were chosen as similar materials, and the mechanical strength of each coal rock layer in the model can be determined according to the stress similarity ratio, which, in turn, determines the ratio of materials [35]. Mica sheets were used to layer the model to simulate the rock stratification surface. In view of the large size of the model, the model was maintained for 60 days after the laying was completed. After the model was air-dried, the upper part of the model was loaded using an oil cylinder with a loading pressure of 24 kPa to compensate for the pressure of the rock formation 240 m above the model. After 24 h of pressure stabilization, the surface of the model was painted white, and points were densely placed at 0.1 m intervals to form a digital point cloud.
The Guojiahe Coal Mine 1309 working face has a daily footage of 4.8 m, according to the motion time similarity ratio and geometric similarity ratio, the working face is excavated 5 cm each time, and the interval between each excavation is 184 min. The rightmost end of the model was left with a 20 m width coal pillar, and the working face was excavated sequentially from right to left. Before each excavation, a high-definition camera was used to take photos of the roof overburden to record the breakage and destabilization of the roof overburden during the advancement of the working face, the transportation pattern, and the development characteristics of the water-conducting fissure zone.

3.2. Experimental Results and Analysis

Characterization of Water-Conducting Fissure Zone Development

Based on the monitoring results of the high-definition camera on the roof overburden, Vic-2D software is used to obtain the displacement magnitude of the digital point cloud on the surface of the model before each excavation, which, in turn, can be inverted to obtain the evolution law of the displacement field of the roof overburden in the process of advancing of the working face. The displacement maps of the rock layer of the seven times of breaking the rock overlaying the working face are shown in Figure 5a–g, respectively. When the working face advances to 40 m, the overburden rock of the Yan’an group collapses, and the height of the collapse zone is 23.06 m; when the working face advances to 70 m, the rock layer of the intuition group in the lower part of sub-critical layer Ⅰ collapses, and the height of the collapse zone increases to 65 m. As the step distance of rock layer collapse of the intuition group is larger than that of the Yan’an group, the collapse of two rock layers is not synchronized, and the rock layer collapse of intuition group generally lags behind that of the Yan’an group. When the working face advances to 100 m, the rock layer of the Yan’an group collapses for the third time, while the intuition group does not collapse; when the working face advances to 140 m, the rock layer of the intuition group collapses for the second time, while the rock layer of the Yan’an group has collapsed four times. When the face advances to 180, sub-critical layer Ⅰ breaks, the height of the water-conducting fissure zone develops to 100.5 m, and the rock layers of Yan’an group and the intuition group collapse for the fifth and third times, respectively, at this stage. When the working face advances to 240 m, the water-isolating key layer breaks, and the upper 100.51 m of the rock layer is synchronously fractured and activated, with significant changes in the middle–upper displacement field of the model, and the water-conducting fissure zone develops into the Yijun Formation aquifer, with a height of more than 229.54 m.
According to the evolution characteristics of the displacement field of the overlying rocks in the working face, the development of the water-conducting fissure zone is in a step-like leap from the bottom to the top. The fracture step of the top rock layer increases with the height of the overlying rock, and due to the asynchronous fracture of the top rock layer, the water-conducting fissure zone always expands along the advancing direction of the working face first. With the increase in the length of the water-conducting fissure zone, the space between the water-conducting fissure zone and the upper unbroken rock layer gradually increases, and the breakage of the upper rock layer triggers the rapid upward development of the water-conducting fissure zone after the range of the water-conducting fissure zone reaches the fracture step distance of the upper rock layer. Among them, the key layer of water isolation has a crucial influence on the water-conducting fissure zone, and the height of the water-conducting fissure zone surged from 100.5 m to 229.54 m after its fracture, which increased the height of the water-conducting fissure zone by 128.40% and led to the aquifer of the Yijun Formation.

4. Discrete Element Simulation of Extra-Thick Coal Seam Mining in Anticlinal Structural Zones

4.1. Model Establishment

Using PFC 2D numerical modeling, this study investigates the mechanisms of water inrush-induced support failures in anticlinal structures through multiscale analysis, macroscopically examining overburden fracture patterns, strata movement, and water-conducting fracture development while microscopically analyzing fracture propagation in roof strata and porosity evolution in key aquicludes.
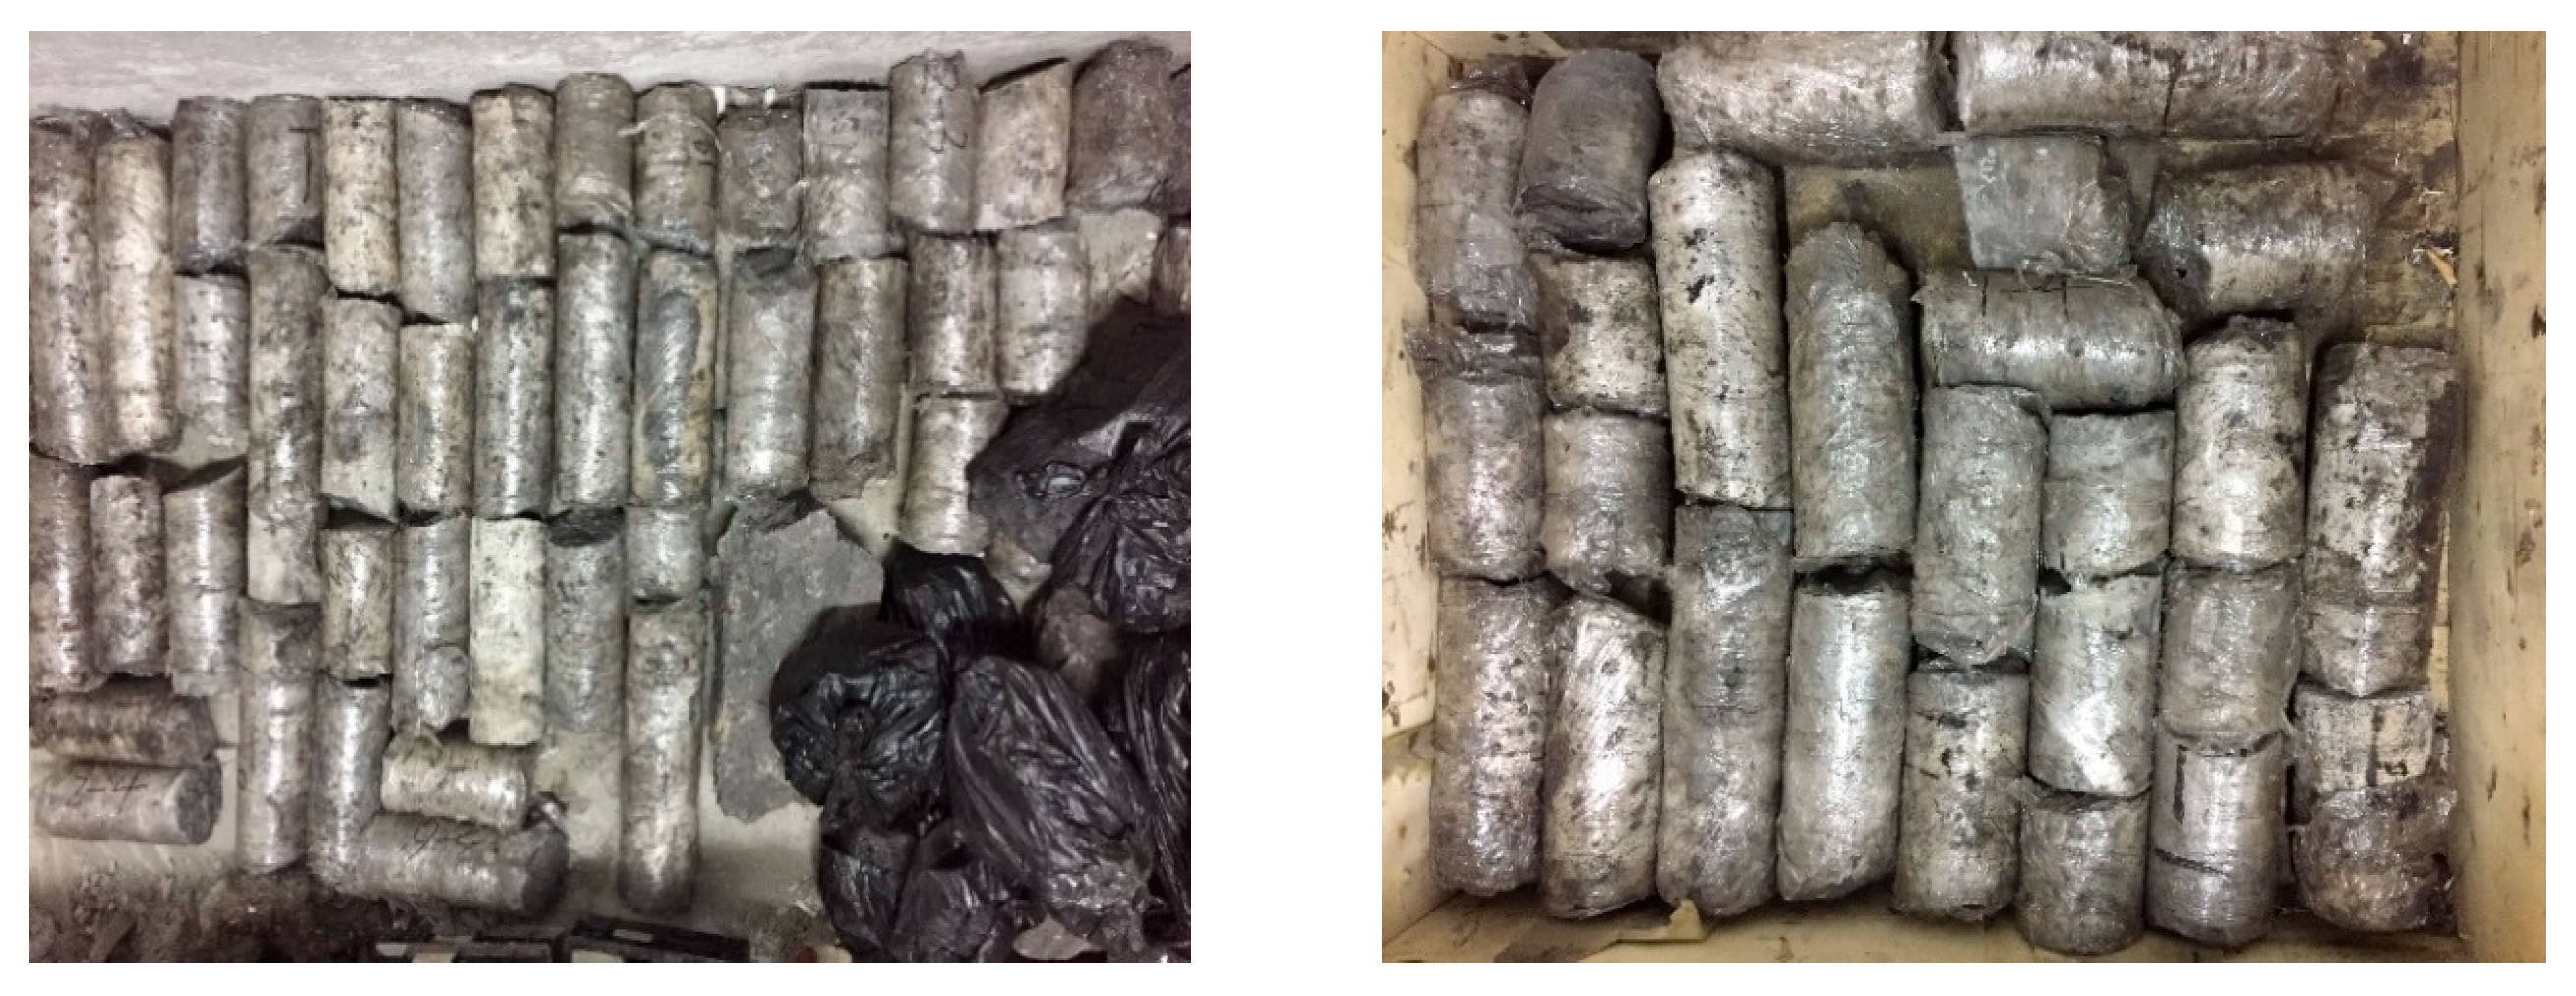
As shown in Figure 6, it can be seen from the on-site borehole coring that the integrity of the rock formation is good, with little joint and fissure development, so in order to simplify the model, we consider the rock to be intact when determining the contact model micro-parameters.
A numerical model was established in PFC 2D 5.0, comprising four mining configurations: horizontal mining, rise mining, anticlinal axis mining, and downdip mining (dimensions: 500 m × 300 m). The stratigraphic model was constructed based on the coal-rock parameters shown in Figure 2. The immediate roof above the coal seam was integrated and designated as a composite immediate roof due to its relatively thin strata. The immediate floor consists of 0.8 m mudstone combined with fine-grained sandstone, collectively termed as the floor. Anticlinal parameters for each stratum are shown in Figure 7. The parallel bond model was adopted for particle–particle contacts, while the linear model was used for particle–wall interactions. Measurement circles were arranged from the coal seam roof to the conglomerate layer, covering both horizontal and rise mining sections, with the critical aquiclude monitoring line indicated in blue in Figure 7. The model was calculated to equilibrium [36], with the physical–mechanical parameters of coal and rocks listed in Table 3.
After model establishment, the mining process during rise extraction in the anticlinal working face was simulated by removing particles within the excavation zone. The mining direction follows the white arrow in Figure 7, with a 25 m coal pillar reserved on the model’s right side. The initial excavation had a horizontal width of 25 m, while subsequent excavations were 20 m each. The simulation included 3 excavations in horizontal mining, 12 in rise mining, 1 at the anticlinal axis, and 7 in downdip mining. Each excavation was followed by 10,000 calculation cycles to allow for stress redistribution, realistically simulating overburden collapse and deformation in the goaf.

4.2. Calibration of Microscopic Parameters

Prior to conducting numerical simulations, it is essential to select appropriate microscopic parameters for particles. Determining micro-scale parameters that match macroscopic rock properties constitutes a critical prerequisite for achieving realistic simulations. Building upon existing research, the corresponding microscopic parameters can be established according to the following empirical formulas [37]:
(1) Elastic modulus:
E E c = a 1 + b 1 ln k n k s
(2) Poisson’s ratio:
μ = c 1 ln k n k s + d 1
(3) Parallel bond shear and normal strength:
σ c σ ¯ = a 2 τ ¯ σ ¯ 2 + b 2 τ ¯ σ ¯ 0 < τ ¯ σ ¯ 1 c 2 τ ¯ σ ¯ > 1
σ t σ ¯ = a 3 τ ¯ σ ¯ 2 + b 3 τ ¯ σ ¯ 0 < τ ¯ σ ¯ 1 c 3 τ ¯ σ ¯ > 1
The meaning of the symbols in the formulas is given in Table 4.
Based on the coal–rock mechanical strength parameters listed in Table 5 and by substituting them into Equations (1)–(4), the corresponding meso-scale mechanical parameters of coal and rock were obtained, as shown in Table 5.

5. Analysis of Numerical Simulation Results for Extra-Thick Coal Seam Mining in Anticlinal Zones

5.1. Fracturing Characteristics of Overlying Strata and Development Features of Water-Conducting Fracture Zones

Based on existing studies of fracture zone height prediction in the Huanglong coalfield [38], the empirical formula is given as follows:
H d = 100 M 0.17 M + 0.76 + 58.30 ln L + 4.71 S 630.8 ± 20.53
In the equation, Hd represents the predicted height of the water-conducting fracture zone, m; M is the mining thickness of the coal seam, m; L denotes the working face length, m; and S signifies the burial depth of the coal seam, m.
Substituting the operational data from Panel 1309 into Equation (5), the theoretically calculated development height of the water-conducting fracture zone ranges from 241.81 to 282.87 m, with an average of 262.34 m.
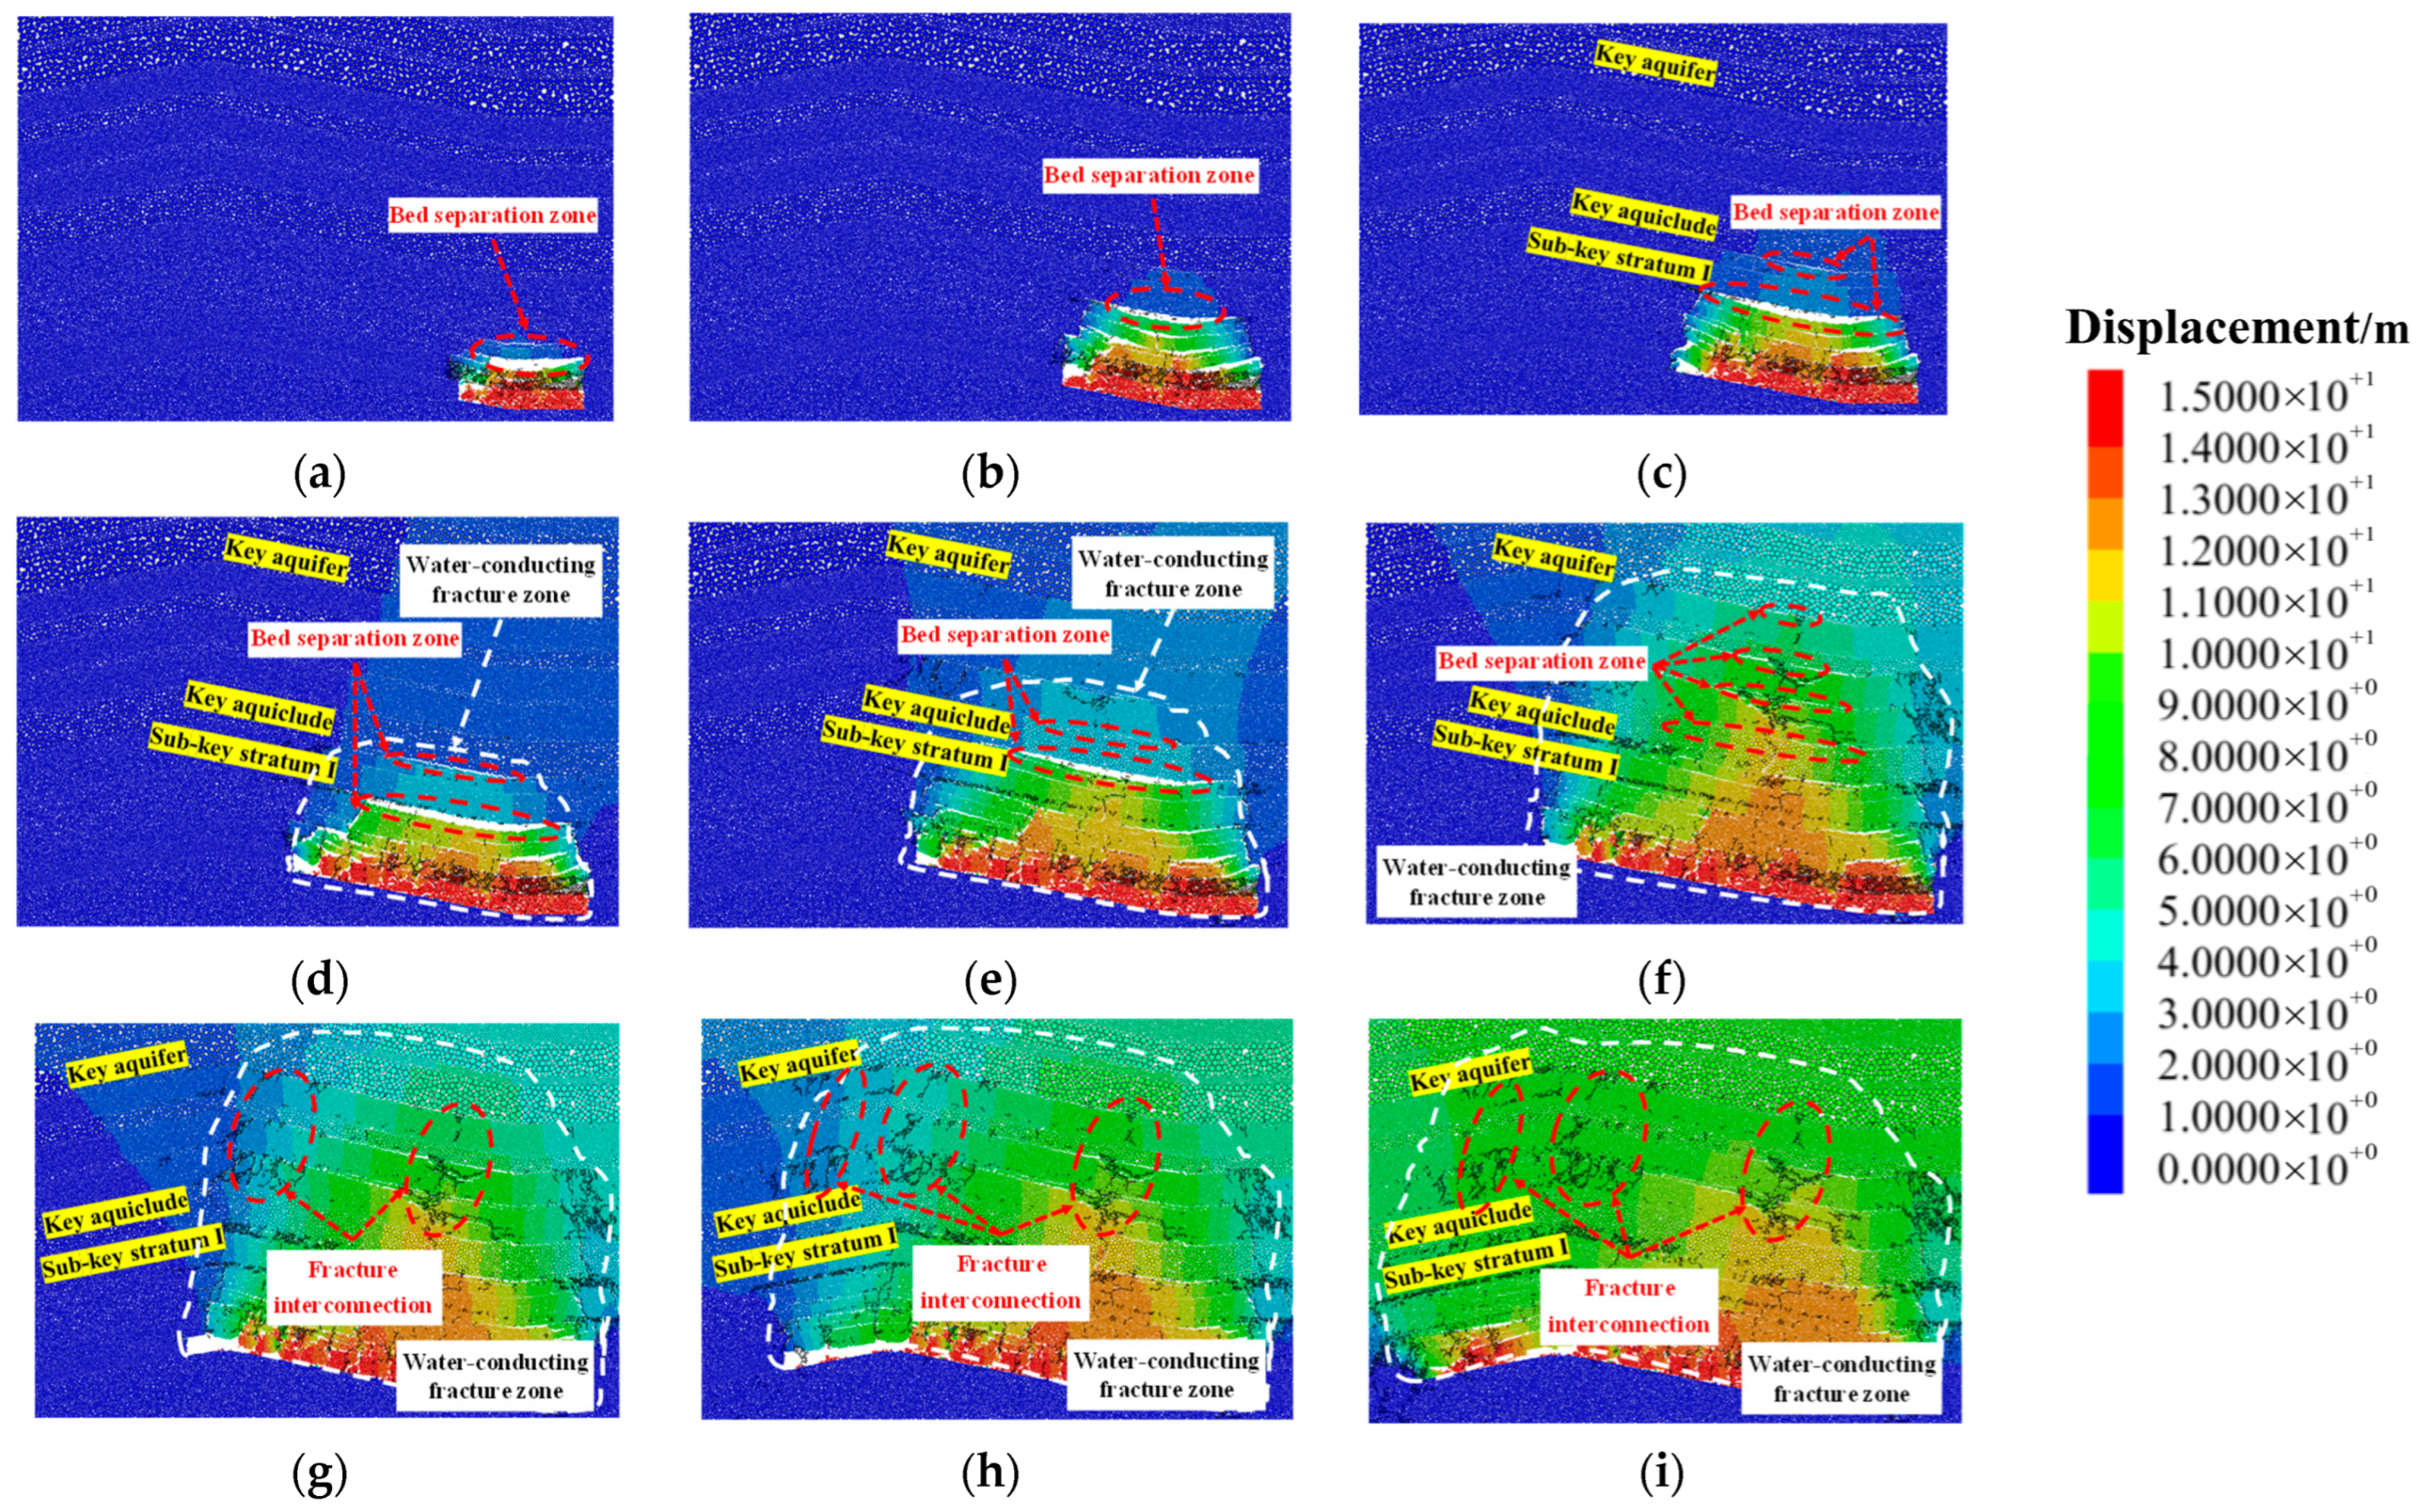
Taking the stages of the working face passing through the anticline as an example for analysis, Figure 8 shows the distribution characteristics of overburden collapse, where the black lines represent the fracture development patterns recorded by DFN. Throughout the entire advance process of the working face, each overburden failure follows four distinct stages: first, the generation of bed separation; second, rock stratum fracture; third, instability-induced collapse; and finally, recompaction.
During the rise mining phase, as the face advance distance increases, the composite immediate roof above the goaf initially fractures, creating a bed separation zone between collapsed strata and intact overburden, with its extent proportional to the advance distance. Due to the rise angle, maximum bed separation shifts toward the goaf side, forming an asymmetric separation pattern. As the face advanced from 100 m to 140 m, the Zhijue Formation’s larger collapse interval compared to the Yan’an Formation’s composite immediate roof prevented Sub-key Stratum I from fracturing synchronously with lower strata, resulting in progressively increasing the bed separation height beneath it. At 180 m advance, the separation zone reached Sub-key Stratum I’s fracture interval, triggering its instability. Between 180 m and 220 m, the recompaction of collapsed Sub-key Stratum I gradually expanded the separation zone below the key aquiclude. When approaching the anticlinal axis at 240 m, fracture of the thick key aquiclude induced multi-layer separation in overlying strata, causing significant deformation in the key aquifer that accelerated fracture propagation. Transitioning to downdip mining, fractured roof strata formed compressive-type fractures with synchronous subsidence (contrasting with rise mining’s non-arching collapse), exhibiting reduced interlayer separation and minimized stability impacts, consistent with field observations where water inrush support failures predominantly occurred during rise mining.
Prior to reaching the 140 m advance position, mining operations had not caused significant fracture or deformation to the key aquifer strata. When the working face advanced to 180 m, Sub-key Stratum I fractured, with the water-conducting fracture zone reaching a height of 113.5 m. At the 220 m advance position, significant displacements occurred in the central bed separation zone below the key aquiclude, inducing fracture development in overlying strata and expanding the water-conducting fracture zone to 142.5 m. As mining progressed to 340 m, continuous displacement accumulation in the mid-lower section of the key aquiclude ultimately caused its fracture. The aquiclude’s failure triggered synchronous fracture and reactivation of overlying strata, with particularly notable displacement in upper surrounding rock. At this time, the water-conducting fissure zone develops to the key aquifer, with a height of more than 256.5 m, which is closer to the similar simulation result of 229.54 m and more consistent with the theoretical calculation result of 262.34 m. These deviations may originate from several factors, including model assumptions and simplifications, the accuracy of numerical grids, and measurement errors in experimental data. The model simplification may ignore the detailed changes in the geological environment, leading to some bias in the prediction results; meanwhile, the accuracy of the instruments in the experimental measurements and the uncertainty of the field environment may also affect the accuracy of the data. In addition, the geological parameters used in the simulation may have estimation errors, and these factors work together to cause errors.
During the working face advance, as different stratigraphic layers have varying fracture intervals and the roof strata’s fracture interval is proportional to the overburden height, the development height of water conducting fracture zone shows step-like increments from bottom to top. The fracture of key aquiclude significantly affects this development: the maximum displacement of key aquifer increases from 1.8 m to 4.6 m (155.6% increase), with the fracture zone height expanding by 114 m. During rise mining and near the anticlinal axis, repeated vertical fracture connections occur between the key aquiclude and aquifer, providing short path channels for water inflow. Therefore, the fracture of the key aquiclude not only causes ground pressure manifestations and reduces hydraulic support stability but also induces water inrush accidents [39].

5.2. Distribution Characteristics of Fracture Angle

The fracture angle can reflect the directionality of the sudden water flow channel [28]: in the numerical simulation using the DFN function to count the tilt angle of the overburden rock mining fissure under different propulsion distances, the statistical range is 0~180 °, and the statistical fissure angle is used to draw a rose diagram, as shown in Figure 9.
According to the different directions of fissure extension, it is known from the theory of the “masonry beam” and “O” ring that the mining fissures can be divided into transversal off-layer fissures and vertical breakage fissures. According to the results of interval distribution of fracture angle, the fracture angle of mining overburden under different mining stages is mainly distributed in the range of 75°~125°, with vertical fracture as the main one. Combined with Figure 8, it can be seen that in the process of workface advancement, the overburden rock fissures are mainly vertical breakage fissures formed by the cycle breakage of the roof plate caused by workface mining: with the increase in advancement distance, the value of overburden rock layer off-layer gradually increases, and the horizontal off-layer fissures in the off-layer area of the lower stratum increase accordingly; at the same time, the upper stratum rock layer and the lower stratum rock layer synchronize with the deformation of the subsidence, and the vertical fissures within the same rock layer are continuously developed, which eventually leads to the breakage of the overburden rock layer. The vertical cracks in the same rock layer develop continuously and eventually lead to the breakage of the overlying rock layer. Until the working face advances to a certain distance when the overlying rock breaks through to the aquifer, affected by the horizontal separation fissures, the distribution of water from the aquifer is wide in the advancing direction of the working face, and the vertical fissures guide the water source to the working face and the mining airspace, which ultimately leads to the accident of a sudden water compression frame.

5.3. Development and Distribution Characteristics of Overburden Fractures

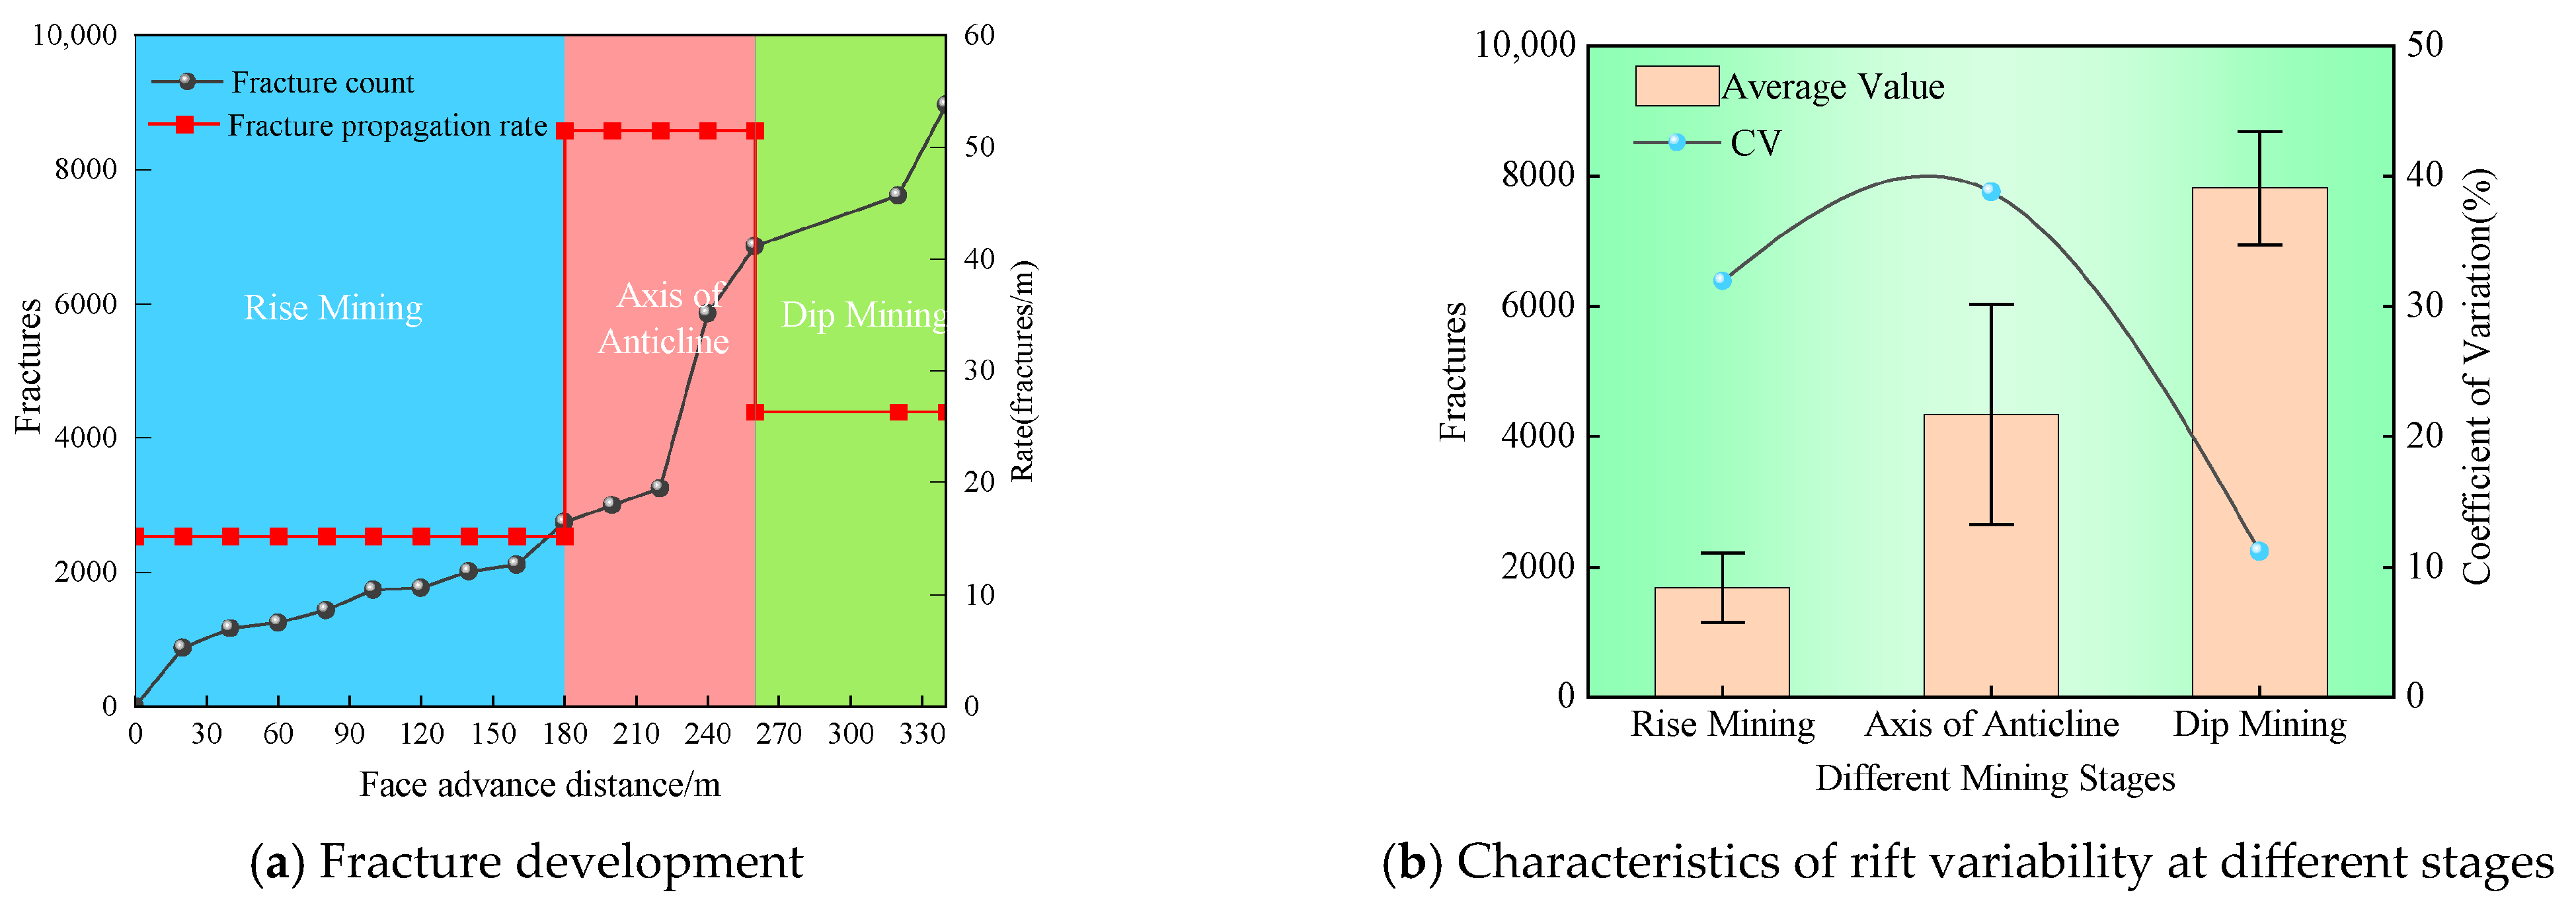
The number of overburden fissures in the above mining process was counted, and the mining stage was also divided, in which 0~180 m is the upward mining stage, 180 m~260 m is the backslope axis, and 260 m~340 m is the downward mining stage, and the results are shown in Figure 10. Overall, the fracture count is proportional to the advance distance, but the fracture development rates differ among various rock strata failures:
(1) In the early stage of upward mining, with the advance of the working face, the composite direct top “rises with mining”, and the basic top breaks periodically, so the overall number of fissures is proportional to the advance distance, and the distribution of fissures is mainly based on the horizontal distribution. When the working face is pushed to 180 m, it enters the key position of the backslope axis at the stage of upward mining, and when sub-critical layer I reaches the limit of the collapse step, it breaks, resulting in an obvious increase in the number of cracks, which are mainly distributed in the collapse zone. As the working face continues to advance, the number of fractures in the basic top cycle increases. When the working face advances from 220 m to 240 m, the key water barrier layer breaks, leading to the activation of the fissures in the overlying rock layer; the number of fissures before and after the breakage increases by 3484, and the distribution of fissures at this time is mainly in the vertical direction. When mining over the backslope axis into the downward mining stage, the key water barrier layer caused by the working face mining experienced periodic breakage, causing high overlying rock breakage, and the number of fissures increased to 8966, which shows that the key water barrier layer in the control of the stability of the overlying rock and aquifer fissure penetration plays a crucial role.
(2) From the perspective of different mining stages, the average development rate of the fissures near the backslope axis is, at the most, 51.4/m in the three stages, and its standard deviation is also relatively large, which is mainly due to the strong mining damage caused by the complex stress superimposed by the high tensile stress and mining stress in the backslope axis. And the fissure development is the slowest in up-slope mining due to the small influence range of the mining disturbance in the early stage. The coefficient of variation (CV) is a relative index used in statistics to measure the degree of data dispersion and is usually calculated using the ratio of standard deviation to mean. The coefficients of variation of different stages show the characteristics of “normal distribution”, among which the corresponding fissure development of the up-slope stage and the backslope axis stage have larger variation values, which are 31.9% and 38.7%, respectively, reflecting that the fissure development of overburden rock caused by mining in this process shows strong non-uniformity, so up-slope mining and the near backslope axis are the most important stages to focus on when mining.

5.4. Evolution Characteristics of Porosity in Key Aquiclude

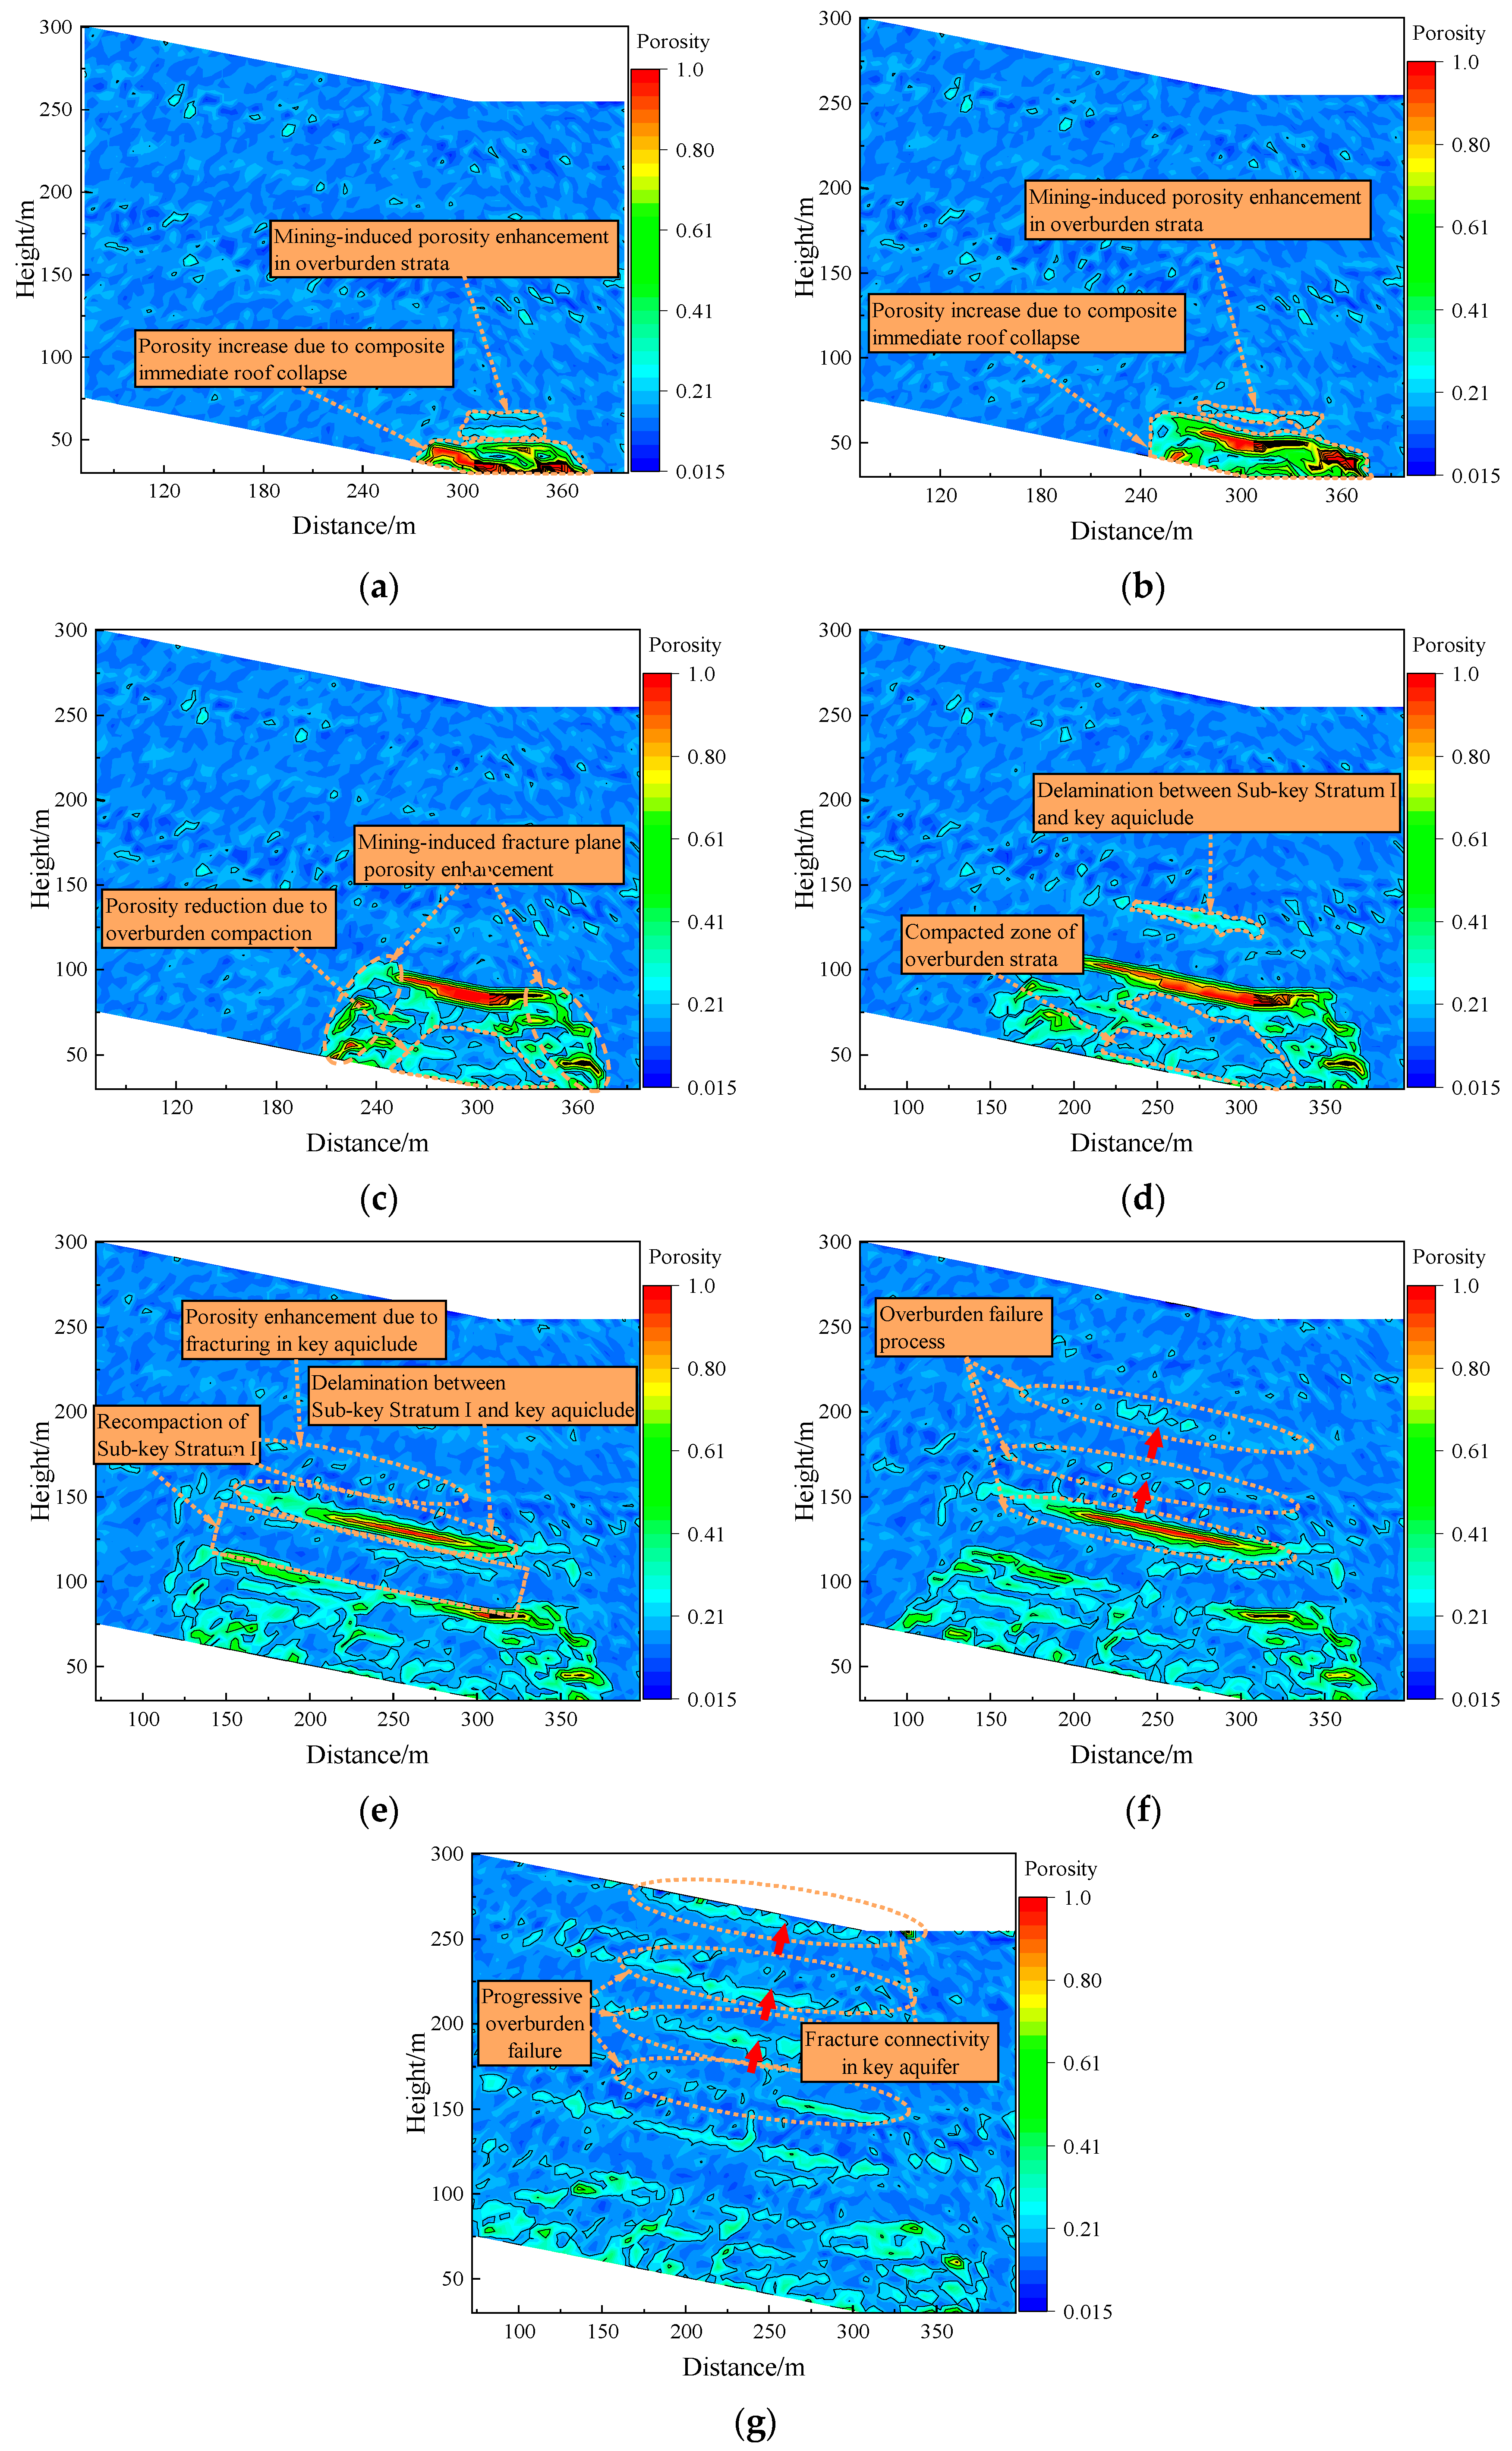
The aforementioned research macroscopically elucidates the mechanism by which the fracture of key aquifers influences the distribution characteristics of water-conducting fracture zones during anticlinal mining. However, mining activities not only induce macroscopic fracture and displacement of overburden strata but also promote fracture development and connectivity. To specifically analyze the water inrush and support instability problems frequently encountered during rise mining through anticlinal zones, measurement circles were strategically arranged between the working face and the overlying key aquiclude. Measurement circles are realized by establishing a measuring circular area in the model to cover the particles in this area to detect the relevant indexes such as porosity, coordination number, stress, strain rate, etc., in the covered area. The measurement circle in this study has a radius of 5 m, an elevation angle of 11°, and is arranged in non-overlapping layers from the top of the coal seam up to the key aquifer. This configuration enables focused investigation of fracture connectivity and porosity evolution characteristics within both the overburden and key aquiclude during rise mining. The study microscopically examines how extraction impacts fracture evolution patterns through pore-scale analysis, thereby revealing the instability mechanism of water inrush-induced support failure during rise mining. The corresponding research findings are presented in Figure 11 and Figure 12.
The following are shown in Figure 11:
(1) During the initial mining stage, the increase in overburden porosity primarily results from fracture, instability, and collapse of the composite immediate roof, along with bed separation from upper strata.
(2) With face advance, after collapsed strata undergo recompaction in the goaf area, high-porosity zones mainly exist in two locations: the bed separation area of overlying strata and fracture surfaces on both sides of the mining zone. The distribution pattern is characterized by two upturned ends and a concave middle, similar to a saddle shape.
(3) As mining progresses further, when Sub-key Stratum I approaches its initial fracture point (due to different caving intervals between Sub-key Stratum I and the key aquiclude), the porosity in the key aquiclude increases under the influence of the high-porosity bed separation zone formed in middle strata.
(4) Upon fracture of Sub-key Stratum I, rapid porosity growth occurs in the key aquiclude due to fracture development and connectivity, while the overlying aquifer remains largely unaffected. With continued face advance, as porosity keeps increasing in the key aquiclude, interlayer separation zones in overlying strata gradually connect, and internal fractures develop. When the key aquiclude fractures, synchronous fracturing occurs in upper strata, eventually propagating through entire structure to reach the key aquifer.
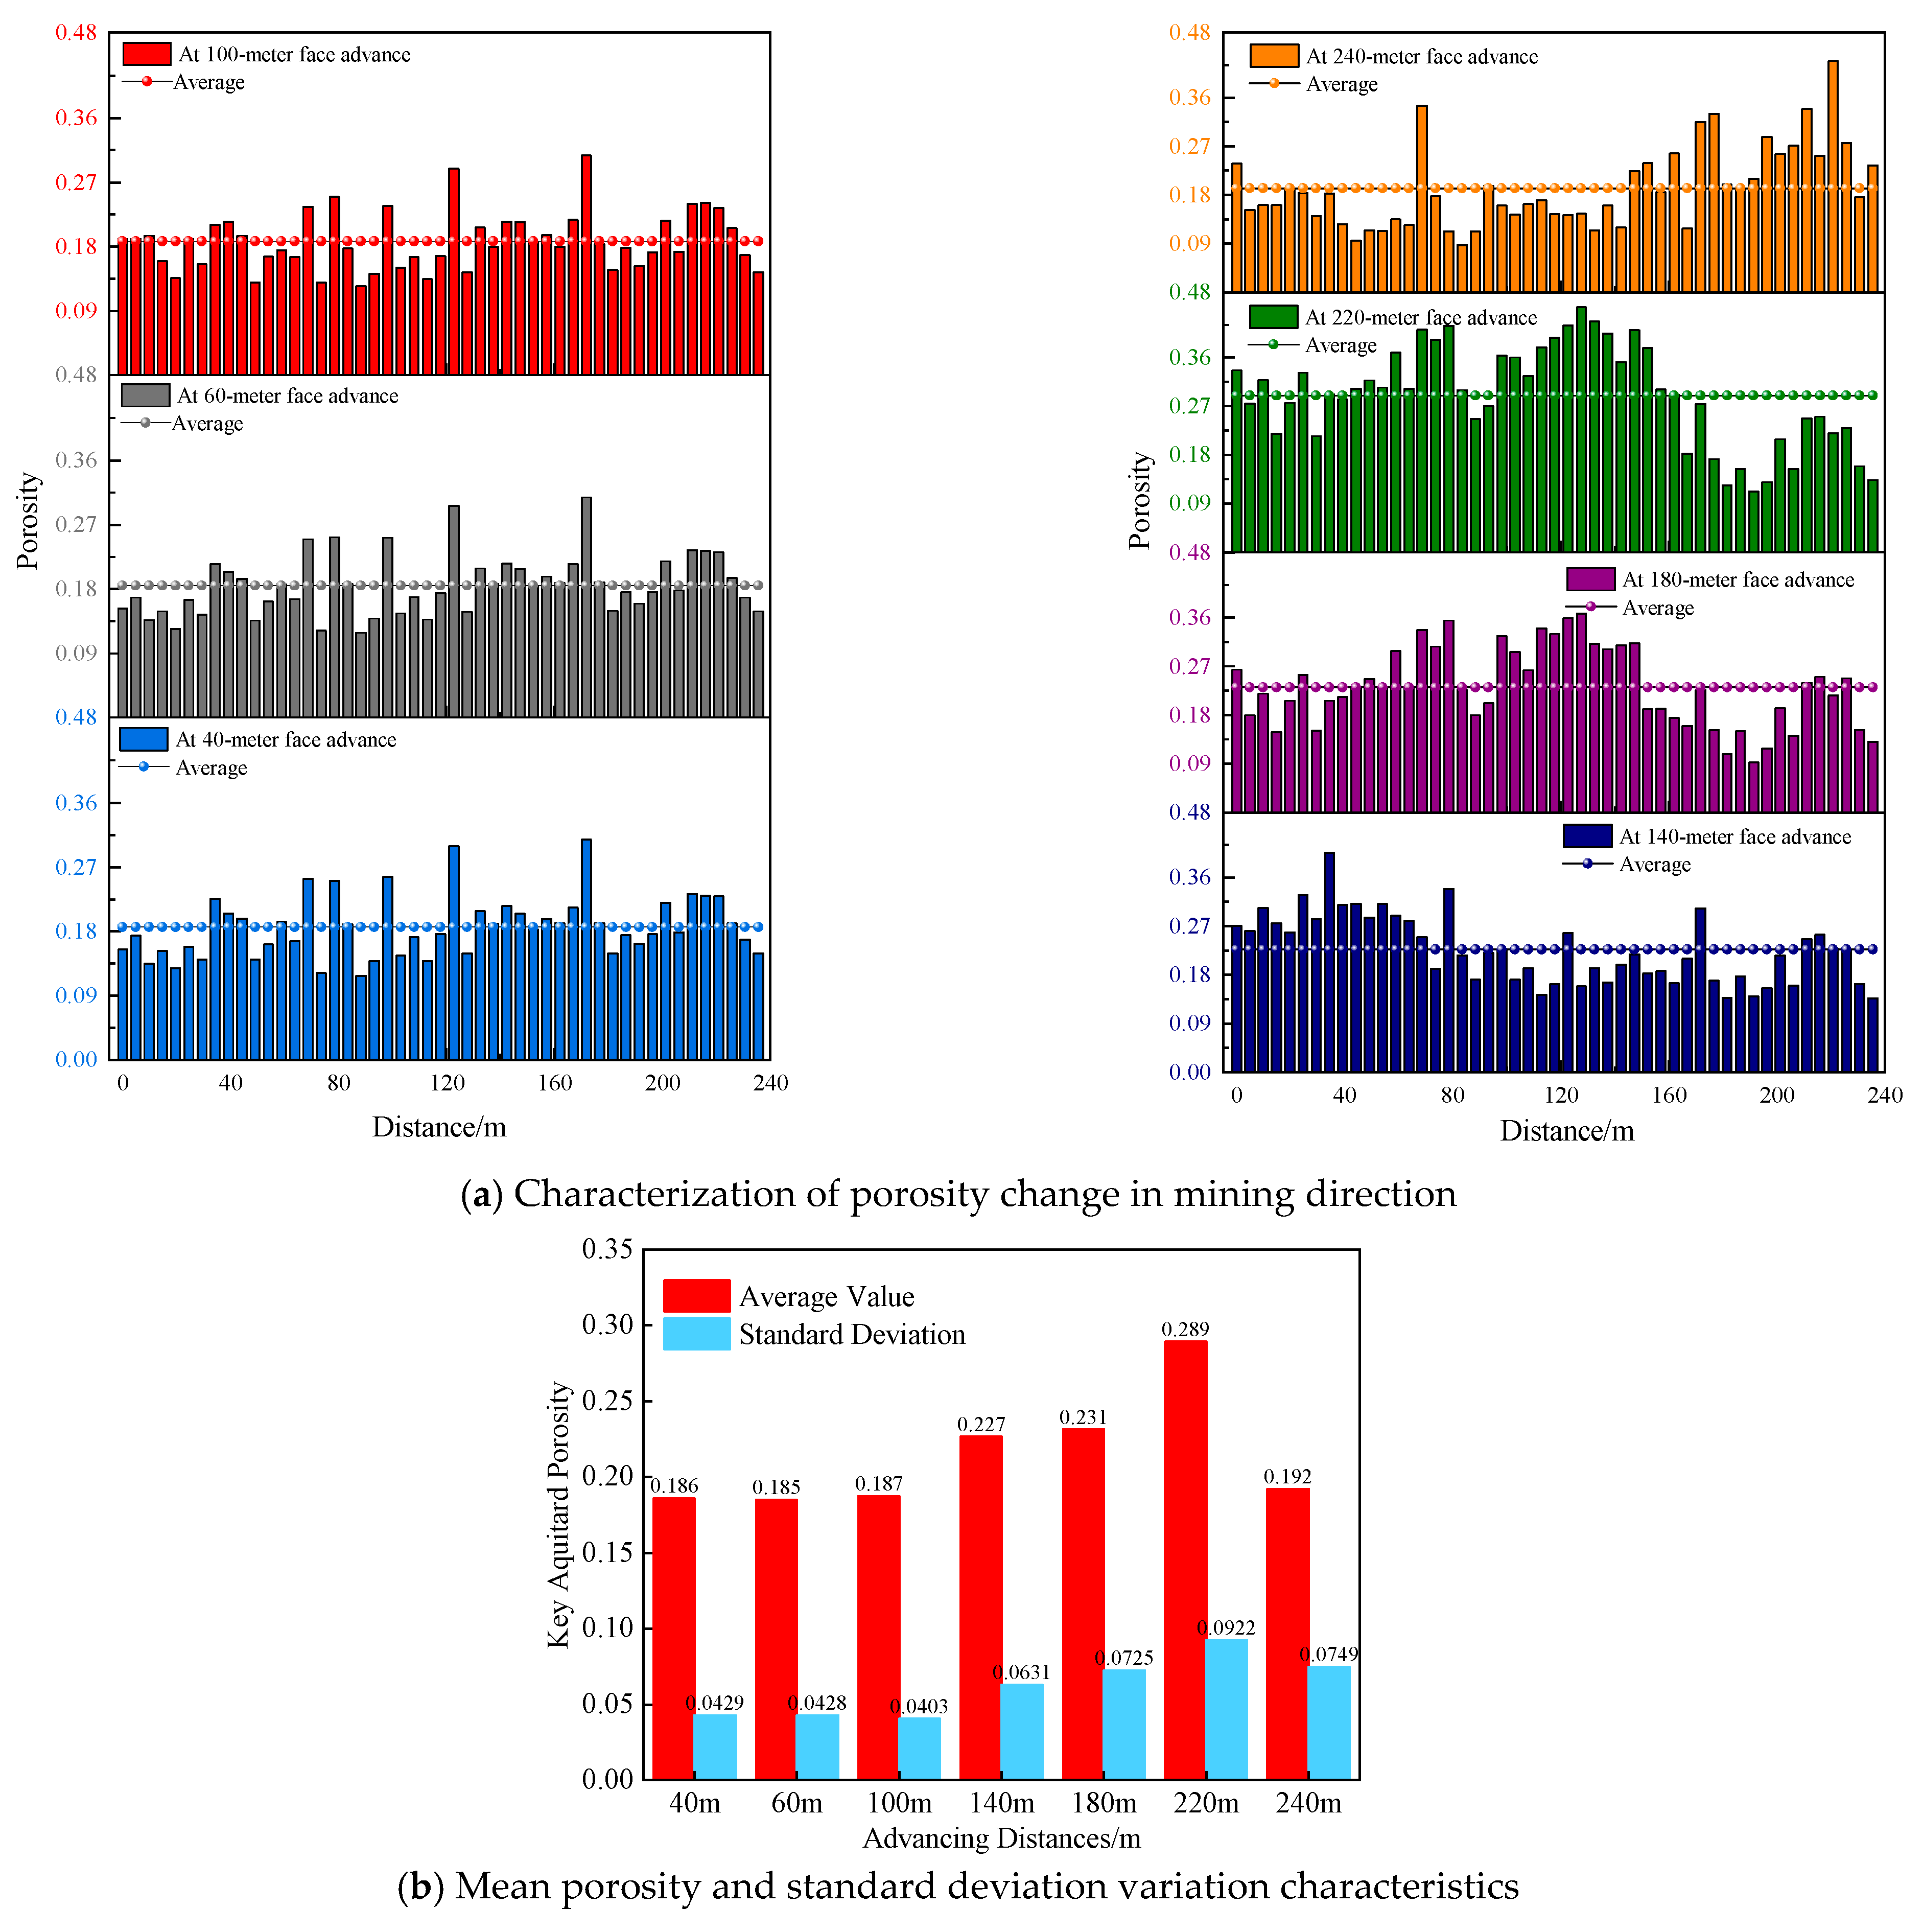
The following are shown in Figure 12:
(1) During the first 100 m of face advance, the key water-isolating layer was less affected by the breakage of the lower rock layer, with an average porosity of 0.186 and little change in the standard deviation of porosity.
(2) When the working face is pushed to 140 m, due to the existence of the angle of upward mining, the overburden rock collapse caused by the off-layer zone is biased toward the side of the mining area, the standard deviation increases to 0.0631, and the distribution of porosity shows discrete characteristics. The porosity of the key water-insulating layer within 80 m of the upward mining distance is higher than the average value of 0.227, and the maximum value of porosity is 0.406, which appears in the middle of the off-layer at 34 m. The larger value of the off-layer leads to an increase in the deformation of the rock layer, prompting the development of rock fissures, so the porosity of the peripheral rock on the side close to the extraction zone increases. The porosity of other parts is not obvious because they are far away from the working face.
(3) When the working face was pushed to 180 m, sub-critical layer I was broken, resulting in the increase in the value of the key diaphragm and the lower overburden; the average porosity increased to 0.231, the standard deviation increased to 0.0725, and the non-cooperative breakage of the key diaphragm was obvious. The main reason is that the key water-trapping layer in the range of 40~150 m from the upward mining distance is affected by the off-layer zone, the porosity in this range is generally larger than the average porosity, and the maximum value of porosity gradually shifts to the deeper part with the increase of the advancing distance.
(4) When the working face was pushed to 220 m, the value of the key water barrier and the lower rock layer gradually converged to the limit of the collapse step, and at the same time, under the influence of the high tensile stress of the backslope axis, the fissures inside the rock layer were constantly developing, penetrating, and expanding, which led to the increase of porosity in the key water-bearing layer. and The porosity of the rock layer in the backing distance of 0~160 m was generally higher than that of other advancing stages, as seen in the figure, and at this time, the average porosity of the rock layer was 0.289, which is the highest value among all advancing stages, and the standard deviation of 0.092 also reaches the maximum value, indicating that the fissure development near the axis of the backslope has high spatial non-homogeneity characteristics.
(5) When the working face was pushed to 240 m, the key water barrier was broken, which led to the breakage of the overlying 100.5 m rock layer, the fissure zone penetrated to the key aquifer, the broken rock layer was overridden above the key water barrier and synchronized with its subsidence, the maximum value of porosity in the key aquifer appeared in the vicinity of the working face after being recompacted under the influence of overlying collapsed rock layer, and the average porosity was reduced to 0.191, with a standard deviation of 18.7% compared with that of the previous stage. The average porosity decreased to 0.191, and the standard deviation value also decreased by 18.7% compared with the previous stage.

6. Discussions

The geological conditions of coal mines in the northwest region are complicated, with a large number of widely distributed inclined and dorsal inclined formations, and the problem of roof water surges occurs from time to time [3,4]. The Guojiahe Coal Mine is a typical representative of such coal mines, and the results of this study are applicable to similar coal mines.
Although the geological characteristics, coal types, and mining conditions of the Guojiahe Coal Mine are representative of the region to a certain extent, the geological environment and mining conditions of each coal mine are unique. These differences may have different impacts on the mining process, fissure evolution, and hydrological behavior of coal mines. Therefore, the generalizability of the content of this study still has some limitations. To ensure the generalizability of the results, future research can validate and improve the conclusions of the current study by conducting more extensive case studies of coal mines with different geological conditions, coal types, and mining methods.
The plastic deformation and creep effects of rocks are not considered in this paper because in the current coal mining process, the workings advance at a faster rate, and roof collapse occurs more rapidly. Specifically, mining usually undergoes a certain stage in a relatively short period of time, and in most of the mining process, the brittle destruction of rock dominates the change of mining pressure, so in this case, the creep and plastic deformation effects have relatively little influence on the deformation and stability of the roof slab [40]. Therefore, the elastic–brittle approach without time dependence is used for modeling in this paper.
This paper adopts the 2DPFC model because the paper mainly studies the relationship between the advancing distance and the change in the overlying rock layer in the advancing process of the working face, and it can be seen from Figure 1 (the geological conditions of the 1309 working face) that the average inclination angle of the overall coal seam is 6°, and there is no big fault or other complex geological structure, so the angle of the coal seam is more gentle, the coal seam is more continuous, and the working face is considered to be mainly in the stage of backslope mining. At the same time, considering that the water surge pressure in the working face mainly occurs in the backslope upward mining stage, in order to simplify the analysis of the development and evolution characteristics of the overburden rock breakage and transport fissure in the upward mining stage, the research object is regarded as a planar strain problem to be analyzed. Although the 2D model cannot fully capture the complexity of 3D geological structures, it is able to effectively simulate major geological features in some cases, especially in terms of fracture evolution and major tectonic stress distribution. The use of a 2D model simplifies the computational process and also provides a clearer framework for preliminary analysis. In addition, since the main objective of the study was to explore macroscopic fracture development trends and the influence of geotectonics on water flow, the 2D model can still provide valuable results.
However, the simplification of the 2D model cannot ignore its shortcomings in accuracy and comprehensiveness, especially in the face of the complex 3D geologic environment. In order to improve the accuracy and applicability of the model, a 3D PFC model will be used for subsequent studies. The 3D model can better simulate the spatial distribution of fissures and geological formations and provide more detailed analysis of fluid infiltration paths, which can more accurately reflect the fissure evolution and water flow behavior under actual geological conditions [41]. In addition, subsequent studies will consider coupling the seepage model with the geomechanical model to further improve the accuracy of hydrological prediction, especially in the application of multilevel and complex geological environments.
In addition, although the current numerical model is calibrated based on the physical and mechanical properties of sandstone and claystone, the basic framework of the model can be adapted to other types of formations, such as limestone, by adjusting the relevant physico-mechanical parameters (e.g., modulus of elasticity, compressive strength, permeability, etc.) of different minerals [41]. When extending the model, it is recommended to obtain specific mechanical parameters of formations with different mineral compositions through field data or laboratory tests and, thus, further calibrate the model. This will help to validate the applicability of the model under a wider range of geological conditions and further enhance the generalizability of the model.
Regarding the permeability of rocks, through the analysis of rock boreholes, we found that the difference in permeability of rocks is not significant but is mainly affected by the cracks; the existence and development of cracks play a decisive role in permeability, and the permeability can be ignored by controlling the integrity and continuity of the diaphragm. These factors can be further explored in future studies to extend the applicability of the model.
Based on the symbiosis mechanism of a sudden water pressure shelf, avoiding the slip and destabilization of the water-insulating key layer is the key to ensuring that no pressure shelf accident occurs in the working face [21]. In order to ensure the safe production of the working face, it is necessary to control the development height of the water-conducting fissure zone below the water-isolating key layer and ensure the water-isolating key layer does not fracture; if the height of the water-conducting fissure zone exceeds that of the water-isolating key layer, it is necessary to make sure that the pressure of the pressurized water is not more than 1.02 MPa. In this regard, the following measures are proposed: (1) Control of mining height and length of mining face: The height of water-conducting fissure zone is positively correlated with the mining height of the coal seam and the length of the working face, and the reasonable reduction of the mining height of the coal seam and the length of the working face can effectively reduce the height of the development of the fissure zone and prevent the water breakout of the aquifer. In order to prevent the water-conducting fissure zone from leading to the Yijun group aquifer, the mining height of the coal seam should be reduced to less than 10 m, or the length of the working face should be controlled to less than 180 m. (2) Pre-cracking the rock layer below the key water barrier: There are several layers of thick rock layer more than 10 m below the key water barrier, and after breaking the thick rock layer, the degree of swelling is low, which leads to a large space for the roof overlaying rock to separate from the layer, and the water-conducting fissure zone develops upward and leads to the key water barrier layer. The development of water-conducting fissure zone can be effectively limited by pre-cracking the thick rock layer on the roof plate through blasting and hydraulic fracturing and increasing the height and degree of fracture expansion of the fallout zone. (3) Advance dewatering of overlying rock aquifer: It is necessary to strengthen the mine’s water prevention and control work, advance dewatering of the Yijun group aquifer, and reduce the pressure of pressurized water so that the pressure of pressurized water in the Yijun group aquifer is not more than 1.02 MPa, so as to ensure that the key layer of water insulation will not be destabilized by sliding down.

7. Conclusions

(1) The large slope angle of the anticlinal structure zone and the high elevation difference between the slope starting point and the axis are the causes of water inrush and support failure in Panel 1309. The conglomerate of the Yijun Formation is the key aquifer leading to water inrush, while the coarse sandstone in the Anding Formation is the key aquiclude. This conclusion helps us to understand the mechanism of the occurrence of water surges in the working face, so that we can take more effective preventive and control measures under similar geological conditions.
(2) Affected by the slope angle, during the rise mining stage, both the overburden fracture and the maximum bed separation zone are biased towards the goaf side. During mining, the water-conducting fracture zone always first expands along the advance direction of the working face, with its development width being greater than its height. When the fracture of key aquiclude causes the collapse of overlying strata, the water-conducting fracture zone connects to the key aquifer, with its development height becoming greater than its width. Through this analysis, the expansion pattern of the overburden fissure zone can be better predicted, which is of great significance for the safety assessment and fissure control of the subsequent back-mining work.
(3) During mining, the fracture development speed caused by the initial fracture of the composite immediate roof, the initial fracture of Sub-key Stratum I, and the initial fracture of the key aquiclude is faster than that caused by periodic fracture of the main roof. Among them, the fracture caused by the fracture of the key aquiclude and synchronous collapse of overlying strata produces the most fractures and develops the fastest. This conclusion provides a basis for monitoring and evaluating the fissures during the back-mining process, which can help optimize the mining plan and reduce the risk of water surges.
(4) The fracture surface on one side of the working face and the bed separation zone of overlying strata together form a “saddle-shaped” high porosity area, whose distribution range is positively correlated with the advance distance. During mining, the porosity change in the key aquiclude shows three stages with advance distance—first unchanged, then increased, and finally decreased—with the highest porosity occurring when the key stratum reaches its ultimate caving interval and fractures. Among them, the ultimate collapse step refers to the maximum mining distance corresponding to the beginning of deformation to the eventual monolithic collapse of the roof rock layer when the mining void zone is expanding. This finding is crucial for understanding the relationship between porosity changes and the back-mining process and may provide a reference for the prediction of water permeability in subsequent mines.
In addition, the conclusions of this study are mainly based on numerical simulation, theoretical analysis, similar simulations, and other aspects of the study, but considering the complexity of the actual geological conditions, there is a subsequent need to carry out on-site measurements of the experimental results of the control analysis in order to prove the reliability of the experimental results.

Author Contributions

Conceptualization, J.W.; methodology, J.W.; software, H.L.; validation, X.Y. and H.G.; formal analysis, J.W.; investigation, H.G.; resources, H.L.; data curation, S.L., X.Y. and H.G.; writing—original draft preparation, S.L.; writing—review and editing, C.L.; visualization, H.L.; supervision, Changyou Liu; project administration, S.L.; funding acquisition, C.L., X.Y. and S.L. All authors have read and agreed to the published version of the manuscript.

Funding

This research was funded by National Natural Science Foundation of China, grant number 52074267, Postgraduate Research & Practice Innovation Program of Jiangsu Province, grant number: KYCX23_2795; KYCX25_2922. The APC was funded by National Natural Science Foundation of China.

Institutional Review Board Statement

Not applicable.

Informed Consent Statement

Not applicable.

Data Availability Statement

The data that support the findings of this study are available on request from the corresponding author upon reasonable request.

Acknowledgments

The work was supported by the National Natural Science Foundation of China (No. 52074267). The work was supported by the Postgraduate Research & Practice Innovation Program of Jiangsu Province Nos. KYCX23_2795 and KYCX25_2922). The authors gratefully acknowledge the financial support of the agencies mentioned above.

Conflicts of Interest

The authors declare no conflicts of interest.

References

  1. Lyu, X.; Yang, K.; Fang, J. Utilization of resources in abandoned coal mines for carbon neutrality. Sci. Total Environ. 2022, 822, 153646. [Google Scholar] [CrossRef] [PubMed]
  2. Zhang, D.; Zhao, M.; Wang, Y.; Vigne, S.A.; Benkraiem, R. Technological innovation and its influence on energy risk management: Unpacking China’s energy consumption structure optimisation amidst climate change. Energy Econ. 2024, 131, 107321. [Google Scholar] [CrossRef]
  3. Fan, G.; Zhang, S.; Zhang, D.; Zhang, C.; Chen, M.; Li, Q. An Index of Aquiclude Destabilization for Mining-Induced Roof Water Inrush Forecasting: A Case Study. Water 2019, 11, 2170. [Google Scholar] [CrossRef]
  4. Wang, W.; Li, Z.; Du, F.; Cao, Z.; Li, G. Study of Roof Water Inrush Control Technology and Water Resources Utilization During Coal Mining in a Karst Area. Mine Water Environ. 2023, 42, 546–559. [Google Scholar] [CrossRef]
  5. Shi, L.; Qu, X.; Qiu, M.; Han, J.; Zhang, W. Water-inrush mechanism from the head-on working face roof in a Jurassic coal seam in the Ordos Basin. PLoS ONE 2024, 19, e0298399. [Google Scholar] [CrossRef]
  6. Sun, X.; Liu, K.; Jin, T.; Wang, K.; Lin, S.; Pang, J.; Xie, J. Dynamic mechanical response and failure characteristics of coal and rock under saltwater immersion conditions. Sci. Rep. 2024, 14, 11869. [Google Scholar] [CrossRef] [PubMed]
  7. Zheng, L.; Wang, X.; Lan, H.; Ren, W.; Tian, Y.; Xu, J.; Tian, S. Study of the development patterns of water-conducting fracture zones under karst aquifers and the mechanism of water inrush. Sci. Rep. 2024, 14, 20790. [Google Scholar] [CrossRef]
  8. Shi, X.; Lyu, G. Mechanism of Bed Separation Water Inrush during the Mining of Extra-Thick Coal Seam under Super-Thick Sandstone Aquifer. Sustainability 2023, 15, 10599. [Google Scholar] [CrossRef]
  9. Li, H.; Chen, Q.; Shu, Z.; Li, L.; Zhang, Y. On prevention and mechanism of bed separation water inrush for thick coal seams: A case study in China. Environ. Earth Sci. 2018, 77, 759. [Google Scholar] [CrossRef]
  10. Sui, W.; Liu, J.; Gao, B.; Liang, Y. A review on disaster mechanism of quicksand with a high potential energy due to mining and its prevention and control. J. China Coal Soc. 2019, 44, 2419–2426. [Google Scholar]
  11. Xiao, L.; Li, F.; Niu, C.; Dai, G.; Qiao, Q. Evaluation of Water Inrush Hazard in Coal Seam Roof Based on the AHP-CRITIC Composite Weighted Method. Energies 2023, 16, 114. [Google Scholar] [CrossRef]
  12. Cheng, W.; Yin, H.; Xie, D.; Dong, F.; Li, Y.; Zhu, T.; Wang, J. Prediction of dominant roof water inrush windows and analysis of control target area based on set pair variable weight-Forward correlation cloud model. J. Clean. Prod. 2024, 483, 144253. [Google Scholar] [CrossRef]
  13. Zeng, Y.; Wu, Q.; Du, X.; Liu, S.; Zan, J.; Dou, G.; Wu, Z. Further research on “water-richness index method” for evaluation of aquifer water abundance. J. China Coal Soc. 2020, 45, 2423–2431. [Google Scholar]
  14. Zhang, J.; Yang, T. Study of a roof water inrush prediction model in shallow seam mining based on an analytic hierarchy process using a grey relational analysis method. Arab. J. Geosci. 2018, 11, 153. [Google Scholar] [CrossRef]
  15. Zhang, J.; Yang, T.; Wang, B.; Zhao, Q.; Liu, D.; Ren, Y. Prediction analysis of roof water-inrush in shallow coal seam with surface valley runoff. J. Min. Saf. Eng. 2017, 34, 868–875. [Google Scholar]
  16. Enke, H.O.; Yan, Y.; Wen, Q.; Che, X.; Miao, Y.; Li, H.; Lu, B. Study on prediction of water inrush hazard in roof of roadway driving. Coal Sci. Technol. 2022, 50, 110–120. [Google Scholar]
  17. Qiao, W.; Wang, Z.; Li, W.; Lü, Y. Formation mechanism, disaster-causing mechanism and prevention technology of roof bed separation water disaster in coal mines. Journal of China Coal Society 2021, 46, 507–522. [Google Scholar]
  18. Wang, Z.; Tang, S.; Li, M.; Wu, S.; Sun, W.; Li, J.; Shui, Y. Development and application of overburden structure composed of caving arch and towering roof beam in deep longwall panel with thin bedrock. J. China Coal Soc. 2023, 48, 563–575. [Google Scholar]
  19. Wu, M.; Hu, N.; Ye, Y.; Wang, X. Multi-hazard risk characterization and collaborative control oriented to space in non-coal underground mines. Sci. Rep. 2022, 12, 16452. [Google Scholar] [CrossRef]
  20. Liu, C.; Liu, H.; Chen, Y.; Yang, P.; Wang, C.; Yang, J. Failure laws of overburden and mechanisms of water inrush and support crushing in extra-thick coal seam mining within anticline structural. J. Min. Saf. Eng. 2025, 42, 239–251. [Google Scholar]
  21. Liu, H.; Liu, C.; Yang, P.; Wang, C.; Yang, J. Structural stability of overlying rock and mechanism of water inrush and support rushing in extra-thick coal seam mining within syncline structural area. J. China Coal Soc. 2024, 49, 3745–3758. [Google Scholar]
  22. Wang, X.; Han, H.; Fu, X.; Yang, Y. Linkage type between water level in confined aquifer and over burden movement and its application. J. Min. Saf. Eng. 2020, 37, 247–253. [Google Scholar]
  23. Wang, X.; Xu, J.; Zhu, W.; Hao, H. Overburden structure influence to support crushing and water inrush during mining under unconsolidated confined aquifer. J. Min. Saf. Eng. 2014, 31, 838–844. [Google Scholar]
  24. Zhou, X.; Ouyang, Z.; Zhou, R.; Ji, Z.; Yi, H.; Tang, Z.; Chang, B.; Yang, C.; Sun, B. An Approach to Dynamic Disaster Prevention in Strong Rock Burst Coal Seam under Multi-Aquifers: A Case Study of Tingnan Coal Mine. Energies 2021, 14, 7287. [Google Scholar] [CrossRef]
  25. Wang, B.; Feng, G.; Jiang, F.; Ma, J.; Wang, C.; Li, Z.; Wu, W. Investigation into Occurrence Mechanism of Rock Burst Induced by Water Drainage in Deep Mines. Sustainability 2023, 15, 8891. [Google Scholar] [CrossRef]
  26. Vu, T.T.; Do, S.A. Determination of the rock mass displacement zone by numerical modeling method when exploiting the longwall at the Nui Beo Coal Mine, Vietnam. Min. Miner. Depos. 2023, 17, 59–66. [Google Scholar] [CrossRef]
  27. Matayev, A.; Uakhitova, B.; Kaumetova, D.; Imangazin, M.; Sarkulova, Z.; Issengaliyeva, G.; Orazbekova, R. Substantiation and selection of parameters for supporting mine workings at deep levels. Min. Miner. Depos. 2024, 18, 125–138. [Google Scholar] [CrossRef]
  28. Ye, Z.; Hou, E.; Duan, Z. Micrometer-scale pores and fractures in coals and the effects of tectonic deformation on permeability based on fractal theory. AlP Adv. 2020, 10, 025118. [Google Scholar] [CrossRef]
  29. Velychkovych, A.; Mykhailiuk, V.; Andrusyak, A. Numerical model for studying the properties of a new friction damper developed based on the shell with a helical cut. Appl. Mech. 2025, 6, 1. [Google Scholar] [CrossRef]
  30. Shatskyi, I.; Velychkovych, A. Analytical model of structural damping in friction module of shell shock absorber connected to spring. Shock. Vib. 2023, 2023, 4140583. [Google Scholar] [CrossRef]
  31. Landar, S.; Velychkovych, A.; Ropyak, L.; Andrusyak, A. A method for applying the use of a smart 4 controller for the assessment of drill string bottom-part vibrations and shock loads. Vibration 2024, 7, 802–828. [Google Scholar] [CrossRef]
  32. Xu, J.; Qian, M. Method to distinguish key strata in overburden. J. China Univ. Min. Technol. 2000, 05, 21–25. [Google Scholar]
  33. Tao, Z.; Zhu, C.; He, M.; Karakus, M. A physical modeling-based study on the control mechanisms of Negative Poisson’s ratio anchor cable on the stratified toppling deformation of anti-inclined slopes. Int. J. Rock Mech. Min. Sci. 2021, 138, 104632. [Google Scholar] [CrossRef]
  34. Peng, L.; Hu, X.; Su, G.; Qin, Z.; Lu, H.; He, B. Cracking characteristics of the surrounding rocks of a hydraulic tunnel under high geothermal conditions: A model test. Rock Mech. Rock Eng. 2021, 54, 1369–1390. [Google Scholar] [CrossRef]
  35. Tu, S. Experimental Methods and Real-World Measurement Techniques for Rock Control; China University of Mining and Technology Press: Xuzhou, China, 2010. [Google Scholar]
  36. Hou, E.; Cong, T.; Xie, X.; Wei, J. Ground surface fracture development characteristics of shallow double coal seam staggered mining based on particle flow. J. Min. Strat. Control. Eng. 2020, 2, 20–28. [Google Scholar]
  37. Liu, G.; Wang, Z.; Cui, Y.; Ma, Q.; Yan, L.; Han, Y. Mechanism of rock burst in deep coal tunnel surroundings due to three-way stress difference gradient. J. China Coal Soc. 2023, 48, 2106–2122. [Google Scholar]
  38. Zhou, N.; Zhang, J.; Xu, J.; Yan, Y.; Ma, H. Research on prediction of the height of water-conducting fracture zone in Huanglong Jurassic Coalfield. Coal Sci. Technol. 2023, 51, 231–241. [Google Scholar]
  39. Zhou, N.; Zhang, J.; Xu, J.; Zhang, Y.; Li, Z. Rock control mechanism of gangue grouting and interval backfilling in post-mining space under aquifer in China’s western mining area. Chin. J. Rock Mech. Eng. 2025, 44, 1736–1751. [Google Scholar]
  40. Meng, Q.; Zhang, X.; Ge, Z.; Han, X.; An, G. Time-dependent analysis of bolt-grouting support structures in deep roadways. Chin. J. Rock Mech. Eng. 2025, 44, 1420–1437. [Google Scholar] [CrossRef]
  41. Song, Z.; Konietzky, H.; Herbst, M. Three-dimensional particle model based numerical simulation on multi-level compressive cyclic loading of concrete. Constr. Build. Mater. 2019, 225, 661–677. [Google Scholar] [CrossRef]
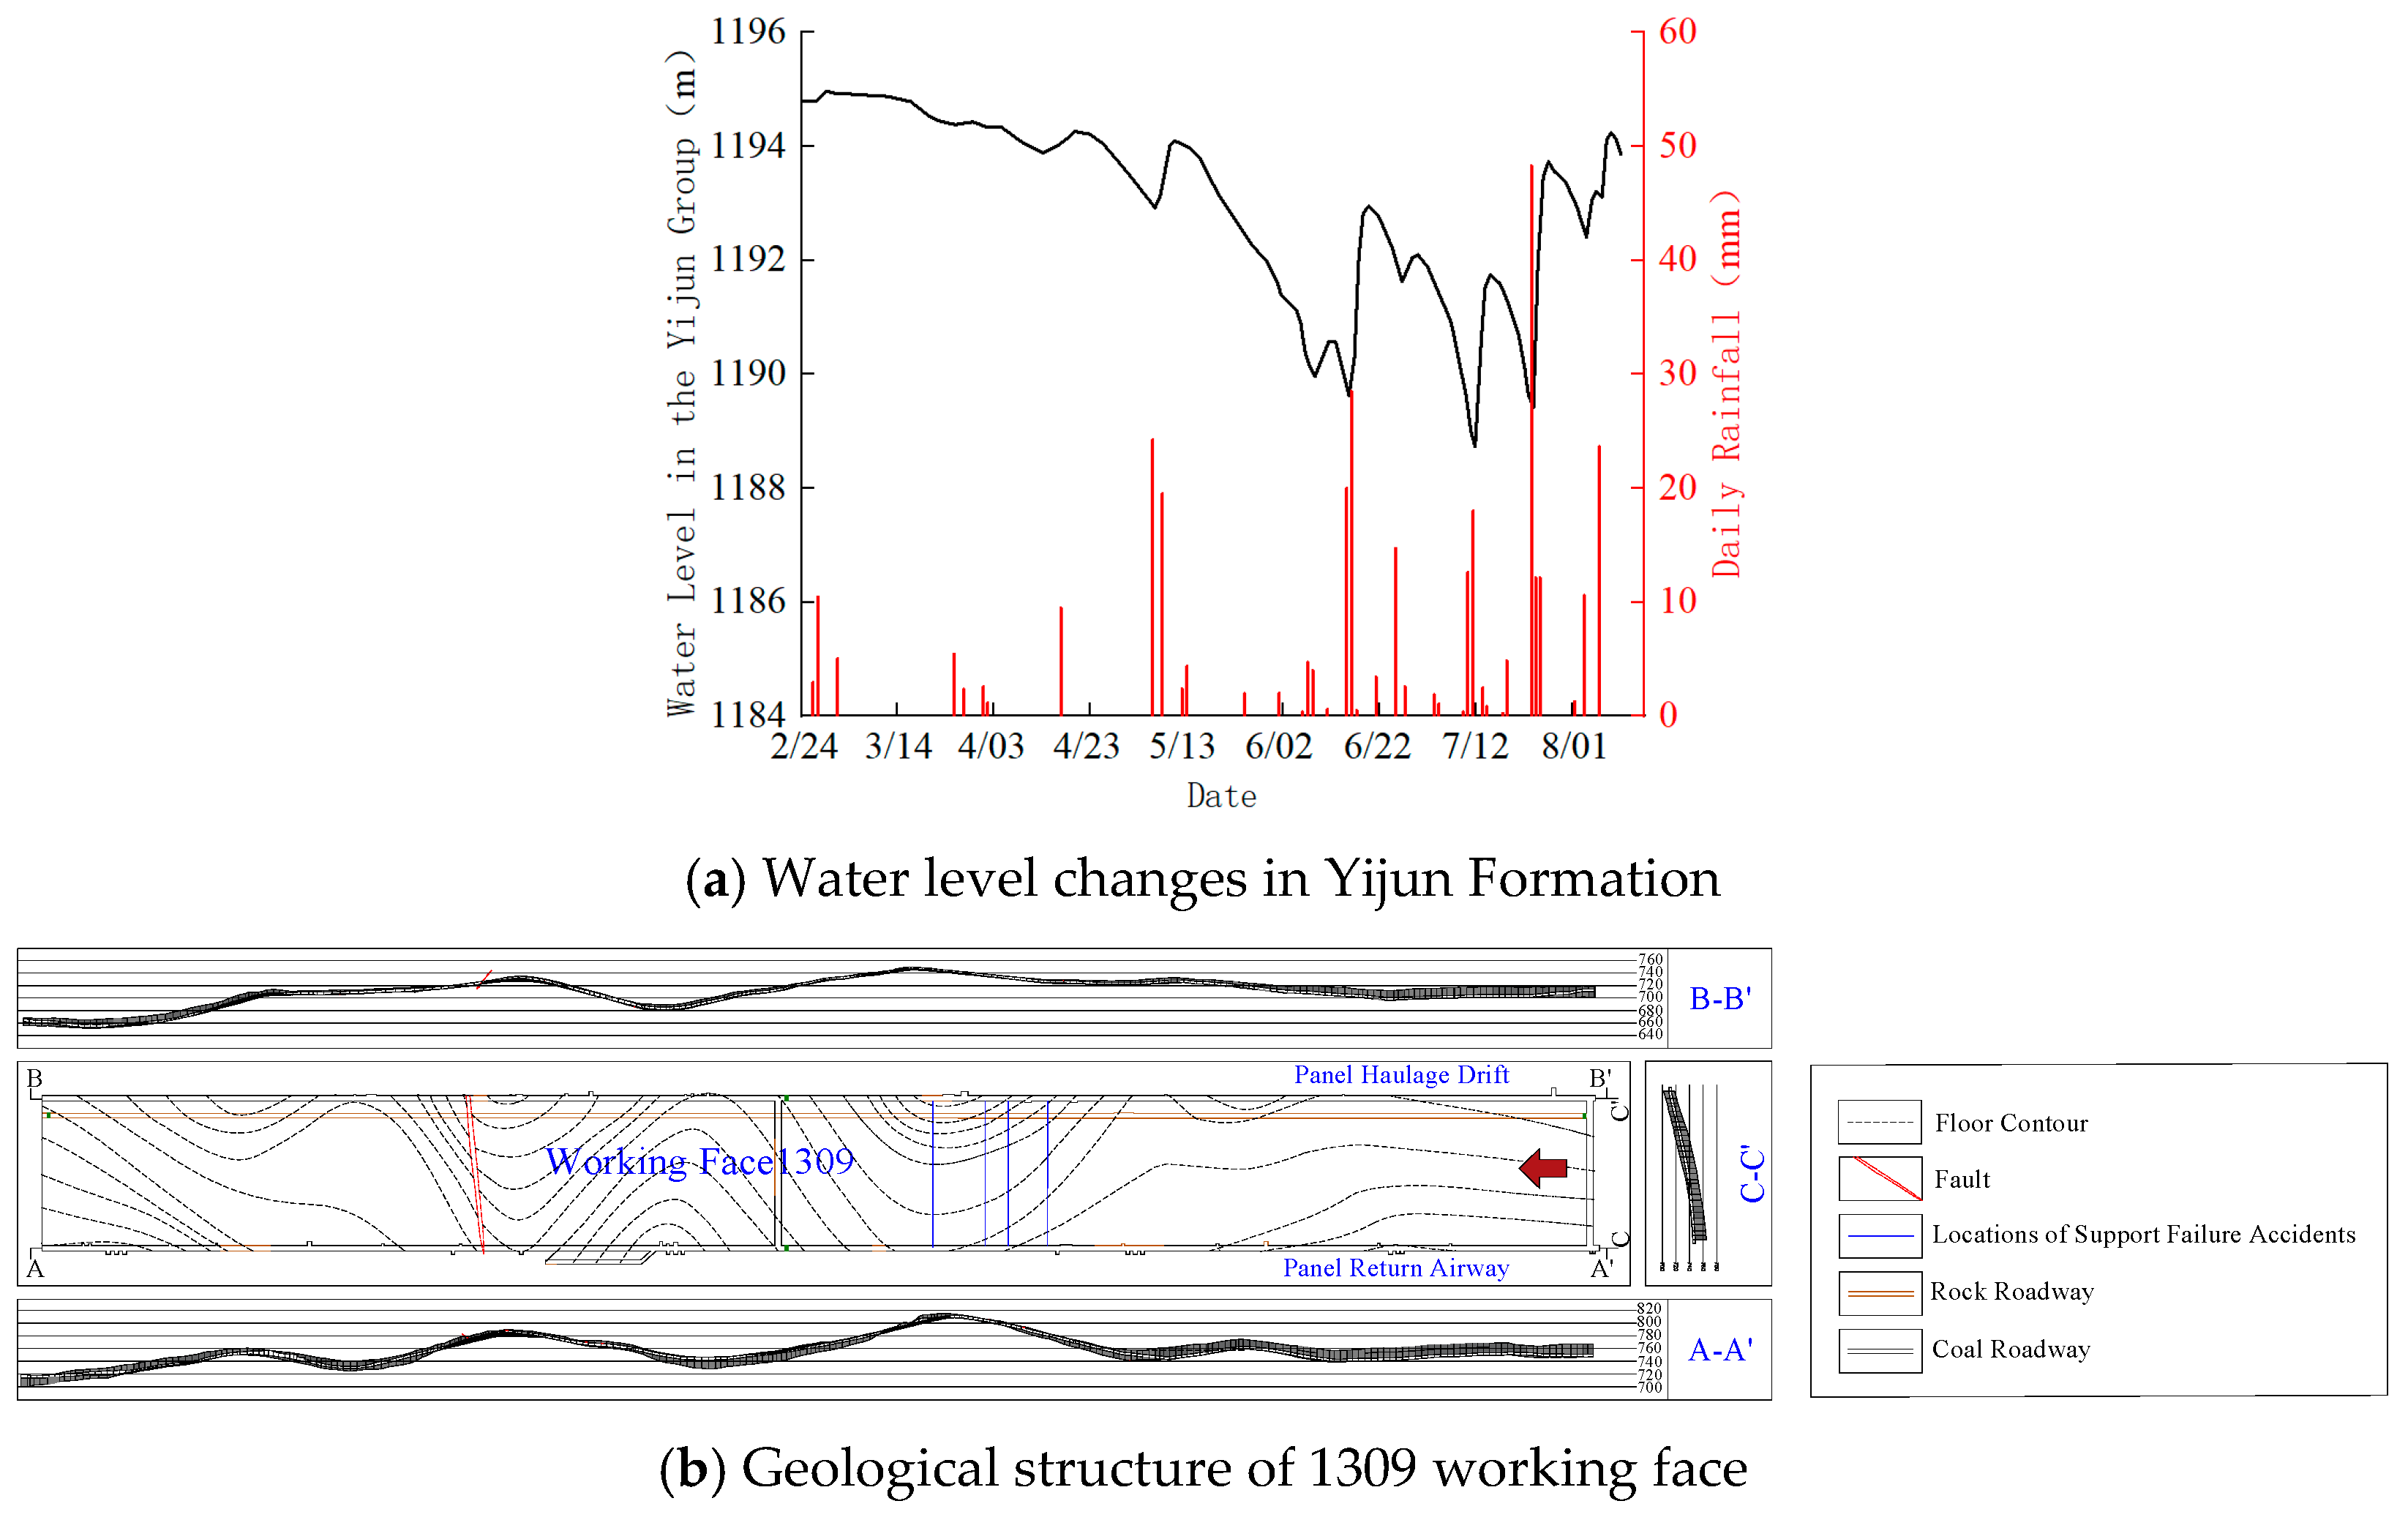
Figure 1. Information of support failure accidents in working face 1309.
Applsci 15 08812 g001
Figure 2. Piper diagram of water quality.
Applsci 15 08812 g002
Figure 3. The 1309 working face coal and rock formation parameters.
Applsci 15 08812 g003
Figure 4. Physical similar material model.
Applsci 15 08812 g004
Figure 5. Fracture process of overlying rock in anticline stage (The red dotted line represents the upper edge of the caving zone).
Applsci 15 08812 g005
Figure 6. Picture of the core removed from the drill hole.
Applsci 15 08812 g006
Figure 7. Numerical simulation computing model.
Applsci 15 08812 g007
Figure 8. Distribution characteristics of overburden rocks under different mining stages: (a) 40 m, (b) 100 m, (c) 140 m, (d) 180 m, (e) 220 m, (f) 240 m, (g) 260 m, (h) 320 m, and (i) 340 m.
Applsci 15 08812 g008
Figure 9. Distribution characteristics of angular intervals of mining overburden fissures: (a) 40 m, (b) 100 m, (c) 140 m, (d) 180 m, (e) 220 m, (f) 240 m, (g) 260 m, (h) 320 m, and (i) 340 m.
Applsci 15 08812 g009
Figure 10. Characteristics of overburden fissure evolution during the mining process.
Applsci 15 08812 g010
Figure 11. Porosity distribution characteristics of overburden rock under different mining stages: (a) 40 m, (b) 60 m, (c) 100 m, (d) 140 m, (e) 180 m, (f) 220 m, and (g) 240 m. (The red arrow indicates the direction of transmission of mining impact.)
Applsci 15 08812 g011
Figure 12. Characteristics of porosity evolution in key water traps at different propulsion distances.
Applsci 15 08812 g012
Table 1. Fold structural parameters of 1309 working face.
Serial NumberStructural TypesThrow
(m)
Working Face Inclination
(°)
1Anticline17.557.51
2Synclines17.42−6.74
3Anticline55.7310.93
4Synclines66.63−10.86
5Anticline41.858.12
6Synclines48.12−11.77
7Anticline20.097.56
8Synclines41.29−7.41
Note: “Throw” refers to the vertical displacement between layers on either side of the fault. “Inclination” refers to the angle at which the layer or fault plane is inclined relative to the horizontal.
Table 2. Water quality results table.
Serial NumberWater SamplesNa+Mg2+Ca2+ClSO42−HCO3Mineralization (mg·L−1)
1The river water of Xiao’anchuan12.9518.1588.708.3241.04317.75489.68
2The water of ground ditch12.5717.6167.844.2030.11263.59404.35
3No. 7 discharge hole38.3516.1324.9520.7238.42177.01320.44
4TS5-2 hole2411.6141.45161.584161.2512.40134.456934.36
5TS8-1 hole2662.9041.92156.344600.741.15135.907610.28
6The open-off cut roof watering of 13092825.1449.84240.825042.136.68214.928406.90
7The belt lane head of 13092967.6253.04248.075288.171.03324.278904.21
8The 103rd drain for water of 1309677.823.0819.10805.93109.23349.191985.08
9The rear chute lower outlet of 1309276.210.867.22167.79107.60287.77871.14
10The 49th frame of the spray water of 1309266.931.009.05158.22109.58248.59836.44
11The upper exit of 1309483.141.8914.88436.47184.93358.861485.38
12The lower exit of 1309489.482.9120.91488.45140.60388.851549.03
13Yan’an group water1322.2719.2752.192050.0017.49213.173674.39
14Yijun group water—159.0931.8436.5224.9832.17329.19513.79
15Yijun group water—232.2030.0268.54384.6536.636.76558.80
Table 3. The 1309 working face coal and rock formation parameters.
Rock StratumDensity
(kg/m3)
Elastic Modulus (GPa)Poisson’s RatioCompressive Strength
(MPa)
Friction
Angle (°)
Cohesion
(MPa)
Tensile Strength
(MPa)
Conglomerate280015.610.23103.8036.3113.234.14
Sandy mudstone27009.320.2549.8030.817.262.91
Coarse sandstone280015.610.23103.8036.3113.234.14
Gritty sandstone280015.610.23103.8036.3113.234.14
Fine sandstone24507.840.1528.0027.737.491.43
Medium sandstone260011.410.2365.9032.8910.722.12
Composite immediate roof27009.320.2549.8030.817.262.91
Coal140010.240.2715.3341.874.280.96
Floor24507.840.1528.0027.737.491.43
Table 4. Meaning of symbols.
SymbolsMeaningSymbolsMeaning
Ethe elastic modulus, GPa σ ¯ the parallel bond normal strength, MPa
Ecthe parallel bond modulus, GPa τ ¯ the parallel bond shear strength, MPa
k n k s the stiffness ratio σ t the tensile strength, MPa
a 1 1.652 a 2 −0.965
b 1 −0.395 b 2 2.292
μPoisson’s ratio c 2 1.327
c 1 0.209 a 3 −0.174
d 1 0.111 b 3 0.463
σ c the compressive strength, MPa c 3 0.289
Table 5. Fine mechanical parameters of each rock layer.
Rock StratumStiffness RatioElastic Modulus
(GPa)
PB Stiffness RatioPB Modulus
(GPa)
PB Normal Strength
(MPa)
PB Shear Strength
(MPa)
Conglomerate1.7710.921.7710.9210.75
Sandy mudstone1.956.711.956.7110.75
Coarse sandstone1.7710.921.7710.9210.75
Gritty sandstone1.7710.921.7710.9210.75
Fine sandstone1.214.961.214.9610.75
Medium sandstone1.7710.921.7710.9210.75
Composite immediate roof1.956.711.956.7110.75
Coal2.147.592.147.5910.75
Floor1.214.961.214.9610.75
Disclaimer/Publisher’s Note: The statements, opinions and data contained in all publications are solely those of the individual author(s) and contributor(s) and not of MDPI and/or the editor(s). MDPI and/or the editor(s) disclaim responsibility for any injury to people or property resulting from any ideas, methods, instructions or products referred to in the content.