Abstract
The Gross Motor Function Measure-66 (GMFM-66, range of values: 0 to 100 points) is one of the most widely used clinical tests to quantify motor function in children with cerebral palsy (CP). A disadvantage of the GMFM-66 is that it can take up to one hour to complete. The aim of the study was to evaluate whether the GMFM-66 can be predicted with sufficient accuracy by the results of an instrumental gait analysis (IGA) in ambulant children with CP. A retrospective analysis was conducted on n = 256 ambulant children with CP enrolled in a rehabilitation program between 2018 and 2023. The sample consisted of 97 females and 159 males, with a mean age of 9.0 years (SD 3.6 years). The IGA was performed with a Zebris FDM pressure plate. For the prediction of the GMFM-66, different statistical models were used (multiple linear regression and machine learning algorithms). Among the models considered, the XGBoost model had the best predictive performance (mean absolute error 6.32 (95%CI 5.35–7.28)). Agreement between results from gait analyses by the Zebris FDM pressure plate and GMFM-66 is not yet sufficient to predict the GMFM-66 score with acceptable accuracy for clinical purposes.
1. Introduction
Infantile cerebral palsy (CP) is the most common cause of motor development disorders in early childhood. It is defined as non-progressive damage to the developing brain that leads to impaired posture and movement, resulting in activity limitations [1]. The severity of CP ranges from mild forms such as unilateral spastic cerebral palsy with mild spasticity, contractures and limitations of sensitivity and fine motor skills to severe disabilities in which the entire body is affected and which often have a mixed form of spasticity and dyskinesia [2]. The severity of motor disorders in people with CP depends on the location, severity and timing of the damage [3]. In addition to motor impairments, individuals may also experience issues with cognition, speech, vision and sensory function, as well as dysfunctions of the autonomic system, behavioral issues, pain and epilepsy [4].
Within the rehabilitation of children with CP, evaluation therapy outcomes are crucial for assessing the effectiveness of interventions [5]. Various instruments are used to assess changes in gross motor functions, which involve movements of the arms, legs and trunk, such as crawling, walking and running [6]. The Gross Motor Function Measure (GMFM) is a standardized instrument for the assessment of gross motor functions in children and adolescents with motor impairments, particularly those with cerebral palsy. It is commonly used in rehabilitation settings to monitor progress [7]. However, the implementation of the GMFM can present challenges for both the examiner and the child or adolescent. For instance, proper administration requires training and experience to ensure consistent and accurate assessments [8]. Additionally, securing the cooperation of participants can be difficult, as the test involves numerous tasks that can be mentally and physically exhausting [8,9]. Repeated testing may also be psychologically stressful, especially for children aware of their motor limitations [10]. The GMFM-66 is a shortened version of the original GMFM-88. With only 66 items, it enhances efficiency and reduces completion time while preserving its established validity and reliability. Avery et al. reported Intraclass Correlation Coefficients (ICCs) greater than 0.96 in their reliability assessments. They evaluated consistency over time (ICC = 0.966, n = 228), between random samples (ICC = 0.976, n = 115), and between samples intentionally biased for ability (ICC = 0.975, n = 536) [11]. It is considered the gold standard for measuring gross motor function in children with CP [12]. To further reduce test burden, two abbreviated versions have been developed: the GMFM-66-IS and the GMFM-66 B&C [13,14]. One study found both shortened versions to yield accurate results compared to the full GMFM-66, especially in children with spastic CP, with the GMFM-66-IS showing better accuracy in unilateral spastic CP. However, it is recommended to retain the full GMFM-66 when evaluating longitudinal changes [13]. A new study has developed a shortened version of the GMFM-66 (rGMFM) that utilizes artificial intelligence to accurately predict the full score in both individual assessments and over time. This method initially uses seven test items to predict the GMFM-66 score, potentially increasing assessment efficiency. However, the method has not yet been integrated into software, and thus, the rGMFM is not currently available for clinical use [15].
In addition to assessing gross motor skills, gait analysis plays a critical role in the rehabilitation of children and adolescents with CP. Instrumented Gait Analysis (IGA) allows for the objective measurement of gait parameters such as step length, step width, walking speed and gait symmetry. These quantitative data form the basis for detailed gait assessments and can inform therapy planning. When performed repeatedly, gait analysis also allows for monitoring therapeutic progress [16].
There is now a wide variety of IGA systems on the market. These systems vary in technology, using video recordings, 2D and 3D joint kinematics (with or without markers) and force plates to measure joint forces. Some devices can also assess dynamic muscle activity via electromyography and energy expenditure via oxygen consumption [17].
Despite advances in technology, objectively assessing gait pathology remains challenging. Therefore, various indices such as the Gillette Gait Index (GGI), Gait Deviation Index (GDI), Gait Profile Score (GPS) and Gait Variable Score (GVS) have been developed [18,19,20]. While the GDI and GPS are reliable for clinical use, qualitative tools such as GOAL and FAQ offer valuable subjective insights into gait function and its impact. Overall, these tools enhance the evaluation and improvement of gait function in children with CP [21,22].
An important research direction in CP involves identifying correlations between health parameters and classification systems. Drouin et al. found a correlation between gross motor function and spatiotemporal gait parameters in children with CP or brain injuries [23]. Molloy et al. reported a significant relationship between the modified Gait Deviation Index (mGDI) and both GMFM-66 and GMFM-88 scores, with a stronger correlation to GMFM-66. They also showed that mGDI values vary by GMFCS level [24].
Another emerging research focus is the prediction of classification scores and health outcomes. Bedla et al. examined whether results from IGA using the Zebris FDM-T treadmill could predict GMFM-88 scores in individuals with CP. Their study analyzed 23 participants aged 8–24 years using the treadmill in standing and walking conditions. Generalized Linear Models (GLMs) were used to predict both total and subdomain GMFM-88 scores. The mean absolute error (MAE) for predicting the total GMFM-88 score was 5.4 points (range: 2.4–8.3; interquartile range: 1.5). The authors concluded that this approach could streamline motor function assessments, potentially facilitating clinical application [25].
Elling-Tammen et al. also explored machine learning for predicting GMFM scores. They developed a Medical Device Score Calculator (MDSC), which predicted GMFM-66 scores for 1639 patients with CP. The best-performing model, a random forest algorithm, achieved an MAE of 7.74 and a root mean square error (RMSE) of 10.1. The study showed that MDSC tended to overestimate scores at higher GMFCS levels and underestimate them at lower levels. Consequently, the authors recommend its use primarily for group comparisons in research rather than for individual assessments [26].
Machine learning is increasingly being applied in pediatric prediction models. Its applications include predicting functional, cognitive, and language development in children with developmental disorders [27] as well as predicting the progression of scoliosis curves in adolescents with idiopathic scoliosis (AIS) [28]. A recent study used machine learning to predict independent walking ability in children with CP. Logistic regression models showed high accuracy, and a clinically useful nomogram was developed [29].
The aim of this study is to investigate the accuracy of predicting GMFM-66 scores in ambulatory children and adolescents with CP using IGA results. Predicting GMFM-66 scores may support therapy evaluation within rehabilitation settings. Eliminating the need for full GMFM-66 testing, which typically takes 45 to 60 min, could save personnel resources. Given that the primary clinical benefit lies in time savings, this study focuses exclusively on pressure plate data, which requires the least time to collect.
2. Materials and Methods
2.1. Gross Motor Function Measure-66 (GMFM-66)
The GMFM-66 serves two purposes. Clinically, it is used to assess changes in gross motor function over time or in response to therapeutic interventions in children with cerebral palsy. In research contexts, the GMFM-66 is a fundamental tool for validating new treatment approaches and evaluating the effectiveness of other assessment instruments. Scoring is performed using the Gross Motor Ability Estimator version 2, a specialized software that converts raw scores into an interval-scaled score ranging from 0 to 100, with higher scores indicating greater motor ability. The GMFM-66 has demonstrated high reliability, validity and sensitivity to change [13,30,31].
2.2. Gross Motor Function Classification System (GMFCS)
The Gross Motor Function Classification System (GMFCS) is a standardized tool for classifying motor function in children with cerebral palsy aged 1 to 18 years. It uses a five-level ordinal scale, with Level I indicating the least and Level V the most severe motor limitations. Classification is based on typical motor performance in everyday settings, relying on observation and caregiver reports rather than formal testing [32,33].
The levels describe expected abilities between ages 6 and 12:
- Level I: walks without limitations; slight issues with advanced motor skills.
- Level II: walks without aids; limited in community mobility.
- Level III: walks with assistive devices; limited outdoor mobility.
- Level IV: limited self-mobility; uses wheeled mobility outside.
- Level V: severely limited mobility; dependent on assistance even with aids.
2.3. Zebris FDM Gait Analysis System
IGA was conducted in the gait laboratory using the Zebris FDM system, which consists of two floor-integrated pressure plates. These plates measure force distribution under the feet to assess static and dynamic loads as well as individual gait parameters. The system is connected to a standard PC and operated via dedicated analysis software (Zebris Medical GmbH, Isny, Germany). Trained medical staff performed the measurements.
Two integrated cameras recorded the subject from the front/back and side during walking. Although the system allows additional kinematic data collection via motion markers and muscle activity via EMG, these features are not yet used for the evaluation of the rehabilitation program and could not be used in this study. Only the pressure distribution data were analyzed. Participants walked over the plates several times to capture approximately ten valid gait cycles. Care was taken to ensure full contact with the plates, which sometimes required repeated trials. The process typically lasted no more than ten minutes.
The following clinical and gait parameters (predictors of the GMFM-66) were further analyzed statistically:
- -
- Age in years;
- -
- Height in cm;
- -
- Weight in kg;
- -
- CP subtype;
- -
- Mean and standard deviation of speed in km/h;
- -
- Mean stance phase in % and side difference in stance phase in %;
- -
- Average step width in cm and side difference in step width in %;
- -
- Average step length in cm and side difference in step length in %;
- -
- Average step time in seconds and side difference in step time in %;
- -
- Average foot rotation in degree angle and side difference in foot rotation in %;
- -
- Average length of gait line (LOGT = the length of the rolling surface of the foot) and side difference in LOGT in %;
- -
- Average single support line (SSL = the length of the rolling surface of the foot where the contralateral foot is in the swing phase) and side difference in SSL in %.
2.4. Study Population
This study is a retrospective, cross-sectional analysis based on data from patients who participated in the “Auf die Beine” rehabilitation program between 2018 and 2023. The program was conducted by UniReha GmbH, the Centre for Prevention and Rehabilitation at the University Hospital of Cologne, Germany. Designed for children and adolescents with mobility impairments, the program offers a comprehensive, intensive and interdisciplinary therapeutic approach.
Patients were assessed using the GMFM-66 and classified according to the Gross Motor Function Classification System (GMFCS) by trained healthcare professionals. Informed consent for data use in research was obtained from all participants or their legal guardians. The data set is registered in the German Clinical Trials Registry (DRKS0001131) and accessible at https://drks.de/search/en, accessed on 1 August 2025. Ethical approval for data collection and analysis was granted by the Ethics Committee of the University of Cologne (reference number 16-269, approval date 11 January 2017). For this study, only baseline data—collected at the time of program entry—were analyzed; follow-up data were excluded.
Eligibility criteria included a confirmed diagnosis of cerebral palsy, age between 3 and 18 years, a minimum of 60 scored items on the GMFM-66, GMFCS level I and II and the availability of gait analysis data.
2.5. Statistical Analysis
Statistical analysis was performed using R (version 4.4.1) and SPSS (IBM SPSS Statistics 27.0). To predict the GMFM-66 using data from gait analysis, multiple linear regression was used. Before evaluating the quality of the model, the assumptions for multiple linear regression were checked. Due to the high number of predictors (s. above), both the overall model and the individual variables were assessed for significance. While the overall model was significant, only a few regression coefficients were. Therefore, variables with high p-values were systematically removed through repeated regression analyses until a model remained in which all coefficients were statistically significant (p < 0.05).
Machine learning is increasingly being used to process big data. Used correctly, analyses of big data can quickly lead to research results [34]. Supervised learning is a type of machine learning where a model is trained on a labeled data set. Each example in the training data consists of an input and a corresponding correct output. The model learns to map inputs to outputs by minimizing the error between its predictions and the true labels (training data set). Once trained, it can make predictions on new, unseen data based on the patterns it has learned (validation data set) [35]. We compared four machine learning models, the feed forward neural net (FNN), random forest (RF) and support vector machine (SVM), with the software packages randomForest (version 4.7-1.1) [36], neuralnet (version 1.44.2) [37], nnet (version 7.3-18) [38] and XGboost (version 1.7.11.1) [39] in the software R (version 4.4.1.). For more information, please see the specific literature as this is beyond the scope of this work.
The data set was randomly selected and divided into two groups. One group with 70% of the patients in the data set was used to train the algorithms (training data set, Figure 1). The other group with 30% was later used for comparison with the calculated data (validation data set). For the self-learning algorithms, all available parameters of the gait analysis were used as predictors. The tuning process was carried out for RF, FNN and SVM by a grid search with the appropriate hyperparameters. For the XGB model, a Bayesian optimization of the hyperparameters was performed. In the turning process, various statistical models with different combinations of hyperparameters are calculated and an attempt is made to find the best constellation of hyperparameters for each model. This is performed using 5-fold cross-validation. Only the data from the training data was used for this. The models (one for each type: RF, FNN, SVM and XGB) with the best hyperparameter combination determined in this way is then applied to the validation data in order to obtain a prediction of the GMFM-66.
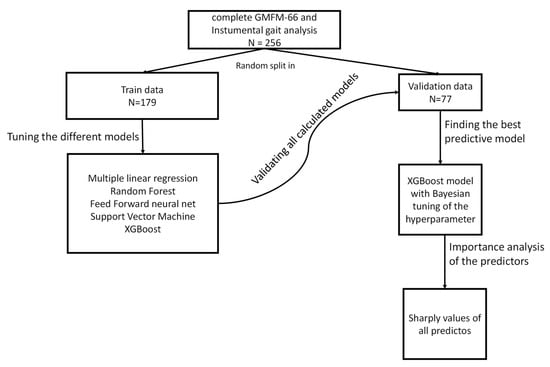
Figure 1.
Schematic representation of the statistical analysis.
SHAP (Shapley Additive Explanations) values were calculated for each individual predictor in the model with the best predictive performance. SHAP values quantify the contribution of each predictor to the model’s output for individual observations, based on cooperative game theory [40]. Larger absolute SHAP values indicate a greater influence of a predictor on the model’s prediction for a given instance. By averaging the absolute SHAP values across all samples, one can identify the most influential predictors globally. This approach enables an interpretable ranking of feature importance across the examined predictors.
The data set was randomly split into a 70% training set and a 30% validation set. Four machine learning models (RF, FNN, SVM and XGB) were trained using all available gait analysis parameters, with hyperparameters tuned via grid search (RF, FNN and SVM) or Bayesian optimization (XGB), based on 5-fold cross-validation. The best-performing models were then applied to the validation data to predict GMFM-66 scores. SHAP values were used to interpret the models by quantifying and ranking the influence of each predictor on the predictions.
To assess the accuracy of the GMFM-66 prediction based on the gait analysis results, the concordance correlation coefficient (by Lin) (CCC), the mean absolute error (MAE) and the root mean square error (RMSE) were calculated. The CCC is a measure used to assess the concordance between two measurement procedures performed on a patient (here, the actual GMFM-66 and the predicted GMFM-66 based on gait analysis). The value ranges from 0 to 1, with a CCC of 0.61–0.80 indicating strong concordance and a value > 0.80 indicating almost complete concordance [41]. Additional Bland–Altman diagrams were created.
3. Results
3.1. Study Population
The most important information on the study population is given in Table 1. A total of n = 270 data sets were available; the following data sets were excluded:

Table 1.
Study population by GMFCS level.
- -
- Three data sets because the age was >18 years;
- -
- Five data sets because the interval between GMFM-66 and gait analysis was >5 days;
- -
- Six data sets because the gait analysis was incomplete.In total, the data of n = 256 children and adolescents were analyzed.
3.2. Multiple Linear Regression
Of all the gait parameters initially examined, the following proved to be significant (Section 2): mean LOGT, mean stand phase, mean step width and SD of the velocity. The results of the MLR are given in Table 2.

Table 2.
Results of the multiple linear regression analysis.
3.3. Machine Learning Models
All tuning hyperparameters of the investigated machine learning models (FNN, RF, SVM and XGB) are given in Table 3. Table 3 also indicates which tuning hyperparameter settings provided the best prediction of the training data set.

Table 3.
Tuning hyperparameters of the statistical models for the prediction of the GMFM-66 score.
3.4. Predictive Performance Analysis of the Evaluated Models
Table 4 gives the results of the predictive performance analysis of MLR and machine-learning algorithms to predict the GMFM-66 using gait analysis data from the validation data set. The XGB model has the best predictive performance, with a CCC of 0.49 (95%CI 0.31; 0.63) (Table 4).

Table 4.
Results of the predictive performance analysis of machine learning algorithms to predict gross motor function using instrumental gait analysis data.
Figure 2, Figure 3, Figure 4, Figure 5 and Figure 6 show the results of the Bland–Altman analysis. Here, too, it can be seen that the accuracy of the GMFM-66 prediction is somewhat higher for the XGB than for the other statistical models (narrower limits of agreement in the Bland–Altman diagram, ±1.96 × SD).
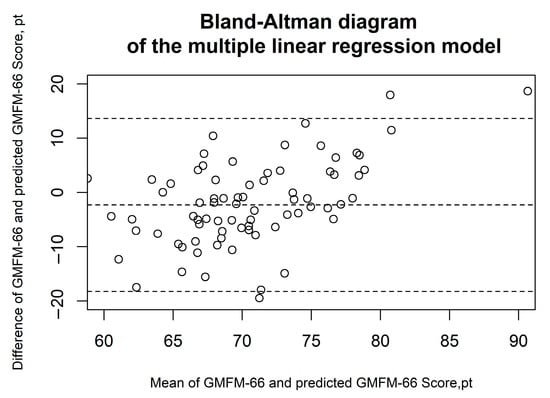
Figure 2.
Bland–Altman diagrams of the multiple linear regression model. The results of the Bland–Altman analysis are presented. The dashed lines represent the mean difference and the limits of agreement (1.96 × standard deviation). Each circle corresponds to a prediction of the GMFM-66.
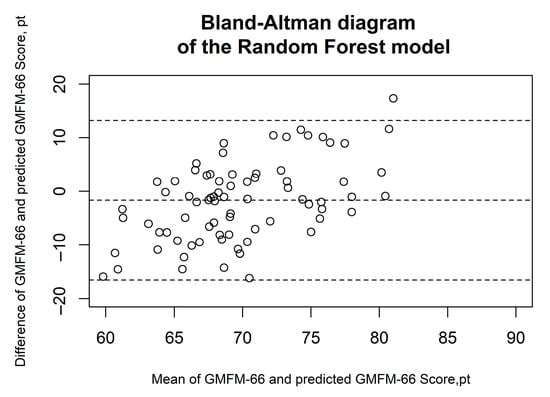
Figure 3.
Bland–Altman diagrams of the random forest model. The results of the Bland–Altman analysis are presented. The dashed lines represent the mean difference and the limits of agreement (1.96 × standard deviation). Each circle corresponds to a prediction of the GMFM-66.
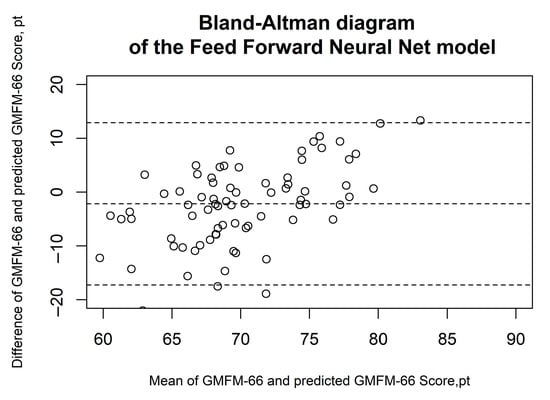
Figure 4.
Bland–Altman diagrams of the feed forward neural net model. The results of the Bland–Altman analysis are presented. The dashed lines represent the mean difference and the limits of agreement (1.96 × standard deviation). Each circle corresponds to a prediction of the GMFM-66.
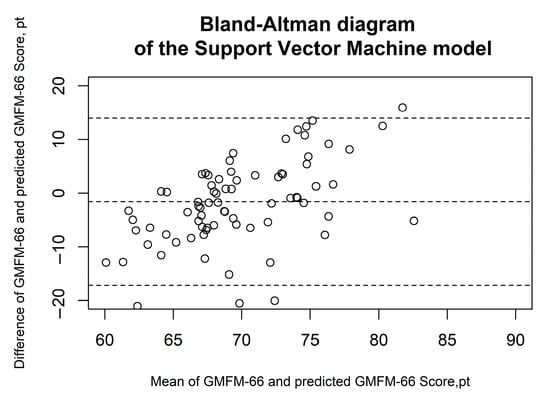
Figure 5.
Bland–Altman diagrams of the support vector machine model. The results of the Bland–Altman analysis are presented. The dashed lines represent the mean difference and the limits of agreement (1.96 × standard deviation). Each circle corresponds to a prediction of the GMFM-66.
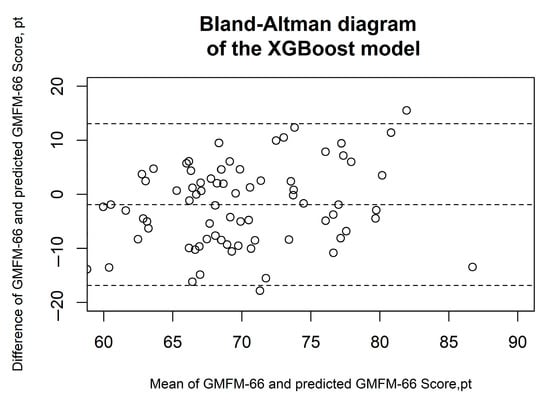
Figure 6.
Bland–Altman diagrams of the XGBoost model. The results of the Bland–Altman analysis are presented. The dashed lines represent the mean difference and the limits of agreement (1.96 × standard deviation). Each circle corresponds to a prediction of the GMFM-66.
SHAP values were calculated for the XGB model, as it demonstrated the highest prediction accuracy (Figure 7).
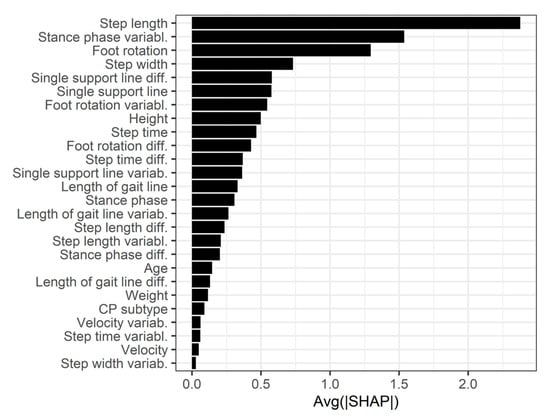
Figure 7.
Feature importance of the XGBoost model.
4. Discussion
The results of this study show that it is possible to predict the GMFM-66 score based on gait analysis with the Zebris FDM pressure plate in children with CP (and GMFCS levels I and II), achieving at best a CCC of 0.49 (95% CI 0.31–0.63), an MAE of 6.32 (95% CI 5.35–7.28) and an RMSE of 7.59 (95% CI 6.56–9.02) using the XGBoost model (a machine learning algorithm, see Table 4). Although the XGBoost model showed the best predictive performance among the five tested models, the low CCC indicates only moderate agreement between the predicted and the true GMFM-66 scores (CCC: 0.31–0.63). XGBoost is widely regarded as one of the most effective machine learning algorithms for structured, tabular data. Its success stems from its ability to efficiently capture complex feature interactions and nonlinearities through gradient-boosted decision trees, while also incorporating regularization to reduce overfitting [42]. Compared to traditional random forests, XGBoost typically achieves higher predictive accuracy due to its additive model structure and optimization techniques.
SHAP values were also calculated for the XGB model, revealing that the three most important predictors were step length, variability in stance phase duration and foot rotation. To our knowledge, no prior study has specifically predicted the GMFM-66 score based on gait analysis with ground reaction force plates. To date, only one study has investigated GMFM score prediction using instrumented gait analysis (IGA): Bedla et al. used the Zebris FDM-T treadmill and generalized linear regression to predict the GMFM-88 (not GMFM-66) score in 23 patients, achieving a median RMSE of 6.9 for the total score—only slightly higher than the RMSE of our XGBoost model [25].
Molloy et al. investigated the correlations between the modified Gait Deviation Index (mGDI) derived from 3D kinematic gait analysis and the GMFM-66 in n = 173 children with CP and GMFCS levels I–IV. They reported a significantly higher correlation coefficient between mGDI and GMFM-66 (0.7) than that observed in our study (0.44, 95% CI 0.24–0.60) [24]. The mGDI is based on values from 3D kinematic measurements [20], which were not available for the participants in our study. It is therefore plausible that including kinematic data could improve prediction accuracy. In addition to measurements of the lower extremities and pelvis, thorax and spine movements could also be considered. Attias et al. found significant differences across CP subtypes and GMFCS levels: children with higher GMFCS levels exhibited greater thoracic movements, and children with diplegia and GMFCS level 3 showed greater ranges of motion in all directions except spinal rotation [43]. Since the Zebris FDM system allows for kinematic and EMG measurements, future investigations including these parameters in regression models could test this hypothesis.
To determine whether GMFM-66 prediction via IGA is clinically meaningful for evaluating treatment outcomes, minimum clinically important differences (MCIDs) must be considered. The MCID represents the threshold beyond which a change is deemed clinically relevant. Oeffinger et al. described MCIDs necessary to recognize visible functional improvements (measured by effect size, ES) in a longitudinal observational study of n = 381 children with CP and GMFCS levels I–III. They postulated that changes must reach at least medium ES (0.5–0.8) or large ES (>0.8) to be clinically relevant. According to Oeffinger et al., at GMFCS level I, a GMFM-66 score change of 1.7 or more (over one year) constitutes a medium ES MCID, and a change of 2.7 or more constitutes a large ES MCID. For GMFCS level II, changes of 1.0 and 1.5 indicate medium and large MCIDs, respectively [44]. Considering these values, it appears unlikely that a prediction with an MAE of 6.32 could reliably reflect such clinically meaningful changes. Answering this question definitively would require analyzing repeat GMFM-66 measurements and corresponding predictions, which could be addressed in future studies. Nevertheless, these results indicate that the prediction errors exceed the thresholds for clinically significant improvements in the GMFM score.
The GMFM-66 primarily assesses the quantity of motor function rather than quality—for example, when walking, step length or foot rotation are less relevant as long as the number of steps is achieved. Consequently, the GMFM-66 provides limited detail on gait dynamics. Conversely, gait analysis with the Zebris FDM pressure plate provides detailed information on movement quality but less on other motor functions. Thus, it is reasonable to combine both methods in rehabilitation programs to obtain a comprehensive picture of changes [31,45].
However, predicting the GMFM-66 score could be useful in individual cases where the GMFM-66 cannot be administered—for example, due to a lack of compliance or limited cognitive understanding—while gait analysis is feasible. If the patient can perform the GMFM, using a reduced version such as the GMFM-66 item set (GMFM-66-IS) should be preferred over prediction based on gait analysis. It should be noted that the GMFM-66-IS is recommended as an alternative to the full GMFM-66 for assessing findings rather than for evaluating treatment outcomes. Nonetheless, based on our results, the GMFM-66-IS appears to have advantages over gait parameter-based predictions from pressure plates in outcome evaluation [13]. Another promising future option could be the revised GMFM (rGMFM) presented by Duran et al., if implemented in software [15].
Limitation
With regard to the limitations of the study, it should be noted that all types of CP were included in the study. As the gait deviations can differ significantly depending on the type of CP, this could be a reason for the higher error values in the prediction. However, if we look at the number of subtypes, we can see that the majority of cases can be classified as spastic cerebral palsy (spastic tetra-, diplegic and unilateral together 90.3%), which is why this influence on the error rate can be considered minor.
Another factor influencing the results is the interval between measurements with regard to the intensive therapy taking place and the individual daily performance of the children and adolescents. The influence of the therapy can probably be considered minimal, as only measurement intervals of a maximum of four days were included in the study and the measured errors were significantly greater than the therapeutic effects of four months of intensive training phases [46]. However, as the individual daily performance of the children and adolescents can have a considerable influence on motor skills, intervals of even one day can lead to distortions.
5. Conclusions
Agreement between results from IGA by the Zebris FDM pressure plate and GMFM-66 are not yet sufficient to predict the GMFM-66 score with acceptable accuracy for clinical purpose. Evidence has been found that incorporating kinematic data into the prediction may improve its accuracy. However, this would mean that the IGA would probably take more time simply due to the application of markers, which would reduce the overall time savings. Taking into account that the GMFM-66 and IGA evaluate different and complementary aspects of motor function in children with CP (quality and quantity of motor function), it seems justified to use both assessments in order to obtain a comprehensive picture of motor function in children and adolescents with CP.
Author Contributions
Conceptualization, S.G. and I.D.; methodology, S.G. and I.D.; formal analysis, S.G. and I.D.; writing—original draft preparation, S.G. and I.D.; writing—review and editing, S.G., S.S., K.S., M.Z., E.S. and I.D.; visualization, S.G. and I.D.; supervision, E.S. and I.D.; All authors have read and agreed to the published version of the manuscript.
Funding
This research received no external funding.
Institutional Review Board Statement
The data set is registered in the German Clinical Trials Registry (DRKS0001131) and accessible at https://drks.de/search/en. Ethical approval for data collection and analysis was granted by the Ethics Committee of the University of Cologne (reference number 16-269, approval date 11 January 2017).
Informed Consent Statement
Informed consent was obtained from all subjects involved in the study.
Data Availability Statement
Data available on request due to restrictions.
Acknowledgments
We would like to thank the children and families who provided their data for this evaluation.
Conflicts of Interest
The authors declare no conflicts of interest.
Abbreviations
The following abbreviations are used in this manuscript:
| CCC | Concordance correlation coefficient (by Lin) |
| CP | Cerebral palsy |
| EMG | Electromyography |
| FNN | Feed forward neural net |
| GMFCS | Gross Motor Function Classification System |
| GMFM | Gross Motor Function Measure |
| ICC | Intraclass Correlation Coefficients |
| IGA | Instrumented Gait Analysis |
| LOGL | Length of gait line |
| LOGT | length of the rolling surface of the foot |
| MAE | Mean absolute error |
| MCID | Minimum clinically important difference |
| mGDI | Modified Gait Deviation Index |
| PCC | Pearson correlation coefficient |
| RF | Random Forest |
| RMSE | Root mean square error |
| SD | Standard deviation |
| SVM | Support vector machine |
References
- Sadowska, M.; Sarecka-Hujar, B.; Kopyta, I. Cerebral Palsy. Current Opinions on Definition, Epidemiology, Risk Factors, Classification and Treatment Options. Neuropsychiatr. Dis. Treat. 2020, 16, 1505–1518. [Google Scholar] [CrossRef] [PubMed]
- Colver, A.; Fairhurst, C.; Pharoah, P.O.D. Cerebral palsy. Lancet 2014, 383, 1240–1249. [Google Scholar] [CrossRef] [PubMed]
- Sellier, E.; Platt, M.J.; Andersen, G.L.; Krägeloh-Mann, I.; de La Cruz, J.; Cans, C. Decreasing prevalence in cerebral palsy. A multi-site European population-based study, 1980 to 2003. Dev. Med. Child Neurol. 2016, 58, 85–92. [Google Scholar] [CrossRef] [PubMed]
- Paul, S.; Nahar, A.; Bhagawati, M.; Kunwar, A.J. A Review on Recent Advances of Cerebral Palsy. Oxid. Med. Cell. Longev. 2022, 2022, 2622310. [Google Scholar] [CrossRef]
- Novak, I.; Morgan, C.; Fahey, M.; Finch-Edmondson, M.; Galea, C.; Hines, A.; Langdon, K.; Namara, M.M.; Paton, M.C.; Popat, H.; et al. State of the Evidence Traffic Lights 2019. Systematic Review of Interventions for Preventing and Treating Children with Cerebral Palsy. Curr. Neurol. Neurosci. Rep. 2020, 20, 3. [Google Scholar] [CrossRef]
- Rosenbaum, P.; Paneth, N.; Leviton, A.; Goldstein, M.; Bax, M.; Damiano, D.; Dan, B.; Jacobsson, B. A report. The definition and classification of cerebral palsy April 2006. Dev. Med. Child neurology. Suppl. 2007, 109, 8–14. [Google Scholar]
- Palisano, R.J.; Hanna, S.E.; Rosenbaum, P.L.; Russell, D.J.; Walter, S.D.; Wood, E.P.; Raina, P.S.; Galuppi, B.E. Validation of a model of gross motor function for children with cerebral palsy. Phys. Ther. 2000, 80, 974–985. [Google Scholar] [CrossRef]
- Mayston, M. Gross Motor Function Measure (GMFM-66 & GMFM-88) User’s Manual, 3rd Edition Dianne J Russell, Marilyn Wright, Peter L Rosenbaum, Lisa M Avery London: Mac Keith Press, 2021 £80.00 (Paperback), pp. 320 ISBN: 978-1-911612-49-0. Dev. Med. Child Neurol. 2021, 63, 1236. [Google Scholar]
- Fowler, E.G.; Kolobe, T.H.; Damiano, D.L.; Thorpe, D.E.; Morgan, D.W.; Brunstrom, J.E.; Coster, W.J.; Henderson, R.C.; Pitetti, K.H.; Rimmer, J.H.; et al. Promotion of physical fitness and prevention of secondary conditions for children with cerebral palsy. Section on pediatrics research summit proceedings. Phys. Ther. 2007, 87, 1495–1510. [Google Scholar] [CrossRef]
- Carlon, S.L.; Taylor, N.F.; Dodd, K.J.; Shields, N. Differences in habitual physical activity levels of young people with cerebral palsy and their typically developing peers. A systematic review. Disabil. Rehabil. 2013, 35, 647–655. [Google Scholar] [CrossRef]
- Avery, L.M.; Russell, D.J.; Raina, P.S.; Walter, S.D.; Rosenbaum, P.L. Rasch analysis of the Gross Motor Function Measure. Validating the assumptions of the Rasch model to create an interval-level measure. Arch. Phys. Med. Rehabil. 2003, 84, 697–705. [Google Scholar] [CrossRef]
- Brunton, L.K.; Bartlett, D.J. Validity and reliability of two abbreviated versions of the Gross Motor Function Measure. Phys. Ther. 2011, 91, 577–588. [Google Scholar] [CrossRef]
- Avery, L.M.; Russell, D.J.; Rosenbaum, P.L. Criterion validity of the GMFM-66 item set and the GMFM-66 basal and ceiling approaches for estimating GMFM-66 scores. Dev. Med. Child Neurol. 2013, 55, 534–538. [Google Scholar] [CrossRef]
- Russell, D.J.; Avery, L.M.; Walter, S.D.; Hanna, S.E.; Bartlett, D.J.; Rosenbaum, P.L.; Palisano, R.J.; Gorter, J.W. Development and validation of item sets to improve efficiency of administration of the 66-item Gross Motor Function Measure in children with cerebral palsy. Dev. Med. Child Neurol. 2010, 52, e48–e54. [Google Scholar] [CrossRef]
- Duran, I.; Stark, C.; Saglam, A.; Semmelweis, A.; Lioba Wunram, H.; Spiess, K.; Schoenau, E. Artificial intelligence to improve efficiency of administration of gross motor function assessment in children with cerebral palsy. Dev. Med. Child Neurol. 2022, 64, 228–234. [Google Scholar] [CrossRef] [PubMed]
- Armand, S.; Decoulon, G.; Bonnefoy-Mazure, A. Gait analysis in children with cerebral palsy. EFORT Open Rev. 2016, 1, 448–460. [Google Scholar] [CrossRef] [PubMed]
- States, R.A.; Krzak, J.J.; Salem, Y.; Godwin, E.M.; Bodkin, A.W.; McMulkin, M.L. Instrumented gait analysis for management of gait disorders in children with cerebral palsy. A scoping review. Gait Posture 2021, 90, 1–8. [Google Scholar] [CrossRef]
- Baker, R.; McGinley, J.L.; Schwartz, M.H.; Beynon, S.; Rozumalski, A.; Graham, H.K.; Tirosh, O. The gait profile score and movement analysis profile. Gait Posture 2009, 30, 265–269. [Google Scholar] [CrossRef]
- Malt, M.A.; Aarli, Å.; Bogen, B.; Fevang, J.M. Correlation between the Gait Deviation Index and gross motor function (GMFCS level) in children with cerebral palsy. J. Child. Orthop. 2016, 10, 261–266. [Google Scholar] [CrossRef] [PubMed]
- Rasmussen, H.M.; Nielsen, D.B.; Pedersen, N.W.; Overgaard, S.; Holsgaard-Larsen, A. Gait Deviation Index, Gait Profile Score and Gait Variable Score in children with spastic cerebral palsy. Intra-rater reliability and agreement across two repeated sessions. Gait Posture 2015, 42, 133–137. [Google Scholar] [CrossRef]
- Novacheck, T.F.; Stout, J.L.; Tervo, R. Reliability and validity of the Gillette Functional Assessment Questionnaire as an outcome measure in children with walking disabilities. J. Pediatr. Orthop. 2000, 20, 75–81. [Google Scholar] [CrossRef] [PubMed]
- Thomason, P.; Tan, A.; Donnan, A.; Rodda, J.; Graham, H.K.; Narayanan, U. The Gait Outcomes Assessment List (GOAL). Validation of a new assessment of gait function for children with cerebral palsy. Dev. Med. Child Neurol. 2018, 60, 618–623. [Google Scholar] [CrossRef]
- Drouin, L.M.; Malouin, F.; Richards, C.L.; Marcoux, S. Correlation between the gross motor function measure scores and gait spatiotemporal measures in children with neurological impairments. Dev. Med. Child Neurol. 1996, 38, 1007–1019. [Google Scholar] [CrossRef]
- Molloy, M.; McDowell, B.C.; Kerr, C.; Cosgrove, A.P. Further evidence of validity of the Gait Deviation Index. Gait Posture 2010, 31, 479–482. [Google Scholar] [CrossRef]
- Bedla, M.; Pięta, P.; Kaczmarski, D.; Deniziak, S. Estimation of Gross Motor Functions in Children with Cerebral Palsy Using Zebris FDM-T Treadmill. J. Clin. Med. 2022, 11, 954. [Google Scholar] [CrossRef]
- von Elling-Tammen, L.; Stark, C.; Wloka, K.R.; Alberg, E.; Schoenau, E.; Duran, I. Predicting Gross Motor Function in Children and Adolescents with Cerebral Palsy Applying Artificial Intelligence Using Data on Assistive Devices. J. Clin. Med. 2023, 12, 2228. [Google Scholar] [CrossRef]
- Kuo, C.-Y.; Chang, H.; Chia-Yu Su, E.; Huang, Y.-J.; Tsai, M.-L.; Tseng, S.-H. Effectiveness of early intervention and prediction of outcomes in taiwanese children with developmental delay. Pediatr. Neonatol. 2025. [Google Scholar] [CrossRef]
- Kim, Y.-G.; Kim, S.; Park, J.H.; Yang, S.; Jang, M.; Yun, Y.J.; Cho, J.-S.; You, S.; Jang, S.-H. Explainable Deep-Learning-Based Gait Analysis of Hip-Knee Cyclogram for the Prediction of Adolescent Idiopathic Scoliosis Progression. Sensors 2024, 24, 4504. [Google Scholar] [CrossRef]
- Wang, Y.; Yang, Y. Development and Validation of a Prognostic Model for Independent Walking in Children With Cerebral Palsy Based on Machine Learning. Arch. Phys. Med. Rehabilit. 2025. [Google Scholar] [CrossRef] [PubMed]
- Lundkvist Josenby, A.; Jarnlo, G.-B.; Gummesson, C.; Nordmark, E. Longitudinal construct validity of the GMFM-88 total score and goal total score and the GMFM-66 score in a 5-year follow-up study. Phys. Ther. 2009, 89, 342–350. [Google Scholar] [CrossRef] [PubMed]
- Russell, D.J.; Avery, L.M.; Rosenbaum, P.L.; Raina, P.S.; Walter, S.D.; Palisano, R.J. Improved scaling of the gross motor function measure for children with cerebral palsy. Evidence of reliability and validity. Phys. Ther. 2000, 80, 873–885. [Google Scholar] [CrossRef]
- Palisano, R.J.; Rosenbaum, P.; Bartlett, D.; Livingston, M.H. Content validity of the expanded and revised Gross Motor Function Classification System. Dev. Med. Child Neurol. 2008, 50, 744–750. [Google Scholar] [CrossRef]
- Wood, E.; Rosenbaum, P. The gross motor function classification system for cerebral palsy. A study of reliability and stability over time. Dev. Med. Child Neurol. 2000, 42, 292–296. [Google Scholar] [CrossRef]
- Mayer-Schönberger, V.; Ingelsson, E. Big Data and medicine. A big deal? J. Intern. Med. 2018, 283, 418–429. [Google Scholar] [CrossRef]
- Deo, R.C. Machine Learning in Medicine. Circulation 2015, 132, 1920–1930. [Google Scholar] [CrossRef]
- Liaw, A.; Wiener, M. Classification and Regression by RandomForest. R-News 2002, 2002, 18–22. [Google Scholar]
- Günther, F.; Fritsch, S. neuralnet. Training of Neural Networks. R J. 2010, 2, 30. [Google Scholar] [CrossRef]
- Chambers, J.; Eddy, W.; Härdle, W.; Sheather, S.; Tierney, L.; Venables, W.N.; Ripley, B.D. Modern Applied Statistics with S; Springer: New York, NY, USA, 2002. [Google Scholar]
- Chen, T.; He, T.; Benesty, M.; Khotilovich, V.; Tang, Y.; Cho, H.; Chen, K. Xgboost: Extreme Gradient Boosting, R package version 0.4-2; The R Foundation: Vienna, Austria, 2015. [Google Scholar]
- Lundberg, S.M.; Lee, S.-I. A Unified Approach to Interpreting Model Predictions. arXiv 2017, arXiv:1705.07874. [Google Scholar] [CrossRef]
- Lin, L.I.-K. A Concordance Correlation Coefficient to Evaluate Reproducibility. Biometrics 1989, 45, 255. [Google Scholar] [CrossRef]
- Chen, T.; Guestrin, C. XGBoost. A Scalable Tree Boosting System; The R Foundation: Vienna, Austria, 2016. [Google Scholar]
- Attias, M.; Bonnefoy-Mazure, A.; Lempereur, M.; Lascombes, P.; de Coulon, G.; Armand, S. Trunk movements during gait in cerebral palsy. Clin. Biomech. 2015, 30, 28–32. [Google Scholar] [CrossRef]
- Oeffinger, D.; Bagley, A.; Rogers, S.; Gorton, G.; Kryscio, R.; Abel, M.; Damiano, D.; Barnes, D.; Tylkowski, C. Outcome tools used for ambulatory children with cerebral palsy. Responsiveness and minimum clinically important differences. Dev. Med. Child Neurol. 2008, 50, 918–925. [Google Scholar] [CrossRef] [PubMed]
- Baker, R. Gait analysis methods in rehabilitation. J. Neuroeng. Rehabil. 2006, 3, 4. [Google Scholar] [CrossRef] [PubMed]
- Stark, C.; Duran, I.; Martakis, K.; Spiess, K.; Semler, O.; Schoenau, E. Effect of Long-Term Repeated Interval Rehabilitation on the Gross Motor Function Measure in Children with Cerebral Palsy. Neuropediatrics 2020, 51, 407–416. [Google Scholar] [CrossRef] [PubMed]
Disclaimer/Publisher’s Note: The statements, opinions and data contained in all publications are solely those of the individual author(s) and contributor(s) and not of MDPI and/or the editor(s). MDPI and/or the editor(s) disclaim responsibility for any injury to people or property resulting from any ideas, methods, instructions or products referred to in the content. |
© 2025 by the authors. Licensee MDPI, Basel, Switzerland. This article is an open access article distributed under the terms and conditions of the Creative Commons Attribution (CC BY) license (https://creativecommons.org/licenses/by/4.0/).