1. Introduction to Olympic Sailing Research
Following the research on the International Laser Class Association (ILCA) Olympic dinghy class from Caraballo et al. [
1] and Zattoni et al. [
2], this paper presents a system for multi-sensor measurement and analysis of maneuver performance, utilizing motion sensors such as global navigation satellite systems (GNSS), inertial measurement units (IMU), and potentiometers for rudder and mast angle measurements.
Dinghy sailing is a technical sport with high demands for tactics, technique, and physical endurance to respond effectively to wind, waves, and current changes [
3,
4]. Olympic sailing regattas are carried out on predefined race courses consisting of upwind (towards the wind), downwind (away from the wind), and broad reach (perpendicular to the wind) sections [
1,
5]. During upwind legs, the sailors perform a course change through the main direction of the wind. These maneuvers, called “tacking”, are made to approach the top mark against the wind [
6,
7]. Olympic sailing typically involves fleet competitions with mass starts over 10–12 races before gold finals.
ILCA 6 and 7 are Olympic sailing classes in the single-handed dinghy category, requiring simultaneous adjustment of the rudder, sail, and body position to optimize propulsion toward the desired direction. A detailed description of the tacking maneuver for the ILCA 7 (formerly called the Laser) can be found in [
8]. Among Olympic classes, ILCA sailors are considered to have the highest demand for physical fitness, as they dynamically adjust their hiking position without the aid of a trapeze (contrary to the 49er skiff, etc.) [
3,
9,
10,
11]. In addition to physical load, continuous analysis of wind changes, waves, and competitors makes ILCA sailing mentally demanding [
12].
Maneuvers, physical fitness, boat speed, and tactics are the main contributors to sailing performance in Olympic competitions [
4,
13,
14]. Velocity Made Good (VMG, defined as the relative velocity vector towards an upwind mark) and distance traveled have been shown in analysis to be of great importance [
4,
15]. Further, a range of studies have employed simulated, numerical, or controlled environments to analyze ILCA sailing performance [
5,
16,
17,
18,
19]. A range of studies investigate the physical demands of dinghy sailing [
3,
9,
10,
13,
20]. The tactical and technical aspects, on the other hand, have received less attention in research. This is largely due to the lack of in situ sailing data available for analysis and difficulties in replicating realistic conditions in a simulated environment [
16,
21]. High-quality scientific research demands repeatability, an inherent challenge of in situ testing in marine environments. However, a recent comprehensive review of sports performance research highlights that athletes and their teams are more interested in research directly applied to the sport in the field, recognizing that performance limits are ultimately tested in real-world conditions, not in the lab [
22].
A recent study on the frequencies of motion for the ILCA 6 included the in situ testing and data collection of global positioning (GNSS) and inertial measurement unit (IMU) data to identify the amplitude and frequency of boat roll in medium-wind conditions [
2]. Modern sailing computers include GNSSs and IMUs for calculating the roll and pitch of a boat [
23], allowing analysis of speed and orientations as demonstrated in [
2]. Looking at the available data for analysis, there is a need for more sensors to expand our understanding of the physical–technical details in sailing. We present a setup for multi-sensor measurement and analysis of tacking technique and performance in elite dinghy sailors. The main aim of this study is to increase the understanding of how different actions, such as rudder movement and mast rotation, influence tacking performance. The setup is demonstrated in situ with an elite ILCA 7 sailor.
2. System Setup, Test, and Data Processing Method
The following section details the design, development, and testing of a low-cost, non-intrusive multi-sensor system for in-field data collection on the ILCA 7 dinghy. Due to the one-design rule of the ILCA class [
24], and ease of use, the equipment was designed to have no permanent interference with the boat. Consequently, the system can be mounted on any ILCA without affecting the ability to use said boat in a competition at a later stage. Simultaneously, the system was designed for a low physical profile, to minimize interference with the sailor and allow for natural and realistic handling of the boat.
2.1. Hardware Architecture
The proposed system, seen in
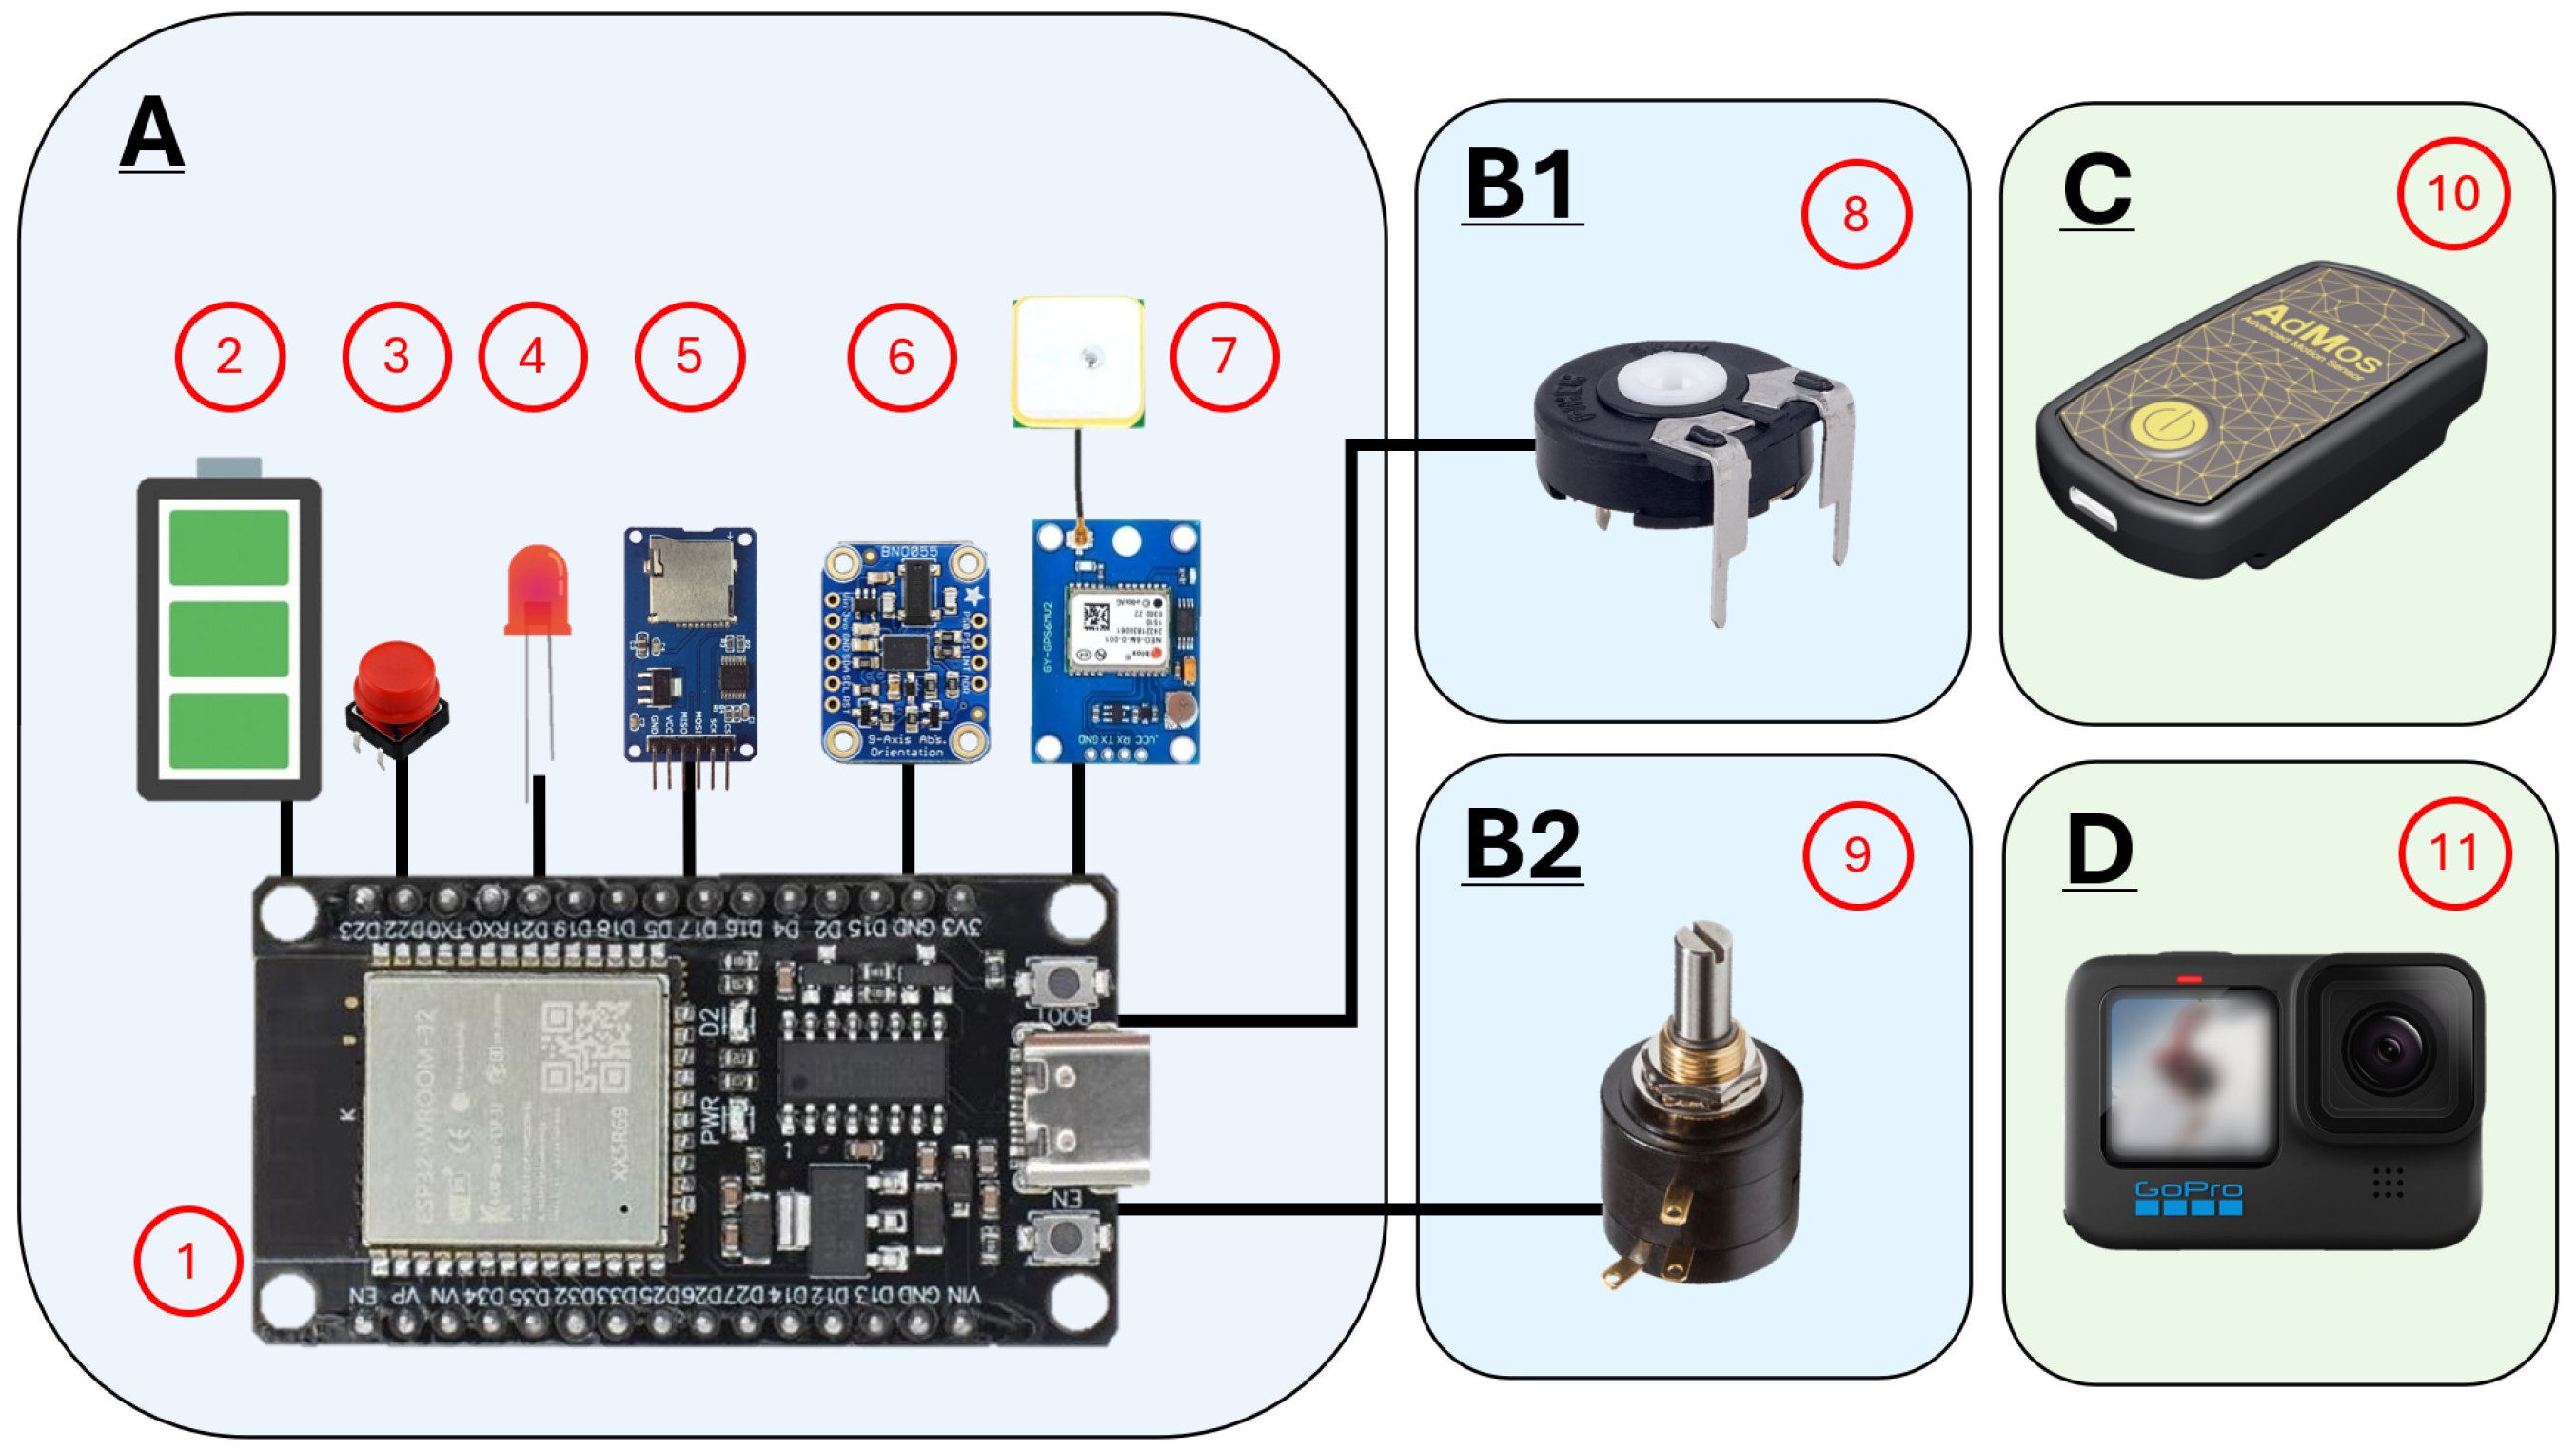
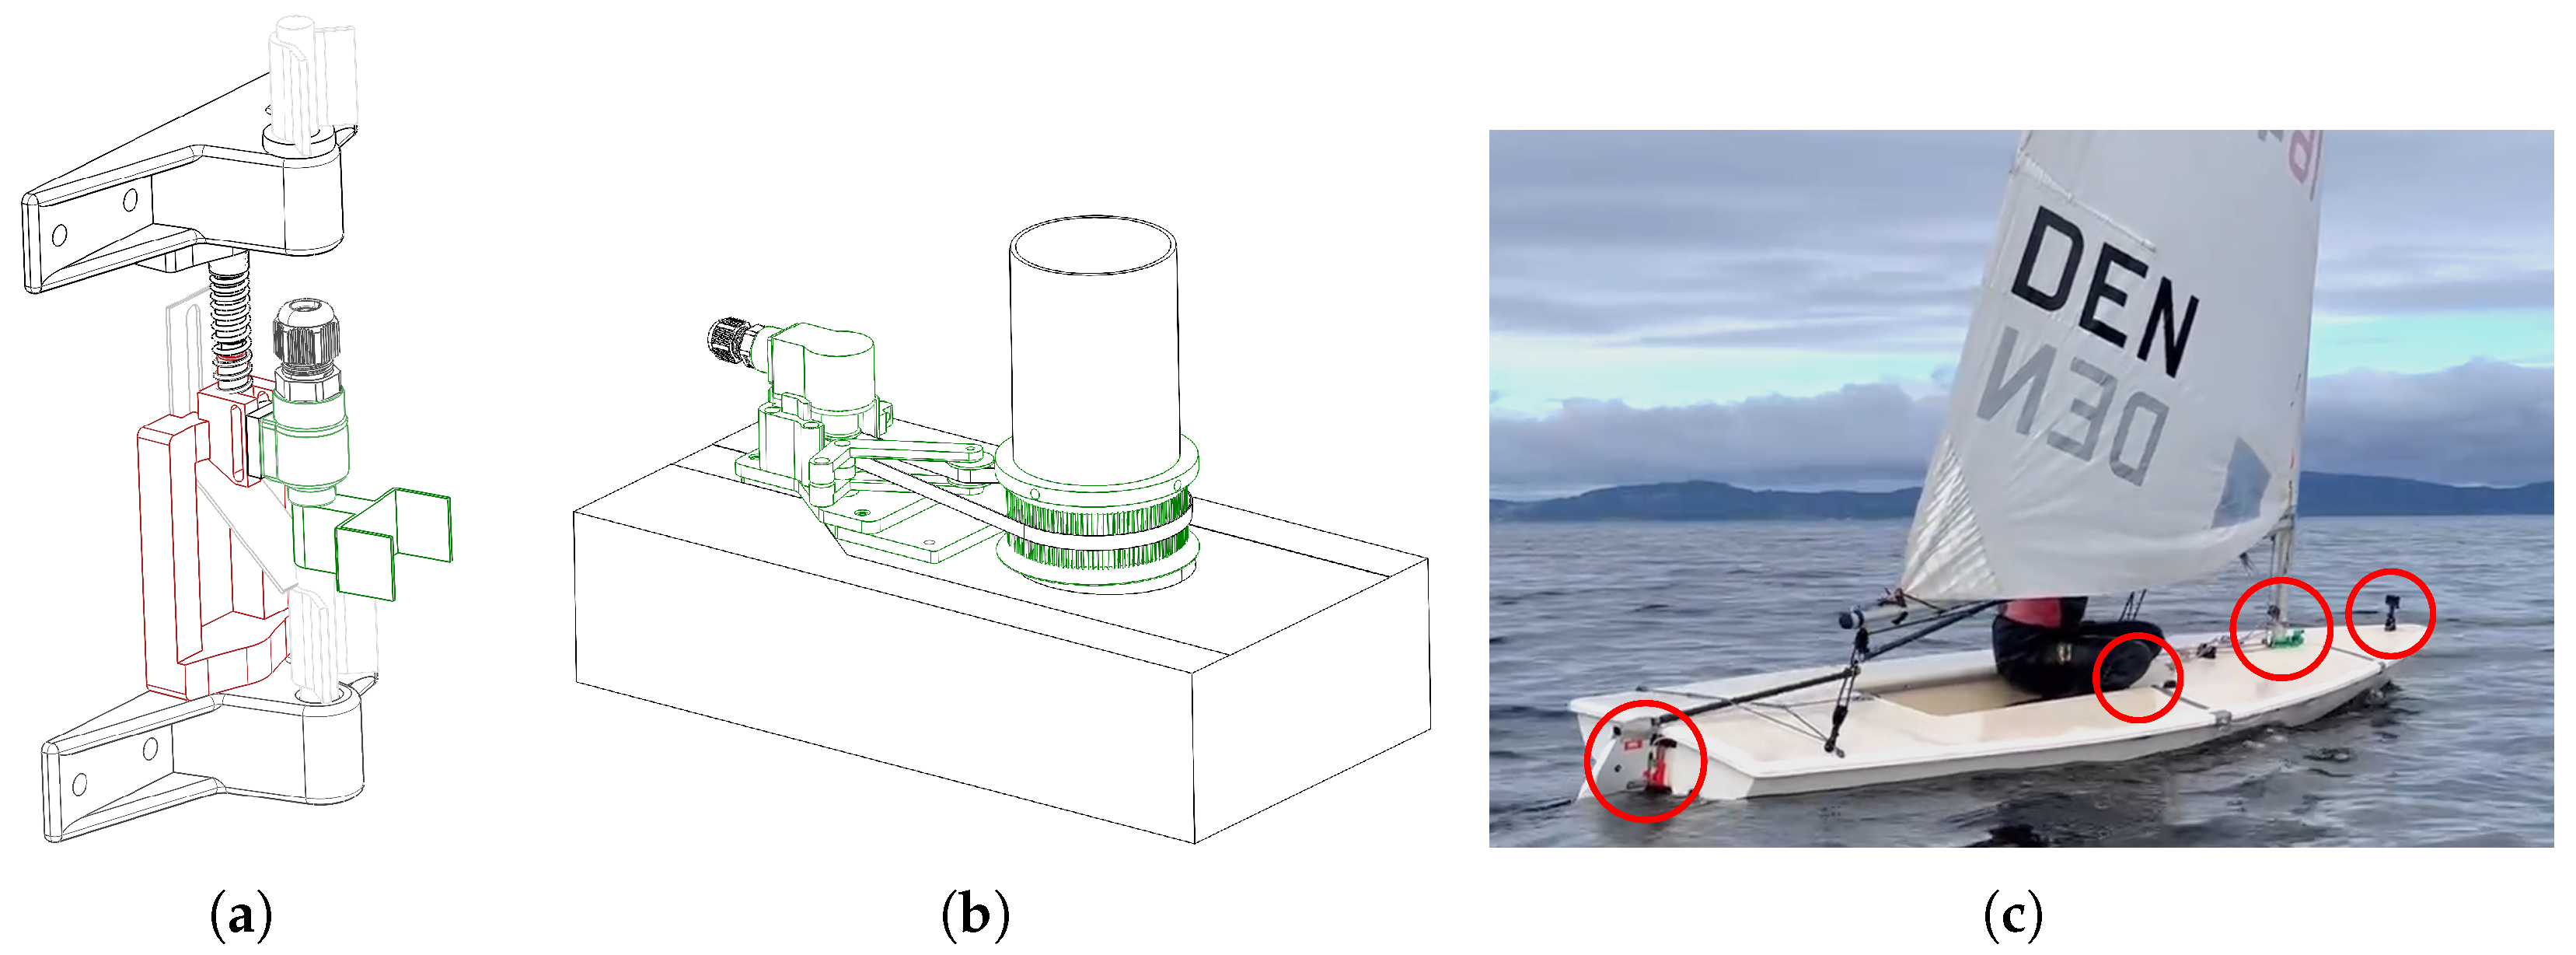
Figure 1, consists of multiple off-the-shelf electronic components, combined with custom mounts tailored to the boat (see
Figure 2a,b), and software to enable data logging of the movements. Additionally, a commercially available sensor package, the AdMos sensor, was included to enhance data collection and validate GNSS accuracy. A GoPro was also mounted to be able to visually verify motion patterns in maneuvers during data processing.
All components used in the multi-sensor system are listed below:
The components were placed on multiple different locations on the dinghy (
Figure 2c). Most were located in a “mechatronics hub” (
Figure 1A) placed in the well towards the bow below the hiking strap. The AdMos was also placed inside this hub (
Figure 1C). The placement was decided in consultation with the sailor who would be performing the field testing. The unit served as a hub for synchronized data collection and storage, to minimize the size of the measurement components in critical areas around the rudder and mast.
Rotary sensors (see
Figure 1B1,B2) were placed on the bottom of the mast and at the rudder. These recorded the movements of these components in relation to the hull. The physical component layout of the mast and rudder sensors were prototyped in polyethylene terephthalate glycol (PETG) with threaded inserts and screws for a robust, waterproof, and modular setup. The sensors were waterproofed using custom PETG casings with cable glands mounted for the data transfer cables. The rudder sensor was mounted to the hull using a spring-loaded clamp mechanism between the two gudgeons holding the rudder (
Figure 2a). The rotational axis was aligned with that of the rudder, and a u-shaped guiding rail clasped onto the rudder head to measure angle changes. A spring-loaded belt drive system (
Figure 2b) was developed to accommodate for longitudinal movement between the mast and hull. The mast rotation sensor system was attached to the hull using water-resistant double-sided tape, to allow non-intrusive mounting. The waterproofed rotary sensors for both rudder and mast were submerged in a lab for 2 h without leaking to verify functionality. Finally, the GoPro (see
Figure 1D) was placed at the bow of the dinghy.
2.2. Software Implementation
Code for the micro-controller was compiled in Arduino IDE. The micro-controller handles sensors located in the mechatronics hub, as well as the rotary sensors on the mast and rudder. When the button is pressed, a new .csv file is opened, and all data are logged chronologically with a frequency of 10 Hz to the SD card. When the button is pressed again, the file is closed. The LED light indicates whether or not the logging is activated.
With the data from the GNSS module, the processing unit adjusts for the local timezone (GMT+2), and saves timestamps, coordinates, speed, and course. The GNSS device refreshes at 1 Hz, and the saved data points are up-sampled using forward fill to match the sampling frequency of the other sensors. The code also reads out data from the IMU, saving the raw values for all nine degrees of freedom: linear acceleration, angular velocity, and magnetometer, along the x-, y-, and z-axes. Raw data from the potentiometers are stored as values on a range from 0 to 4095. The data from the AdMos sensor was used for validating the integrated setup measurements.
2.3. Field Test
The system was tested with a male elite sailor, age 22, in Trondheim Fjord, leaving from Skansen Marina, heading north into the open water to minimize turbulence from surrounding land formations. The laser was escorted by a rib to document the test, in coordination with the sailor throughout the test. The sailor was instructed to perform a normal training session, focusing on consistent performance. After a warm-up session, the sequence of upwind tacks was initiated before returning to the harbor in downwind and broad reach.
Table 1 shows the average weather conditions from the test period. Weather data was fetched from the research weather station of The Foundation for Industrial and Technical Research (SINTEF) [
34]. The study was conducted in accordance with the Declaration of Helsinki and approved by the Ethics Committee of Norway (ID: 661300, approved 16 January 2025).
2.4. Data Analysis
After the completion of the field test, data were selected and analyzed. Course changes as a result of a tack were identified manually, and a 10 s interval centered around the apex of the tack was defined as the representative interval capturing a full tack maneuver. For this analysis, the direction for VMG was found using the estimated onboard wind direction (EOWD). The EOWD was determined by finding the mean course of all starboard legs and the mean course of all port legs from the selected dataset, and lastly, by calculating the mean course between those two.
Data was collected after the field test to identify the angles corresponding to the mast and rudder. The rudder rotary sensor was sampled at and 60°. For each static angle, potentiometer values were sampled and used to derive a proportional angle mapping. This was repeated for the mast, and data was sampled at , and 720°. The reference angle point was identified from a static section at the beginning of the field test where the rudder and mast were aligned straight in relation to the hull for 30 s. Potentiometers were selected over other angle measurement sensors, such as encoders, to maintain a low-cost overall system. The entry and exit courses were calculated as the mean course during the first and last second of the tack interval, respectively. The entry and exit speed over ground (SOG) were calculated as the mean speed of the first and last two seconds of the tack interval, respectively. The time until 80% of SOG was defined as the time interval from the start of the tack until the speed reached 80% of the entry SOG, using the lowest SOG in the interval as a threshold gate.
Weather data was extracted from the SINTEF weather station in the relevant time interval. Wind speed is defined by the average speed of all wind measurements, and gust is the average of the highest value from each minute. The wind direction is the mean of the wind course data. Three outliers in the wind course data were filtered out: 170°, 171°, and 173°. These were determined as numerical errors from the measurement buoy, considering all other data points were centered around 339.9 ± 4.85°.
3. Results
The data presented in this section are the results of the field test.
Figure 3 shows the outlined GNSS path of the entire test in gray, with the section selected for tacking analysis marked in orange. Mean wind direction (MWD) and EOWD are illustrated with red and green direction vectors. Mean values are 340° and 318°. The overall test area spans approximately 1000 × 600 m.
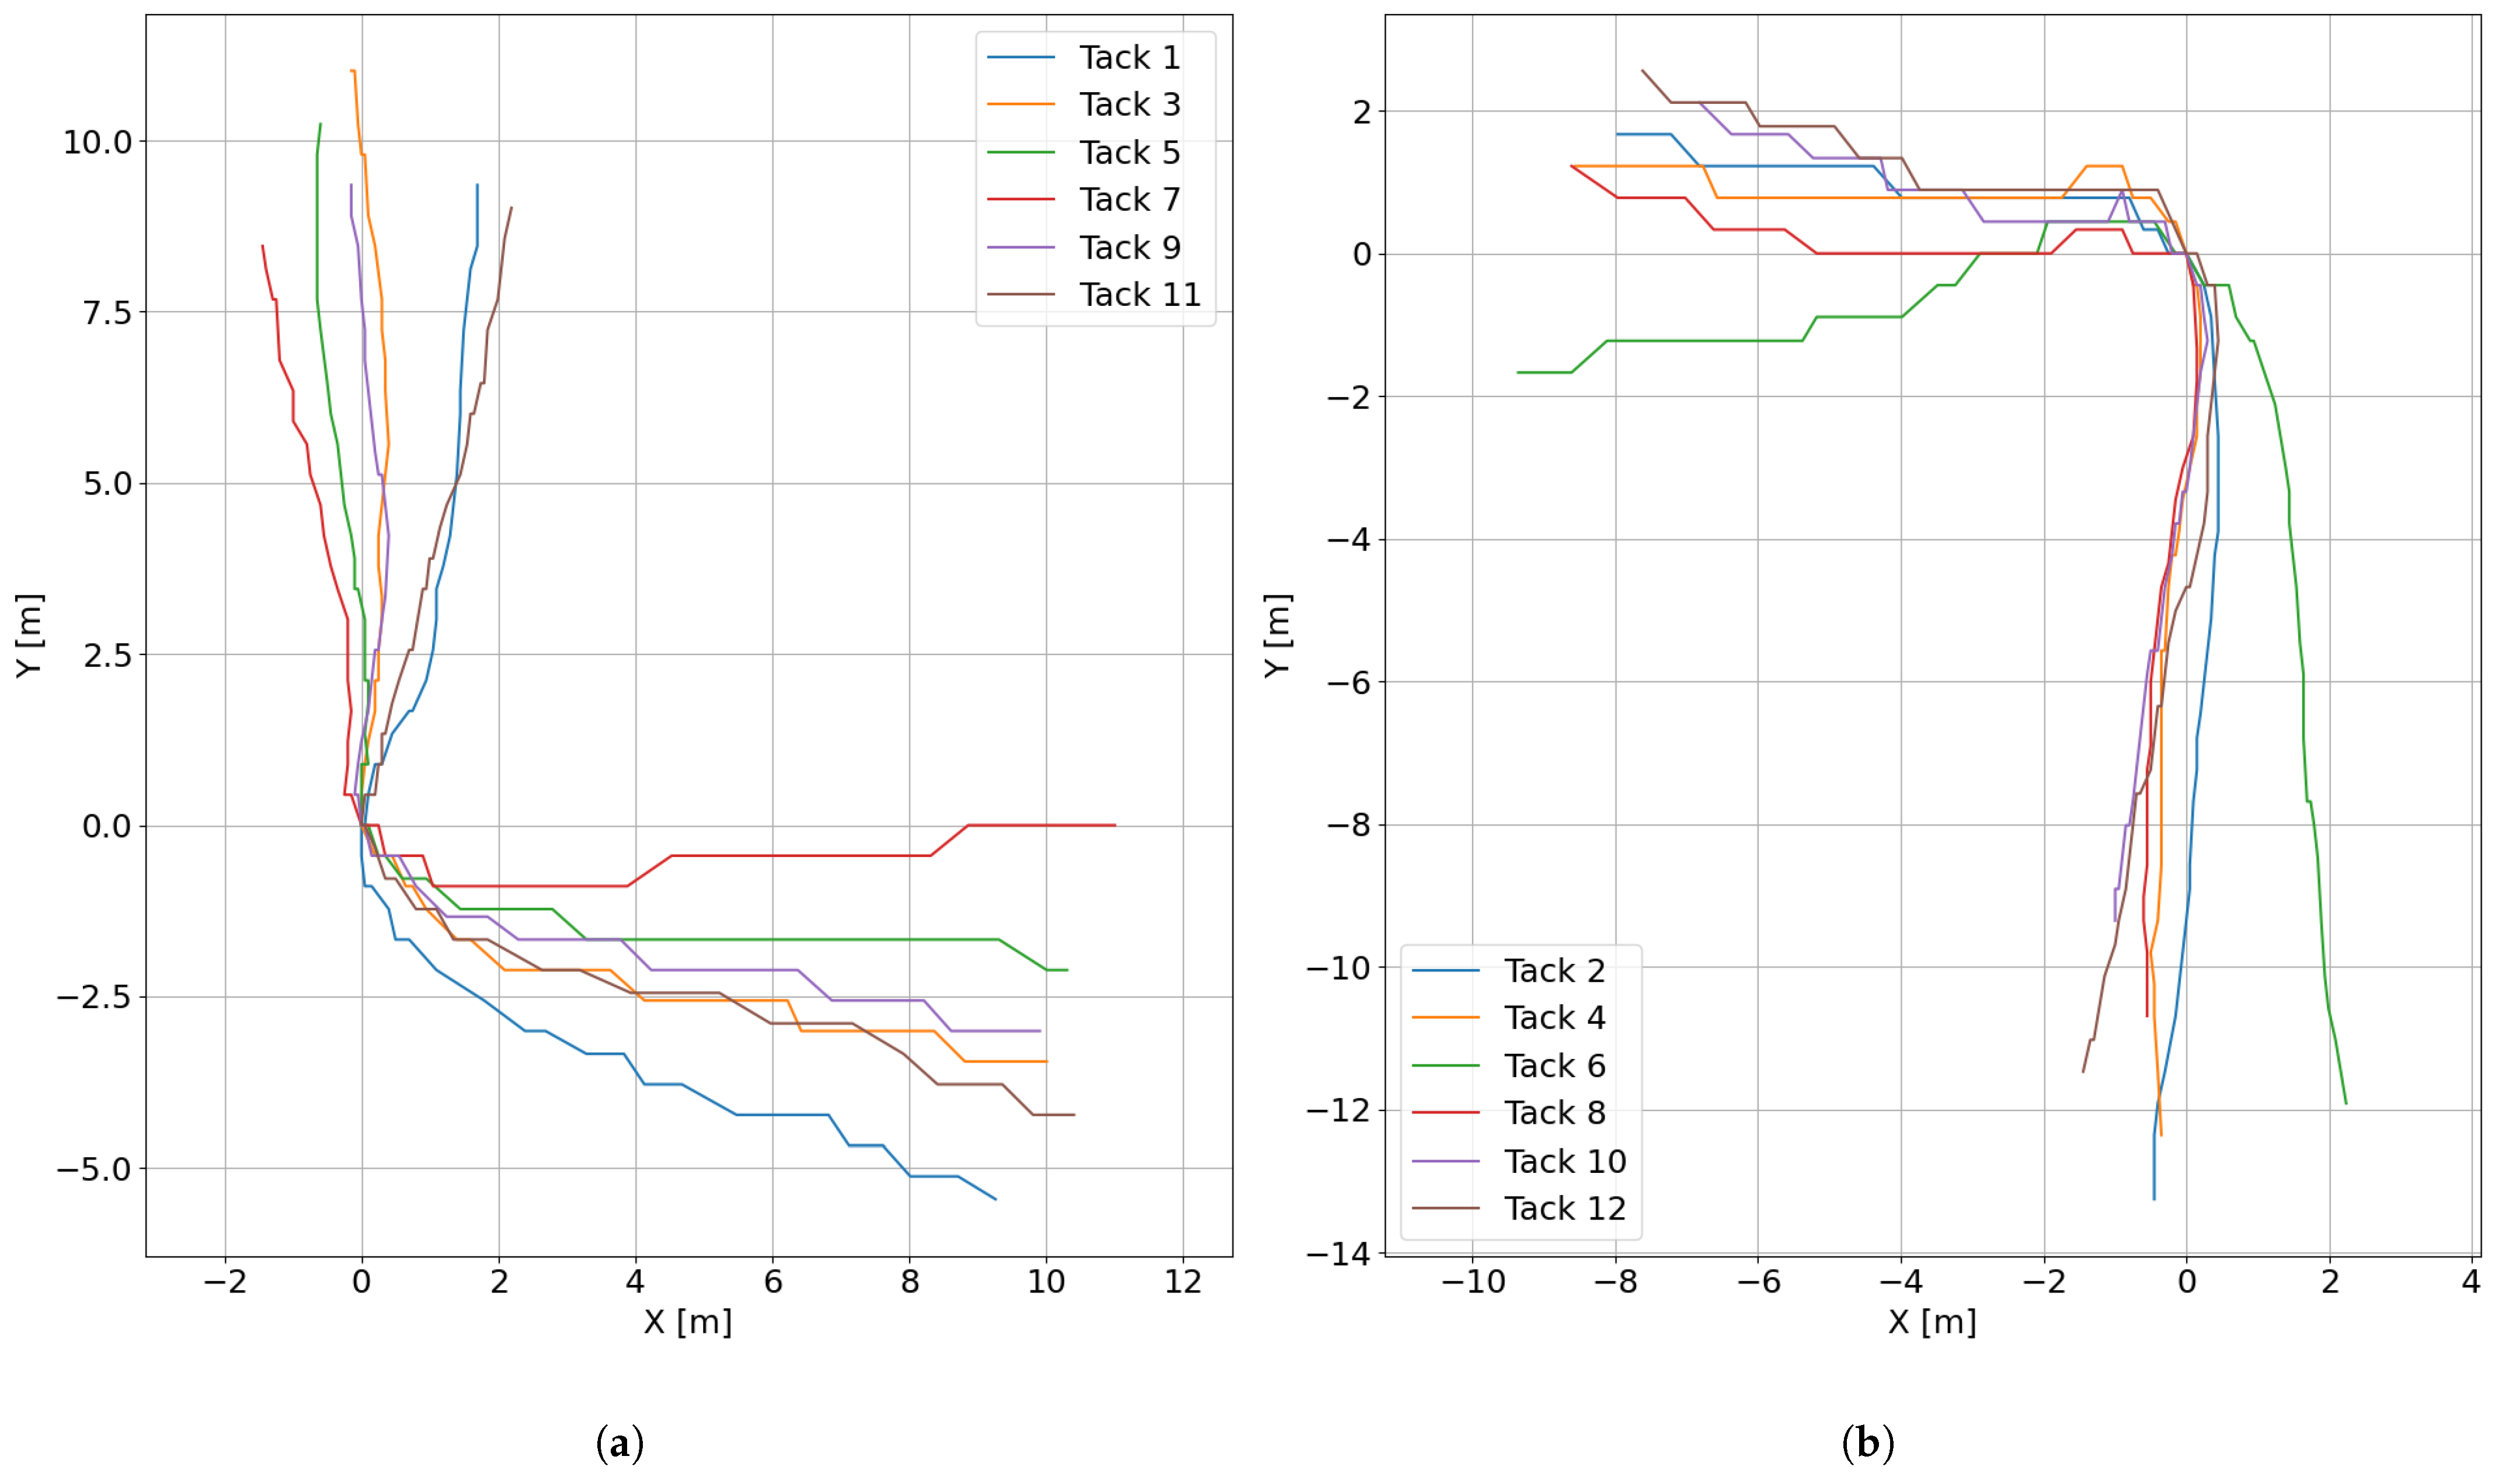
A total of 12 tacks were carried out in the selected test section, equally distributed on port and starboard sides.
Figure 4 shows all the tacks stacked over each other for comparison, using the apex of the turn estimated by visual inspection as the relative alignment point.
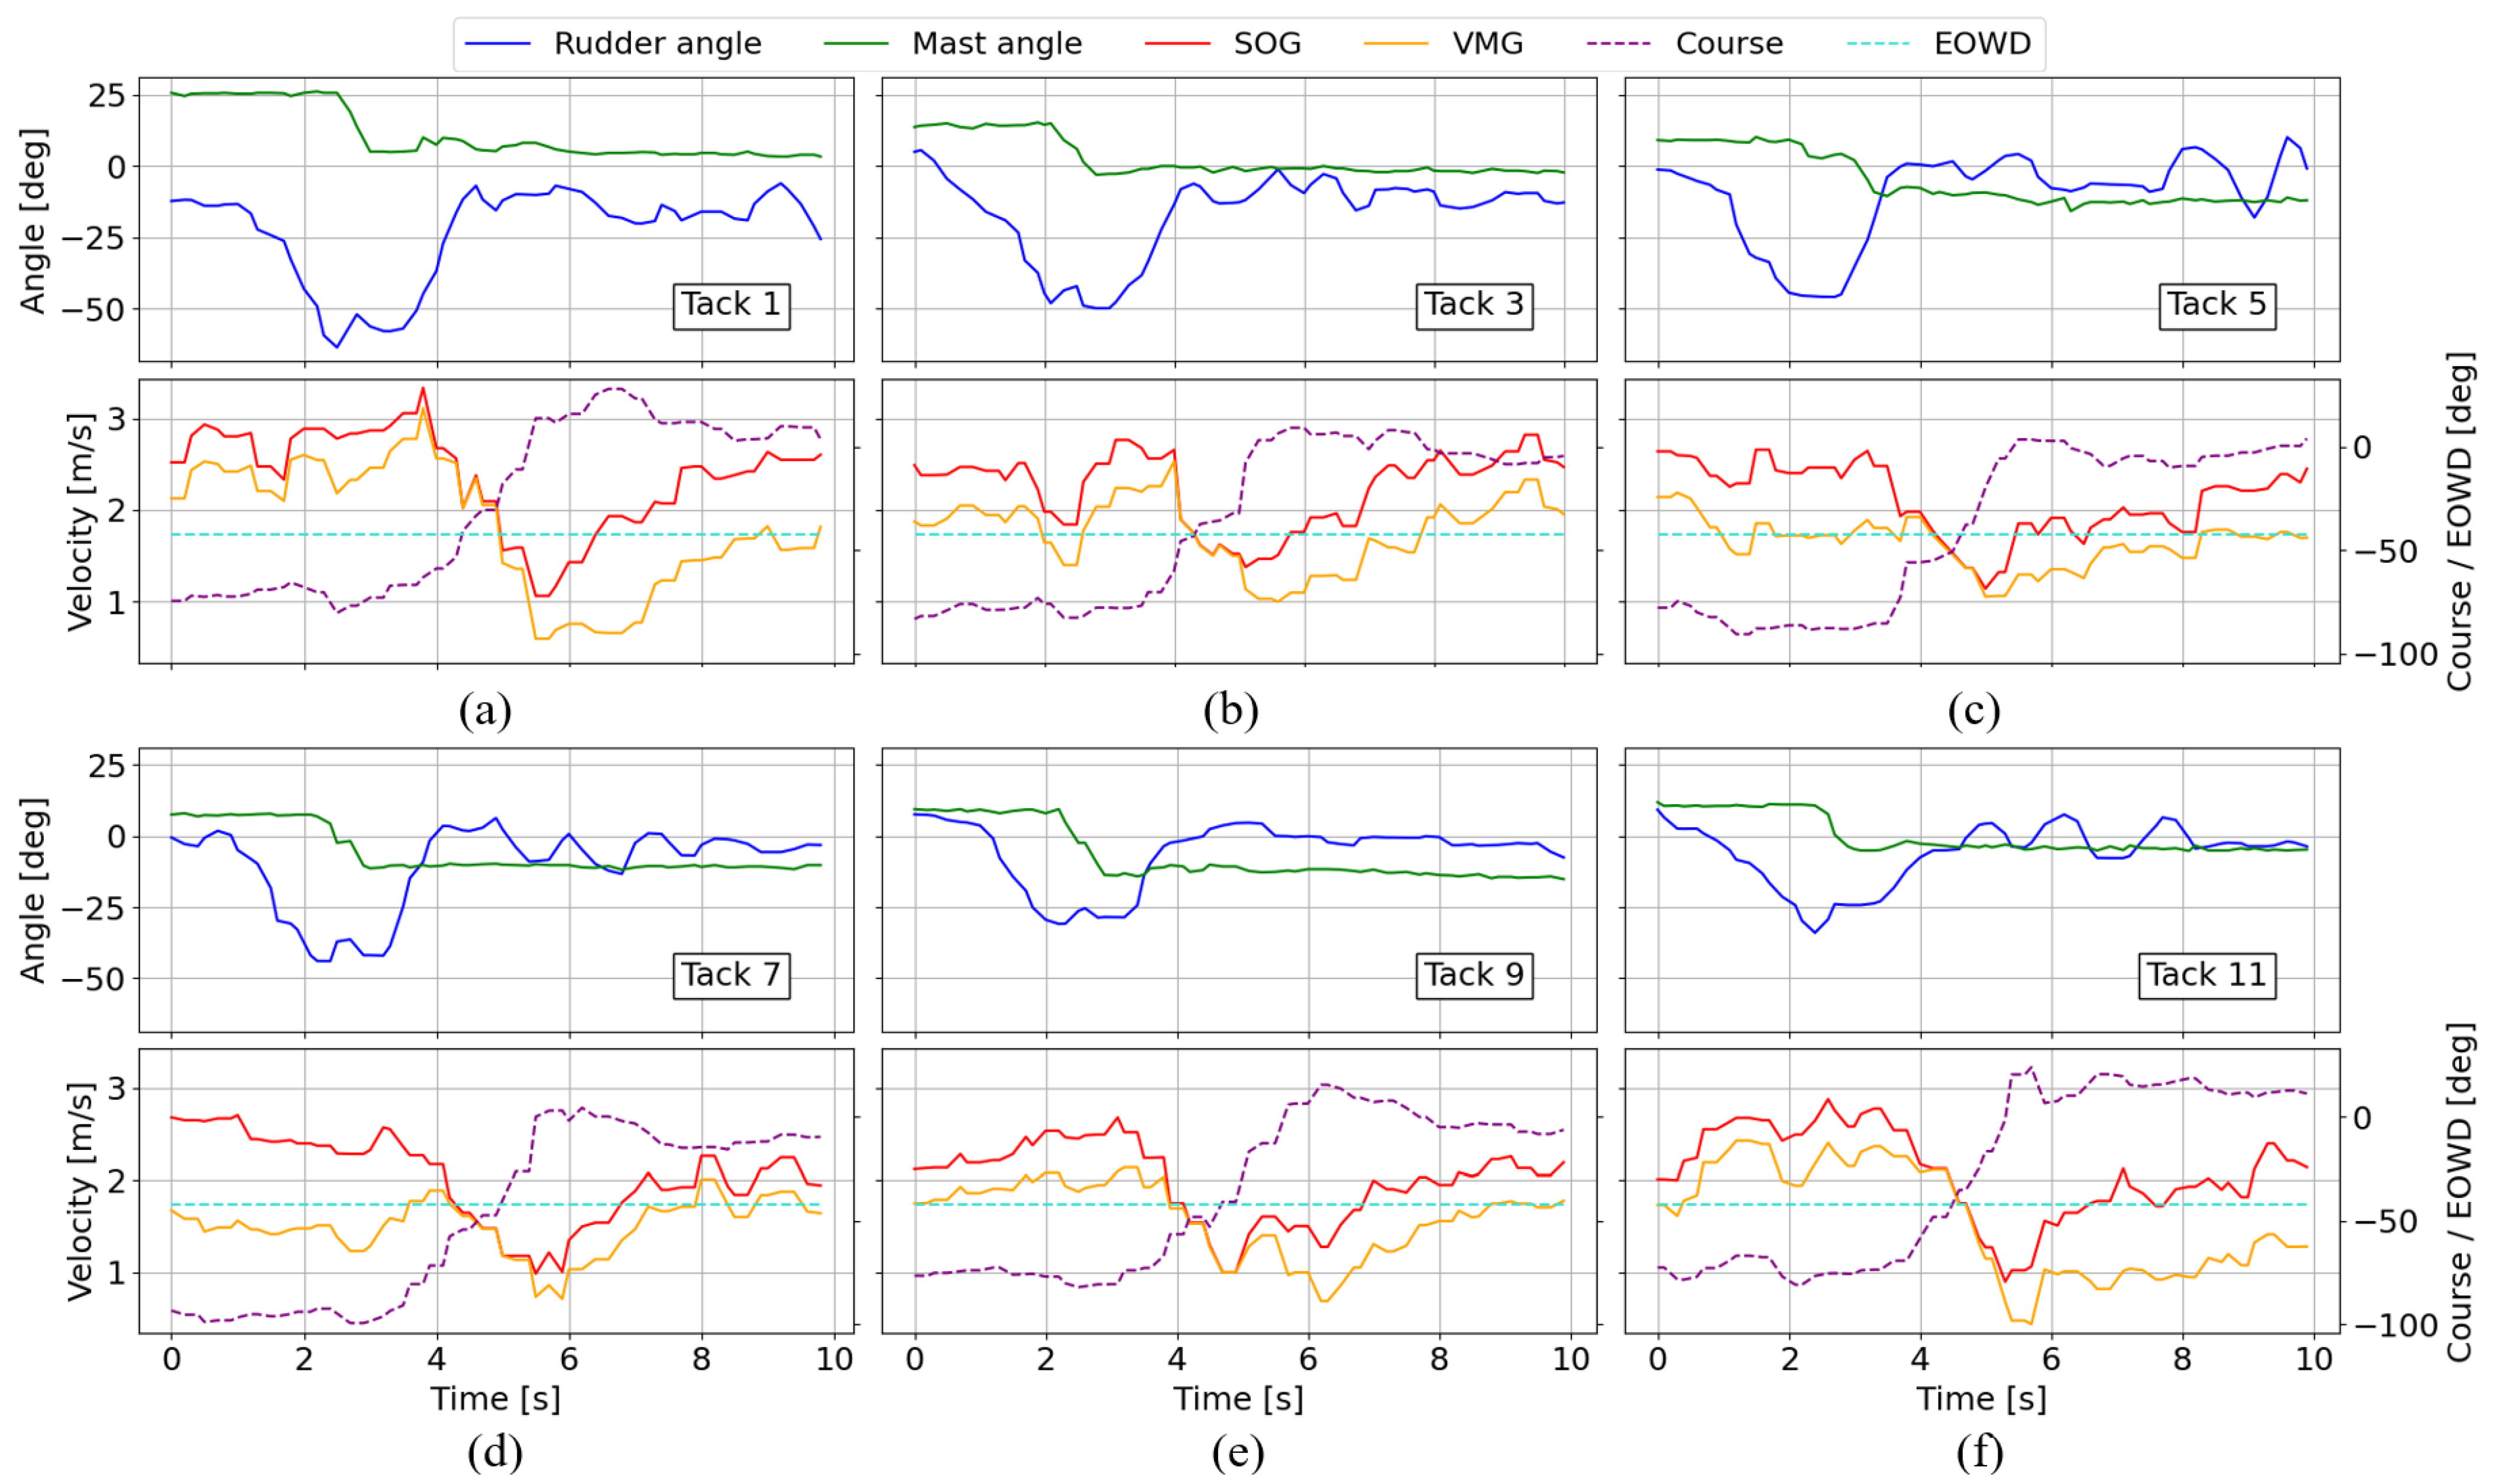
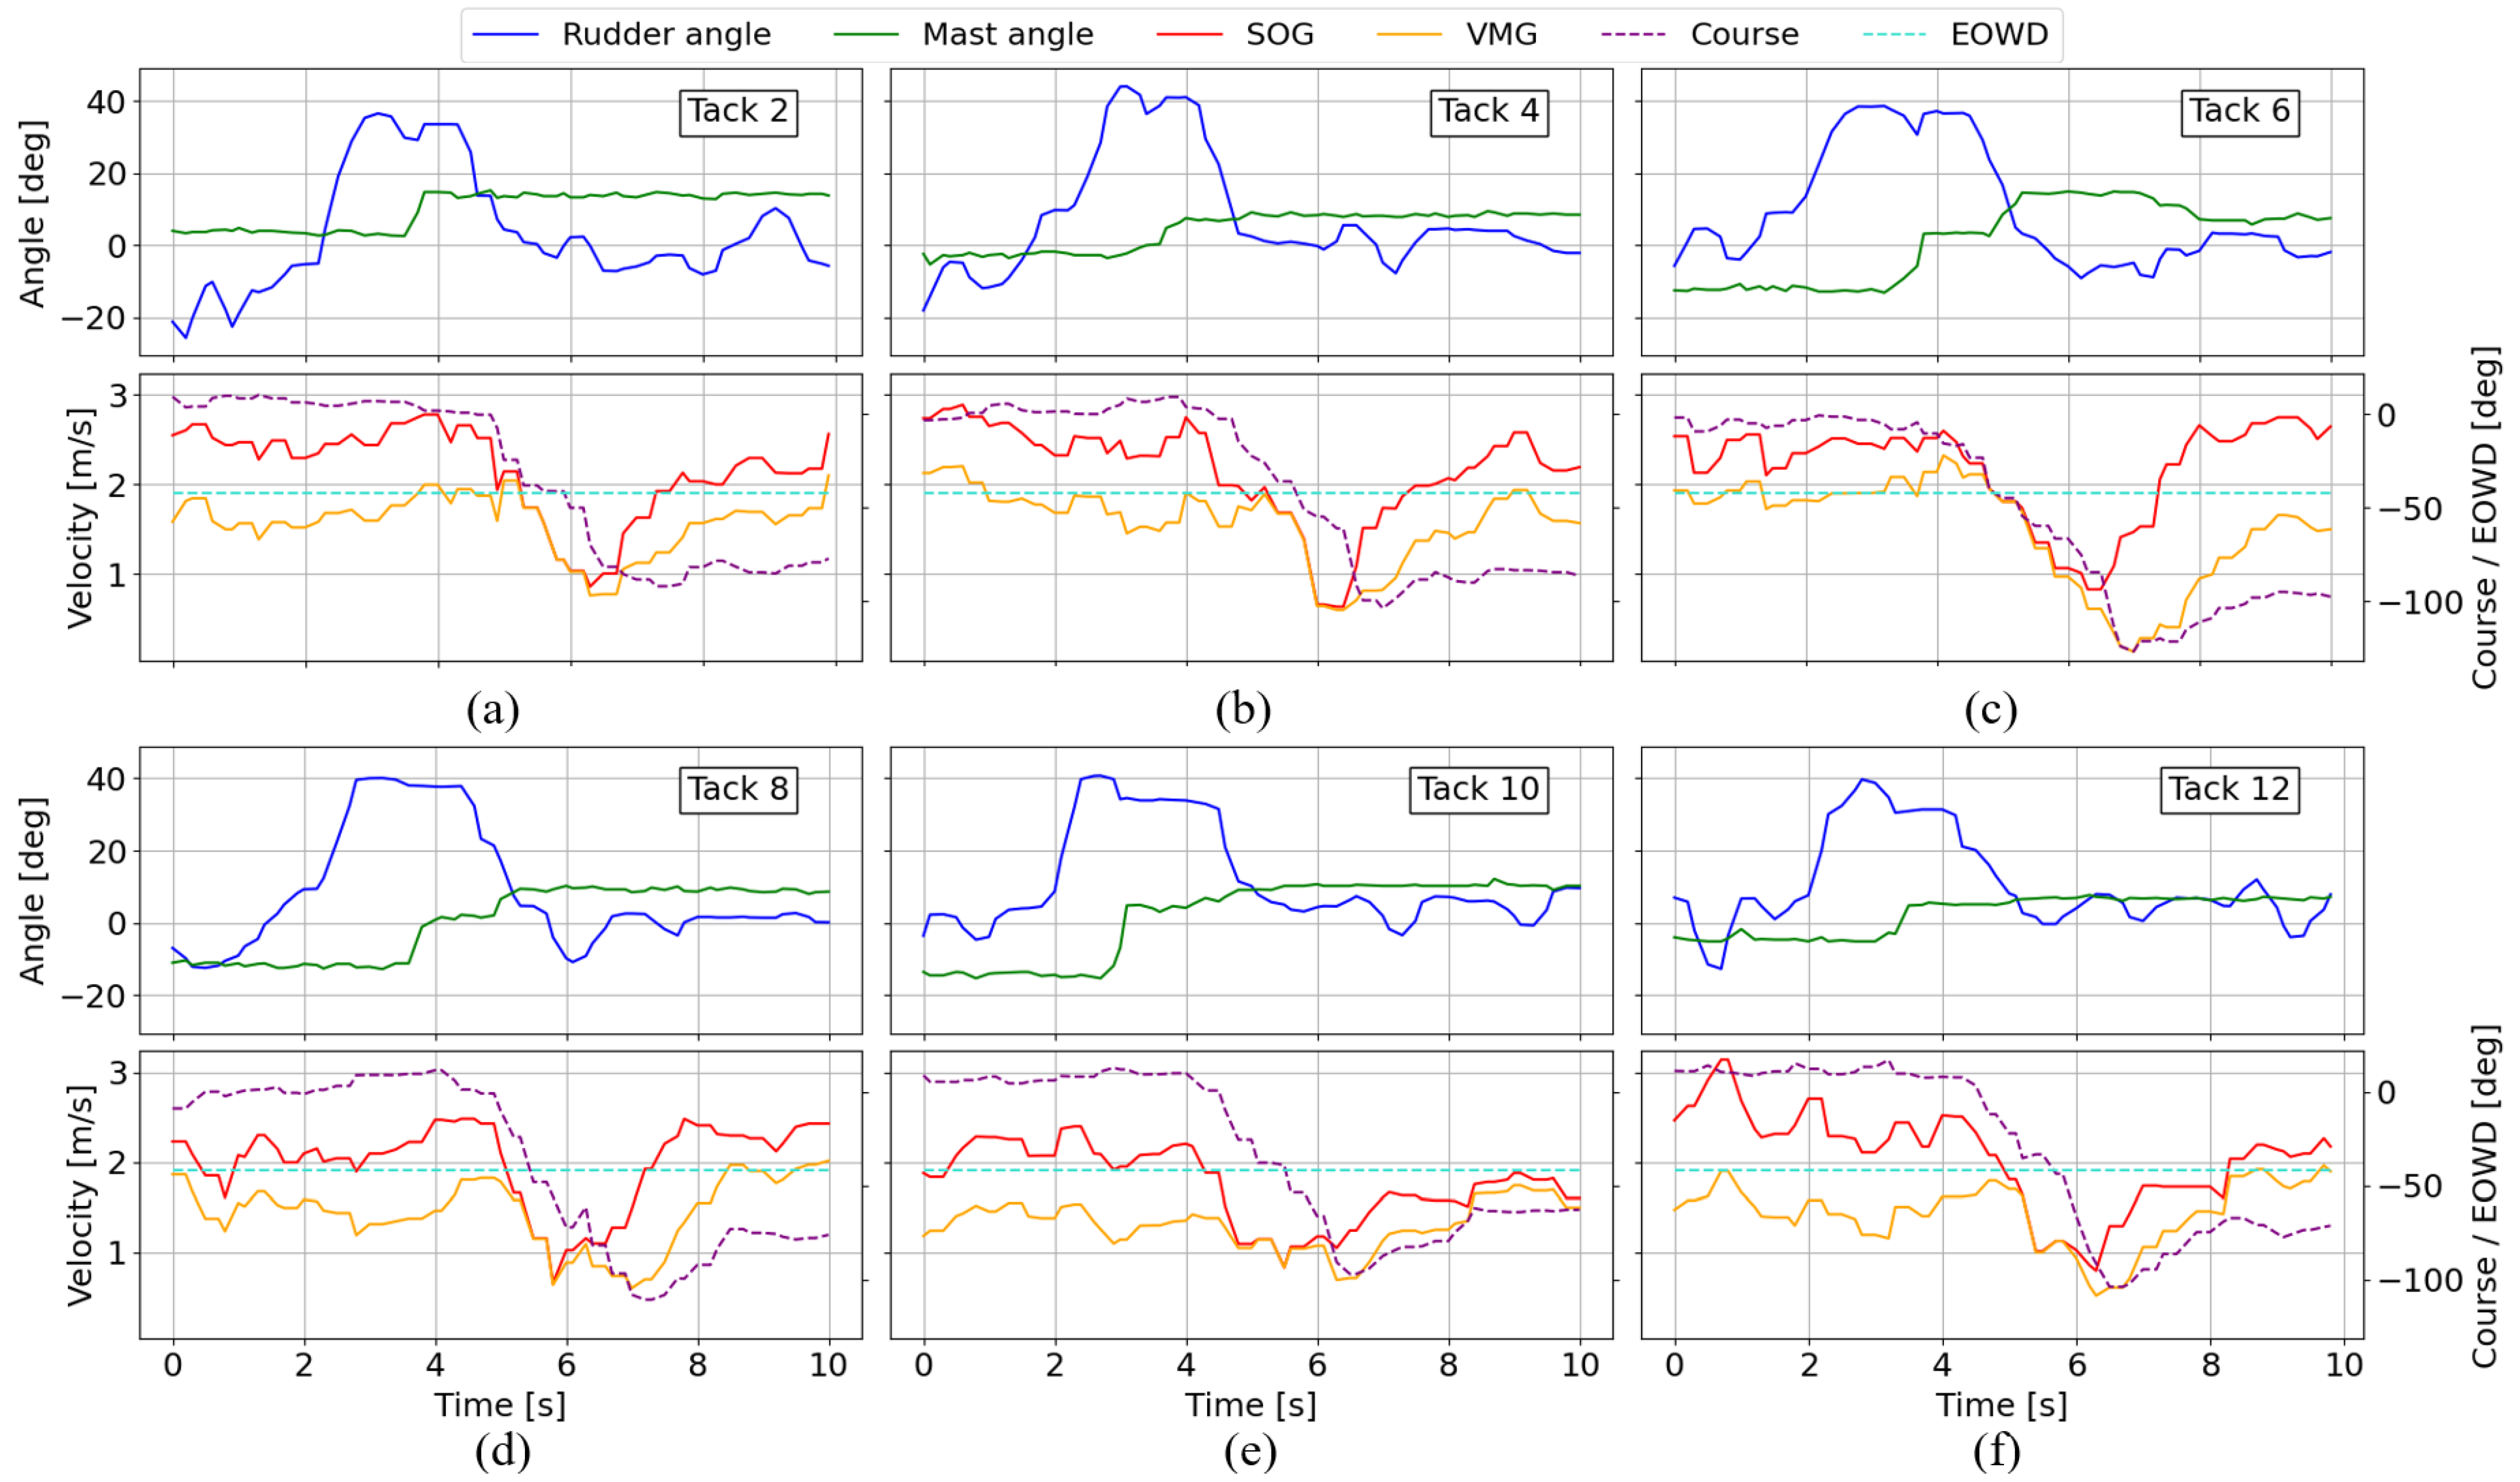
Figure 5 shows timeseries data for the six starboard tacks in subplots (a)–(f). The timeseries data for the port tacks are shown in
Figure 6. For each figure, the upper plots display the measured rudder angles (blue) and mast angles (green), while the lower plots in each subplot show the velocities and course of the boat. SOG is shown in red and VMG in orange. The average EOWD is illustrated by a flat dotted line (turquoise) through the plots to provide a reference for the changing course angles. Course is plotted in dotted purple. Corresponding performance metrics for each tack are listed in
Table 2.
In
Figure 4, we observe that the tacks were performed with consistent entry and exit angles. The variations in entry and exit angles likely correspond to variations in local mean wind and gust conditions, requiring the athlete to adjust course to maintain speed. The overall spread in [entry/exit] course was [21°/22°] for the starboard tacks and [18°/33°] for the port tacks. The paths plotted in (a) and (b) provide an indication of the distance traveled within the defined time span of the tack. Across all tacks, we observe a gradual course change through the entry of the tack, while the second half of the tack shows more aggressive turn rates. The paths of starboard and port tacks show that the sailor turns slightly more downwind at the exit of the tack, before stabilizing at a slightly higher course, closer to the wind direction. We will now look at a selection of maneuver properties, with different examples from starboard and port tacks.
In the timeseries of the starboard tacks in
Figure 5, we observe a concise rudder movement (blue) at the beginning of each tack. Most of the tacks on starboard show a double low point in rudder angle. In tack 11 (
Figure 5f), we observe that the rudder angle has a more gradual change and less presence of double-peaked behavior, with a range of 17°. In the phase after the main direction change, we observe active use of the rudder (
). The mast rotation angles are consistent across all tacks, with stable angles before and after the direction change. The abrupt change in mast angle in the tack can be easily identified in each plot and shows the moment when the boom pivots from one side to the other.
The velocity profiles for the starboard tacks provide insights into the overall performance and comparability of the tacks. The mean SOG for the starboard tacks ranges from 2.0 m/s (tack 7 and 9) to 2.4 m/s (tack 1), while the VMG ranges from 1.5 m/s (tack 7 and 11) to 1.8 m/s (tack 1 and 3).
Table 2 lists the time from tack initiation until 80% of the entry velocity is reached. For the starboard tacks, the shortest 80%-SOG time is 6.5 s, found in tack 3. We observe that this time is coupled with a mast angle range of 18° and a rudder angle range of 56°. The mean VMG for tack 3 is 1.8 m/s.
The port tacks are shown in
Figure 6. Looking at the mast angles on the port tacks, we observe two main trends. Tacks 2, 4, 10, and 12 show one sudden change in the mast angle as the boom changes side, while tacks 6 and 8 show a two-step adjustment in the mast angle, confirmed by inspection of GoPro footage. In terms of SOG and VMG, tacks 6 and 8 are close to the overall mean SOG of 2.05 m/s. For tack 6, the mean SOG is 2.2 m/s and the mean VMG is 1.5 m/s. Tack 8 is slower with a mean SOG of 2.0 m/s and VMG of 1.4 m/s. The tack with the shortest 80%-SOG time on the port side is tack 8.
The overall mean SOG of the starboard tacks is 2.13 m/s, compared to 2.05 m/s for the port tacks. The overall mean VMG differs from 1.63 m/s on the starboard tacks to 1.48 m/s on the port tacks. Detailed statistics for each tack can be found in
Table 2 below. Looking at the rudder angles throughout the port tacks (
Figure 6), we observe the same double-peaked shapes as for the starboard tacks. Tacks 2, 4, and 6 show a slight dip in the plateau of the maximum rudder range. The maximum rudder angle stays stable for approximately 1.5 s in tack 8. Tacks 10 and 12 show a strong initiation of the tack with the rudder, followed by a short correction to a less aggressive rudder angle in the second phase of the plateau.
4. Discussion
The main aim of this study was to develop and test a sensor system to enable more detailed analysis of maneuver performance for the ILCA Olympic dinghy. We demonstrated a novel, low-cost, multi-sensor system for in situ measurement on the boat, followed by a presentation of the selected upwind tacking data. The discussion on the collected data will serve as a foundation for how detailed in situ data analysis could look when the system is deployed in an athlete–coach collaboration scenario for enhancing technique. We will now discuss the data results and the proposed system, followed by an evaluation of our study relative to previous research.
As the ILCA 7 is a single-handed dinghy, the rudder movements directly influence not only the course but also velocity, drag, and interaction with waves. The measured mast rotation provides new insight into how the sail is continuously adjusted, depending on the momentary weather conditions for each tack. As shown in the results, the rudder movement during the initiation of the tacks exhibits a double-peaked trend. This could indicate either an adjustment motion provoked by the sailor, the passing of the tiller behind the sailors back, or the fact that the rudder motion induces rotational motion on the boat, delayed by water resistance. Comparing the starboard tacks, we can see that the gradual entry into tack 11 results in a much slower tack and more loss of boat momentum. The mast rotations combined with the change in course could indicate the amount of pressure the sailor puts on the boat and main sheet. Port tacks 6 and 8 show some of the most efficient transitions of all the tacks, with aggressive rudder action to enter the tack, followed by a two-step adjustment of the main sail, seen in the mast rotations. The sailor enables quick acceleration by over-steering slightly lower with respect to the wind for a short period of time to gain SOG, before adjusting course to optimize for VMG. This is supported by the fact that broad reach is overall faster (SOG) than upwind [
1]. Note that the tacking course range will be influenced by this compensation if it is maintained for longer periods of time.
The nuances of SOG versus VMG are of great importance in sailing competitions, and the EOWD was defined to provide an accurate foundation for the comparison of VMG. The internal shifts in wind around the land formations surrounding the test site are likely the reason behind the offset between MWD and EOWD. For future experiments, onboard wind data collection is desired to expand our analysis with details on the subtle changes from port to starboard. This could indicate if a sailor has a faster side and why that is the case. A potential cause for the offset in MWD and EOWD lies in the natural tidal currents in Trondheim Fjord, which can lead to a sideward shift, influencing the port and starboard course angles. Further, we defined the 80%-SOG time as a performance measurement for the regaining of lost speed in the tack, a metric influenced by variations in entry SOG. The 80%-SOG time should always be considered together with the overall average SOG and VMG of the tack, to ensure that techniques found in overall slower tacks are not preferred simply because of short 80%-SOG timings. A good example is found in tack 8, which has the lowest 80%-SOG time of all the port tacks, but also the second lowest mean SOG of the port tacks. To support objective and replicable analysis, we chose to define the tack ending using a fixed time interval, rather than relying on subjective interpretations. Upwind tacking has served as an example maneuver for analysis. Jibing and steady course wave interactions are suitable for analysis using the same data. We focused on the novel angle measurement systems and on connecting these data points with position–velocity data for performance analysis, not including IMU data at this point.
The main advantages of the presented system is its robustness, battery life, and waterproofing. The field testing in the Trondheim Fjord involved both harsh saltwater spray and periods of complete submersion for the rudder sensor. The efficient, non-intrusive mounting process for the sensors allows athletes to use the measurement system in training, remove the system with ease, and proceed straight to competition without worrying about illegal modifications to the boat. The sailor reports the system to be “non-intrusive and small enough to not interfere with the sailing experience”. The proposed sensor setup also has the advantage of being low-cost. This has been a criterion followed consistently through the component selection and development process to ensure rapid development and to avoid fixation on specific solutions due to large investments. One consequence of this design choice has been some sacrifice in accuracy in the potentiometers used for angle measurement. The current potentiometers are slightly affected by temperature. For the next iteration of the system, we propose to implement high-precision encoders to ensure even better data quality. The usability of the current system has two main limitations: form factor and threshold for post-sailing analysis. The physical sensor system is currently a proof of concept, consisting of several 3D printed parts and bulky components such as the waterproof mechatronics hub. An important part of our plan for further development is to optimize the electronics for a smaller form factor while maintaining the current advantages of robustness and long battery life for practical use in the field. The data analysis is currently performed in post, with Python 3.11.9 tools and several manual steps. The next step in our development process will involve streamlining the analysis to efficiently allow coaches to analyze field data with athletes. We also plan to implement automatic anomaly detection for GNSS data loss caused by submersion or other factors, and to improve the fixed-time maneuver completion definition by accounting for varying sailing conditions. Another point for system improvement is to enhance the mast rotation measurement by also measuring the angle between the mast and the boom.
Looking at our study in the broad context of existing research, we can see three main tracks in Olympic sailing research. The first track involves analyses of large datasets to acquire a better understanding of general trends in ILCA sailing [
1,
4]. The second track involves simulated environments, which currently has limited transferable value to on-water sailing due to challenges in properly recreating environmental conditions [
10,
13,
19]. The third track revolves around field tests with data collection and analysis of some physical properties measured, such as orientation and position–velocity with a GNSS [
2,
21]. Following the conclusions of [
22], in situ data collection and analysis have the highest value for athletes and coaches. We aimed our research towards the third main track, and expanded the possibilities within on-water sailing analysis through new measurement systems for onboard logging combined with existing tools like GNSS for position–velocity tracking. We aimed to build on existing research on in situ measurements and provide new data to enable coaches and athletes to train and perform better by applying detailed maneuver analysis to their training in a continuous feedback loop. The presented system architecture can be expanded with additional sensors and has the potential to improve sailing performance at the top level by providing detailed measurements previously unseen in Olympic ILCA sailing.


