Article

Discrete Element Analysis of Grouting Reinforcement and Slurry Diffusion in Overburden Strata

State Key Laboratory of Simulation and Regulation of Water Cycle in River Basin, China Institute of Water Resources and Hydropower Research, Beijing 100038, China
*
Author to whom correspondence should be addressed.
Appl. Sci. 2025, 15(15), 8464; https://doi.org/10.3390/app15158464
Submission received: 12 June 2025 / Revised: 24 July 2025 / Accepted: 29 July 2025 / Published: 30 July 2025
(This article belongs to the Section Civil Engineering)

Abstract

Research on the grouting reinforcement mechanism of overburden is constrained by the concealed and heterogeneous nature of geotechnical media, posing dual challenges in theoretical analysis and process visualization. Based on discrete element numerical simulations and laboratory tests, an analytical model for grouting reinforcement in overburden layers is developed, revealing the influence of grouting pressure on slurry diffusion shape and distance. The results indicate the following: (1) Contact parameters of overburden and cement particles were obtained through laboratory tests. A grouting model for the overburden layer was established using the discrete element method. After optimizing particle coarsening and the contact model, the simulation more accurately represented slurry diffusion characteristics such as compaction, splitting, and permeability. (2) By monitoring porosity and coordination number distributions near grouting holes before and after injection using circular measurement, the discrete element simulation clearly visualizes the slurry reinforcement range. The reinforcement mechanism is attributed to the combined effects of pore structure compaction (reduced porosity) and cementation within the overburden (increased coordination number). (3) Based on slurry diffusion results, a functional relationship between slurry diffusion radius and grouting pressure is established. Error analysis shows that the modified formula improves the goodness of fit by 34–39% compared to the classical formula (Maag, cylindrical diffusion). The discrete element analysis method proposed in this study elucidates the mechanical mechanisms of overburden grouting reinforcement at the particle scale and provides theoretical support for visual evaluation of concealed structures and optimization of grouting design.

1. Introduction

Grouting is an efficient, convenient, and flexible anti-seepage treatment technique for overburden strata. The core principle is to inject slurry into the overburden under grouting pressure, forming a continuous solidified vein, thereby effectively reducing seepage pressure or flow beneath structures [1]. However, the concealed nature of grouting, coupled with the loose structure and heterogeneous particle size of the grouted medium, poses significant challenges to studying slurry diffusion mechanisms in overburden, resulting in a reliance on empirical knowledge during construction. Therefore, research on visualization and numerical simulation of the grouting process holds both theoretical value and practical significance for guiding overburden grouting in hydropower projects.
Numerical simulation methods offer distinct advantages in addressing complex engineering problems, owing to their intuitive and detailed nature. They not only provide solutions to grouting challenges but also dynamically visualize both global and local diffusion patterns during the grouting process [2]. Various numerical simulation techniques—including the finite element method [3], extended finite element method [4], boundary element method [5], and composite element method [6]—have been employed for detailed analyses and engineering applications related to grouting diffusion. Regarding the theory of cement slurry diffusion, Bouchelaghem and Vulliet [7], Papanastasiou et al. [8], and Zhou et al. [9] derived diffusion formulas based on porous media theory and validated the accuracy of cement slurry diffusion models. In research on grouting construction strategies, Wang Dongliang et al. [10] developed a refined 3D geological model integrating various geological data and proposed a three-dimensional mathematical model for Bingham fluid turbulence during grouting. Ao et al. [11] simulated grouting in porous media under sequential porosity conditions and analyzed the diffusion behavior of cement slurry. Although continuum-based numerical simulation of grouting has achieved notable success, traditional approaches to overburden grouting and anti-seepage reinforcement primarily emphasize macroscopic project safety and stability, often neglecting the particle-scale heterogeneity of overburden and cementitious media [12]. This idealization frequently leads to discrepancies between simulation outcomes and real-world performance. In addition, constitutive models based on continuum mechanics typically capture only specific aspects of soil behavior and have limited applicability. Their formulations are often dominated by mathematical assumptions rather than physical principles, which makes it difficult to accurately account for the interaction processes between slurry and soil. As a result, certain micro-scale reinforcement mechanisms cannot be effectively revealed.
To more accurately capture the heterogeneous structure of the overburden and visualize the slurry diffusion process, the discrete element method (DEM) combined with random generation techniques offers an effective approach for studying grouting in heterogeneous geotechnical media. Geng Ping [13] investigated the effects of cofferdam grouting on the excavation of water-rich tunnels using the particle flow-based DEM, and analyzed how grouting pressure and hole arrangement affect slurry seepage patterns. Lintao et al. [14] examined grouting in fractured surrounding rock using a DEM-based model, finding that crack dilatancy induced by deviatoric stress widens fracture openings, thereby altering slurry diffusion behavior. However, existing DEM-based grouting studies often simplify formations to uniform particle sizes and simulate slurry vein expansion via hydraulic fracturing, neglecting the pronounced particulate characteristics of both overburden and cement slurry. Zhou Zilong [15] developed a discrete element grouting model using PFC’s Fish scripting language and employed a servo mechanism to apply grouting pressure, thereby simulating the grouting process. The study demonstrated that the discrete element method effectively captures the grouting process and its underlying mechanics. Liu et al. [16] applied the DEM to investigate Bingham fluid diffusion in silty fine sand, identifying relationships among grouting pressure, diffusion radius, and initial splitting pressure. Zhang et al. [17], Zheng et al. [18], and Yu et al. [19] utilized particle flow DEM software to elucidate the diffusion range and pressure distribution characteristics of cement slurry during grouting. Unlike continuum-based models, the DEM does not rely on complex constitutive equations, giving it distinct advantages in simulating the motion behavior of heterogeneous materials such as cement slurry and enabling mesoscopic analysis of its diffusion and mechanical properties. The model established using the discrete element method (DEM) can better capture the internal particle structure of rock and soil media. It allows for the simulation of particle flow behavior and enables the modeling of irregular contact and mutual interpenetration between soil particles, as well as between slurry and soil particles. This approach offers a new perspective for in-depth investigation of overburden grouting and facilitates a more accurate understanding and characterization of complex grouting phenomena.
Currently, there are few theoretical analyses on the interaction mode between slurry–soil in the grouting engineering of cover layer by discrete element method (DEM). In this study, the fundamental diffusion pattern of cement slurry was validated using a two-dimensional discrete element method (DEM) numerical simulation, and the fundamental diffusion pattern of cement slurry is validated through numerical simulation. A dynamic DEM-based simulation of slurry diffusion in overburden strata is implemented. The diffusion mechanism of grouting slurry in overburden is analyzed, and a predictive formula relating slurry diffusion distance to grouting pressure is proposed. The findings provide a theoretical reference for optimizing grouting design in geotechnical engineering.

2. Fundamental Principles of Mechanics

The particle-based discrete element method (DEM) is founded on the theory of discontinuous media. In this framework, the particle system is required to satisfy the equations of motion (equilibrium) and the constitutive (physical) relationships, but it does not need to fulfill the deformation compatibility conditions. In DEM-based grouting simulations, the overburden and cement slurry are discretized into a series of independent particles [20]. The motion of particles is not entirely unconstrained; rather, it is influenced by contact forces arising from interactions with neighboring particles during the evolution process. These contact forces depend on both the extent of particle overlap (i.e., relative displacement) and the specific contact model adopted in the simulation. The motion of each particle is governed by Newton’s second law, with contact force calculations as the core of the method. A grouting model is then constructed using particles endowed with mechanical properties such as accumulation and cementation. Mechanical responses, including stress and displacement, are computed through time-step iteration to simulate the slurry diffusion process within the overburden.

2.1. Wall Servo Loading Mechanism

To ensure that the particle system meets the requirements of uniformity and minimal overlap, the rigid servo mechanism proposed by Cundall et al. is commonly employed. This approach applies a specified confining pressure to the model to bring the particle assembly to the desired initial stress state. Once this state is achieved, appropriate contact parameters are assigned to reflect realistic mechanical behavior, allowing for subsequent analysis. In numerical grouting simulations, it is necessary to impose a predefined confining pressure on the model boundaries to replicate grouting conditions at different burial depths. Furthermore, a specified grouting pressure must also be applied during the grouting process to accurately simulate field conditions. The core principle of this mechanism is to gradually approach the target stress by iteratively adjusting the wall’s velocity. To ensure numerical convergence and stability, the absolute value of each wall stress adjustment must be smaller than the difference between the current stress and the target stress; that is, at each simulation step, the wall loading speed must satisfy Equation (1).
Δ σ w = K n v w Δ t A < α Δ σ
In the formula, Δ σ w —increment of target stress value; K n —the average stiffness value of the contact between particles and the wall; v w —wall speed; Δ t —calculate the time step; A —wall area; α —relaxation factor (generally set to 0.5); Δ σ —the increment of the difference between the target stress and the current stress.

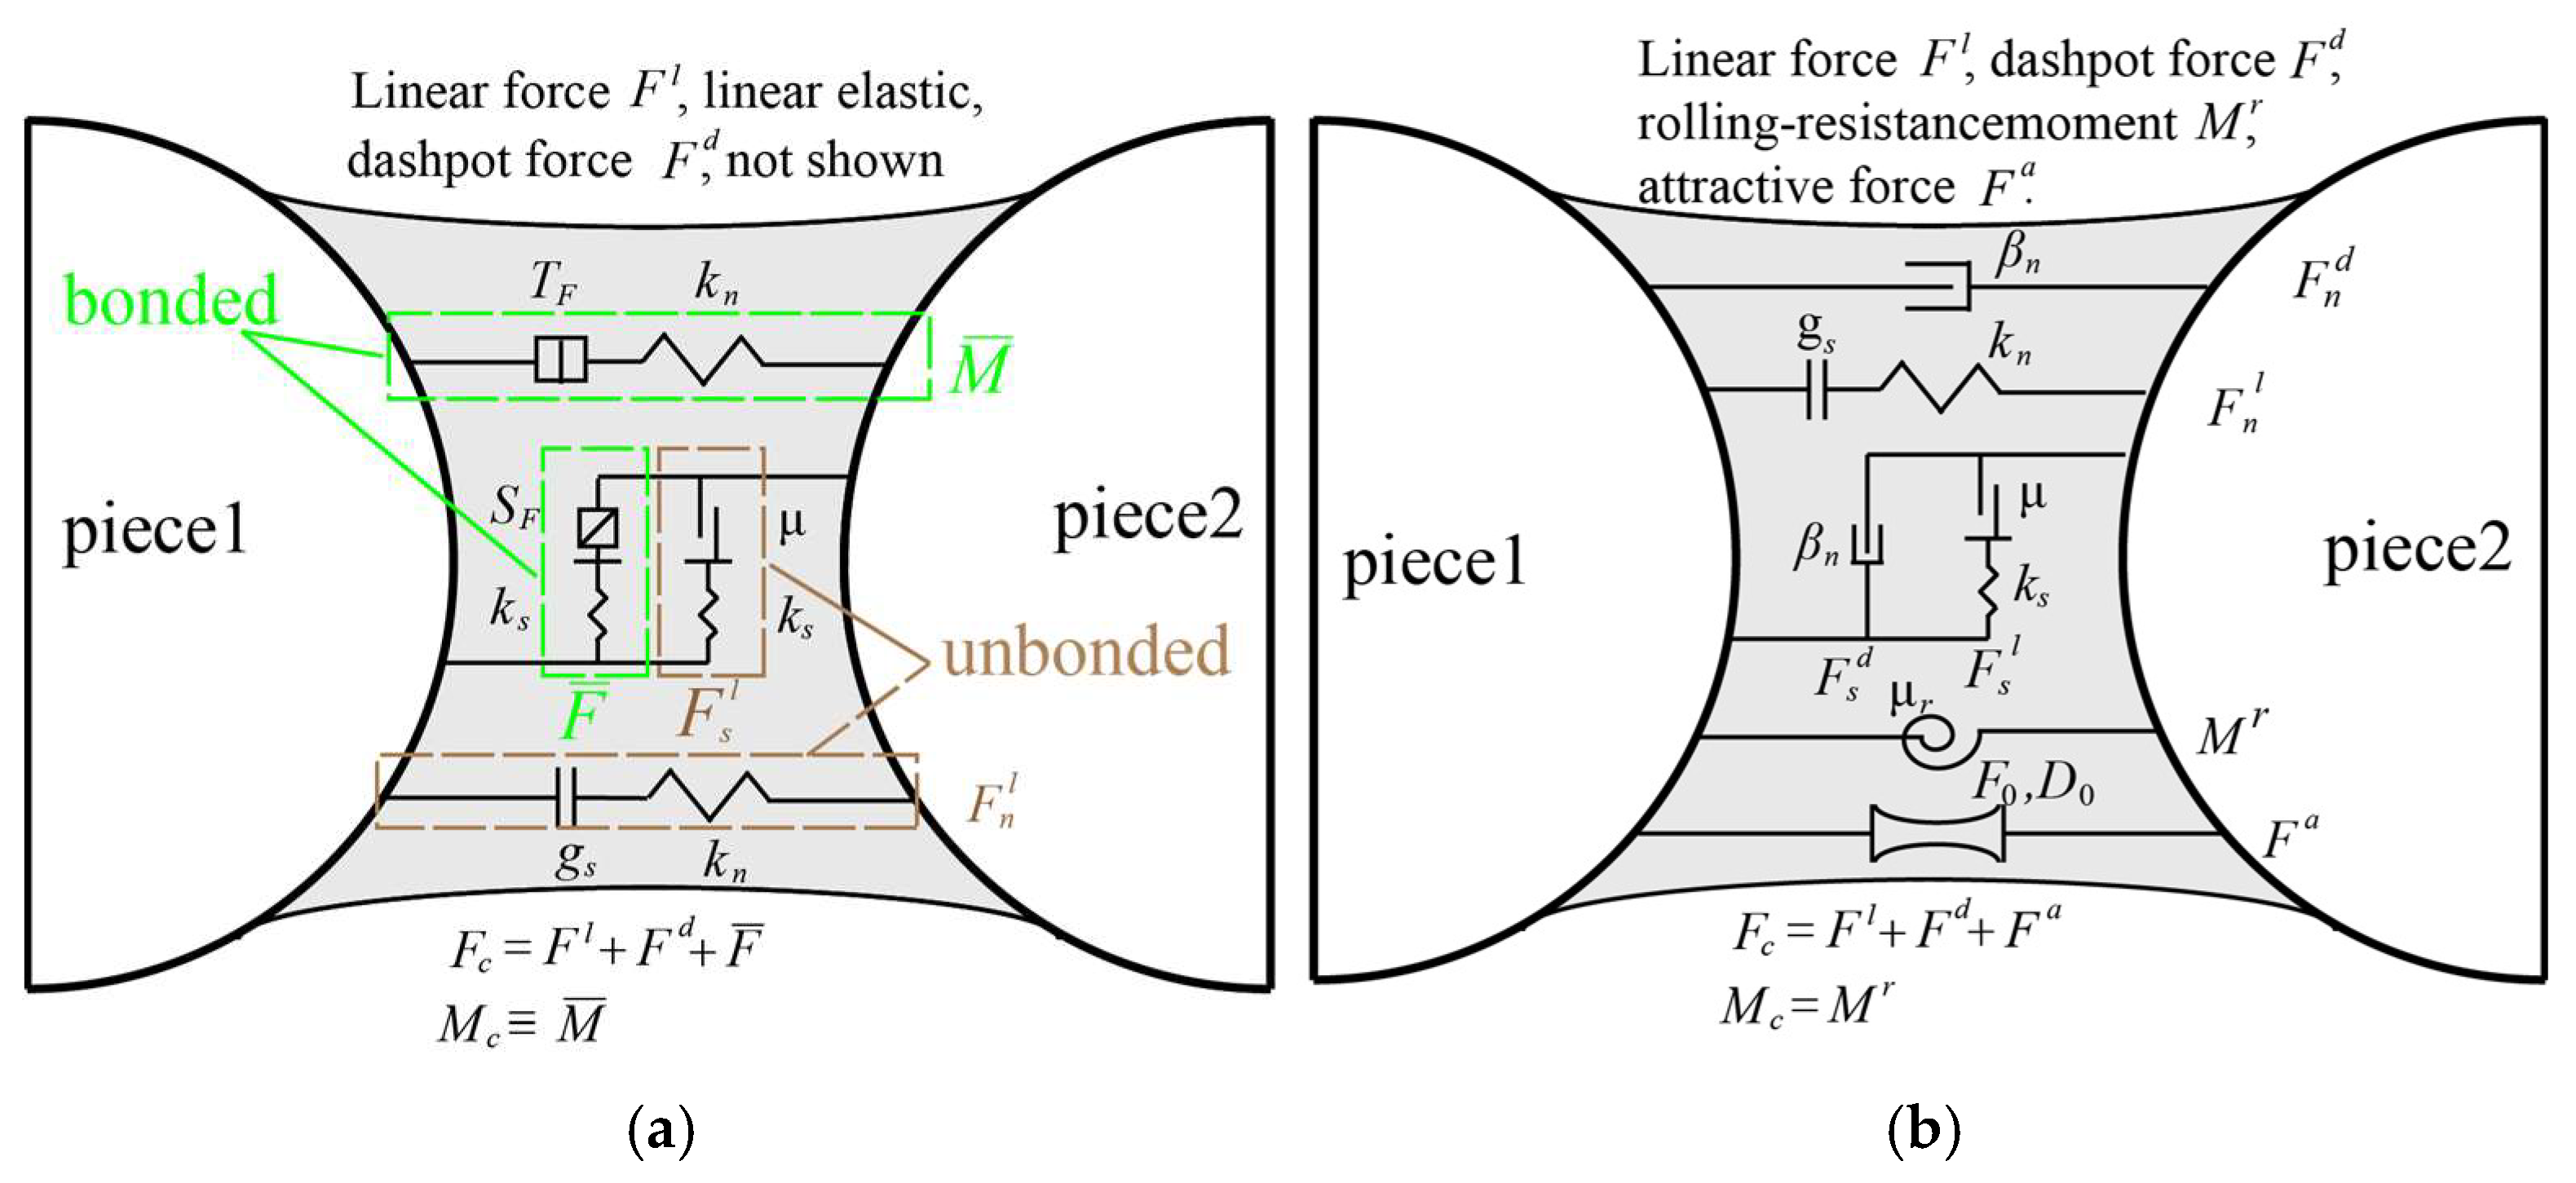
2.2. Particle Contact Contact Model

In the discrete element method (DEM), the physical behavior of particles is governed by the relationship between contact forces and relative displacements, as defined by the constitutive contact model—that is, the physical model describing how contact forces arise from particle interactions. The contact constitutive model is thus the fundamental component of DEM calculations. DEM captures the macroscopic mechanical behavior of a material by simulating the microscopic motions of a large number of particles, including displacement, rotation, and collision. The contact model defines the force–displacement behavior at individual contact points, incorporating mechanical properties such as elasticity, plasticity, and viscosity. The collective response of these microscopic interactions—through statistical averaging or superposition—gives rise to the macroscopic mechanical parameters of the material, such as elastic modulus, internal friction angle, and cohesion. Therefore, the contact constitutive model serves as the essential physical link between microscale interactions and macroscale engineering behavior.
(1) Contact constitutive model of overburden
To more accurately capture the physical and mechanical behavior of the overburden, inter-particle mechanical interactions are modeled using the linear contact bond model (LCBM). The LCBM incorporates a range of contact parameters with strongly nonlinear relationships, while maintaining constant normal and shear stiffness at contact points. This allows it to effectively represent particle bonding and failure behaviors in overburden materials. The LCBM contact constitutive model is illustrated in Figure 1a.
(2) Contact constitutive model of cement slurry
Circular particles with small diameters are used to simulate stable cement slurry for grouting, and the mechanical behavior of cement particles is described using the adhesive rolling resistance linear model (ARRLM). ARRLM is a contact mechanics model based on a linear model. Its core significance is to more truly simulate the complex mechanical behavior of granular materials at the contact point by introducing the adhesion mechanism. Based on the traditional linear model, ARRLM can describe the interaction between particles more accurately by adding the coupling mechanism of adhesion and rolling resistance. Specifically, unlike adhesive materials, this model does not incorporate the concept of damage. As a result, loose yet solid cohesive particles can form, and the rolling kinetic energy of particles is dissipated through viscous forces and friction [21]. The constitutive diagram of the ARRLM contact is shown in Figure 1b.

2.3. Numerical Calculation Assumptions

To achieve the simulation objectives, the following assumptions are made in the numerical grouting model used in this study: (1) Circular particle assumption: a typical group of circular particles is used to simulate the target gradation and cement particles, while the shape effects of particles are neglected. (2) Filling ratio assumption: when determining particle sizes, the groutability ratio is assumed to be greater than 10; i.e., the ratio of overburden particle size D15 to cement particle size d85 exceeds 10. (3) Coarsening assumption: to reduce the total number of particles and computational cost, particle sizes are uniformly scaled up, and each particle represents a bulk soil mass in the numerical simulation. (4) Slurry flow assumption: the flow behavior of cement slurry is simulated by adjusting the tangential stiffness between cement particles, while other fluid characteristics of the slurry are neglected.

3. Model Establishment and Parameter Calibration

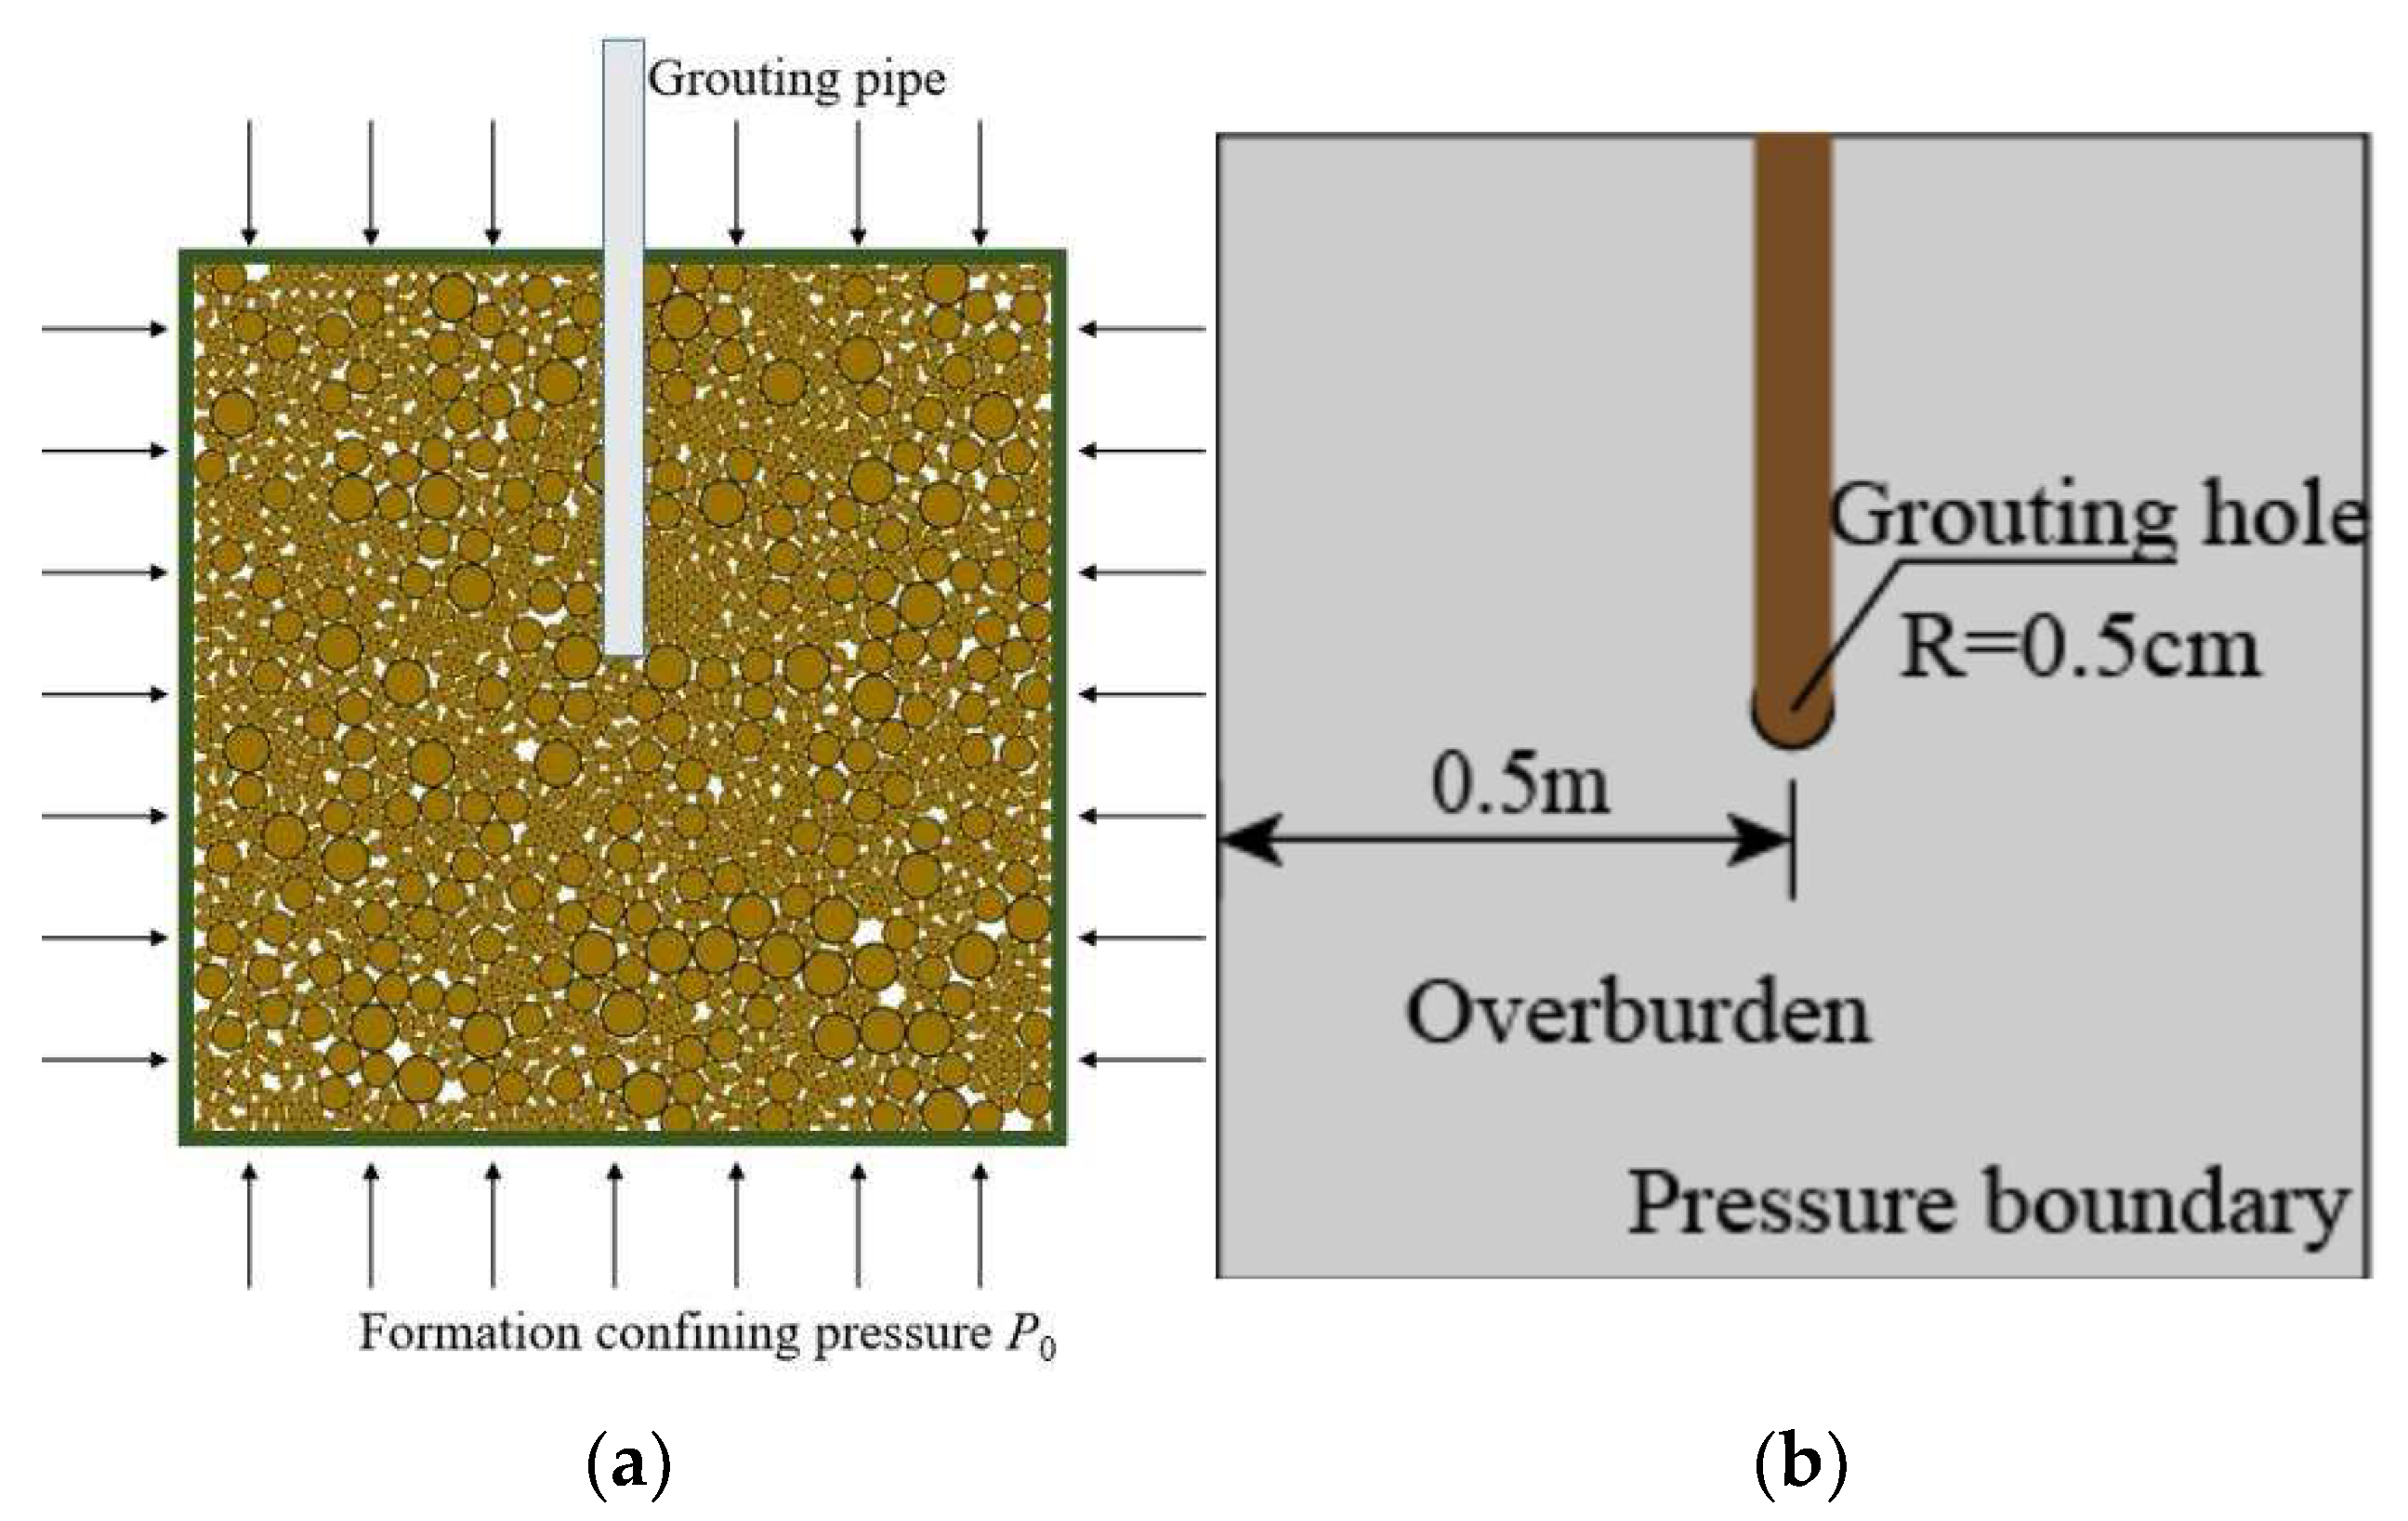
3.1. Geometric Model and Particle Generation

The particle size distribution of the overburden simulated by particle flow in this paper refers to the typical particle size of a grouting project. The corresponding gradation curve is presented in Figure 2. Based on the particle size range above, a program was developed using the Fish language function ball distribute bin to generate overburden particles following the specified gradation. The basic physical and mechanical properties of the simulated overburden are listed in Table 1.
In the numerical grouting model, the d65, d50, and d35 particle sizes of the actual formation (corresponding to 1 mm, 0.5 mm, and 0.2 mm, respectively) are selected and uniformly magnified by a factor of 50, resulting in simulation particle sizes of 50 mm, 25 mm, and 10 mm for the overburden. Due to their small size and large quantity, cement particles present a major computational constraint in discrete element simulations, limiting both scale and efficiency. To ensure slurry fluidity during the grouting simulation, the groutability ratio is set to be greater than 10, meaning the cement particle size is defined as 1 mm. In the simulation, slurry is introduced into the overburden from top to bottom through a grouting pipe. The boundary conditions are defined as follows: the model dimensions are set to 1.0 × 1.0 m; a pressure boundary is applied along the model’s perimeter; the confining pressure P0 of the overburden is set at 500 kPa; and this pressure is applied to the walls using a servo mechanism. The boundary configuration of the grouting simulation model is illustrated in Figure 3b.

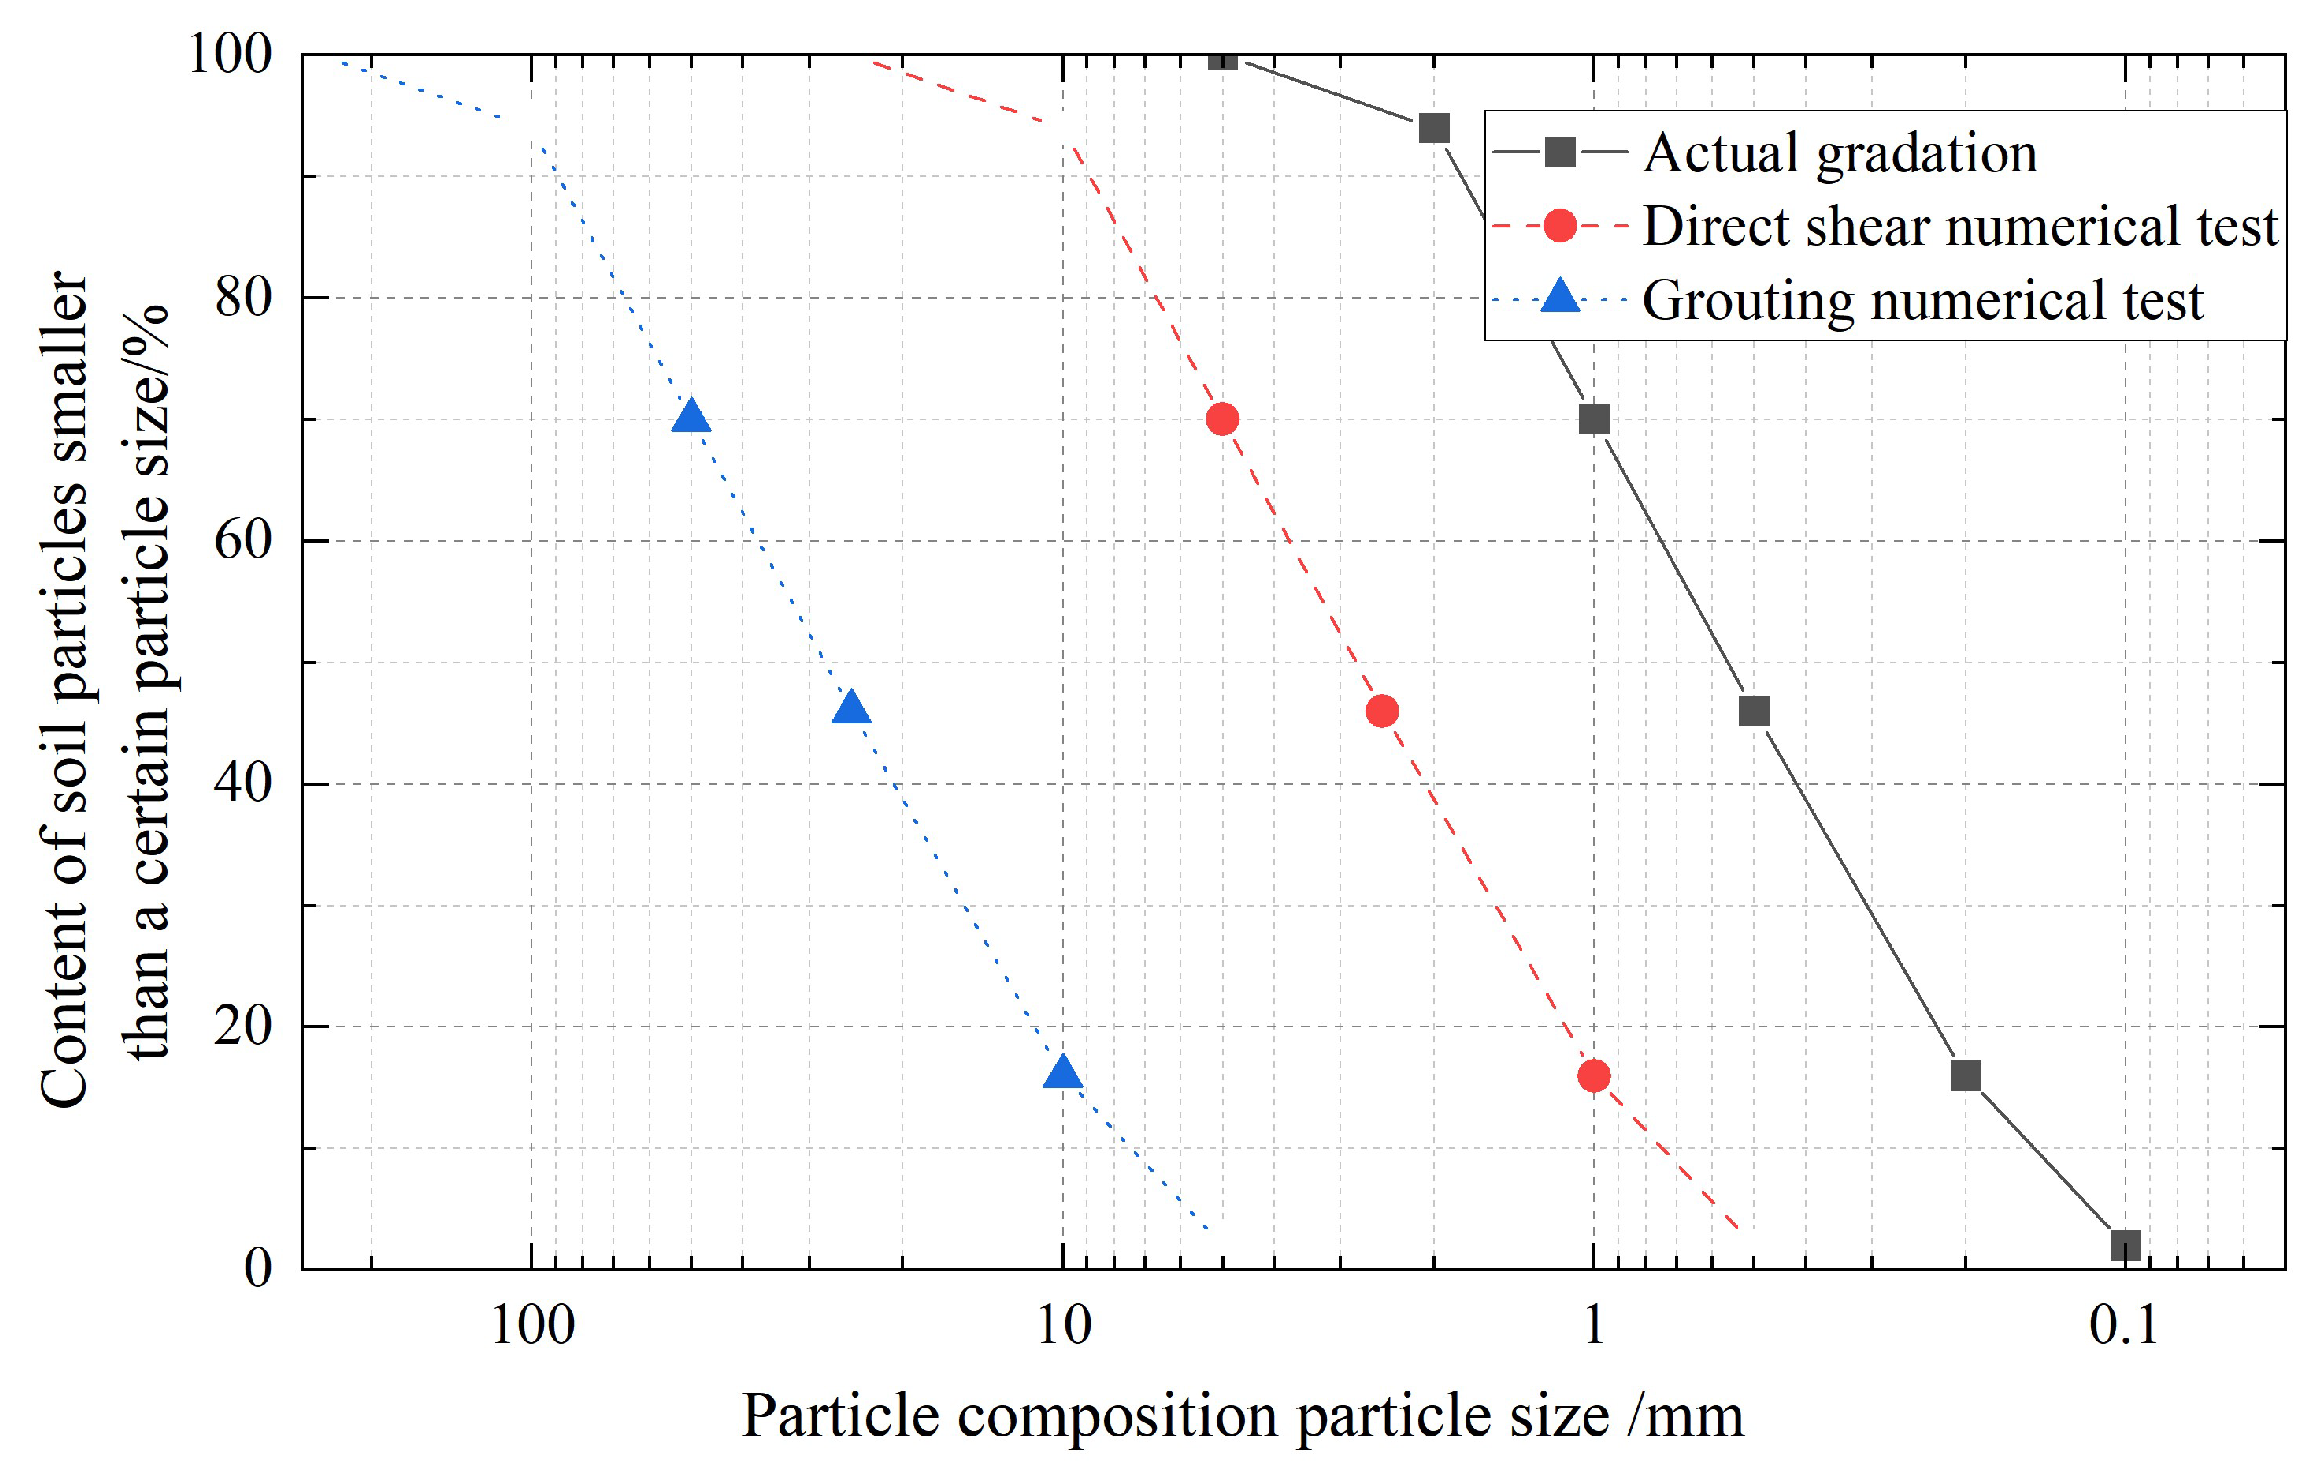
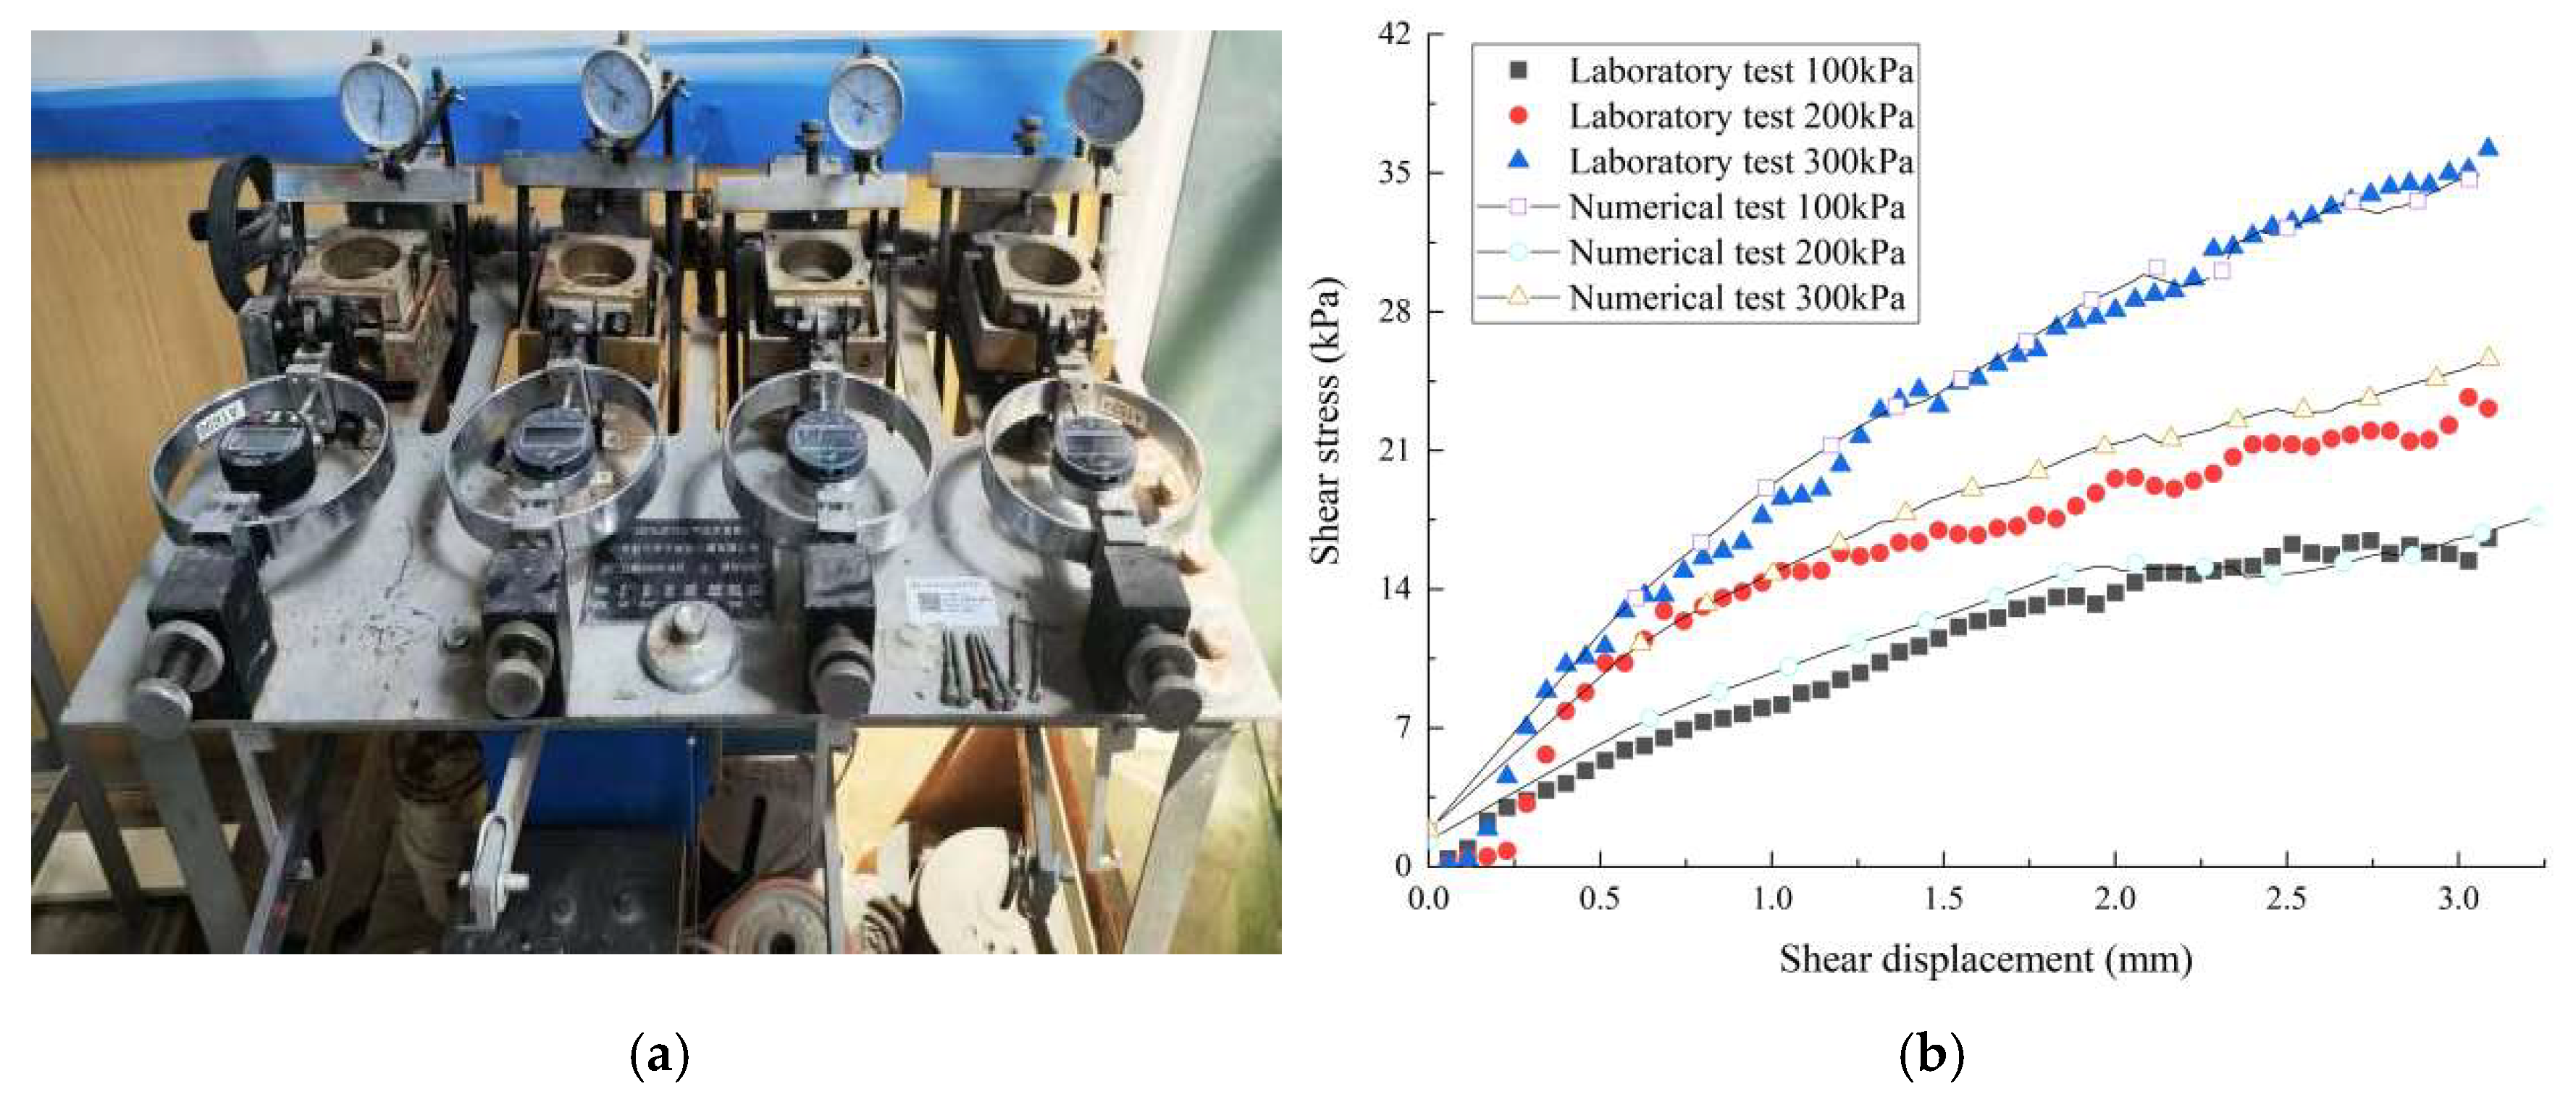
3.2. Overburden Strength Parameter Calibration (Direct Shear Test)

Since macroscopic mechanical parameters of soil—such as cohesion and internal friction angle—cannot be directly input into discrete element software, it is necessary to define mesoscopic parameters, including friction coefficient, stiffness, and stiffness ratio, to construct representative soil specimens. Therefore, in this section, numerical simulation results are compared with laboratory direct shear test data. The mesoscopic parameters required for the grouting discrete element model are determined using a parameter inversion method to ensure that the simulation curves align with the experimental results.
As an effective and straightforward method for analyzing the strength of overburden, the direct shear test offers a clear mechanical basis and high testing efficiency. The ZJ1 strain–controlled direct shear apparatus is used in this laboratory test. Vertical pressures of 100, 200, and 300 kPa are applied, and the shear rate is set to 0.8 mm/min [22]. The test apparatus is shown in Figure 4a. In the numerical direct shear test, a shear box model was constructed at a 1:1 scale based on the actual apparatus dimensions. To reduce computational cost and reference existing research, the particle sizes were scaled up by a factor of five to 0.005, 0.0025, and 0.001 m, respectively. A total of 1207 particles were generated in each shear box, and the overburden particles followed the contact bond model. The shear stress–displacement curve used for calibration is shown in Figure 4b.

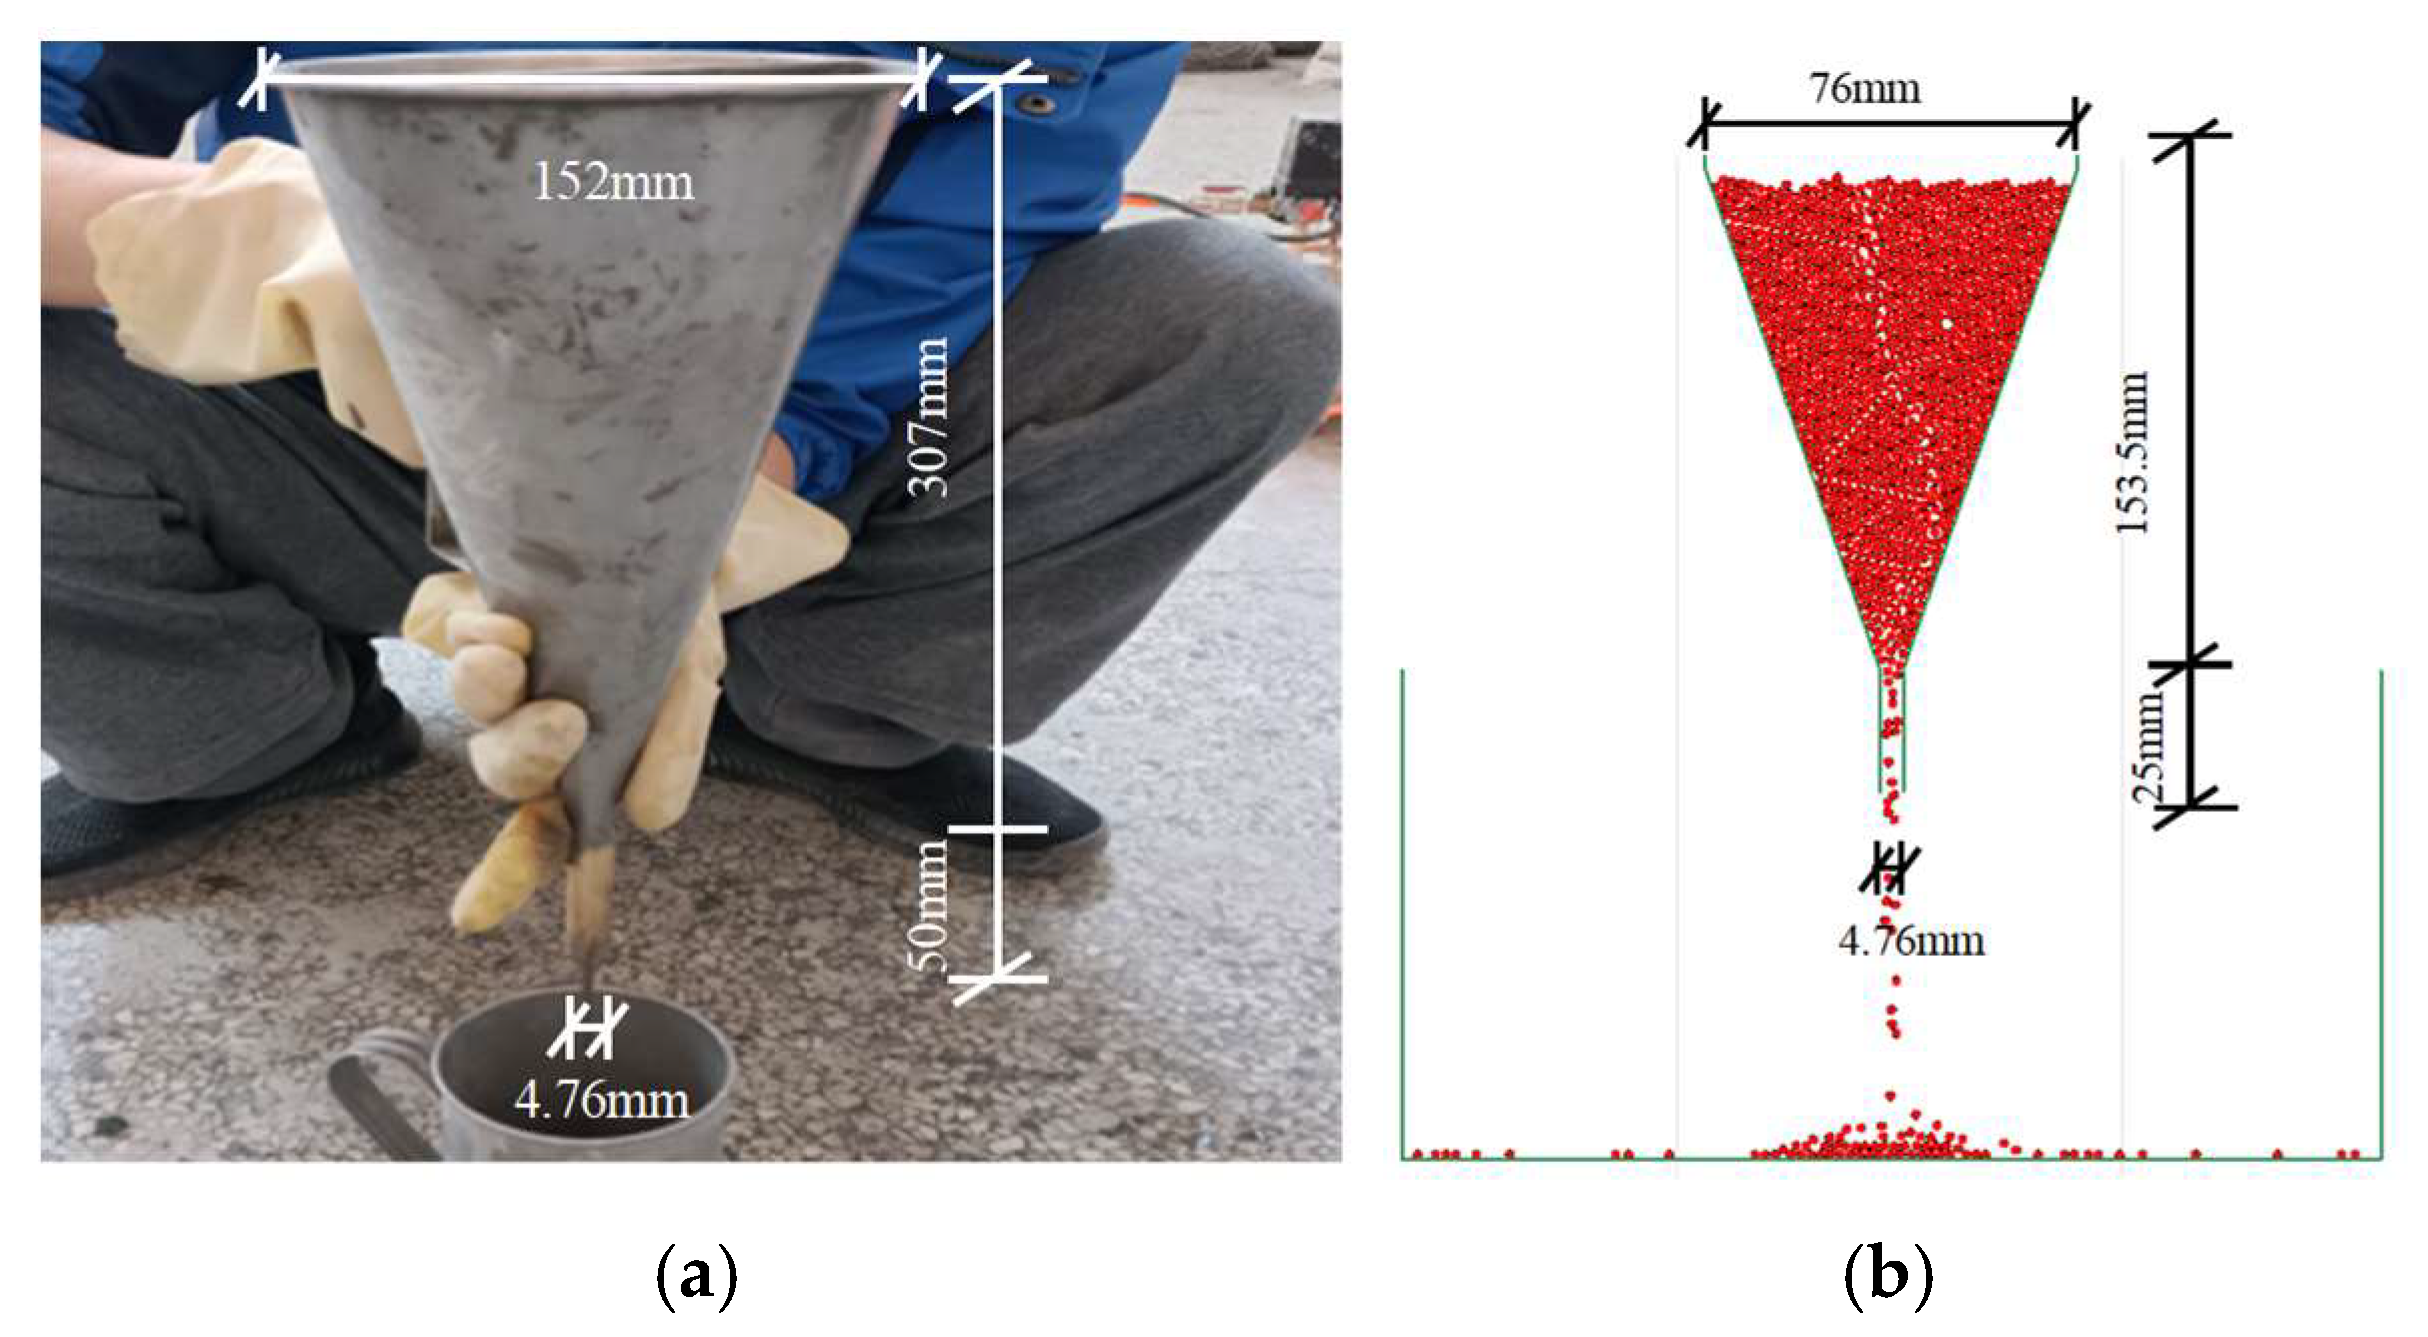
3.3. Calibration of Cement Slurry Flow Parameters (Marsh Funnel Test)

The Marsh funnel test is a simple, rapid, and practical field method primarily used to evaluate the relative viscosity of non-Newtonian fluids, such as cement slurries or other grouting materials. It offers a standardized and reproducible approach for assessing the flowability and consistency of slurry mixtures, serving as a useful indicator of their workability under field conditions. As a classical rheological test method, the Marsh funnel test quantitatively evaluates the workability of slurry by measuring its outflow time through a standardized geometric container. In this study, a stable slurry with a water–cement ratio of 0.7 is used, and its component mass ratio is cement–water–water reducer–bentonite = 1:0.7:0.015:0.005. The water exudation rate within 2 h is measured to be ≤1% in laboratory tests. To improve computational efficiency, the following optimization strategies are employed in the numerical modeling: (1) Geometric similarity criterion: key dimensions of the standard funnel are reproduced at a 1:2 scale. (2) Particle discretization: the characteristic particle size of cement particles is set to 1 mm, and 1341 discrete elements are generated using a random packing algorithm. (3) Contact constitutive modeling: the adhesive rolling resistance linear model is adopted to characterize particle interactions. (4) Parameter inversion and calibration: through iterative optimization of mesoscopic parameters, the simulated outflow time converges to the reference value of 45 s obtained from physical testing. The key geometrical parameters of the Marsh funnel are illustrated in Figure 5a,b.

3.4. Calculation of Particle Coarsening Treatment Method

Due to the small scale of the direct shear and Marsh funnel test models, the corresponding discrete element simulations require limited computational resources. However, when these mesoscopic particles are applied to the overburden grouting model, the number of computational elements increases exponentially. To balance computational accuracy and efficiency, a multi-scale particle size optimization strategy is implemented based on a stepwise amplification method [23]. Coarse graining is not merely a matter of increasing particle size; it typically requires corresponding adjustments to material parameters—such as contact stiffness, damping coefficients, and friction coefficients—to ensure the rationality of particle behavior. The core objective of particle coarsening is to enable efficient simulations at larger spatial and temporal scales while preserving the macroscopic physical behavior of the system. This is achieved by reducing computational complexity without compromising the fidelity of the simulation results. The implementation process involves the following steps: (1) Initially, direct shear tests and Marsh funnel tests were performed using the same model scale and a smaller particle radius, consistent with laboratory conditions. Through iterative trial-and-error calibration, the mechanical parameters derived from the numerical simulations were aligned with the experimental results, thereby yielding a set of appropriate PFC parameters. (2) Similar grading: Maintain the original particle gradation of the overburden while proportionally enlarging the model’s geometric dimensions. (3) Parameter equivalence correction was performed by applying particle size scaling and mesoscopic parameter inversion to ensure that the macroscopic mechanical response of the system remained consistent. Based on the calibrated parameters from the initial step, a larger-scale model was subsequently constructed to assess its mechanical performance. This approach enables model upscaling while preserving the fidelity of particle interaction characteristics. (4) Iterative convergence control: Repeat the first two steps until the desired model scale is achieved. After grading and amplification, the particle size of the overburden and cement particles is enlarged by factors of 50 and 20, respectively. As a result, the minimum particle size of the overburden is 0.01 m and that of the cement is 0.001 m in the grouting simulation, ensuring that the groutability ratio exceeds 10. After recalibrating the contact constitutive parameters, the particle contact properties used in the grouting simulation are listed in Table 2.

4. Discrete Element Grouting Diffusion Results

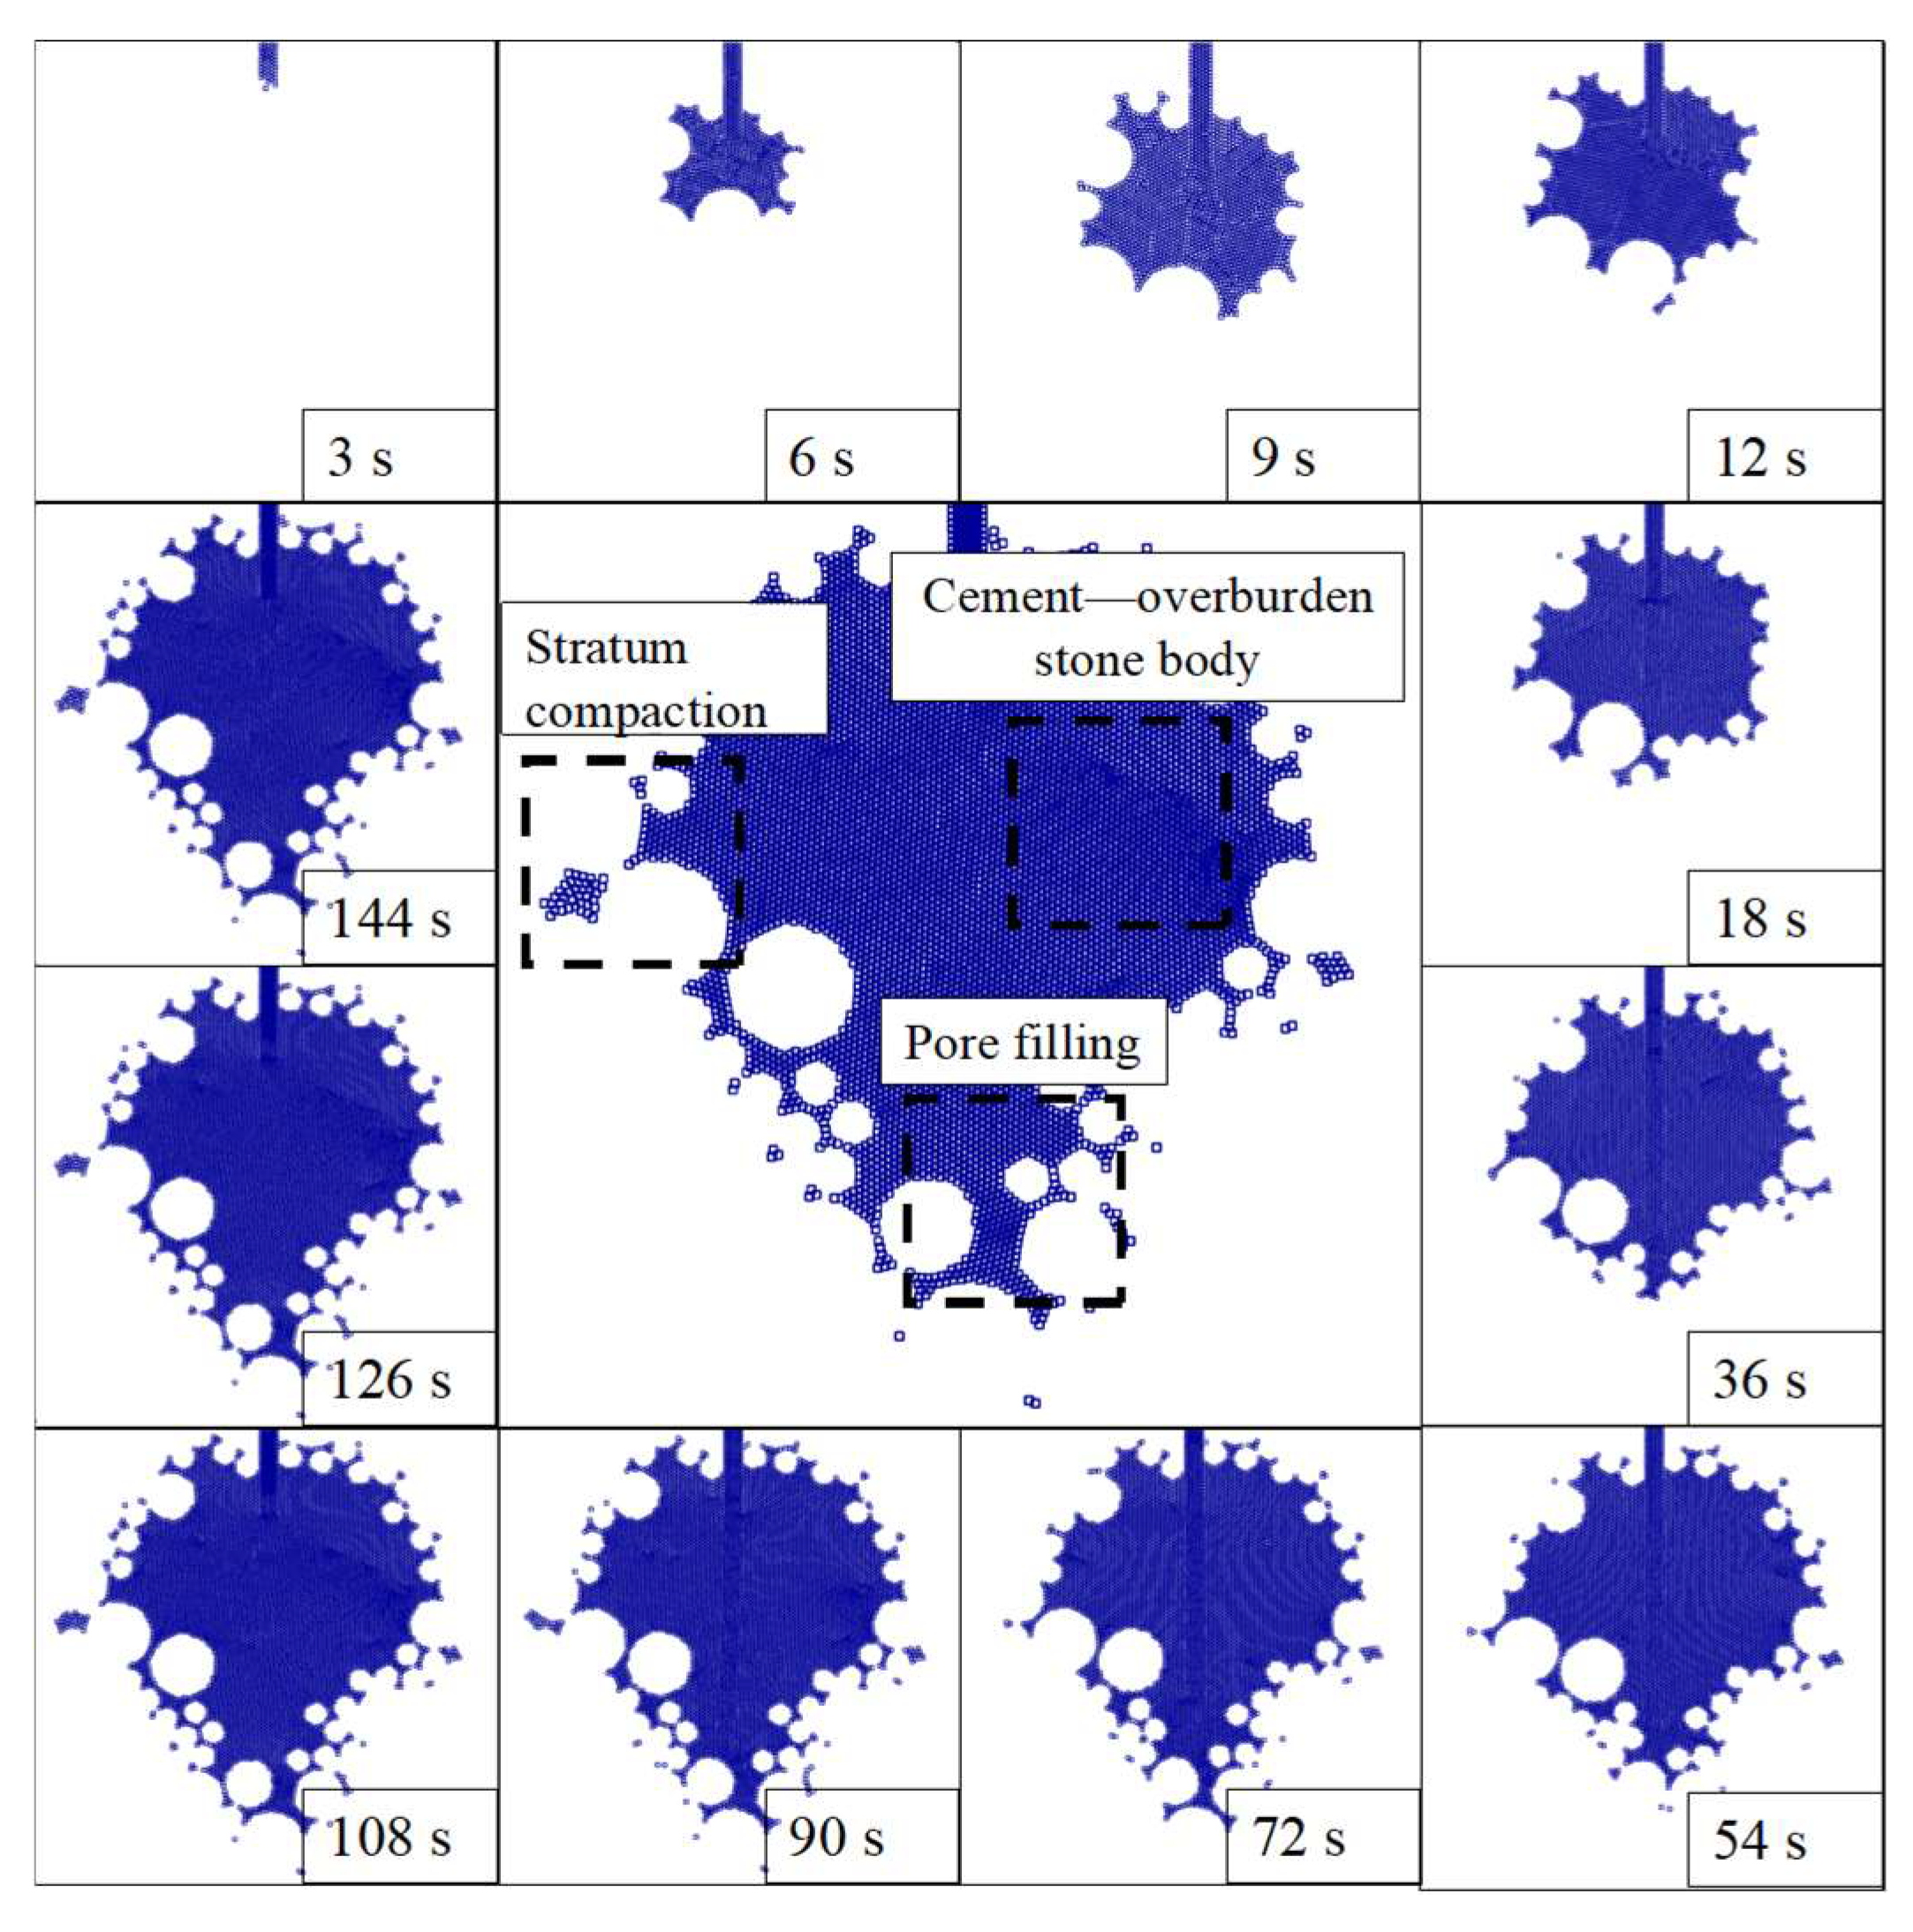
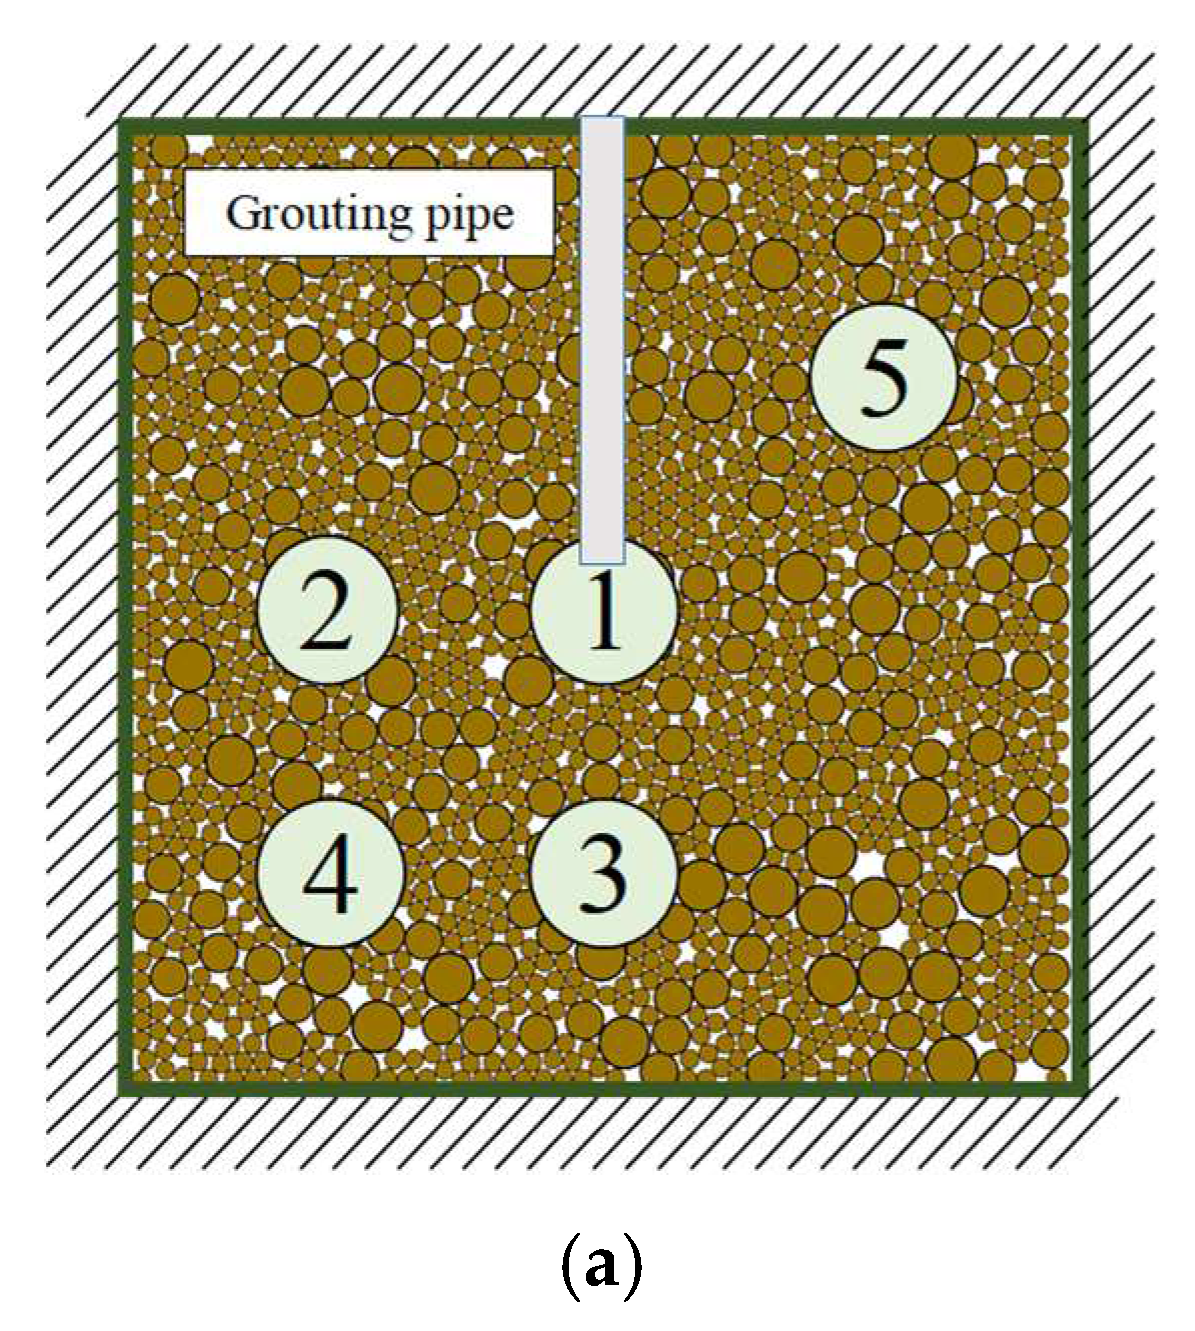
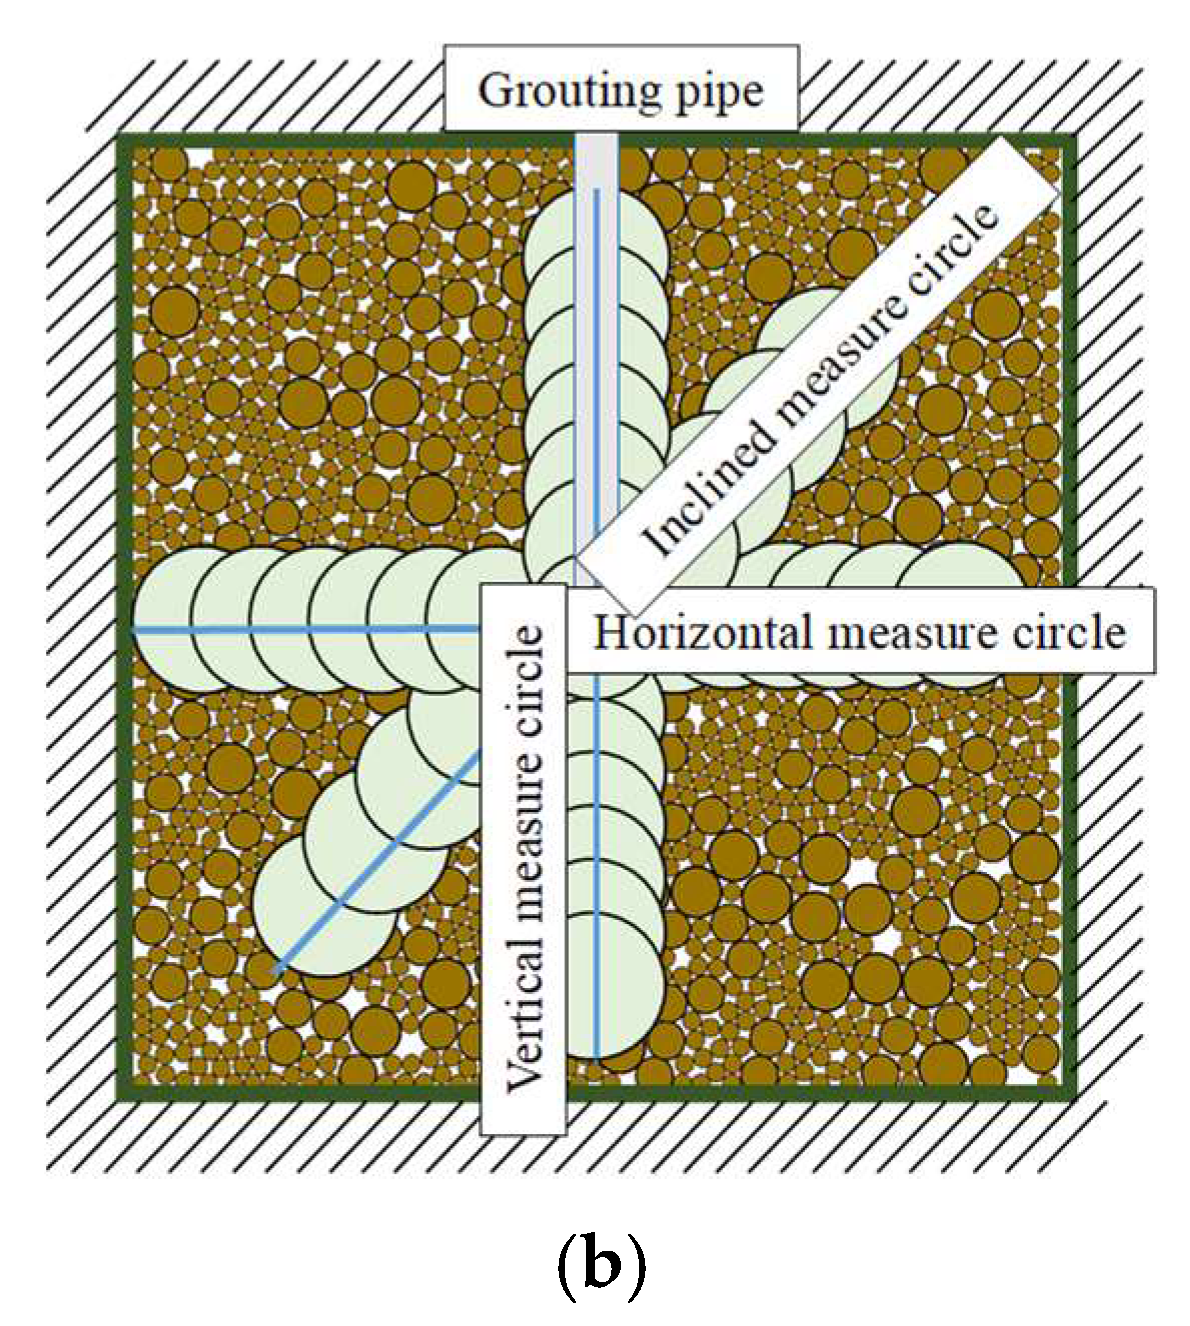
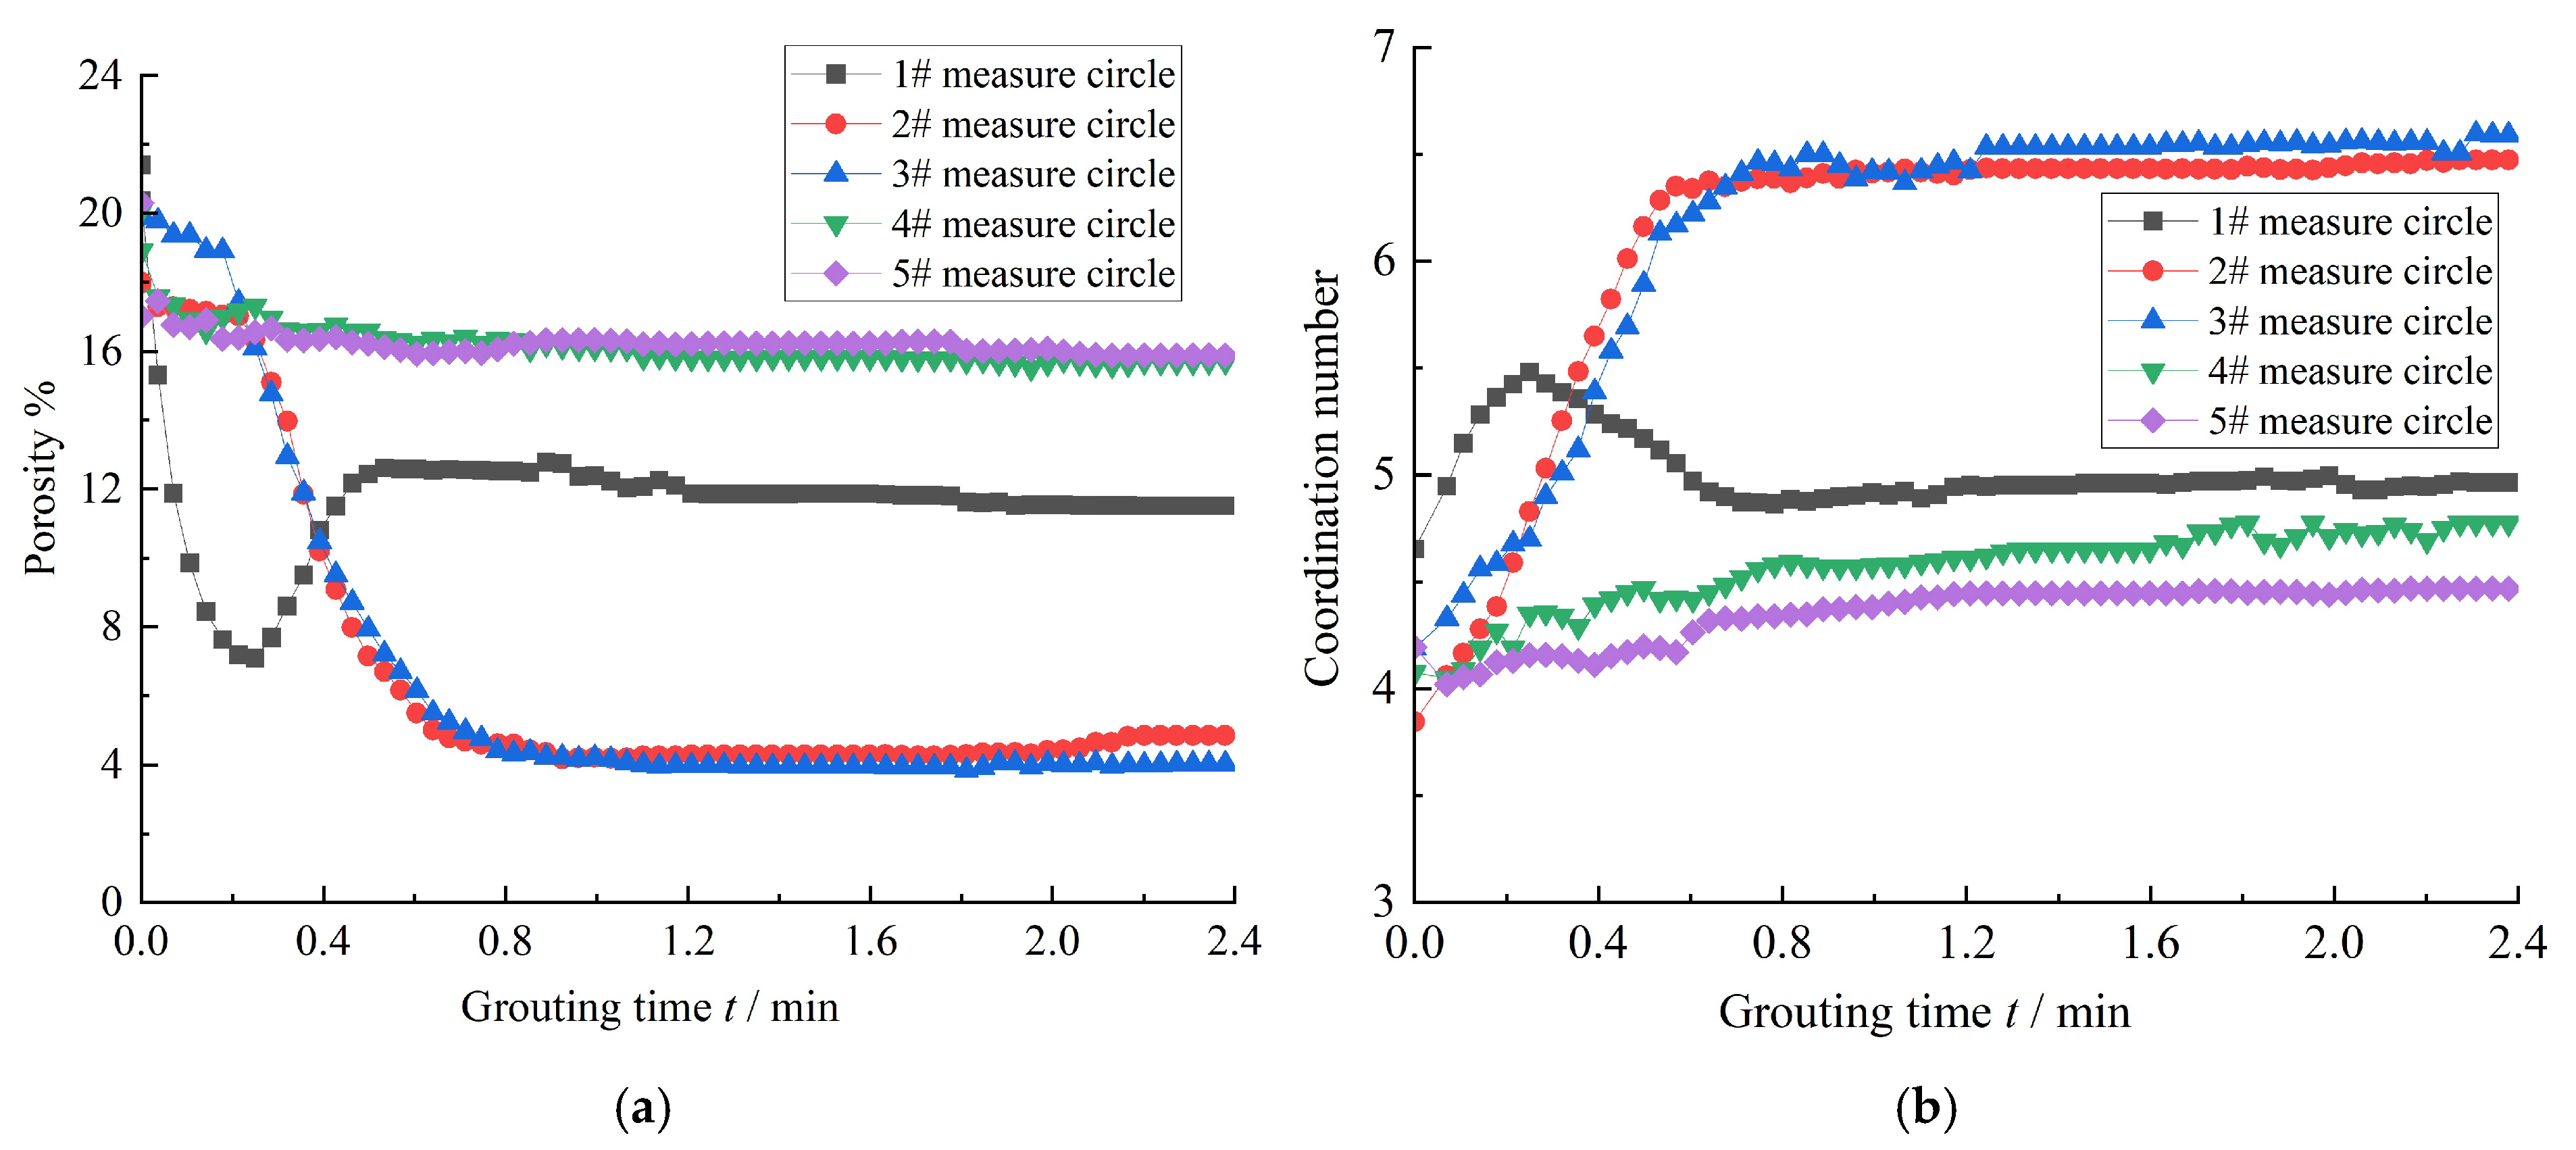
4.1. Analysis of Grouting Reinforcement Form

The grouting duration is set to 144 s (i.e., 2.4 min), corresponding to the time required for all slurry particles to be discharged from the grouting pipe under a maximum pressure of 3 MPa, as determined in preliminary experiments. The slurry inlet pressure is 2 MPa, the model boundary pressure is set to 0.5 MPa, and the numerical model and parameter selection follow Section 3.1 and Table 2. The discrete element simulation results of slurry diffusion are presented in Figure 6. As shown in the figure, (1) in the initial stage of grouting, the slurry enters the formation along the pipeline under grouting pressure, then diffuses radially outward from the grouting hole into the overburden, forming an approximately pear-shaped diffusion pattern. (2) The reinforcement effect of the grout is comprehensive. Initially, the slurry enters the formation through compaction and diffusion. As grouting continues, it gradually overcomes the bonding forces between overburden particles, leading to a splitting diffusion pattern. Subsequently, the slurry seeps through the created fissures, enveloping some overburden particles and forming a slurry–soil mixture.

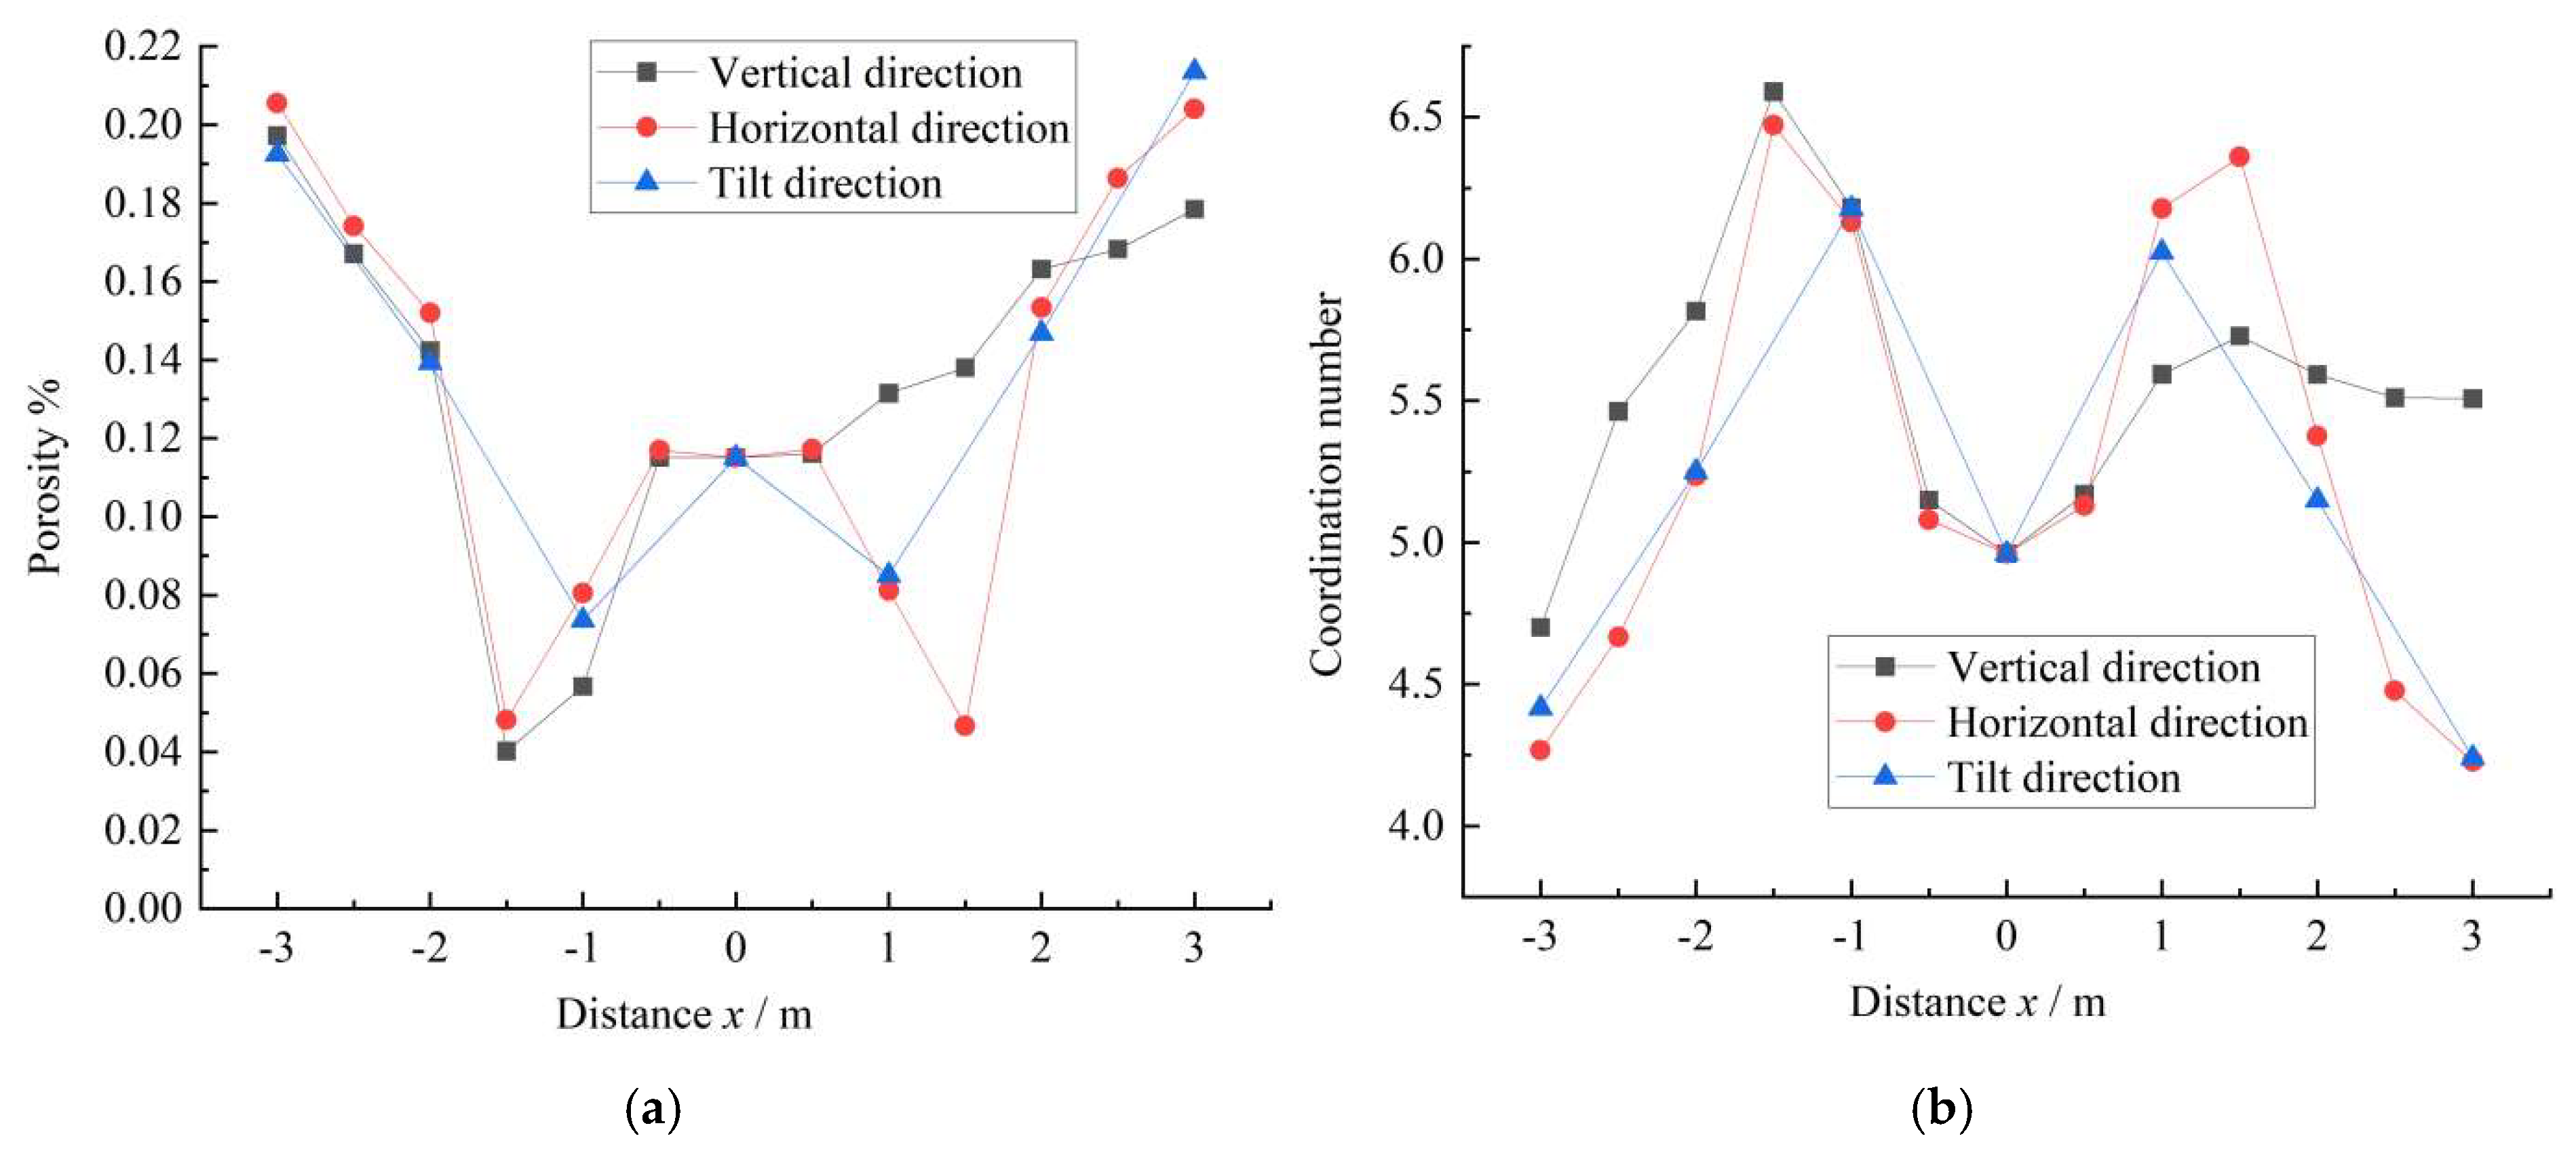
4.2. Grouting Reinforcement Mechanism Analysis

(1) Variation of porosity and coordination number with time
In this section, porosity and coordination number near the grout outlet are monitored throughout the grouting process to evaluate the consolidation behavior of the stratum at various locations during and after grouting. A circular monitoring zone with a diameter of 5 mm is employed, and its location is illustrated in Figure 7.
Porosity monitoring reflects the extent of pore compression and filling by cement particles. The porosity results are shown in Figure 8a, with all monitoring zones exhibiting a decreasing trend. Specifically, the 1# monitoring zone is located at the slurry outlet. As cement particles enter the overburden, this region is first rapidly filled, causing the porosity to drop sharply from 21.4% to 7.1%. It then gradually increases to 11.5% before stabilizing. Monitoring zones 2# and 3# are positioned along the horizontal and vertical axes of the grouting hole. These zones are influenced by both pore compression and cement particle filling, resulting in a rapid decrease in porosity from 20.0% to approximately 4.0%. Monitoring zones 4# and 5# are located at the lower-left and upper-right of the grouting hole, respectively. These locations are relatively distant from the grouting hole, and grout particles do not reach them. These zones are influenced only by pore compression, leading to a relatively smaller reduction in porosity—from 20.3% to 15.6%.
The coordination number refers to the number of neighboring particles that are in direct contact with a given particle. The coordination number results are shown in Figure 8b. Across all monitoring zones, the coordination number exhibits an overall increasing trend. The coordination number initially rises, then decreases, and finally stabilizes at 4.9. Specifically, it increases from 4.7 to 5.5 before decreasing to 4.9. This fluctuation results from the gradual expulsion of particles from the monitoring zone due to grouting pressure, as they are replaced by incoming cement particles. During the grouting process, the average coordination number at monitoring zones 4# and 5# increases slightly from 4.1 to 4.7, primarily due to pore compression in the overburden.
(2) Variation of porosity and coordination number with spatial position
This section aims to monitor post-grouting changes in porosity and coordination number along the horizontal, vertical, and inclined directions. The grouting hole is defined as the coordinate origin, with the horizontal right direction as the positive X-axis and the vertical upward direction as the positive Y-axis. Measurement circles along the horizontal and vertical directions are spaced at 0.05 m intervals, with 13 measurement points arranged on each side of the origin. Along the inclined direction—set at 45° relative to the positive X-axis and centered at the origin—measurement circles are spaced at 0.07 m intervals. A total of nine measurement circles are arranged from the bottom left to the top right along this inclined direction. The overall layout of the measurement circles is illustrated in Figure 7b.
The post-grouting porosity results are shown in Figure 9a. The porosity at all monitoring points first decreases and then increases with distance from the origin, ranging from 4.0% to 21.4%. The overall trend is approximately axisymmetric about the horizontal axis at the origin. The decrease in porosity near the grouting hole can be attributed to the fact that when the monitoring zone contains either pure cement or pure overburden particles, the porosity tends to be higher; when located in the mixing zone of cement and overburden particles, the porosity is relatively low due to the filling effect of cement particles; as the distance from the grouting hole further increases, the monitoring zones consist entirely of overburden particles, and porosity gradually increases due to pressure transmission. Notably, porosity along the positive vertical axis shows a gradual increasing trend, which is attributed to the combined effects of the slurry entry channel and extrusion near the grouting hole.
The coordination number distribution is shown in Figure 9b. As the distance from the grouting hole increases, the coordination number in both the horizontal and inclined directions first increases and then decreases, exhibiting approximate symmetry about the origin. The coordination number ranges from 4.2 to 6.5. However, along the positive vertical axis, the coordination number initially increases and then stabilizes. This behavior occurs because the slurry enters the grouting hole from top to bottom via the grouting pipe. As a result, the monitoring zone above the grouting hole captures the state of cement particles within the pipe, which does not accurately reflect the reinforcement characteristics of the overburden. Affected by the random and uneven distribution of particles on the coverage side, the porosity curve and the coordination number distribution curve are not completely symmetrical with the horizontal axis zero point. Specifically, the coordination number on the left side of the grouting hole is slightly higher than on the right, and the lower-left side exhibits higher values than the upper-right side—indicating a stronger reinforcement effect in the lower-left region compared to the upper-right.

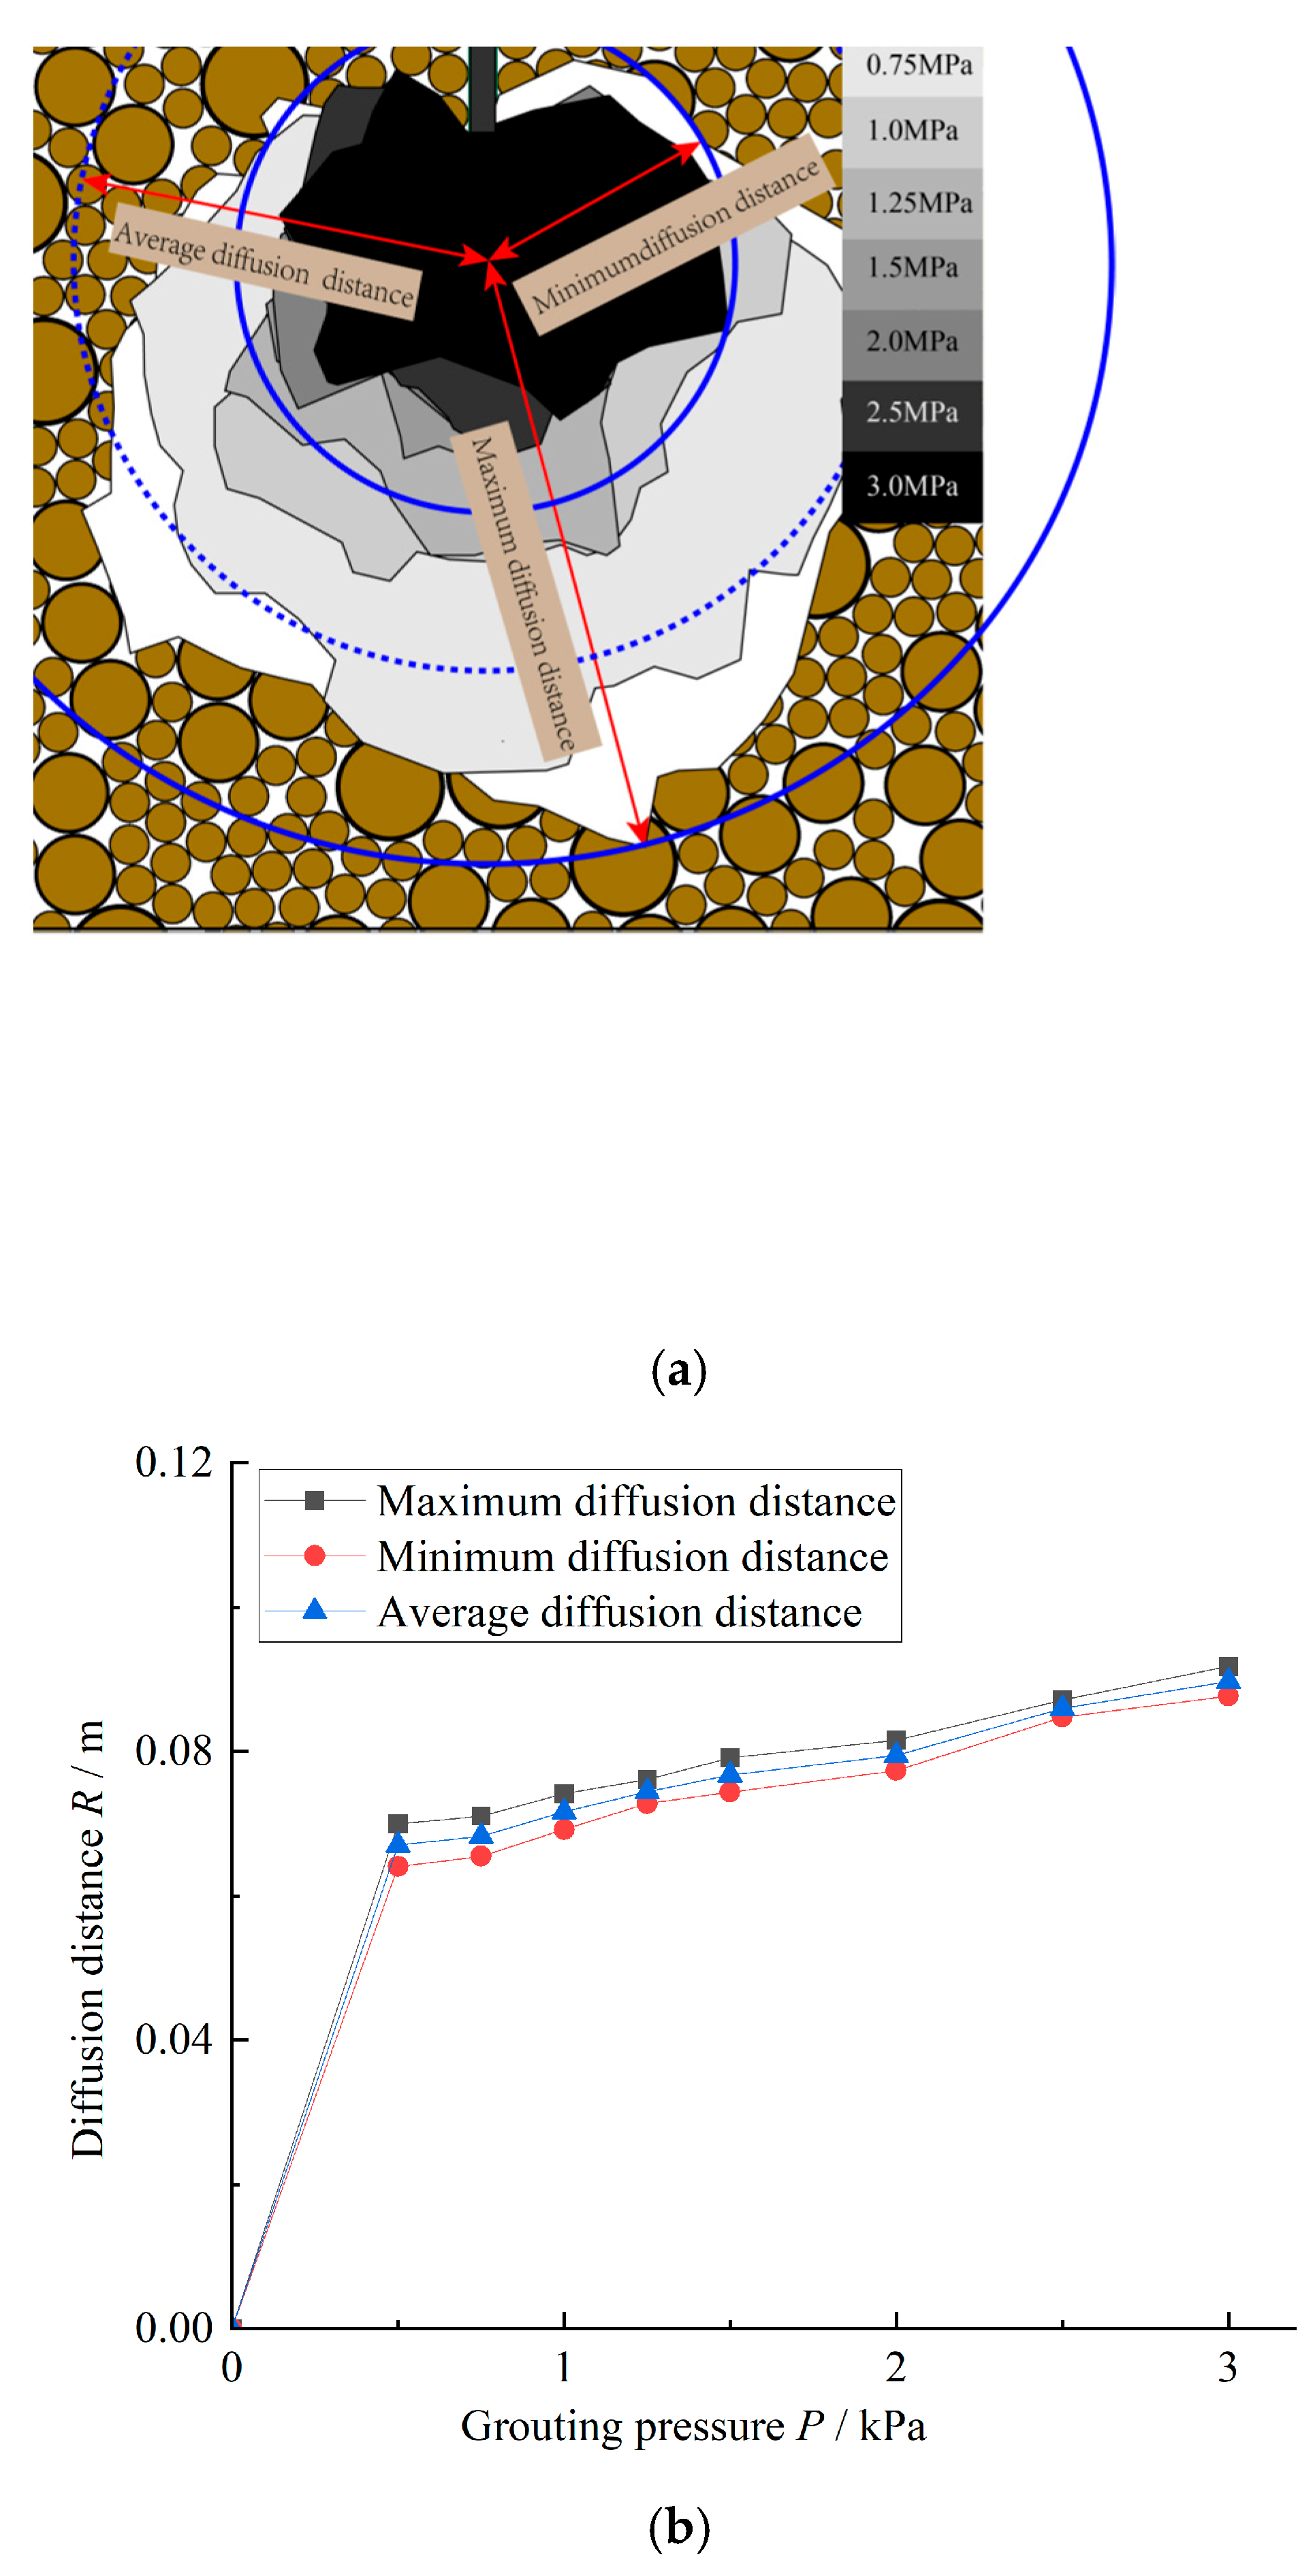
4.3. Influence of Formation Confining Pressure on Slurry Diffusion Radius

Investigating the influence of grouting depth on diffusion distance provides a theoretical basis for optimizing grouting parameter design. To accurately define diffusion distance under different grouting pressures, the following concepts are introduced: (1) Minimum diffusion radius (R1): defined as the radius of a dynamically expanding concentric detection zone centered on the grouting hole, at the point when it is first completely filled with cement particles. (2) Maximum diffusion radius (R2): the radius of the detection zone when it fully encompasses the outermost extent of all migrated cement particles. In the grouting simulations, grouting pressures are set to 500 kPa, 750 kPa, 1 MPa, 1.25 MPa, 1.5 MPa, 2 MPa, 2.5 MPa, and 3 MPa, respectively.
(1) Law of slurry diffusion distance
Based on the discrete element simulation results, the extent of slurry diffusion is outlined in Figure 10a, and the corresponding diffusion distances are plotted in Figure 10b. The analysis shows that with the increase of grouting pressure, the maximum and minimum diffusion distances show a trend of increasing rapidly and then increasing slowly, and the increasing trend of the diffusion radius of the whole slurry is nonlinear. For example, the maximum diffusion distances corresponding to grouting pressures of 500 kPa, 750 kPa, 1 MPa, 1.25 MPa, 1.5 MPa, 2 MPa, 2.5 MPa, and 3 MPa are 6.41, 6.55, 6.92, 7.28, 7.44, 7.74, 8.48, and 8.67 cm, respectively.
(2) Formula of slurry diffusion distance
Based on the test data presented in Figure 10, the influence of grouting pressure on the slurry diffusion radius is analyzed using a single-factor regression method. In conjunction with the mathematical model established in previous studies [24], the following assumptions are proposed: it is assumed that the dependent variable is the diffusion distance R, and the independent variable is the grouting pressure p, and these variables are assumed to follow a power function relationship, as expressed in Equation (2).
R = a p b m c K d t e
In the formula, a, b, c, d, and e represent undetermined regression coefficients. Yang Ping et al. [24] calibrated the formula using experimental data from grouting tests conducted in a sand–gravel layer, and the resulting expression is presented as Equation (3):
R = 19.953 p 0.412 m 0.121 100 K 0.429 60 t 0.437
In this study, the water–cement ratio m (W/C = 0.7), permeability coefficient K (1 × 10⁻⁴ cm/s), and grouting time t (2.4 min, i.e., 144 s) are set as fixed parameters. By substituting these parameters into Equation (2) and performing regression analysis using the model test data from Figure 10, Equation (4) is obtained, with a coefficient of determination R2 of 0.9495.
R min = 2024.96 p 0.1865 0.7 0.0379 0.0001 0.6636 2.3 0.5611
To verify and compare the applicability of the proposed formula, several commonly used slurry diffusion models are summarized, including Equations (5)–(7). The Maag theoretical model is regarded as one of the earliest and most representative studies in grouting theory in porous media. This model is based on the flow behavior of Newtonian fluids in porous media. It assumes that when slurry is injected into a uniform and isotropic formation as a point source, it diffuses spherically within the medium, as described by Equation (5). Building on the Maag model, some researchers further derived a cylindrical diffusion model for slurry, as shown in Equation (6). Xu et al. [25], based on previous studies of grouting diffusion tests in sand layers, compared several typical empirical models and validated them against experimental data to derive an empirical formula for the grouting diffusion radius in fractured rock masses, as presented in Equation (7):
R 1 = 3 K h 1 r 0 t β n 3
R 2 = 2 K h 1 t β n ln R r 0
R 3 = 226.2 p 0.4306 m 0.0379 K 0.6636 t 0.5611
This study compares and analyzes the errors between the fitted equation and classical models by substituting relevant parameters into Equations (3)–(6), with the results and associated errors summarized in Table 3. Due to varying assumptions regarding the geological strata, each diffusion model exhibits differing levels of accuracy. The Maag formula demonstrates good accuracy within a grouting pressure range of 1.5–3 MPa, whereas the cylindrical diffusion model is more applicable at around 1 MPa. The Xu formula shows a relatively large deviation from the test results, likely due to its assumption that the grouted body is composed of fractured rock masses with large pores. It is evident that the fitted equation proposed in this study achieves a strong fit, with overall error within 0–10%, which is lower than those of the Maag, cylindrical diffusion, and Xu formulas. This indicates that the empirical equation for overburden grouting diffusion, established through regression analysis, more accurately describes the relationship between grouting pressure and diffusion distance in this test. To verify the accuracy of the proposed formula, we compared the calculation results with the diffusion distances observed in Fan Kai’s [26] grouting test on glacial till soil. In that study, the observed diffusion distances of the slurry were 0.10 m, 0.12 m, and 0.16 m under grouting pressures of 0.4 MPa, 1.2 MPa, and 2 MPa, respectively. By substituting the relevant soil and slurry characteristic parameters into Equation (4), the corresponding predicted diffusion distances are 10.77 cm, 13.22 cm, and 14.54 cm, respectively. The relative errors between the predicted and experimental results are 0.7%, 1.2%, and −0.1%, indicating good agreement and verifying the reliability of the formula.

5. Conclusions

In this study, a slurry diffusion analysis model for overburden was developed using discrete element grouting simulation technology. The spatiotemporal distribution characteristics of slurry diffusion were investigated, and the regulatory mechanism of grouting pressure on slurry diffusion distance was examined. The main conclusions are as follows:
(1) To address the invisibility of the grouting process and the inhomogeneity of the grouted medium, a visual numerical particle flow model was proposed to simulate slurry flow. The contact parameters of overburden and cement particles were calibrated through laboratory tests, and the computational load was significantly reduced by applying a coarse-graining method. The results indicate that the discrete element method can effectively simulate the diffusion of grout within the overburden, confirming the feasibility of this simulation approach.
(2) A measurement circle was employed to monitor the grouting process and its effect on the overburden. The improvement in grouting effectiveness was characterized by the spatial and temporal distribution of porosity and coordination number before and after grouting. The numerical simulation demonstrates that under typical working conditions (grouting pressure of 2 MPa and formation pressure of 0.5 MPa), the porosity near the grouting pipe decreases from 21% to 4%, while the coordination number increases from 3.8 to 6.5. The reinforcement range is clearly delineated in the horizontal, vertical, and inclined directions. The reinforcement effect in the overburden exhibits a synergistic mechanism involving pore structure compaction (porosity reduction) and cement-overburden bonding (coordination number increase).
(3) Based on the discrete element simulation results, a correlation between grout diffusion radius and grouting pressure in the overburden was established. By integrating classical grout diffusion formulas, empirical correction equations for both maximum and minimum diffusion distances were derived. Error analysis indicated that the modified equations improved the goodness of fit by 34% to 39% compared to classical models (Maag formula and cylindrical diffusion formula). These equations are expected to offer valuable reference for the study of grout diffusion mechanisms and the design of grouting schemes in similar overburden conditions.
Compared with continuum-based methods, the discrete element method (DEM), despite its limitations in computational efficiency, offers significant advantages in modeling granular media. DEM provides a more realistic representation of the internal particle structure of the overburden layer, enabling the simulation of particle flowability, non-uniform contact, and interpenetration between soil particles, as well as between soil and slurry. With the development of grouting technology and numerical calculation theory, using discrete element numerical simulation to visualize the grouting diffusion process is of great significance for in-depth understanding of the grouting mechanism of overburden. There are still some problems in the research process of this paper. Due to the limitation of computer efficiency, considering that the wide particle size distribution coefficient (Dₘₐₓ/Dₘᵢₙ) will lead to the generation of a large number of calculated particles, the filling medium of this study is the overburden particles with a grading range of 0.1–5 mm; In addition, due to the small size and large number of cement slurry particles, as well as the complexity of particle dynamic process, the simulation of cement particles has become an important factor restricting the calculation efficiency and calculation scale. Therefore, how to simplify the model, improve the calculation efficiency, and shorten the calculation time are the keys to further optimize the numerical simulation of grouting. Although this method can only carry out small-scale slurry diffusion research, it provides a way to study the mesoscopic diffusion mechanism of overburden grouting.
Although the current coarse-graining methods can reduce the number of particles by several orders of magnitude—significantly lowering memory requirements for storing particle information (such as positions, velocities, and contact forces) and contact pair data—and increase computational speed by tens to hundreds of times, they inherently possess certain limitations. Coarse graining drastically decreases the number of contact pairs and simplifies the complexity of contact geometries, thereby reducing the computational burden of contact detection and force calculation. However, this simplification results in the complete loss of microscale dynamic details, including micro-sliding and micro-rotation between particles, the microscopic force chain network structure, and local porosity distribution. Moreover, coarse-grained models require complex calibration procedures, such as simulating standard tests or matching macroscopic responses to determine appropriate parameters, with multiple parameter sets often yielding similar macroscopic behaviors. Additionally, the surfaces of coarse-grained particles are typically too smooth to accurately represent the surface roughness and frictional characteristics of real particle aggregates. Their rotational behavior—particularly rolling resistance—is also challenging to model accurately, as it involves complex coupling effects between sliding and rotation of multiple fine particles. Therefore, current coarse-graining approaches fundamentally serve as a trade-off between computational efficiency and simulation accuracy. Further research could investigate the grouting behavior of slurries with varying viscosities. Additionally, future studies may incorporate analyses of the effects of particle shape on grouting performance.

Author Contributions

Conceptualization, P.G. and W.Z.; methodology, P.G. and Y.M.; formal analysis, P.G. and W.Z.; Investigation, P.G.; writing—review and editing, W.Z. and H.G.; supervision, P.G., W.Z., and Y.M.; project administration, P.G. and W.Z.; funding acquisition, W.Z. All authors have read and agreed to the published version of the manuscript.

Funding

This research was funded by the Doctoral Student Innovation Fund of the China Institute of Water Resources and Hydropower Research, grant number BS202302. And the APC was funded by a Special Scientific Research Project of the China Institute of Water Resources and Hydropower Research, grant number EM0145B022021.

Institutional Review Board Statement

Not applicable.

Informed Consent Statement

Not applicable.

Data Availability Statement

The data presented in this study are available on request to the corresponding author. The data are not publicly available due to privacy.

Acknowledgments

The authors are grateful to Qu Linxiu for her help with the preparation of figures in this paper.

Conflicts of Interest

The authors declare that they have no known competing financial interests or personal relationships that could have appeared to influence the work reported in this paper.

References

  1. Zhou, Z.J.; Jiang, Y.Y.; Wang, X.D.; Yu, X.M.; Wang, D.Z. Numerical simulation method of grouting diffusion for foundation with overburden and its application. Chin. J. Undergr. Space Eng. 2017, 13, 646–650. (In Chinese) [Google Scholar]
  2. Deng, S.H.; Wang, X.L.; Ao, X.F.; Ren, B.Y.; Li, R.J. Three-dimensional numerical simulation of curtain grouting in the dam bedrock based on binghamian grouts. J. Hydraul. Eng. 2016, 47, 165–172. (In Chinese) [Google Scholar]
  3. Cheng, S.Z.; Chen, T.L.; Guo, W.Q.; Zhang, Y. Numerical simulation of fracture grouting and influencing factors for morphology of grout veins. Chin. J. Geotech. Eng. 2019, 41, 484–491. (In Chinese) [Google Scholar]
  4. Li, X.L.; Chen, C.; Wang, Y.S.; Zhang, B.; Zhong, Y.H. Simulation method for fracture grouting of expansible polymer in soil. China Civ. Eng. J. 2023, 56, 156–165. (In Chinese) [Google Scholar]
  5. Shi, G.C.; Yang, L.Q.; Dai, G.Z. A porous grouting theory based on natural boundary element method. China Rural. Water Hydropower 2013, 135–138. (In Chinese) [Google Scholar]
  6. Hou, X.P.; Chen, S.H. Simulation of variably-saturated flow in fractured porous media using composite element method. Rock Soil Mech. 2020, 41, 1437–1446. (In Chinese) [Google Scholar]
  7. Bouchelaghem, F.; Vulliet, L. Mathematical and numerical filtration–advection–dispersion model of miscible grout propagation in saturated porous media. Int. J. Numer. Anal. Methods Geomech. 2001, 25, 1195–1227. [Google Scholar] [CrossRef]
  8. Papanastasiou, T.C.; Boudouvis, A.G. Flows of viscoplastic materials: Models and computations. Comput. Struct. 1997, 64, 677–694. [Google Scholar] [CrossRef]
  9. Zhou, Z.L.; Zang, H.Z.; Wang, S.Y.; Du, X.M.; Ma, D.; Zhang, J. Filtration behaviour of cement-based grout in porous media. Transp. Porous Media 2018, 125, 435–463. [Google Scholar] [CrossRef]
  10. Wang, D.L.; Hao, B.Y.; Liang, X.M. Slurry diffusion of single fracture based on fluid-solid coupling. J. Min. Strat. Control Eng. 2021, 3, 104–112. (In Chinese) [Google Scholar]
  11. Ao, X.F.; Wang, X.L.; Zhu, X.B.; Zhou, Z.Y.; Zhang, X.X. Grouting simulation and stability analysis of coal mine goaf considering hydromechanical coupling. J. Comput. Civ. Eng. 2017, 31, 4016069. [Google Scholar] [CrossRef]
  12. Min, H.J.; Chen, X.; Lu, X.C.; Tian, X.C.; Wei, K.X. Laboratory experimental study on seepage erosion in wide-graded soils considering saturated permeability coefficient. Water Resour. Hydropower Eng. 2023, 54, 183–192. (In Chinese) [Google Scholar]
  13. Geng, P.; Lu, Z.K.; Ding, T.; Quan, Z.L.; Yan, Q.X. Research on the dynamic process simulation of rock grouting based on particle flow. J. Railw. Eng. Soc. 2017, 34, 34–40. (In Chinese) [Google Scholar]
  14. Lin, T.; Zhao, Z.H.; Zhou, S.M. Block-based DEM modeling on grout penetration in fractured rock masses. Chin. J. Undergr. Space Eng. 2021, 17, 1080–1090. (In Chinese) [Google Scholar]
  15. Zhou, Z.; Zhao, Y.; Chen, Z.; Du, X.M.; Wu, Z.B. Meso-mechanism of compaction grouting in soil based on particle flow method. J. Cent. South Univ. (Sci. Technol.) 2017, 48, 465–472. (In Chinese) [Google Scholar]
  16. Liu, X.L.; Wang, F.; Huang, J.; Wang, S.J.; Zhang, Z.Z.; Nawnit, K. Grout diffusion in silty fine sand stratum with high groundwater level for tunnel construction. Tunn. Undergr. Space Technol. 2019, 93, 103051. [Google Scholar] [CrossRef]
  17. Zhang, Z.L.; Shao, Z.S.; Fang, X.B.; Liang, X.J. Research on the fracture grouting mechanism and PFC numerical simulation in loess. Adv. Mater. Sci. Eng. 2018, 2018, 4784762. [Google Scholar] [CrossRef]
  18. Zheng, Z.; Li, S.; Liu, R. Analysis on structural characteristics of grout and rock distribution in complex geological mixtures after grouting reinforcement and its mechanical strength. Rock Mech. Rock Eng. 2021, 54, 3757–3782. [Google Scholar] [CrossRef]
  19. Yu, H.; Jia, H.S.; Liu, S.W.; Liu, Z.H.; Li, B.Y. Macro and micro grouting process and the influence mechanism of cracks in soft coal seam. Int. J. Coal Sci. Technol. 2021, 8, 969–982. [Google Scholar] [CrossRef]
  20. Yang, S.; Li, X.Q. Shear simulation and macro meso analysis of sand based on PFC3D. Chin. J. Comput. Mech. 2019, 36, 777–783. (In Chinese) [Google Scholar]
  21. Gao, Z.G.; Dong, P.K.; Zhang, Y.J.; Sun, H.Z.; Di, Y. A novel discrete element rolling resistance model based on hysteresis spring energy dissipation. Chin. J. Theor. Appl. Mech. 2021, 53, 2384–2394. (In Chinese) [Google Scholar]
  22. Guo, P.; Hou, T.S.; Liu, Q.; Luo, Y.S. Study on the influence of direct shear test methods on shear strength of lightweight soil. Water Resour. Hydropower Eng. 2023, 54, 161–170. (In Chinese) [Google Scholar]
  23. Peng, C.; Liu, W.; Wang, Z. Parameter checking method of large scale particle model. Geotech. Geol. Eng. 2021, 39, 1533–1540. [Google Scholar] [CrossRef]
  24. Yang, P.; Tang, Y.Q.; Peng, Z.B.; Chen, A. Study on grouting simulation experiment in sandy gravels. Chin. J. Geotech. Eng. 2006, 28, 2134–2138. (In Chinese) [Google Scholar]
  25. Xu, H.F.; Wang, C.; Li, C.F.; Jiang, M.; Geng, H.S.; Chen, F. Estimating diffusion radius grouting into broken rock mass. Appl. Mech. Mater. 2013, 353–356, 44–49. [Google Scholar] [CrossRef]
  26. Fan, K. Study on the Diffusion Mechanism of Solidified Grouting Slurry in Surface Moraine at Pulang Copper Mine. Ph.D. Thesis, Kunming University of Science and Technology, Kunming, China, 2024. [Google Scholar]
Figure 1. Schematic diagram of contact constitutive model (two-dimensional space). (a) Linear contact bond model. (b) Adhesive rolling resistance linear model.
Applsci 15 08464 g001
Figure 2. Particle grading curve of overburden.
Applsci 15 08464 g002
Figure 3. Geometric model and boundary conditions (two-dimensional space). (a) Computational geometry model. (b) Model boundary conditions.
Applsci 15 08464 g003
Figure 4. Direct shear test results of overburden. (a) ZJ1 direct shear tester. (b) Direct shear test results.
Applsci 15 08464 g004
Figure 5. Cement fluidity test. (a) Marsh funnel test. (b) Numerical simulation test of Marsh funnel.
Applsci 15 08464 g005
Figure 6. Slurry diffusion pattern at different times.
Applsci 15 08464 g006
Figure 7. Layout of measuring circle. (a) Measure the circular monitoring position of grouting time characteristics. (b) Measure the circular monitoring position of grouting space characteristics.
Applsci 15 08464 g007aApplsci 15 08464 g007b
Figure 8. Monitoring results of particle contact law during grouting. (a) Distribution law of particle porosity during grouting. (b) Distribution law of particle coordination number during grouting.
Applsci 15 08464 g008
Figure 9. Monitoring results of particle contact law after grouting. (a) Distribution law of particle porosity after grouting. (b) Distribution law of particle coordination number after grouting.
Applsci 15 08464 g009
Figure 10. Effect of grouting depth on grout diffusion distance. (a) Influence of different formation confining pressure on grouting diffusion radius. (b) Influence of grouting pressure on farthest diffusion distance.
Applsci 15 08464 g010
Table 1. Basic physical parameters of covering layer of a grouting project.
Lithological NameDensity
ρ/g/m3
Void Ratio
e
Permeability Coefficient
K/cm/s (×10−4)
d 65 / mm d 50 / mm d 35 / mm
Moraine soil1.840.7328.1410.50.2
Table 2. Parameter values of numerical test for grouting diffusion of overburden.
Overburden ParticlesLCBM ModelContact Modulus
/kPa
Stiffness RatioNormal Critical Damping RatioShear Critical Damping RatioTensile Strength/NShear Strength/NFriction Coefficient
Parameter Value1.2 × 1061.50.801 × 1041 × 1040.3
CementARRLM modelContact modulus
/kPa
Stiffness ratioNormal critical damping ratioShear critical damping ratioRolling friction coefficientAttraction range/mFriction coefficient
Parameter value8 × 10420.10.050.010.0010.1
Table 3. Comparison and error of results of classical slurry diffusion formula.
Grouting Pressure/MPaNumerical Test Value/cmTheoretical Calculation Value/cmThe Calculated Value of This Formula/cm
Diffusion Distance rminMaag Formula
Equation (5)
ErrorCylindrical Diffusion Formula
Equation (6)
ErrorPolynomial Formula
Equation (7)
ErrorRmin Fitting Formula
Equation (4)
Error
0.56.413.99−37.73%4.95−22.75%10.7968.38%6.21−3.09%
0.756.554.56−30.38%6.06−7.48%13.11100.15%6.702.29%
16.925.02−27.43%7.011.34%15.05117.58%7.062.07%
1.257.285.41−25.69%7.837.55%16.76130.22%7.371.24%
1.57.445.75−22.72%8.5815.32%18.29145.83%7.622.42%
27.746.32−18.37%9.927.87%21.01171.38%8.043.85%
2.58.486.82−19.58%11.0830.66%23.39175.83%8.38−1.18%
38.777.24−17.45%12.1338.31%25.53 191.11%8.67−1.14%
Disclaimer/Publisher’s Note: The statements, opinions and data contained in all publications are solely those of the individual author(s) and contributor(s) and not of MDPI and/or the editor(s). MDPI and/or the editor(s) disclaim responsibility for any injury to people or property resulting from any ideas, methods, instructions or products referred to in the content.

