Article

A Multi-Objective Optimization Method for Carbon–REC Trading in an Integrated Energy System of High-Speed Railways

1
College of Computer Science and Technology, Shanghai University of Electric Power, Shanghai 201306, China
2
Department of Electrical Engineering, Chung Yuan Christian University, Chung Li District, Taoyuan City 320, Taiwan
*
Author to whom correspondence should be addressed.
Appl. Sci. 2025, 15(15), 8462; https://doi.org/10.3390/app15158462
Submission received: 9 May 2025 / Revised: 21 July 2025 / Accepted: 29 July 2025 / Published: 30 July 2025

Abstract

The significant energy intensity of high-speed railway necessitates integrating renewable technologies to enhance grid resilience and decarbonize transport. This study establishes a coordinated carbon–green certificate market mechanism for railway power systems and develops a tri-source planning model (grid/solar/energy storage) that comprehensively considers the full lifecycle carbon emissions of these assets while minimizing lifecycle costs and CO2 emissions. The proposed EDMOA algorithm optimizes storage configurations across multiple operational climatic regimes. Benchmark analysis demonstrates superior economic–environmental synergy, achieving a 23.90% cost reduction (USD 923,152 annual savings) and 24.02% lower emissions (693,452.5 kg CO2 reduction) versus conventional systems. These results validate the synergistic integration of hybrid power systems with the carbon–green certificate market mechanism as a quantifiable pathway towards decarbonization in rail infrastructure.

1. Introduction

The operational advantages of high-speed rail systems, including exceptional energy efficiency, enhanced passenger comfort, and environmental sustainability, have driven their rapid global expansion, establishing this transportation mode as a key component of climate-conscious infrastructure development across the globe. Under the carbon peaking and carbon neutrality mandates [1], governments and societies worldwide are imposing increasingly stringent environmental requirements on the transportation sector. The traction power supply systems for high-speed railways present unique challenges [2], characterized by high power demands, significant load fluctuations, and instantaneous peak power requirements. China operates the largest high-speed rail network in the world [3], making substantial contributions to global low-carbon initiatives. However, the current high-speed rail power infrastructure in China primarily relies on thermal generation, which incurs substantial energy expenditures and considerable carbon emissions, indicating considerable potential for cost reduction and emission mitigation. The rapid advancement of Photovoltaic (PV) and energy storage systems (ESSs) offers promising solutions for enhancing energy economy and environmental performance. PV technology enables the utilization of underutilized solar resources along railway corridors, thereby reducing both operational costs and carbon footprint. Nevertheless, the inherent intermittency of PV generation necessitates ESS integration to ensure power supply stability, improve power quality, and achieve peak shaving. Beyond technological solutions, market-driven instruments are increasingly proving effective in promoting low-carbon transitions. Globally implemented carbon trading mechanisms adopt market-oriented approaches, establishing total emission caps while permitting inter-enterprise quota trading to achieve cost-effective greenhouse gas reduction. The Renewable Energy Certificate (REC) represents another market instrument designed to accelerate renewable energy adoption. The REC system essentially separates the environmental benefits of renewable energy from the physical electricity, enabling corporations and individuals to indirectly support renewable energy production through certificate purchases.

1.1. Literature Review

Research on high-speed railway power systems prioritizes multi-energy complementation and intelligent regulation to enhance sustainability. Recent advances reveal three key progressions: (1) Energy routers in electrified transport [4,5] demonstrate boosted efficiency through intelligent multi-source coordination; (2) renewable integration impacts on critical infrastructure, including PV-induced traction transformer aging, are quantified via electrothermal models [6]; (3) hybrid ESS designs [7] integrated with robust PV storage planning [8] ensure resilience during power outages. However, these solutions require enhanced spatiotemporal coordination for dynamic carbon–energy synergies.
Life Cycle Assessment (LCA) has become pivotal in evaluating PV sustainability, with methodological shifts from techno-economic analysis toward triple bottom line frameworks. Geographically differentiated LCA quantifies regional impacts across PV lifecycles. Studies on Brazilian monocrystalline production [9] and Malaysian utility-scale plants [10] have documented material-to-decommissioning impacts using CML-IA and ReCiPe methods, revealing installation-specific emissions patterns. Other studies ahve used multi-material circularity integration to assess polymer backsheets [11] and Indian manufacturing [12], where FRELP recycling models quantify recovery rates and emissions reductions. Some studies have used carbon-accounting innovations to evaluate distributed systems [13] and power plants [14] using Carbon Payback Time (CPBT) metrics, extending beyond traditional electricity-phase perspectives. However, current frameworks lack harmonized regional carbon factors and dynamic operation–emission coupling, necessitating integrated spatiotemporal assessment tools.
Beyond traditional PV carbon–energy studies, emerging ESS lifecycle assessments integrate dynamic interactions among technological evolution, recycling infrastructure, and policy adoption. Cross-technology LCA harmonization establishes unified methodologies for emerging batteries—solid-state [15], flow [16], and prospective Li-S [17]—using standardized functional units and uncertainty analysis to identify hotspots. Multi-parameter benchmarking quantifies technology-size interdependencies [18] through integrated energy–environmental–economic–technical assessments [19]. Methodological optimization enhances financial returns via degradation-aware capacity models [20] while resolving data disparities through hierarchical scoping frameworks [21].
The environmental benefits potential of carbon trading mechanisms has been extensively investigated. Carbon trading policies significantly impact regional Total Factor Carbon Productivity (TFCP) by driving technological advancement, factor allocation optimization, industrial scaling, and energy structure transitions [22]. Emission Trading Schemes (ETS) elevate corporate carbon performance [23] through Carbon Management System (CMS) optimization and innovation-driven efficiency gains, mechanistically linking policy implementation to organizational carbon metrics. Carbon trading constraints drive multi-echelon supply chain optimization via safety stock placement [24], quantifiably reconciling emission–inventory–service trilemmas across nodal operations. Carbon trading policies activate corporate green innovation [25] through financing-R&D mediation, digitally moderated across innovation pathways.
Recent advances in Renewable Energy Certificate (REC) mechanisms reveal tripartite synergies among pricing dynamics, decarbonization strategies, and investment viability. Non-monotonic REC pricing effects under RES frameworks [26] now integrate corporate GHG accounting realities, where emission reduction efficacy depends nonlinearly on market maturity and subsidy coupling [27]. Nonlinear PDEs capturing cumulative inventory–productivity dynamics [28] and derivatives pricing models [29] enable stochastic REC valuation through advanced numerical solvers. Real options analysis [30] quantifies PV plant viability under REC–electricity price uncertainties, while Hong Kong case studies [31] reveal FiT-REC synergies accelerating breakeven thresholds.
Algorithmic advances for energy systems now achieve dual progressions: (1) Metaheuristic hybridization elevates dispatch optimization–carbon market MOPSO [32], resolving renewable revenue tradeoffs via Pareto frontiers, while hierarchical GWO-PSO [33] overcomes MPPT stability limitations through synergetic hyperparameter tuning. (2) Multi-objective constrained solvers reconfigure hybrid systems: Grasshopper algorithms [34] optimize TNPC/renewable penetration under geographic constraints, and LARO methods [35] ensure 95% reliability at minimal LCOE via adaptive foraging.

1.2. Motivation and Main Contributions

Current strategies promoting green energy adoption remain underexplored within PV-ESS-integrated high-speed railway power systems. This study addresses critical gaps concerning the following: (1) Energy Dispatch Under Carbon Constraints: Existing work often treats emissions statically, neglecting dynamic carbon emission coupling effects. Models inadequately capture carbon price volatility, and dispatch algorithms demonstrate limited responsiveness to market fluctuations, hindering real-time emission control aligned with decarbonization goals. (2) REC–Energy Dispatch Synergy: The absence of coordination between REC pricing dynamics and dispatch decisions limits REC benefit optimization in real-time operations, with REC trading strategies rarely co-optimized with dispatch protocols. (3) Multi-Objective Optimization: Contemporary algorithms face challenges in convergence speed and solution diversity when handling the high-dimensional, strongly constrained problems typical of these systems; fixed or simplistic adaptive-weight strategies are insufficient for dynamic state responses.
To bridge these gaps, this paper proposes a high-efficiency optimization algorithm for sizing ESS in high-speed railway hybrid power systems. The methodology strengthens PV-ESS integration while accommodating system complexity, ultimately delivering solutions that synergistically enhance economic efficiency and environmental performance to meet the sophisticated load demands of high-speed railway hybrid power infrastructures.
This study proposes a novel methodology for optimizing the capacity and operational power of ESS in high-speed railway hybrid power systems under market trading mechanisms, specifically designed for railway lines with variable weather conditions. To ensure representative weather complexity, the G3176/G3177 high-speed railway route from Shanghai Hongqiao Station to Qinghai Xining Station and its return route G3178 were selected as case studies. Although stations along this route share similar latitudes, significant longitudinal variations induce substantial weather disparities between adjacent stations, resulting in pronounced PV power generation fluctuations. The proposed system reduces grid dependency and operational costs while mitigating carbon emissions through PV panel retrofitting on train roofs and ESS installations above lighting systems, supplementing conventional grid power. ESS units store surplus energy from PV and Regenerative Braking Energy (RBE). PV integration facilitates renewable energy adoption, enabling REC participation to incentivize solar utilization and generate ancillary economic benefits for high-speed railway power systems. A cradle-to-grave LCA is conducted to quantify total carbon emissions across all life stages of PV and ESS technologies, from raw material extraction to end-of-life disposal. The optimization framework integrates a carbon management model that combines carbon trading, penalty, and incentive mechanisms. Load demand profiles are analyzed for four operational modes, and the proposed Elite Dwarf Mongoose Optimization Algorithm (EDMOA) determines optimal ESS configurations by minimizing system costs and carbon emissions. This algorithm demonstrates enhanced convergence speed and solution diversity, effectively addressing the high-dimensional optimization challenges inherent in high-speed railway hybrid power systems.
This study makes three principal contributions to hybrid power systems in high-speed railways: (1) it introduces an integrated framework combining carbon constraints and REC within power system optimization, enabling coordinated management across multiple timescales. (2) It develops a tripartite coupling model that rigorously quantifies dynamic interdependencies among power dispatch, carbon trading, and REC transactions, aligning hourly operational scheduling with daily market participation and annual infrastructure planning. (3) It proposes an adaptive optimization strategy that synchronizes electricity dispatch with carbon–REC market dynamics by dynamically adjusting optimization weights based on real-time fluctuations in carbon prices, REC valuations, and renewable generation forecasts.

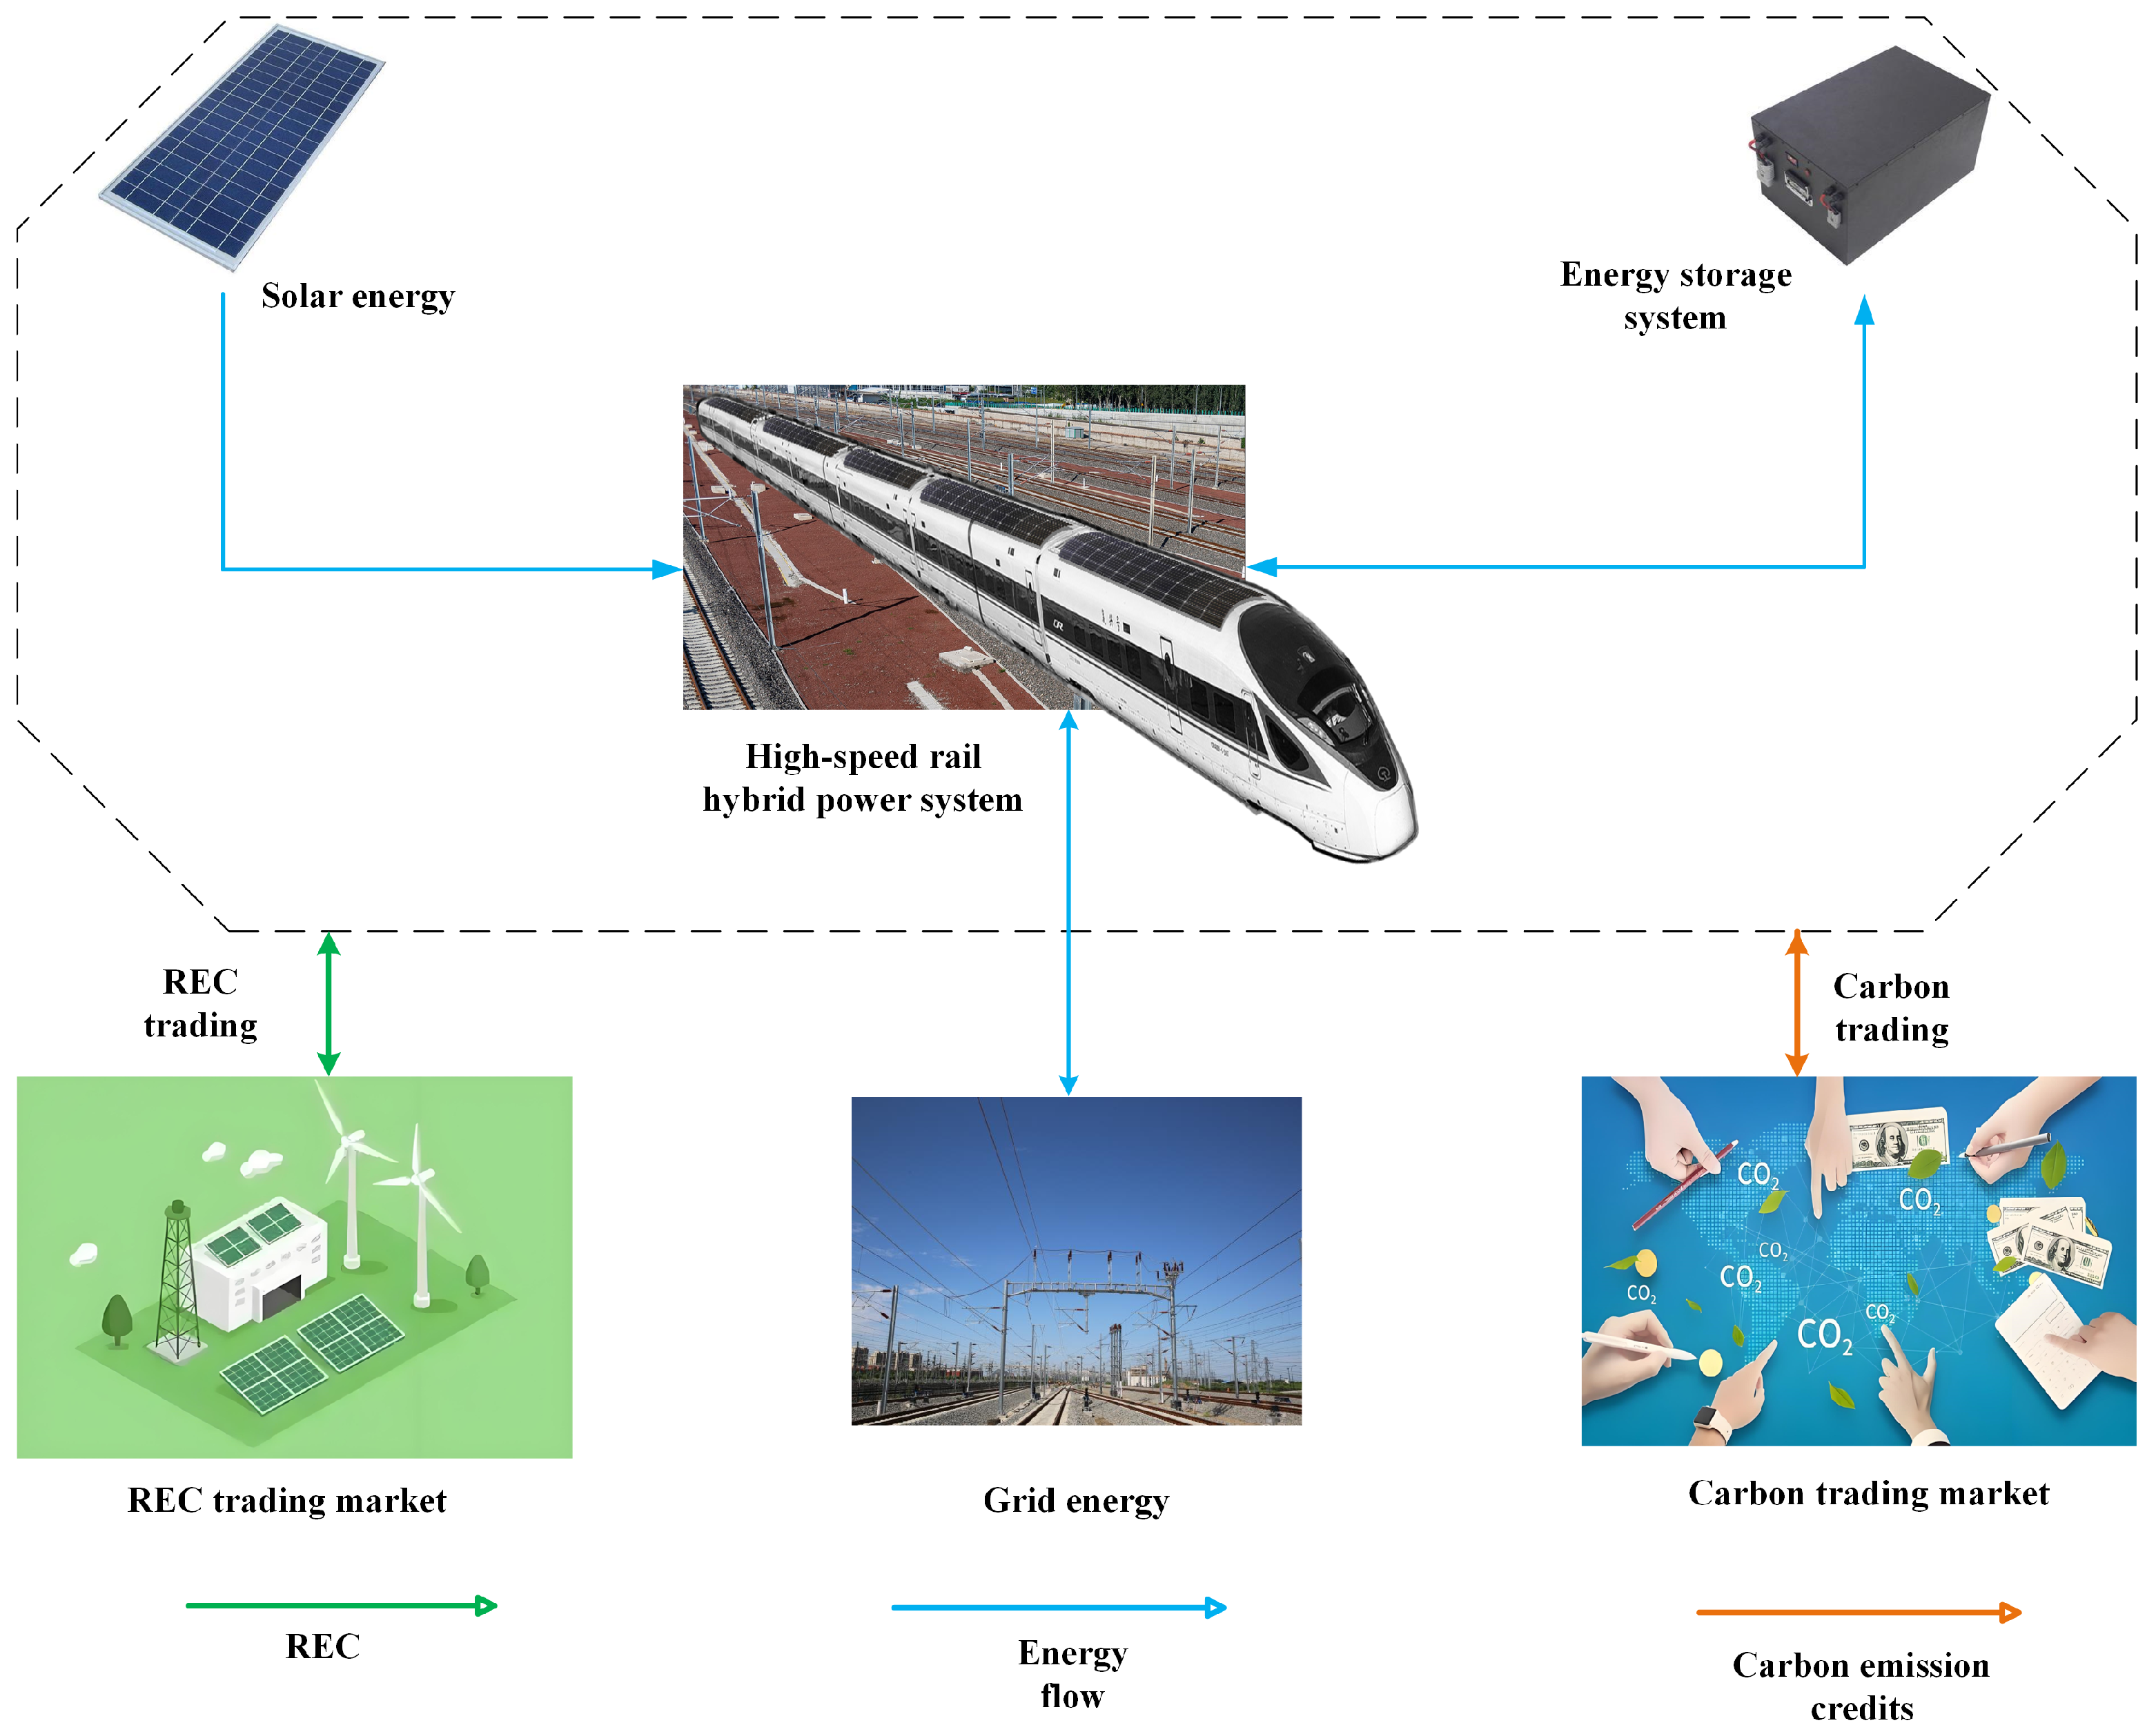
2. Optimized Hybrid Energy System for High-Speed Rail Integrating Carbon–REC Trading

2.1. Problem Description

This study focuses on optimizing the capacity and operational power of ESS in high-speed railway hybrid power systems under low-carbon constraints while exploring synergistic benefits of renewable energy through carbon trading mechanisms and REC transactions. The Fuxing CR400BF high-speed railway Electric Multiple Unit (EMU) was selected as the research platform, featuring an eight-car configuration with four powered cars (cars 2, 4, 5, 7) and four trailer cars (cars 1, 3, 6, 8). Key technical parameters include a total length of 209.06 m, width of 3360 mm, height of 4050 mm, and a horizontally mounted PV array covering 2000 m2 on the train roof (as shown in Figure 1). ESS units are installed above lighting systems with negligible aerodynamic resistance. The EMU has an unladen mass of 461.8 tons and a maximum operational mass of 506.3 tons, with a passenger capacity of 576 seats. Under full occupancy conditions (70 kg average mass per passenger including luggage), the total mass reaches 502.12 tons, leaving 4.18 tons of mass allowance for PV and ESS installation. ESS operational parameters are constrained to 1500 kWh maximum capacity and 1500 kW power output. The integrated optimization framework systematically addresses carbon–REC coordination while maintaining mass-energy equilibrium for safe high-speed railway operations.
This study analyzes the hybrid power system for high-speed railways illustrated in Figure 1, comprising three core components: PV arrays, grid power as the primary energy supply, and ESS for renewable energy integration and system reliability enhancement. The output of PV system varies significantly under different irradiance and temperature conditions, necessitating advanced control strategies to maintain optimal performance. To address this, the PV system employs MPPT control within its power conversion units, which continuously adjusts operating points to maximize solar energy utilization across diverse conditions. Given the inherent limitations of high-speed railway trains in generating sufficient onboard power, the capability of grid to reliably energize all loads under any operational scenario proves critical for maintaining system stability and safety.
The trading architecture of system comprises carbon trading and REC mechanisms. The cap-and-trade mechanism tackles decarbonization bottlenecks via market-driven price signaling, transforming carbon allowances into tradable commodities within a cap-and-trade framework. Governments allocate emission quotas based on corporate power generation while enforcing aggregate emission controls. Enterprises with actual emissions below allocated quotas may monetize surplus allowances through carbon markets. All participants incur baseline costs proportional to carbon prices, while non-compliant entities must purchase deficit allowances to fulfill obligations. This mechanism economically incentivizes optimized carbon management strategies through dual market pressures. Concurrently, the REC trading system mandates market participants with renewable energy consumption below quota thresholds to procure RECs for compliance, while surplus REC holders may trade certificates through dedicated platforms. To incentivize renewable adoption in high-speed railway systems, this study sets the renewable quota at zero for railway operators, enabling full REC monetization through market transactions. The revenue model exclusively considers net REC trading income, a methodology that enhances interregional renewable energy allocation efficiency while directly improving market dynamics.
The operational route from Shanghai Hongqiao Station to Qinghai Xining Station is illustrated in Figure 2. The entire journey takes 12 h and 20 min. This high-speed train service operates only once daily in one direction, departing from Shanghai Hongqiao Station at 06:32 and arriving in Xining Station at 18:52. The return journey takes 12 h and 56 min, with the train departing Xining Station at 09:30 and arriving back in Shanghai Hongqiao Station at 22:26, also operating once daily. Although the overall route remains consistent, the return journey requires an additional stop at three stations, resulting in a 30 min increase in travel time.
In this study, 13 representative stations along the route were selected. Given the high operational speed of the high-speed trains (typically 250–350 km/h) and relatively short distances between stations (usually 20–140 km), a solar radiation data sharing mechanism based on the first passage time of the train was implemented between adjacent stations. Under these short time (tens of minutes) and short distance (hundreds of kilometers) conditions, the solar radiation environment remains relatively consistent. Figure 3 presents the PV power generation conditions of the 13 sample stations, with PV power generation at each site statistically averaged monthly. Specifically, this study calculates PV power generation based on the scheduled arrival times of the train, effectively enhancing the credibility of the research. As shown in the figure, significant spatial variations in PV power generation are observed among different stations, with distinct monthly sequential fluctuation characteristics at each site. The monthly average PV power generation along the route can reach approximately 1100 kW. For example, Shanghai Hongqiao Station experiences lower power generation due to the departure of train during the early morning period of weak irradiance, while Lanzhou West Station and Xining Station exhibit the smallest power generation due to the arrival of train during late night low-irradiance periods.
This study employs the Density Peak Clustering (DPC) method for meteorological clustering analysis to identify typical weather conditions along the route as benchmark datasets. Specifically, four round-trip train schedules were established by selecting departure dates of 24 January 2021, 21 April 2022, 12 May 2021, and 29 August 2022, with corresponding return dates of 25 January 2021, 22 April 2022, 13 May 2021, and 30 August 2022, following clustering analysis. The optimization process involved refined modeling of 608 intervals at 10 min resolution, during which solar irradiance, ambient temperature, and high-speed train load data were sampled every 10 min. Notably, this study did not account for the influence of train vibration on the incident angle of onboard PV arrays.

2.2. Models of System Components

2.2.1. PV Model and ESS Model

The solar radiation received by PV modules on the train roof is influenced by the high-speed motion of the train. As the high-speed train travels along the track, solar radiation varies with the position of train, date, and time. Raw data for global horizontal irradiance, diffuse horizontal irradiance, and air temperature were sourced from 13 meteorological stations owned by SOLCAST [36]. In this study, every two adjacent stations shared meteorological data from one weather station. These data were sampled every 10 min and allocated to specific fixed time points based on the train’s location and travel time along the route. Consequently, the instantaneous power generation of the PV arrays on the high-speed train could be calculated using date, local time, and ambient temperature data recorded at 10 min intervals. Practical environmental conditions were incorporated to enhance the accuracy of the proposed computational methodology. This study implemented a mathematical model to calculate the power output of PV modules and derived the PV system’s output power at each time step t (t = 1, 2, …, 608) using Equation (1) [37], which converts solar irradiance into electrical power.
P P V t = η P V × A P V × I t
where η P V represents the instantaneous power generation efficiency of the PV generator, and A P V denotes the total area (m2) of PV modules utilized in the PV power generation system, which is set to 2000 m2 in this study. I t indicates the total solar irradiance (W/m2). The rated power of individual PV panels in this system is 650 W, resulting in a total installed capacity of 1300 kW (2000 × 650 W) under the specified total installation area of 2000 m2. It should be noted that the costs of power conversion equipment, including DC/DC converters, inverters, and control devices, have been included in the investment cost of the system.
The grid energy consistently serves as the primary power source for the entire high-speed rail train power system. During train startup under traction mode, the grid supplies the predominant proportion of electrical energy. In other operational modes, the grid compensates for load demands when the combined energy supply from PV and ESS proves insufficient. To address PV generation intermittency and ensure stable power injection in high-speed rail systems, ESSs are deployed to regulate power imbalances, incorporating state of charge (SOC) management for operational stability. This study specifically selects lithium iron phosphate batteries as the energy storage device.
Because the output power of the PV is intermittent and the high-speed railway power system requires a smooth input of electricity, a lithium iron phosphate battery is used as the ESS to regulate the insufficient or excess power in the entire system, while also considering the State of Charge (SOC). The work selects LiFePO4 battery as the ESS.
When the total power generation of the high-speed railway power grid and the PV exceeds the load, the ESS is charged; when the high-speed train generates RBE, the ESS is also charged. The energy for the time step t can be calculated by Equation (2).
E t = E t 1 + P c h × 1 6 × η c h
where E t and E t 1 represent the energy content of the ESS at time t and time t 1 , respectively, with the unit of kWh, and 1/6 converts the time from minutes to hours to ensure consistent units in energy calculation; η c h denotes the charging efficiency, which is set at 90% for the work; P c h indicates the charging power of the ESS, which is a positive value with the unit of kW.
On the other hand, when the load demand exceeds the generated energy, the ESS discharges; similarly, during the traction operation at startup, the ESS also discharges. The energy at the time step t can be calculated using the Equation (3).
E t = E t 1 + P d i s × 1 6 × η d i s
It should be noted that in this equation, the value of P d i s has a negative sign, and the magnitude of η d i s is 100%. The relevant information is in Table 1.

2.2.2. Load Model

This study classifies the operational modes of high-speed rail trains into four distinct categories: traction, cruising, coasting, and braking. The investigated train departs from Hongqiao Station during the outbound journey, traversing 23 intermediate stations before reaching Xining Station, while the return journey originates from Xining Station and passes through 26 intermediate stations before returning to Hongqiao Station, involving multiple mode transitions. The traction mode is defined as the acceleration phase from standstill until reaching the target speed of 350 km/h. In scenarios where adjacent stations are geographically proximate, preventing the train from attaining 350 km/h, the system transitions to subsequent operational modes upon reaching a lower stabilized speed. The cruising mode corresponds to steady-state operation at either 350 km/h or a predetermined constant speed. During coasting mode, the propulsion system is deactivated, leaving the train subject solely to resistance forces that gradually reduce its velocity, with zero load demand in this phase.
For braking operations prior to station arrival, the CR400BF trainset employs a through-type electro-pneumatic braking system integrated with regenerative braking devices. During deceleration, the instantaneous kinetic energy conversion generates substantial electrical power, which is preferentially utilized for charging the ESS. Any surplus energy beyond ESS capacity is dissipated into the power grid.
The traction power of a high-speed train refers to the power required for the train to travel at its designed maximum speed on a straight railway. The traction power is influenced by various factors, including its maximum operating speed, total vehicle mass, resistance at maximum speed, residual acceleration, the transmission efficiency of various components, and the efficiency of the electric motor. The traction power Pk (kW) is derived from the calculation Equation (4) [38].
P k = M ω 0 + 1.06 × 10 3 M a V m a x + v × 10 3 3.6 η G e a r η M M
where M represents the weight of the high-speed train, with the unit of t, and it is taken as 505 t; ω 0 represents the basic running resistance per unit weight of the train, with the unit of N/t; a represents the residual acceleration, taken as 0.05 m/s2; v represents the headwind speed, taken as 15 km/h; V m a x represents the maximum operating speed of the high-speed train, taken as 350 km/h in the work; η G e a r represents the gear transmission efficiency, taken as 0.98; η M M represents the electric motor operating efficiency, taken as 0.94; the factor of 1.06 in the equation represents the inertia coefficient. The numerical coefficient 3.6 serves exclusively as the unit conversion factor for transforming velocity measurements from km/h to the fundamental mechanical units of m/s.
When the high-speed train reaches a speed of 350 km/h or a certain speed, it begins to operate at a constant velocity; at this point, the net force acting on the train is 0, and the traction force is equal in magnitude to the resistance force. The power P (kW) of the high-speed train under cruising conditions is derived from the calculation Equation (5) [39]
P = M 3.09 + 0.03621 v + 0.001098 v 2 10 3 + m 1 + γ a v 3.6
where v represents the speed of the high-speed train when traveling at a constant velocity, with the unit of km/h; γ represents the rotational inertia coefficient, taken as 0.06 in the work; according to the specification that a high-speed train traveling at a speed of 350 km/h on a straight railway still has a residual acceleration of 0.05 m/s2, a represents the residual acceleration, taken as 0.05 m/s2.
In the work, during braking, the movement of the high-speed train over a unit time interval is considered as a point mass. By taking the data at the start and end of the time interval, including the magnitude of the braking force and the velocity, and then calculating the average of the data, the calculation Equation (6) for the power of the RBE generated can be derived from a kinematic perspective, as shown below.
P B r = B r V t + B r V t 1 2 × V t + V t 1 2
where B r v represents the braking force, with the unit of KN, B r V t and B r V t 1 denote the braking forces at time t and t 1 , respectively; V t and V t 1 represent the velocities of the high-speed train at time t and t 1 , with the unit of km/h; P B r indicates the power of RBE produced, with the unit of kW. After substituting the relevant data into the equation, the following results were obtained: the load during the traction condition is average 10,400 kW; the load during the cruising condition is average 6100 kW; under braking conditions with 0 load demand, the RBE exhibits a power output peaking at 10,260 kW initially before gradual decay. In this work, the load variation of the high-speed train along the route every minute is shown in the Figure 4, which includes the load conditions for one trip and return trip.
Figure 4 with minute-level temporal resolution on the x-axis (capturing round-trip load variations) reveals that train speed predominantly governs electrical load demand in high-speed rail systems when other parameters are maintained to be constant. Specifically, an increase in speed significantly enhances aerodynamic resistance, leading to higher traction power requirements and increased grid electricity procurement costs. Conversely, reducing the speed effectively decreases system load and associated power costs. This fundamental relationship between train speed and load demand provides the theoretical foundation for analyzing system economics under different speed constraints.

2.2.3. Carbon Model

To achieve low-carbon systematic optimization in the high-speed rail power system, this study integrates a carbon model into the hybrid power system, which quantifies system carbon emissions and their economic costs from a LCA perspective. The power system primarily consists of the grid as the main energy source, PV for solar energy absorption, and ESS for renewable energy storage. Therefore, carbon modeling is required for these three components individually. E m i s s i o n T o t a l represents the daily carbon emissions of the hybrid power system in the high-speed rail, E m i s s i o n G r i d denotes the daily carbon emissions from grid electricity consumed during high-speed rail operations, E m i s s i o n P V reflects the average daily carbon emissions allocated from the entire LCA of PV systems, and E m i s s i o n E S S corresponds to the average daily carbon emissions allocated from the entire LCA of ESS. In this study, carbon emissions are measured in kg. The Equation (7) is presented below.
E m i s s i o n T o t a l = E m i s s i o n G r i d + E m i s s i o n P V + E m i s s i o n E S S
The carbon emissions from grid electricity consumption are first modeled. Given that the data sampling interval in this study is 10 min ( 1 6 of an hour), E Grid , i represents the electricity purchased from the grid during the i-th time interval (10 min), with units of kWh . The parameter k denotes the number of 10 min intervals during the high-speed train’s daily operational period. The calibration yields k-values of 74 (outbound) and 78 (return), exhibiting a mean value of 76 in this study. The carbon emission factor for grid electricity, ρ Grid , is set to 0.5568 kg CO 2 / kWh [40]. The Equation (8) is presented below.
E m i s s i o n G r i d = i = 1 k E Grid , i × ρ Grid
Next, the carbon emissions over the entire LCA of PV components are modeled. In this study, the installed PV panels cover an area of 2000 m 2 , with a rated power generation capacity of 650 W per square meter, resulting in a total rated PV power output of 1300 kW ( P PV , rated = 1300 kW ). The lifecycle carbon emission factor for PV, ρ PV , is set to 200 kg CO 2 / kW [41], which encompasses silicon production, module manufacturing, installation, and recycling processes. L PV denotes the total lifespan of the PV system in days. This approach calculates the daily carbon emissions allocated from the entire LCA of the PV system. The Equations (9) and (10) are presented below.
E m i s s i o n P V = P PV , r a t e d × ρ PV × 1 L PV
L PV = 365 × 20
Next, the carbon emissions over the entire LCA of the ESS are modeled. In this study, the installed ESS capacity, denoted as E b , is a variable to be optimized, with units of kWh . The lifecycle carbon emission factor for ESS, ρ ESS , is set to 130 kg CO 2 / kWh [42], which encompasses material extraction, manufacturing, transportation, and recycling processes. L ESS represents the total lifespan of the ESS in days. The Equations (11) and (12) are presented below.
E m i s s i o n E S S = E b × ρ ESS × 1 L E S S
L ESS = 365 × 5
In summary, the accounting boundary of the carbon accounting framework proposed in this study encompasses both direct and indirect emissions. Direct emissions originate from the carbon emissions associated with direct electricity consumption from the power grid, while indirect emissions include the lifecycle carbon emissions of equipment. This accounting methodology conducts daily settlement of carbon emissions from diverse sources and aligns the temporal scale to facilitate the modeling of subsequent carbon trading mechanisms and the establishment of multi-objective functions.
In this study, the daily carbon emissions of the entire high-speed rail power system are calculated, enabling the determination of carbon emission costs based on the carbon price. Carbon emission costs constitute a fundamental cost component, meaning that any carbon emissions inherently incur such costs. Cost Carbon represents the carbon emission cost in $, while Price Carbon denotes the carbon price in $ / t . The carbon price in this study is set to 13.2   $ / t [43]. Since carbon emissions in this work are measured in kg , unit conversion is required to ensure consistency for calculations. Equation (13) is presented below.
C o s t C a r b o n = E m i s s i o n T o t a l × P r i c e C a r b o n 1000
In this study, the daily total carbon emission allowance for the high-speed rail power system is set to 7900 kg , denoted as Carbon Allowance . This value is derived from the 95th percentile of the daily carbon emission data for high-speed rail power systems relying solely on grid energy. When the total daily carbon emissions of the high-speed rail exceed the specified carbon emission allowance, additional carbon allowances must be purchased. Therefore, in addition to paying for the daily carbon emission costs, the high-speed rail must also incur a carbon transaction cost, referred to as Cost CarbonT . If the total daily carbon emissions do not exceed the carbon emission allowance, only the carbon emission costs are required. The price of carbon allowances is consistent with the carbon price, both set at 13.2   $ / t , denoted as Price Allowance . Equation (14) is presented below.
C o s t C a r b o n T   = E m i s s i o n T o t a l C a r b o n A l l o w a n c e × P r i c e A l l o w a n c e 1000
If the total daily carbon emissions are less than the specified carbon emission allowance, the high-speed rail can trade the unused portion of its carbon allowance for the day, which is referred to as carbon incentivization or Cost CarbonI . In this study, carbon credits are treated as negative costs to simplify calculations.
This study introduces a carbon penalty mechanism into the model to internalize environmental externalities, compelling the system to balance between economic optimality and emission compliance. In addition to daily carbon emission modeling, annual carbon emissions are also incorporated. When the total annual carbon emissions exceed the prescribed upper limit, the penalty term imposes a carbon penalty cost, thereby incentivizing the high-speed rail power system to prioritize low-carbon operations. Conversely, if the annual emissions remain below the threshold, the penalty value is 0. Equation (15) is presented below.
C o s t C a r b o n I   = σ 365 × E m i s s i o n T o t a l C a r b o n L i m i t τ × W C a r b o n
This study sets the annual carbon emission upper limit ( Carbon Limit ) to 2,020,321 kg, derived from the 70th percentile of the annual carbon emission data for high-speed rail power systems relying solely on grid energy. The function σ ( x ) represents the Sigmoid function, employed to smooth the penalty term. The parameter τ denotes a normalization coefficient, set to 1000 in this study, to regulate the sensitivity of the penalty term. W Carbon represents the penalty weight (set to 10 5 here), determined through grid search. A high penalty weight ensures strict penalties for excessive emissions, aligning with dual-carbon policy goals of China.

2.2.4. REC Model

This study employs a real-time integration method to calculate the REC generation. First, the PV generation during the i-th time interval, denoted as PV generation , is calculated in kWh . Where t [ i ] represents the duration of PV generation within the i-th 10 min high-speed rail operation interval, and P PV [ i ] denotes the PV power output in kW . The cumulative total PV generation, REC generation , is measured in kWh . Equations (16) and (17) are presented below.
P V g e n e r a t i o n = k i = 1 P P V i × t i 60
R E C g e n e r a t i o n = P V g e n e r a t i o n
The hybrid high-speed rail power system in this study is a semi-islanded microgrid, where the solar energy absorbed by PV panels is primarily stored by ESS devices and supplied to the system. Increasing the capacity and power of ESS can enhance the PV accommodation rate, thereby reducing the curtailment rate. Therefore, considering the synergistic amplification effect of ESS configuration on REC, a coupling coefficient ψ is introduced. Equations (18) and (19) are presented below.
R E C r e v e n u e = R E C g e n e r a t i o n   × P r i c e R E C × ψ
ψ = 1 + 0.29 × E b 100 + 0.29 × P b 100
The ψ coefficients of 0.29/kW ( P b ) and 0.29/kWh ( E b ), derived from Spearman correlation analysis ( p < 0.01 ), demonstrate that increasing the ESS capacity E b or rated power P b by 100 units enhances REC revenue by 29%. The REC price is set to 0.036 USD/kWh [44], with REC revenue consistently treated as a negative cost in economic calculations. The assumption of guaranteed REC monetization at fixed prices with 100% purchase rates represents an idealized market scenario adopted for computational tractability. While such simplifications allow clear attribution of economic benefits in our framework, it constitutes a methodological limitation given empirical evidence of substantial REC price volatility.

3. Problem Formulation

3.1. Objective Function

The objective of this study is to optimize the size of ESS while satisfying constraints of train operation, with the aim of minimizing both the investment and operational costs of the high-speed rail power system and reducing carbon emissions. Specifically, the optimization problem involves 610 control variables, including 608 grid power output values at 10 min intervals, the installed capacity of the ESS ( E b ), and the rated power of the ESS ( P b ). The optimization simultaneously minimizes total system cost (f1) and carbon emissions (f2) through a Pareto-based framework, where both objective functions jointly constrain the solution space during the iterative evaluation of ESS configurations and grid-power dispatch sequences. The objective functions are defined as shown in Equations (20) and (21).
min f 1 = C o s t G r i d + C o s t P V × C R F P V + C o s t E S S × C R F E S S
min f 2 = Cost Carbon + Cost CarbonT + Cost CarbonI +   Cost CarbonP + REC revenue
Specifically, the total cost is composed of the electricity charges from the grid as well as the installation and replacement costs of the PV and the ESS, designated to be converted into net present value. These costs are defined by the Equations (22)–(24).
Cost Grid = Price Grid × E Grid + 57,400
Cost PV = C Capital PV + C Replacement PV P PV
Cost ESS = C Capital ESS + C Replacement ESS E ESS
where P r i c e Grid represents the electricity price (USD/kWh), which varies by region and is also divided into peak (08:30–11:30, 18:00–23:00), off-peak (07:00–08:30, 11:30–18:00), and valley (23:00–07:00) electricity prices throughout the day. E Grid represents the total energy consumed by the high-speed train from the grid during its entire operation. The term 57,400 represents the basic electricity fee, which is calculated using the reading of the demand meter (10,400 kW) multiplied by the basic electricity price (USD 5.52/kW). The terms C Capital PV , C Replacement PV , C Capital ESS , and C Replacement ESS represent the installation and replacement costs for the PV and ESS, respectively; P PV indicates the power capacity of the PV; E ESS denotes the capacity of the ESS. In this study, the installed capacity of PV system is fixed at 1300 kW, with its investment cost treated as a constant parameter in the model. Despite being preset parameters rather than optimization variables, these parameters are included in the objective function for comprehensive evaluation, ensuring a full representation of the economic performance of system throughout its entire LCA.
This study employs the Capital Recovery Factor (CRF) to uniformly convert initial investments and future replacement costs into annualized capital costs, as defined in Equation (25). The CRF is a standard method in power economic analysis, which converts capital costs into equivalent annualized values, enabling rational allocation of equipment replacement expenses across project lifecycles with time-value considerations.
C R F = r 1 + r y 1 + r y 1
where r represents the interest rate, taken as 4.9% in the work, and y represents the lifespan of PV equipment or the ESS, y of PV is 20, and y of ESS is 5. Upon calculation, C R F of PV is 0.0784 and C R F of ESS is 0.2326.
Sensitivity analyses examining ±15% carbon price variations (NREL 2020–2023), ±20% REC price fluctuations (China Green Certificate Platform), and ±10% PV cost deviations confirmed less than 5% LCOE variability, demonstrating robust optimal configurations under economic uncertainty.

3.2. Constraints

For a high-speed rail hybrid power system, the following operational constraints (26)–(31) should be met.
0 P c h t P b P m a x
0 P d i s t P b P m a x
0 0.2 E b E t E b E m a x
0.2 S O C t 0.8
S O C 0 = S O C t e n d = 0.5
S O C t = E t E b
where P c h t indicates the charging power of the ESS at time t, while P d i s t denotes the discharging power at the same instance. P b signifies the unknown energy storage capacity, with units of kW. P m a x represents the upper limit of the capacity of ESS, set at 1500 kW for the purposes of the work. At each computational time step t, the ESS will exhibit either a charging power P c h t or a discharging power P d i s t , with at least one being 0, indicating that simultaneous charging and discharging are not permitted. P c h t is designated as a positive value, whereas P d i s t is considered negative. E t is used to express the energy content of the ESS at time t. E b represents the unknown energy content of the ESS, with units of kWh. E m a x is the maximum energy capacity set for the ESS in this research, which is 1500 kWh. S O C t is the state of charge of the ESS at time t, calculated as the ratio of the instantaneous energy E t to the total capacity E b . S O C 0 and S O C t e n d correspond to the state of charge at the commencement and conclusion of operational cycle of the high-speed train, respectively.
Furthermore, the high-speed train must satisfy the load constraints (32) during operation.
P P V t + P c h t + P d i s t + P G r i d t = P L o a d t
where P G r i d t represents the output power of the grid at time t. The coexistence of P c h t and P d i s t is mutually exclusive at time t and P L o a d t represents the load demand of the train at time t.

4. Multi-Objective Optimization Framework

This study addresses a problem characterized by large-scale and complex data, necessitating accurate computation across all model components and the ability to handle multi-objective requirements. To meet these challenges, the work proposes the EDMOA as the optimization method.

4.1. Algorithmic Process of EDMOA

The EDMOA algorithm initializes population parameters, including population size N pop , maximum iteration count T max , and key operational parameters. It initializes the output power P Grid of the high-speed railway power grid across 608 consecutive 10 min intervals, along with the operational power P ESS and capacity E ESS of the energy storage system. Upon execution, an initial population P 0 is generated via an enhanced logistic circle composite chaotic mapping, where each individual X i is systematically distributed within the solution space. A pre-computed random number pool R pool is established to optimize computational efficiency throughout the optimization process. During initialization, an elite archive E containing the top 5% of the population is created, and the fitness f ( X i ) of each candidate is evaluated to identify the global optimum X and its fitness f . Within the main iteration loop, dynamic parameter adjustments are first executed per generation: the learning rate α ( t ) decays exponentially, while the crossover rate P c ( t ) adaptively adjusts according to real-time population diversity σ ( t ) using predefined formulas. The core evolutionary phase integrates hierarchical pursuit mechanism of GWO with spiral encircling strategy of WOA. The GWO component generates dynamic search vectors, while the WOA constructs spiral trajectories. Intermediate solutions are produced through differential mutation and subsequently fused with the original DMOA strategy via a time-varying hybrid coefficient η ( t ) , forming new candidate solutions.
Following hybrid evolution, the algorithm initiates trust-region local search, conducting precision probes along five symmetric directions centered on X . The trust-region radius Δ ( t ) is dynamically adjusted: it is expanded by 1.2× upon success or contracted by 0.8× upon failure. Every 100 generations, chaotic population renewal is executed using time-varying parameter r to reorganize the worst-performing 10% of individuals, continuously injecting diversity. The elite archive E persistently retains high-quality individuals, while roulette wheel selection is applied to the hybrid population to maintain exploration–exploitation equilibrium. Convergence is monitored continuously; the algorithm terminates early if the global fitness variation   f t f t 50 < ϵ ( ϵ < 10 8 ) persists for 50 consecutive generations, or when reaching T max . Final outputs include X and semi-logarithmic convergence curves. A parallel evaluation framework accelerates fitness computation, achieving optimal balance between search efficiency and solution quality. The flowchart is shown in the Figure 5 below.

4.2. Chaotic Mapping-Driven Population Initialization and Updating Mechanism

This optimization algorithm employs an enhanced logistics circle composite chaotic mapping for population initialization to improve solution diversity and exploration capability. Chaotic mapping generates heterogeneous initial solution sets due to its intrinsic unpredictability and complex dynamical behavior, which facilitates escaping local optima and enhances global search performance. By increasing population diversity, the algorithm effectively explores the search space and mitigates premature convergence. The initial solutions are generated with high ergodicity, where r (control parameter of the chaotic mapping) is initialized at 3.99, and μ , k (parameters of the circle mapping) are set to 0.5 and 1.0, respectively, to modulate the mapping behavior. Compared to the random initialization in the original DMOA [45], this method prevents population clustering in specific regions and significantly improves initial solution diversity. A chaotic update operation is introduced every 100 generations to reorganize the worst-performing 10% of individuals. Nonlinear perturbation is achieved through dynamic adjustment of the chaotic parameter r, continuously injecting fresh solutions to avoid local optima. Here, X k denotes the current iterative value, θ k represents another chaotic variable, and t indicates the current iteration count. The governing Equations (33) and (34) are formulated as follows.
r = 3.99 + 0.1 × sin t 100
X k + 1 = r × X k ( 1 X k ) + μ                                                     k 2 π sin ( 2 π θ k ) ) mod 1

4.3. Hybrid-Driven Position Updating Strategy

The core evolutionary mechanism integrates the hierarchical pursuit strategy from GWO [46] and the spiral encircling tactics from the Whale Optimization Algorithm (WOA) [47] to establish a dynamic hybrid update equation. The hybrid coefficient η ( t ) dynamically decays with iterations, prioritizing global exploration in early phases and shifting toward local exploitation in later stages. The GWO component incorporates an enhanced α -wolf guidance mechanism with adaptive parameters to balance exploration intensity, while the WOA component introduces an exponentially decaying spiral factor combined with cosine fluctuation terms to strengthen local optimum escape capability. This hybrid strategy demonstrates accelerated convergence rates compared to single-mechanism algorithms, particularly excelling in high-dimensional optimization problems. α ( t ) denotes the adaptive parameter, X GWO and X WOA represent position updates from GWO and WOA respectively, X old indicates the original individual position, and X DMOA corresponds to the updated position in the DMOA. The adaptive learning rates α 0 and β are set to 0.5 and 0.9 respectively, with T denoting the total iteration count. The governing Equations (35)–(37) are formulated as follows.
X new = η ( t ) × X GWO + α ( t ) × X WOA X old + 1 η ( t ) × X DMOA
η t = 0.9 × 1 t T
α t = α 0 × β t

4.4. Dynamic Trust-Region Local Search Framework

This algorithm incorporates a radius-adaptive trust-region stochastic search module, whose core mechanism lies in dynamically adjusting the search radius. The parameter ξ ( t ) is regulated based on the historical search success rate: the radius expands by a factor of 1.2 upon successful iterations and contracts by 0.8 upon failure. Five symmetric probing directions are generated around the global optimum, synergistically combined with normally distributed random perturbations to establish a local search pattern that balances directional guidance and stochasticity. This mechanism complements the original nanny rotation mechanism in the DMOA, enabling refined exploitation of potential optimal regions during later optimization stages. Δ ( t ) denotes the trust-region radius, Δ 0 represents the initial radius size (set as one-tenth of the upper bound minus the lower bound), and ζ ( t ) signifies the dynamic adjustment factor (1.2 for success, 0.8 for failure). The governing Equation (38) is formulated as follows.
t = 0 × e x p 5 t T × ξ t

4.5. Multimodal Adaptive Parameter Control Strategy

The algorithm incorporates a dual-layer parameter adjustment mechanism, where the outer layer controls the global exploration intensity through an exponentially decaying α ( t ) , and the inner layer dynamically adjusts the crossover rate based on population diversity metrics. σ ( t ) represents the diversity index measured by population standard deviation. The mutation rate employs an adaptive adjustment strategy to maintain early exploration capabilities while preventing excessive perturbations in later stages. Compared to the fixed parameters in the DMOA, this parameter framework demonstrates enhanced robustness in dynamic environmental adaptation. In this context, P c ( t ) denotes the crossover rate, 0.5 represents the base crossover probability, and 0.4 signifies the adjustment magnitude, controlling the influence of diversity on the crossover rate. The governing Equation (39) is formulated as follows.
P c ( t ) = 0.5 + 0.4 × 1 e 10 σ ( t )

4.6. Elite-Guided Parallel Computing Architecture

This algorithm implements an elite preservation strategy combined with a parallel evaluation framework. It maintains a repository of the top 5% of the population to preserve superior genetic traits and employs Joblib for multithreaded parallel computing. A hybrid selection mechanism is designed where elite individuals are directly retained and the remaining individuals are generated through tournament selection. Additionally, a pre-generated random number pool optimizes computational efficiency. This architecture maintains population diversity while significantly enhancing algorithmic efficiency, making it particularly suitable for optimizing computationally intensive objective functions. S new represents the selection operation, E elite denotes the elite individual set (directly preserving the top 5% optimal individuals to ensure convergence), and R stochastic signifies the stochastic selection set, which is generated from the remaining individuals via roulette wheel selection to maintain diversity. The union operation integrates elite preservation and stochastic selection to achieve an optimal balance. The governing Equation (40) is formulated as follows.
S n e w = E e l i t e R s t o c h a s t i c

5. Simulation Results and Discussion

5.1. Algorithm Performance Analysis

The primary objective of this study is to solve the target function using the proposed EDMOA, ensuring both the normal operational load of high-speed railway trains and the stable operation of all system components. The algorithm optimizes the power and capacity of energy storage devices while minimizing the total cost and carbon emissions of the hybrid power system. For comparative validation, six benchmark algorithms—DMOA, GWO, Zebra Optimization Algorithm (ZOA) [48], Bird Swarm Algorithm (BSA) [49], Golden Jackal Optimization (GJO) [50], and Sand Cat Swarm Algorithm (SCSA) [51]—are selected to evaluate the rationality of the optimization results. Lower fitness values indicate superior algorithmic performance. The convergence curves of these algorithms for the target function are illustrated in the figures. All experiments are conducted under identical conditions with a population size of 100 and a maximum iteration count of 1000.
The comparative analysis reveals the rationality of the optimization results obtained by EDMOA and validates the effectiveness of the algorithmic improvements proposed in this study. As illustrated in Figure 6, which shows the convergence curve of EDMOA being employed as the baseline for local magnification, EDMOA achieves a non-zero fitness value of 235,760, outperforming all benchmark algorithms. Specifically, the optimal fitness values are 237,104 for BSA, 236,195 for DMOA, 236,947 for GJO, 236,142 for GWO, 236,343 for SCSA, and 240,096 for ZOA. EDMOA demonstrates a performance advantage ranging from 435 points (compared to DMOA) to 4336 points (compared to ZOA). Furthermore, EDMOA exhibits enhanced capability to escape local optima and discover superior solutions during iterations. Runtime comparisons show that the original DMOA requires 2000.51 s for 1000 iterations, while the improved EDMOA completes the same task in 840.67 s, confirming significant computational efficiency gains. The iterative convergence curve also highlights EDMOA’s phased optimization behavior, characterized by early exploration and later exploitation phases. To statistically validate these performance advantages, Wilcoxon signed-rank tests ( α = 0.5) were conducted on convergence trajectories across 30 independent runs. The tests confirmed improvements of EDMOA in both final solution quality ( p = 1.8 × 10 7 ) and convergence speed ( p = 3.2 × 10 8 ) are statistically significant. Collectively, the results demonstrate that EDMOA achieves the lowest fitness value in optimizing the target function for minimizing operational costs and carbon emissions while ensuring uninterrupted high-speed railway load demands.

Ablation Study of EDMOA

To systematically evaluate the necessity of components of EDMOA, we conducted an ablation study to assess their individual and combined contributions to algorithm performance. As shown in Table 2, the complete EDMOA implementation incorporating chaotic mapping, trust-region adaptation, and elite-guided search achieves the lowest fitness value of 235,760. The removal of the elite-guided mechanism results in a fitness increase to 235,949, indicating its critical role in enhancing solution quality. Furthermore, the absence of trust-region adaptation leads to a significant fitness degradation to 236,102, underscoring its importance in maintaining algorithm stability. These findings validate the necessity of all components and their synergistic effects in achieving optimal performance.

5.2. Simulation Analysis

After obtaining the optimal ESS configuration through the optimization algorithm, it is incorporated into the simulation model. The energy interaction simulation results are depicted in Figure 7 and Figure 8. PV generation significantly impacts the high-speed railway hybrid power system, as PV output is influenced by time and seasonal variations. Figure 7 and Figure 8 illustrate the energy interactions within the hybrid power system during a single round trip in summer and winter, respectively. As observed from these figures, compared to winter, summer PV generation is more robust and stable. By examining the power output curves of the high-speed railway grid during both seasons, it is evident that the electricity output of a grid is lower in summer than in winter. Consequently, the proposed high-speed railway hybrid power system exhibits higher energy efficiency in summer, leading to reduced electricity costs.
From an economic perspective, the calculated REC trading revenue amounts to USD 216,137.2 in summer and USD 120,565.4 in winter. The analysis reveals a significant positive correlation between seasonal climate fluctuations and the economic benefits of REC trading. Specifically, solar irradiance intensity, as the key driving factor, enhances REC revenue by 79.3% in summer compared to winter. Furthermore, at sites with abundant solar resources, the REC trading mechanism demonstrates superior economic benefits.

5.3. Economic Benefit Analysis

This study investigates the integration of solar energy and braking regenerative energy into high-speed railway power systems via PV devices and ESS while incorporating carbon trading mechanisms and REC trading mechanisms into the model. The analysis evaluates the impacts of operational load variations under diverse conditions, PV device performance, and ESS configurations on the high-speed railway power system, thereby validating the efficacy of the proposed EDMOA as an optimization framework.
Case 1: Cost analysis considering solely grid energy.
Case 2: Objective optimization incorporating grid energy, PV devices, and ESS.
Case 3: Objective optimization incorporating grid energy, PV devices, and ESS, while integrating carbon trading and REC trading mechanisms.
From Table 3, the following can be observed:
(a) Both Case 2 and Case 3 exhibit lower Net present cost compared to Case 1, with reductions of USD 668,294 and USD 923,152, respectively. This demonstrates that the hybrid power system incorporating PV and ESS significantly reduces operational costs.
(b) Using the proposed EDMOA optimization algorithm to solve the two models, the ESS in Case 2 is configured with a rated capacity of 460 kWh and a maximum output power of 1430 kW, while in Case 3, the ESS has a rated capacity of 408 kWh and a maximum output power of 1498 kW. Quantitative analysis indicates that after integrating life-cycle carbon emission accounting and internalizing carbon trading costs, the system optimization direction shifts significantly. Compared to a focus on maximizing storage capacity, the algorithm prioritizes ESS configurations with higher power density (≥3.67 kW/kWh). This shift in technical selection arises from the sensitivity of marginal carbon abatement costs to the rapid charging and discharging capabilities of high-power ESS. Such systems can achieve multiple daily cycles, optimizing carbon footprint reduction and reflecting the influence of carbon trading mechanisms on ESS technology selection. Case 3 achieves USD 826 lower grid-related expenditure compared to Case 2 due to the higher power density of the ESS.
(c) After connecting the hybrid power system to the carbon trading market and implementing daily carbon emission quotas, the system incurs additional annual carbon credit purchase costs of USD 119,109. This indicates that the current energy supply structure remains grid-dependent, with a significant proportion of electricity sourced from coal-fired power generation. The carbon intensity transmission effect of this energy mix ultimately necessitates the purchase of supplementary carbon credits to meet operational requirements.
(d) By incorporating the REC trading mechanism, Case 3 achieves annual revenue of USD 579,427. This highlights the substantial potential for renewable energy development along high-speed railway corridors. The integration of distributed renewable energy systems into the high-speed railway power supply network, combined with participation in the REC trading market, enables the creation of auxiliary revenue streams through market-based compensation mechanisms. These results confirm that the EDMOA-optimized hybrid power system achieves significant cost reduction compared to traditional single-source architectures. Despite the carbon trading-related emission rights acquisition costs, the revenue generated through REC trading enables Case 3 to achieve a lower net cost compared to Case 2, with a reduction of USD 254,858 (7.97%). Economic analysis demonstrates that the algorithm-driven ESS configuration shifts toward higher power density. These findings validate the economic feasibility of the carbon–REC synergistic trading mechanism in high-speed railway operations and highlight the value of the EDMOA algorithm in optimizing hybrid power systems for high-speed railways.

5.4. Environmental Benefit Analysis

The primary energy source for high-speed railway power grids is coal-fired power generation, which emits substantial carbon dioxide. Consequently, when drawing electricity from the grid, high-speed trains inherently incur substantial carbon footprints. In this study, the integration of PV systems and ESS not only optimizes economic costs but also significantly reduces carbon emission intensity. The carbon dioxide equivalent per kWh consumed by the high-speed railway grid reaches 0.5568 kg. The life-cycle carbon emissions of PV and ESS presented in the tables are calculated by amortizing total emissions over annual averages.
As evidenced in Table 4, (a) both Case 2 and Case 3 exhibit lower carbon emissions than Case 1, with reductions of 691,912.5 kg and 693,452.5 kg, respectively. This confirms that incorporating renewable energy as a power source for high-speed railway systems effectively reduces overall carbon emissions. (b) Case 3, which integrates carbon trading and REC trading mechanisms, demonstrates a 1540 kg reduction in emissions compared to Case 2. Although the absolute emission reduction is modest, the synergistic implementation of these mechanisms further decreases the grid energy dependency ratio, thereby reducing grid-related carbon emissions from 24.70% in Case 2 to 24.72% in Case 3. Simultaneously, the life-cycle carbon emissions of ESS are reduced by 923.5 kg annually in Case 3 compared to Case 2, representing an 11.3% improvement. These results highlight the environmental benefits of optimizing ESS configurations through the integration of carbon–REC synergistic trading mechanisms.

6. Conclusions

This study develops an ESS optimization framework for a PV-ESS-Grid system with carbon–REC trading, establishing four 10 min operational modes (traction, cruising, coasting, braking). The meteorologically complex Hongqiao–Xining corridor validates framework adaptability through systematic evaluation of seasonal weather impacts. EDMOA optimizes ESS capacity/power allocation and grid dispatch to achieve dual cost-carbon reduction objectives in high-speed rail systems. Simulation results verify that the hybrid system outperforms the conventional rail grid system in terms of costs and CO2 emissions. The following conclusions are drawn: (i) Through dynamic pricing and benefit evaluation frameworks, green power-integrated multi-energy systems reduce total costs by 23.90% and carbon emissions by 24.02%, synergistically enhancing economic–environmental performance of high-speed rail while boosting marginal revenue and reducing carbon intensity. (ii) A multi-source power system with energy management is proposed, employing dynamic energy-flow models and LCA to reveal renewable synergy in low-carbon rail operations, establishing clean transformation pathways for transit systems. (iii) The optimization algorithm achieves 435 fewer objective function iterations and 58% faster convergence speed than the original DMOA, with significant enhancements from trust-region search, elite retention, parallel evaluation, and improved logistics circle chaotic mapping. While current carbon–electricity coupling mechanisms limit real-time price modeling fidelity, the proposed multi-scale framework enables mobile energy coordination. Future work will implement deep reinforcement learning-driven neural co-optimization across temporal scales, systematically addressing price volatility through spatiotemporal flexibility transfer mechanisms. This approach will be specifically benchmarked in maritime port and airport microgrid electrification scenarios to quantify resilience and efficiency gains in critical infrastructures.

Author Contributions

W.-N.Z.: conceptualization, methodology, investigation, formal analysis, writing—review and editing, funding acquisition. Z.X.: methodology, software, data curation, visualization, writing—original draft. Y.-Y.H.: conceptualization, investigation, resources, supervision. F.-Y.L.: investigation, supervision. Z.-Q.B.: investigation, supervision. All authors have read and agreed to the published version of the manuscript.

Funding

This research was funded by the Soft Science Research Project of the Shanghai Science and Technology Innovation Action Plan, No. 23692109400.

Institutional Review Board Statement

Not applicable.

Informed Consent Statement

Not applicable.

Data Availability Statement

The raw data supporting the conclusions of this article will be made available by the authors on request.

Conflicts of Interest

The authors declare no conflicts of interest.

References

  1. Yuan, J.; Peng, L.; Zhou, H.; Gan, D.; Qu, K. Recent research progress and application of energy storage system in electrified railway. Electr. Power Syst. Res. 2024, 226, 109893. [Google Scholar] [CrossRef]
  2. Wang, H.; Qiu, X.; Xiong, Y.; Tan, X. AutoGRN: An adaptive multi-channel graph recurrent joint optimization network with Copula-based dependency modeling for spatio-temporal fusion in electrical power systems. Inf. Fusion 2025, 117, 102836. [Google Scholar] [CrossRef]
  3. Ministry of Transport of China. The 14th Five-Year Plan for Green Transportation Development; Technical Report; Ministry of Transport of China: Beijing, China, 2022.
  4. Feng, C.; Gao, Z.; Sun, Y.; Chen, P. Electric Railway smart microgrid system with integration of multiple energy system and power-quality improvement. Electr. Power Syst. Res. 2021, 199, 107459. [Google Scholar] [CrossRef]
  5. Fan, H.; Cui, X.; Lin, Y.; Jin, T. Research on Multi-port Large Capacity Energy Router Technologies for Urban Rail Transit. In Proceedings of the 2023 6th International Conference on Energy, Electrical and Power Engineering (CEEPE 2023), Guangzhou, China, 12–14 May 2023; pp. 867–872. [Google Scholar]
  6. Yang, H.; Xie, L.; Guo, C.; Qin, Y.; Liang, G. Influence of New Energy Access to Power System on Current Transformer Aging. In Proceedings of the 2022 IEEE International Conference on High Voltage Engineering and Applications (ICHVE 2022), Chongqing, China, 25–29 September 2022. [Google Scholar]
  7. Muhammad, T.; Huawei, L.; Abdul, Q.; Arif, H. Design of Hybrid Energy System of CRH2 Train Passing Through Neutral Section. In Proceedings of the 2022 IEEE 4th Global Power, Energy and Communication Conference (GPECOM 2022), Nevsehir, Turkey, 14–17 June 2022; pp. 117–123. [Google Scholar]
  8. Guo, S.; Cai, L.; Wu, H.; Song, G.; Lin, L.; Chen, Y. Optimal PV-storage capacity planning for rail transit self-consistent energy system considering extreme weather conditions. IET Renew. Power Gener. 2024, 18, 3753–3764. [Google Scholar] [CrossRef]
  9. Pupin, P.C.; Perazzini, M.T.B.; Grillo Reno, M.L.; Perazzini, H.; Haddad, J.; Yamachita, R.A. Life cycle assessment for producing monocrystalline photovoltaic panels: A case study of Brazil. Energy Sources Part A Recover. Util. Environ. Eff. 2023, 45, 12924–12937. [Google Scholar] [CrossRef]
  10. Quek, A.; Abbas, A.R.; Zaman, N.Z.I.S.; Ata, W.N.S.W.; Zainal, M.F.; Yapandi, F.K.M.; Ibrahim, Z.F.; Suhardi, A. Life Cycle Assessment of Large-Scale Solar Photovoltaic Plant based in Malaysia. IOP Conf. Ser. Earth Environ. Sci. 2024, 1372, 012055. [Google Scholar] [CrossRef]
  11. de Wild, P.; de Wild-Scholten, M.; Goudswaard, I. Life cycle assessment of photovoltaic module backsheets. Prog. Photovolt. Res. Appl. 2025, 33, 27–39. [Google Scholar] [CrossRef]
  12. Prabhu, V.S.; Shrivastava, S.; Mukhopadhyay, K. Life Cycle Assessment of Solar Photovoltaic in India: A Circular Economy Approach. Circ. Econ. Sustain. 2022, 2, 507–534. [Google Scholar] [CrossRef] [PubMed]
  13. Dong, L.; Gu, Y.; Cai, K.; He, X.; Song, Q.; Yuan, W.; Duan, H. Unveiling lifecycle carbon emissions and its mitigation potentials of distributed photovoltaic power through two typical case systems. Sol. Energy 2024, 269, 112360. [Google Scholar] [CrossRef]
  14. Zaiqiang, J.; Yao, C.; Xingguo, Y.; Yaoling, Z.; Qi, Y. Study on Carbon Emissions Throughout the Entire Lifecycle of Photovoltaic Power Station Projects. China Resour. Compr. Util. 2023, 41, 158–160. [Google Scholar]
  15. Mandade, P.; Weil, M.; Baumann, M.; Wei, Z. Environmental life cycle assessment of emerging solid-state batteries: A review. Chem. Eng. J. Adv. 2023, 13, 100439. [Google Scholar] [CrossRef]
  16. Dieterle, M.; Fischer, P.; Pons, M.N.; Blume, N.; Minke, C.; Bischi, A. Life cycle assessment (LCA) for flow batteries: A review of methodological decisions. Sustain. Energy Technol. Assess. 2022, 53, 102457. [Google Scholar] [CrossRef]
  17. Wickerts, S.; Arvidsson, R.; Nordelöf, A.; Svanström, M.; Johansson, P. Prospective Life Cycle Assessment of Lithium–Sulfur Batteries for Stationary Energy Storage. ACS Sustain. Chem. Eng. 2024, 12, 6035–6036. [Google Scholar] [CrossRef]
  18. Ager-Wick Ellingsen, L.; Jayne Thorne, R.; Wind, J.; Figenbaum, E.; Romare, M.; Nordelöf, A. Life cycle assessment of battery electric buses. Transp. Res. Part D Transp. Environ. 2022, 112, 103498. [Google Scholar] [CrossRef]
  19. Hammond, G.P.; Hazeldine, T. Indicative energy technology assessment of advanced rechargeable batteries. Appl. Energy 2015, 138, 559–571. [Google Scholar] [CrossRef]
  20. Lam, D.H.C.; Lim, Y.S.; Wong, J.; Sapihie, S.N.M. Life-cycle assessment of batteries for peak demand reduction. J. Electron. Sci. Technol. 2023, 21, 100226. [Google Scholar] [CrossRef]
  21. Peters, J.F. Best practices for life cycle assessment of batteries. Nat. Sustain. 2023, 6, 614–616. [Google Scholar] [CrossRef]
  22. Liu, B.; Ding, C.J.; Hu, J.; Su, Y.; Qin, C. Carbon trading and regional carbon productivity. J. Clean. Prod. 2023, 420, 138395. [Google Scholar] [CrossRef]
  23. Jiang, Y.; Luo, L.; Tsang, A.; Zhang, Y. Carbon emission trading scheme and carbon performance: The role of carbon management system. Br. Account. Rev. 2024, 57, 101492. [Google Scholar] [CrossRef]
  24. Wang, Y.; Shu, J.; Su, J.; Zhen, L. Inventory placement with carbon cap-and-trade in guaranteed service supply chains. Transp. Res. Part E Logist. Transp. Rev. 2025, 193, 103813. [Google Scholar] [CrossRef]
  25. Xi, B.; Jia, W. Research on the impact of carbon trading on enterprises’ green technology innovation. Energy Policy 2025, 197, 114436. [Google Scholar] [CrossRef]
  26. Zhu, Q.; Chen, X.; Song, M.; Li, X.; Shen, Z. Impacts of renewable electricity standard and Renewable Energy Certificates on renewable energy investments and carbon emissions. J. Environ. Manag. 2022, 306, 114495. [Google Scholar] [CrossRef]
  27. Bjørn, A.; Lloyd, S.M.; Brander, M.; Matthews, H.D. Renewable energy certificates allow companies to overstate their emission reductions. Nat. Clim. Change 2022, 12, 508–509. [Google Scholar] [CrossRef]
  28. Baamonde-Seoane, M.A.; del Carmen Calvo-Garrido, M.; Vázquez, C. Pricing renewable energy certificates with a Crank–Nicolson Lagrange–Galerkin numerical method. J. Comput. Appl. Math. 2023, 422, 114891. [Google Scholar] [CrossRef]
  29. Baamonde-Seoane, M.A.; del Carmen Calvo-Garrido, M.; Vázquez, C. Model and numerical methods for pricing renewable energy certificate derivatives. Commun. Nonlinear Sci. Numer. Simul. 2023, 118, 107066. [Google Scholar] [CrossRef]
  30. Zhang, H.; Assereto, M.; Byrne, J. Deferring real options with solar renewable energy certificates. Glob. Financ. J. 2023, 55, 100795. [Google Scholar] [CrossRef]
  31. Zhang, R.; Lee, M.; Huang, L. Grid parity analysis of photovoltaic systems considering feed-in tariff and renewable energy certificate schemes in Hong Kong. Renew. Sustain. Energy Rev. 2023, 181, 113326. [Google Scholar] [CrossRef]
  32. Guo, X.; Wang, L.; Ren, D. Optimal scheduling model for virtual power plant combining carbon trading and green certificate trading. Energy 2025, 318, 134750. [Google Scholar] [CrossRef]
  33. Águila León, J.; Vargas-Salgado, C.; Díaz-Bello, D.; Montagud-Montalvá, C. Optimizing photovoltaic systems: A meta-optimization approach with GWO-Enhanced PSO algorithm for improving MPPT controllers. Renew. Energy 2024, 230, 120892. [Google Scholar] [CrossRef]
  34. Araoye, T.O.; Ashigwuike, E.C.; Mbunwe, M.J.; Bakinson, O.I.; Ozue, T.I. Techno-economic modeling and optimal sizing of autonomous hybrid microgrid renewable energy system for rural electrification sustainability using HOMER and grasshopper optimization algorithm. Renew. Energy 2024, 229, 120712. [Google Scholar] [CrossRef]
  35. Kharrich, M.; Hassan, M.H.; Kamel, S.; Kim, J. Designing an optimal hybrid microgrid system using a leader artificial rabbits optimization algorithm for domestic load in Guelmim city, Morocco. Renew. Energy 2024, 223, 120011. [Google Scholar] [CrossRef]
  36. Solcast. Global Solar Irradiance Data and PV System Power Output Data; Solcast: Sydney, Australia, 2019. [Google Scholar]
  37. Wen, S.; Lan, H.; Yu, D.C.; Fu, Q.; Hong, Y.Y.; Yu, L.; Yang, R. Optimal sizing of hybrid energy storage sub-systems in PV/diesel ship power system using frequency analysis. Energy 2017, 140, 198–208. [Google Scholar] [CrossRef]
  38. Jia, Z.B. Research on the Application of Photovoltaic Power Generation in Auxiliary Power Supply System of CRH2 Rolling Stock. Master’s Thesis, Lanzhou Jiaotong University, Lanzhou, China, 2020. [Google Scholar]
  39. Sun, J.F. Research on the main top-level technical indexes of traction system for 400 km/h locomotives. China Railw. Sci. 2017, 38, 70–77. [Google Scholar]
  40. Li, Y.; Yang, X.; Du, E.; Liu, Y.; Zhang, S.; Yang, C.; Zhang, N.; Liu, C. A review on carbon emission accounting approaches for the electricity power industry. Appl. Energy 2024, 359, 122681. [Google Scholar] [CrossRef]
  41. International Energy Agency. Life Cycle Carbon Emissions of Photovoltaic Systems, 2024. Photovoltaic Life Cycle Carbon Emissions. Available online: https://www.iea.org/reports/solar-pv-global-supply-chains (accessed on 1 September 2024).
  42. National Renewable Energy Laboratory. Life Cycle Assessment of Lithium Iron Phosphate Batteries; Technical Report; LFP Battery Carbon Footprint; National Renewable Energy Laboratory (NREL): Golden, CO, USA, 2024. Available online: https://www.nrel.gov/analysis/life-cycle-assessment.html (accessed on 1 September 2024).
  43. Shanghai Environment and Energy Exchange. China Carbon Emission Allowance (CEA) Trading Data, 2023. Average CEA Spot Price: 95 CNY/ton (Date: December 2023). Available online: https://www.cneeex.com/ (accessed on 1 September 2024).
  44. China Green Certificate Trading Platform. Renewable Energy Certificate (REC) Trading Data, 2024. Average REC Spot Price: 130 CNY/MWh (Date: October 2024). Available online: https://www.greenenergy.org.cn/ (accessed on 1 September 2024).
  45. Agushaka, J.O.; Ezugwu, A.E.; Abualigah, L. Dwarf Mongoose Optimization Algorithm. Comput. Methods Appl. Mech. Eng. 2022, 391, 114570. [Google Scholar] [CrossRef]
  46. Kaveh, A.; Zakian, P. Improved GWO algorithm for optimal design of truss structures. Eng. Comput. 2018, 34, 685–707. [Google Scholar] [CrossRef]
  47. Mirjalili, S.; Lewis, A. The Whale Optimization Algorithm. Adv. Eng. Softw. 2016, 95, 51–67. [Google Scholar] [CrossRef]
  48. Trojovská, E.; Dehghani, M.; Trojovský, P. Zebra Optimization Algorithm: A New Bio-Inspired Optimization Algorithm for Solving Optimization Algorithm. IEEE Access 2022, 10, 49445–49473. [Google Scholar] [CrossRef]
  49. Meng, X.; Gao, X.; Lu, L.; Liu, Y.; Zhang, H. A new bio-inspired optimisation algorithm: Bird Swarm Algorithm. J. Exp. Theor. Artif. Intell. 2016, 28, 673–687. [Google Scholar] [CrossRef]
  50. Chopra, N.; Mohsin Ansari, M. Golden jackal optimization: A novel nature-inspired optimizer for engineering applications. Expert Syst. Appl. 2022, 198, 116924. [Google Scholar] [CrossRef]
  51. Seyyedabbasi, A.; Kiani, F. Sand Cat swarm optimization: A nature-inspired algorithm to solve global optimization problems. Eng. Comput. 2023, 39, 2627–2651. [Google Scholar] [CrossRef]
Figure 1. The hybrid power system architecture of high-speed railways.
Applsci 15 08462 g001
Figure 2. The high-speed rail route map and the solar radiation diagram for the case.
Applsci 15 08462 g002
Figure 3. The PV power generations at 13 stations along the high-speed railway route.
Applsci 15 08462 g003
Figure 4. Load of a round trip of a high-speed train.
Applsci 15 08462 g004
Figure 5. The flowchart of the optimization algorithm.
Applsci 15 08462 g005
Figure 6. The comparative graph of algorithm iteration results.
Applsci 15 08462 g006
Figure 7. The winter energy interaction diagram.
Applsci 15 08462 g007
Figure 8. The summer energy interaction diagram.
Applsci 15 08462 g008
Table 1. The data information of the PV equipment used in this experiment and lists the relevant parameters of LiFePO4 battery.
PV lifetimeefficiencycost of investmentcost of replacement
20 years0.25USD 876/kWUSD 676/kW
Battery lifetimech/dis efficiencycost of investmentcost of replacement
5 years0.9/1.0USD 600/kWhUSD 600/kWh
Table 2. Component ablation effects on EDMOA performance.
Chaotic Mapping-DrivenTrust-RegionElite-GuidedFitness
236,102
235,949
235,760
Table 3. Net present cost in 3 cases in the first year.
Case 1Case 2Case 3
PV size (m2)020002000
ESS capacity (kwh)0460408
ESS power (kw)014301498
Total NPC (USD)3,864,8523,196,5582,941,700
Grid cost (USD)3,864,8522,909,9832,909,157
PV installation cost (USD)089,28189,281
PV replacement cost (USD)068,89868,898
ESS installation cost (USD)064,19856,940
ESS replacement cost (USD)064,19856,940
Carbon emission cost (USD)00159,413
Carbon transaction cost (USD)00119,109
Carbon incentivization (USD)001579
Carbon penalty cost (USD)0062,968
REC revenue (USD)00579,427
Table 4. Carbon emission in 3 cases in the first year.
Case 1Case 2Case 3
Total CO2 emission (kg)2,886,213.12,194,300.62,192,760.6
Grid CO2 emission (kg)2,886,213.12,173,131.32,172,514.5
PV CO2 emission (kg)013,000.013,000.0
ESS CO2 emission (kg)08169.67246.1
Disclaimer/Publisher’s Note: The statements, opinions and data contained in all publications are solely those of the individual author(s) and contributor(s) and not of MDPI and/or the editor(s). MDPI and/or the editor(s) disclaim responsibility for any injury to people or property resulting from any ideas, methods, instructions or products referred to in the content.

