Abstract
This study proposes a computational framework that transforms eye-tracking analysis from statistical description to cognitive structure modeling, aiming to reveal the organizational features embedded in the viewing process. Using the designers’ observation of a traditional Chinese landscape painting as an example, the study draws on the goal-oriented nature of design thinking to suggest that such visual exploration may exhibit latent structural tendencies, reflected in patterns of fixation and transition. Rather than focusing on traditional fixation hotspots, our four-dimensional framework (Region, Relation, Weight, Time) treats viewing behavior as structured cognitive networks. To operationalize this framework, we developed a data-driven computational approach that integrates fixation coordinate transformation, K-means clustering, extremum point detection, and linear interpolation. These techniques identify regions of concentrated visual attention and define their spatial boundaries, allowing for the modeling of inter-regional relationships and cognitive organization among visual areas. An adaptive buffer zone method is further employed to quantify the strength of connections between regions and to delineate potential visual nodes and transition pathways. Three design-trained participants were invited to observe the same painting while performing a think-aloud task, with one participant selected for the detailed demonstration of the analytical process. The framework’s applicability across different viewers was validated through consistent structural patterns observed across all three participants, while simultaneously revealing individual differences in their visual exploration strategies. These findings demonstrate that the proposed framework provides a replicable and generalizable method for systematically analyzing viewing behavior across individuals, enabling rapid identification of both common patterns and individual differences in visual exploration. This approach opens new possibilities for discovering structural organization within visual exploration data and analyzing goal-directed viewing behaviors. Although this study focuses on method demonstration, it proposes a preliminary hypothesis that designers’ gaze structures are significantly more clustered and hierarchically organized than those of novices, providing a foundation for future confirmatory testing.
1. Introduction
1.1. Research Background
In the context of both design practice and education, design thinking is not grounded in a single theoretical model. Rather, it is characterized as a cognitive process driven by problem framing and combining problem-solving, logical reasoning, and relational construction [1,2]. Designers often develop problem definitions and potential solutions simultaneously, advancing their thinking through compositional operations between form and meaning [3]. This mode of thinking emphasizes the construction of meaning and strategy generation in complex situations, rather than relying on pre-defined solutions [4]. As such, design activity tends to be highly operational and iterative. Designers frequently make decisions amid uncertainty, structure ideas within ambiguity, and continuously adjust between form and function to produce flexible and viable visual outcomes [1,3]. These cognitive traits have been widely applied in design education and creativity training, and are regarded as key to fostering problem reframing and cross-domain thinking [5]. In design education, viewing is also considered a foundational capability. Students are often encouraged to observe “good” or “beautiful” works, developing sensitivity to form, composition, and visual language through repeated exposure and comparison. Over time, this training becomes internalized as an intentional strategy of visual understanding and exploration. When engaging with images, designers tend to organize and construct visual information in a goal-oriented manner. Their viewing processes may not be random but instead reflect a continuing sensitivity to spatial logic, compositional order, and problem structure rooted in design thinking. It is therefore reasonable to assume that the designers’ viewing behavior may not be arbitrary but rather shaped by an underlying structure and exploratory logic. Such structure may be reflected in patterns of fixation distribution, the sequence of region-to-region transitions, and the temporal dynamics of attentional focus. Viewing behavior is an active process that integrates perceptual input, selective attention, and cognitive construction, and has long been a central topic in visual cognition and eye-tracking research [6,7]. This process involves not only the reception of external visual stimuli but also reveals how observers actively select, organize, and interpret information based on task goals and contextual demands. Patterns of eye movements and fixations not only reflect how observers process visual input, but also reveal underlying cognitive strategies and exploration structures [8,9]. By analyzing eye-tracking data, researchers can examine how individuals plan visual actions, prioritize information, and incrementally build understanding of visual environments or images under different conditions [10,11]. Although eye-tracking has been widely applied in areas such as reading [10], medical diagnosis [12], and scene perception [13], existing analyses often focus on statistical measures such as fixation locations and saccade lengths. Less attention has been paid to the higher-level structures or latent relational patterns embedded within the viewing process, which remain in need of more integrated modeling and descriptive strategies [14]. In fact, viewing behavior often involves subtler and less directly observable patterns—such as non-linear transitions between fixation areas (cyclical movements involving exploration, transition, and reinspection rather than sequential scanning), return paths, and stage-specific shifts in attentional focus [11,15,16]. Developing integrative and computational approaches for capturing such patterns would contribute to a deeper understanding of the cognitive structures and operational mechanisms underlying visual exploration. Building on these theoretical foundations, this study focuses on the viewing behavior of designers in an art appreciation context, particularly their visual exploration while observing traditional Chinese landscape paintings. To reveal the structural tendencies embedded in their gaze patterns, we propose a data-driven analytical framework that computationally models the strength of relationships between fixation regions, the distribution of visual attention, and the temporal dynamics of the viewing process. Before detailing the methodology, we first clarify the visual mechanisms and task characteristics associated with viewing behavior, establishing the theoretical basis for our analytical approach.
1.2. Visual Mechanisms and Task Characteristics of Viewing Behavior
To understand the cognitive basis of our computational approach, we first examine the fundamental mechanisms underlying viewing behavior. Viewing behavior is generally driven by two primary mechanisms: the selection of information and the guidance of spatial exploration. Selection refers to how observers filter specific visual information, while guidance pertains to planning movements toward visual targets [7,17,18]. Building on these foundational mechanisms, visual attention research focuses on how individuals selectively process stimuli [17,19], whereas visual search research emphasizes how task-relevant features dynamically guide attention shifts under goal-oriented conditions [18,20]. In visual attention research, top-down (goal-directed) and bottom-up (stimulus-driven) processes are recognized as two primary modes of guidance. Top-down processes originate from the observer’s task goals, prior knowledge, and working memory, emphasizing intentional control over eye movements [17,21]. Such goal-centered guidance is typically observed in tasks with explicit goals, such as reading and specific diagnostic tasks; whereas in art appreciation, top-down exploration tends to emerge primarily under instructed or goal-directed conditions [6,22]. In contrast, bottom-up processes are driven by salient visual features (e.g., color, brightness, contrast, edges, motion), rapidly attracting attention in free-viewing situations without explicit goals [23,24]. While these mechanisms operate through different pathways, they are not mutually exclusive but dynamically interact during naturalistic viewing. Neurocognitive and experimental studies have shown that initial fixations may be influenced by bottom-up salience, but subsequent gaze distributions are rapidly modulated by top-down control based on task demands and feature goals [7,25,26]. Moreover, beyond task settings, an observer’s understanding of scene semantics, prior knowledge, and anticipated goals can modulate the selection of visual search strategies and exploration patterns [8,11]. While both top-down and bottom-up processes dynamically interact during naturalistic viewing, the dominant mechanism often varies depending on task characteristics. For instance, bottom-up salience tends to govern attention in free-viewing or vigilance tasks, whereas goal-driven exploration, semantic interpretation, and evaluative judgment typically engage stronger top-down control. This distinction becomes particularly salient in tasks that involve verbalization or meaning-making, such as art commentary or reflective viewing, where higher-order cognitive resources are mobilized to guide visual selection. Based on this theoretical perspective, the present study focuses specifically on top-down modulated visual exploration and its underlying structural characteristics. In goal-directed visual search tasks, observers dynamically adjust their gaze strategies according to task features, showing preferential fixations and strategic transitions between visual regions [27,28,29]. Recent studies further refine this understanding: Grüner et al. [30] demonstrated that top-down knowledge outweighs selection history when target features change; Dolci et al. [31] showed that top-down attention can suppress the influence of statistical learning during visual search, as revealed by EEG findings; and Rashal et al. [32] provided neurophysiological evidence that both task goals and stimulus salience jointly influence post-selection attentional responses. These findings strengthen the understanding of top-down and bottom-up interactions and support the structured nature of visual exploration under goal-oriented conditions [33].
Theoretical Rationale for Focusing on Designers
Applying this theoretical understanding to design contexts, the present study specifically examines the visual exploration behaviors of designers in the context of art appreciation. This focus on designers is theoretically motivated: design cognition research indicates that design activity is fundamentally an exploratory process centered around problem framing and compositional judgment [3]. Design thinking further embodies the ability to construct potential structures and solutions by integrating prior knowledge and contextual features [2]. Thus, when professionally trained designers engage with artworks, their visual search behaviors are influenced not only by salient perceptual features but also by implicit compositional principles, expressive strategies, and aesthetic objectives. This goal-centered exploratory behavior reflects a strong top-down modulation, resulting in structured, strategic, and conscious visual exploration patterns rather than random, stimulus-driven search behaviors. Based on this characteristic, this study employs young designers as participants to investigate the organizational structures and cognitive dynamics underlying goal-directed visual exploration. These theoretical foundations lead to our central hypothesis: designers’ professional training should manifest as detectable structural patterns in their viewing behavior. This hypothesis forms the basis for our computational framework presented in the following section.
1.3. The Conceptual Framework of the Viewing Process
Inspired by research in cognitive psychology and knowledge representation [34,35,36], we propose that the process of viewing may exhibit an inherent structural tendency. Observers are not passive recipients of visual stimuli. In goal-directed visual search, observers actively organize visual information based on scene content, task goals, and cognitive strategies, whereas in stimulus-driven exploration, attention is primarily guided by salient visual features without explicit cognitive control. This active structuring plays a crucial role in facilitating goal-oriented exploration patterns. Preliminary studies have explored this possibility—for instance, Kuan-Chen Chen [37] combined mobile eye-tracking with think-aloud data to align dispersed fixation points with semantic interpretation, visualizing three distinct viewing patterns. Importantly, this study was conducted with design students viewing artworks, where the viewing behavior was predominantly guided by top-down, goal-oriented design thinking processes rather than by purely bottom-up perceptual salience. Their findings suggest that, within this specific context, eye movement data can be sorted, classified, and potentially transformed into knowledge structures. Although many existing studies in the visualization literature continue to focus on fixation distributions or scan paths as statistical indicators, a growing number of investigations are beginning to explore the latent structure of gaze behavior from new perspectives—treating fixation data as analyzable, mappable knowledge units. Notably, other fields, such as medical image perception, have been exploring this potential since the 1970s. This perspective aligns with related research in data visualization and slow design, which also aims to translate sensory inputs into semantically structured information networks [35,36]. Such approaches resonate with the core philosophy of the knowledge representation field, wherein latent structural features embedded in the viewing process can be revealed and constructed through computational and visual means [14]. From this perspective, the act of viewing can be conceptualized as a form of knowledge representation, where individuals systematically select and organize visual information based on prior experience, perceptual processes, and task demands. This process reflects the active nature of human learning and understanding, as well as the structural characteristics of cognitive information processing. As an exploratory study, we propose a conceptual framework that characterizes viewing behavior through four analytical dimensions: the spatial clustering of fixations, the associative transitions between regions, the relative intensity of visual attention, and the evolving temporal dynamics of the viewing process. Rather than stemming from a single theoretical model, these dimensions are derived from common patterns observed across various task contexts and serve as the foundation for our operational definitions and subsequent algorithmic modeling. Together, they reflect the organizational strategies and attentional structures frequently exhibited in visual exploration and demonstrate potential for computational translation.
1.3.1. Fixation Regions
The clustering behavior of fixation points can be regarded as structured spatial units that reflect cognitive organization rather than simple statistical aggregations. While traditional approaches merely identify visual hotspots based on fixation density, this study treats clustered fixations as meaningful perceptual regions that reveal the viewer’s systematic segmentation of visual content. Hahn and Klein [38] and Schütt et al. [28] utilized eye-tracking and clustering techniques to analyze how observers coordinate multiple representations and apply top-down strategies in complex visual tasks, revealing that visual features and cognitive goals jointly guide fixation clustering. Building on these findings, Santella & DeCarlo [39], analyzed eye-tracking data to identify Areas of Interest, supporting the notion that fixation points tend to aggregate within specific regions; importantly, these regions tend to emerge within each observer, though their exact locations may differ across individuals due to individual goals, strategies, and interpretations. Numerous studies have further demonstrated a high degree of consistency between fixation clustering patterns and the spatial distribution of visual attention [11,40,41]. To capture this spatial structure of attentional aggregation, this study adopts fixations as the fundamental unit for structured analysis, treating these regions as cognitively meaningful spatial units rather than statistical clusters. Fixations, defined as eye movement pauses with spatial stability and temporal continuity, represent regions where observers engage in perceptual and cognitive processing within a visual field. This research focuses on the spatial patterns formed by clusters of fixations, using them as representations of attention distribution and as a foundational component for developing a structured analytical framework for visual behavior that reveals the organizational logic underlying visual exploration.
1.3.2. Regional Associations
When an observer’s gaze shifts between different visual regions, specific associations are formed along the gaze path that constitute structured relationship networks rather than simple sequential movements. Moving beyond conventional scanpath analysis that merely tracks eye movement sequences, our approach quantifies the associative strength between visual regions to reveal the underlying organizational logic of visual exploration. These transitions are not random wanderings; in goal-directed (top-down) visual search, they are shaped by task goals, semantic content, and prior fixation history, resulting in structured and predictable patterns of movement, whereas in stimulus-driven (bottom-up) exploration, they are primarily guided by salient visual features without explicit cognitive control [41,42,43]. In the context of art appreciation, Locher [44] observed that viewers may strategically alternate their gaze between key areas within a work, forming individually repeated and deliberate visual paths that reflect their unique goals, interpretations, and interactions with the artwork. Onuchin and Kachan [45] used topological analysis of eye movement trajectories to reveal differences in individual visual exploration styles, while Marin and Leder [46] found that gaze patterns during art viewing systematically vary with levels of aesthetic engagement. Similarly, Ishiguro et al. [47] demonstrated that educational interventions, such as a photo creation course, can significantly influence students’ viewing strategies. Their study showed that post-intervention, students engaged in more active perceptual exploration and exhibited increased global saccades, indicating a shift toward more deliberate and informed visual analysis. Building on these findings, this study introduces “relation” as the second analytical dimension of structured viewing behavior, used to characterize the transitions and linkages between visual regions during the viewing process. This represents a fundamental shift from describing “where” viewers look to understanding “how” visual regions interconnect in cognitive space. By analyzing fixation movements across regions, this structural layer offers new possibilities for the computational modeling of interregional relationships that capture the relational architecture of visual attention.
1.3.3. Weights
The concept of “weight” reflects how visual attention is distributed and concentrated across different regions. In this study, weight is operationally defined as the number of fixation points falling within each visual region, which is then used to calculate the relative proportion of attention during the overall viewing process. This spatially based approach highlights how attentional resources are distributed among different areas, without assuming a direct relationship with cognitive load or task difficulty. Locher [22] noted that observers often form an initial holistic impression of an artwork and then direct their attention toward specific regions for deeper exploration. Fixation duration and location are related to task-specific processing strategies, indicating that the spatial distribution of gaze reflects the viewer’s intentions and interpretive focus, e.g., Schwetlick et al. [48] and Vasilyev [49]. These studies suggest that the visual field is not processed evenly; rather, some areas receive greater attentional emphasis due to their visual saliency or perceived informational value. Based on this perspective, this study calculates weight through the count of fixation points per region, providing a structured representation of how attention is distributed spatially. Unlike conventional heat maps that simply show fixation density, our weight-based approach distinguishes between central focal areas and transitional nodes, revealing the hierarchical organization underlying visual attention. This measure serves as a foundation for subsequent spatial analysis and the modeling of interregional relationships that illuminate the cognitive architecture of structured viewing.
1.3.4. Temporal Dynamics
Temporal information not only reflects the dynamic nature of viewing behavior but also reveals the evolution of cognitive strategies over time, enabling us to capture how viewing structures emerge, develop, and transform throughout the exploration process. König et al. [50] argued that although models based on retinal topography can explain the selection of many fixation points, they often neglect the temporal and sequential aspects of eye movement patterns. Land [51] further emphasized that understanding the temporal order of gaze behavior is essential for interpreting visual exploration strategies. Similarly, Tatler et al. [11] demonstrated that in naturalistic viewing environments, saliency alone does not determine gaze behavior; rather, gaze patterns emerge from the interaction of stimulus-driven saliency and observer-driven goals, shaped by time-dependent behavioral dynamics. These findings suggest that analyzing the temporal dynamics of gaze can complement structural analysis by illustrating how attention shifts and cognitive focus evolve during the viewing process, while also revealing how temporal changes interact with other dimensions—such as regional association and attentional weight—to form coherent visual strategies that support the real-time construction of visual understanding. Although their study focused on naturalistic scenes, this broader insight into the dynamic interaction of bottom-up and top-down influences offers a conceptual foundation for analyzing temporal gaze patterns even in static image viewing. Rather than treating time as a simple sequential variable, our framework integrates temporal sequencing with spatial structure to reveal the evolutionary dynamics of cognitive organization.
Based on this four-dimensional theoretical framework, this study develops a computational approach to reveal the structural organization of visual exploration in design contexts. Through the proposed analytical dimensions—spatial clustering, associative relations, attentional weights, and temporal dynamics—we aim to demonstrate that the designers’ viewing behavior exhibits systematic organizational patterns that can be computationally modeled and visualized. This framework moves beyond traditional statistical measures to provide new insights into the cognitive mechanisms underlying professional visual expertise, offering a foundation for understanding how design thinking manifests in structured viewing behaviors.
1.3.5. Summary and Hypothesis
In summary, the present framework characterizes viewing behavior through four analytical dimensions—region, relation, weight, and time—derived from common patterns of goal-directed exploration. This framework is grounded in the hypothesis that design-trained viewers exhibit non-random, clustered, and temporally organized gaze behaviors, which can be systematically revealed and modeled through the proposed computational method. This hypothesis provides a basis for future confirmatory testing beyond the present exploratory demonstration.
The remainder of this paper is structured as follows. Section 2 provides a detailed exploration of the computational methods and algorithmic design for these four dimensions. Section 3 describes the implementation process, and Section 4 presents the experimental results. Section 5 presents an exploration of the research findings and future directions.
2. Literature Review
Transforming viewing behavior into a computable form not only enables a systematic understanding of the viewing process but also facilitates the quantification of visual behavior analysis. In this study, a literature review was conducted on the computational aspects of four core dimensions: clustering analysis for identifying fixation regions, associations between visual regions, representations of attention intensity, and the dynamic characteristics of temporal variations. These dimensions together establish the foundation for the computation of the viewing process.
2.1. Research Progress in Fixation Point Coordinate Transformation
Coordinate transformation is a key aspect of eye-tracking research, ensuring that fixation points accurately correspond to viewing content. However, balancing geometric accuracy, stability, and computational efficiency remains a major challenge. Geometric Projection-Based Methods were among the earliest widely adopted techniques, with their core principle being the construction of a geometric relationship between the eyeball, camera, and screen perspectives to maintain high-accuracy fixation estimation. Guestrin and Eizenman [52] established a projection model that allows stable remote fixation estimation in fixed scenarios, permitting a certain degree of head movement. However, this method is highly dependent on hardware calibration, and estimation accuracy significantly declines when participants move beyond the calibration range [53]. To reduce hardware dependency, Homography Matrix-Based Methods were introduced to address multi-view and geometric distortions through mathematical models [53]. This method calculates the mapping relationship between fixation points using 2D planar homography, improving its adaptability and making it applicable to scenarios with different viewing angles. Although this approach achieves high experimental accuracy (within 0.6°) and greater stability, its reliance on homography transformations and matrix operations may impose computational burdens in real-time applications. Additionally, in dynamic scenarios, head movements and environmental changes may affect its stability [54]. With advancements in image processing technology, researchers have explored Feature-Based Mapping Methods that do not require geometric modeling. Lowe [55] proposed the Scale-Invariant Feature Transform (SIFT), which establishes coordinate correspondence through image feature point matching, eliminating the need for traditional hardware-dependent approaches. However, SIFT is susceptible to lighting changes, occlusions, and the depth of field in dynamic scenes, leading to decreased matching stability [56]. Additionally, its high computational cost limits its feasibility for real-time applications [57]. Considering the developments in these methods, current coordinate transformation techniques still involve trade-offs among geometric modeling accuracy, head movement adaptability, dynamic scene stability, and computational efficiency. On this basis, a geometric point–line distance calculation approach is adopted in this study, and the coordinate transformation mechanism is optimized to reduce hardware calibration dependence while enhancing computational efficiency, providing a more flexible solution for eye-tracking research. In the context of visual cognition, the spatial accuracy of fixation coordinates is fundamental to reconstructing attentional patterns and viewing strategies. A precise transformation mechanism preserves the spatial and temporal coherence of gaze behavior, which is critical for interpreting how attention is distributed and how visual transitions occur across regions of interest. Conversely, mapping inaccuracies can disrupt the inferred structure of visual exploration and diminish the reliability of subsequent cognitive interpretations.
2.2. Comparison of Clustering Analysis Methods
Fixation clustering analysis is a common technique used to explore visual attention patterns and their distribution characteristics [58]. From a cognitive perspective, the spatial clustering of fixations reflects the viewer’s preferential allocation of attention and task-driven visual strategies. According to selective attention theory, gaze behavior is not random but guided by cognitive relevance, making clustered fixations indicative of perceptual salience and goal-oriented processing [17]. Clustering methods thus offer an analytical window into how viewers segment scenes into meaningful units based on internal cognitive priorities. In current research, three main methods are employed to process fixation data: Density-Based Spatial Clustering of Applications with Noise (DBSCAN), Hierarchical Clustering, and K-means algorithms. DBSCAN is a density-based clustering method that does not require predefining the number of clusters and adapts well to irregularly distributed data [59]. However, studies indicate that when datasets contain regions of varying density, their stability may be compromised, making it difficult to ensure consistent results in all scenarios [60]. Hierarchical Clustering constructs a hierarchical tree structure to represent relationships between data points, allowing for more detailed cluster-level information [61]. This method enables researchers to observe clustering patterns at different levels, making it particularly suitable for interpretive analysis and visualization. However, due to its iterative computation requirements, it has a relatively high computational cost when processing large-scale data, limiting its suitability for real-time applications. K-means algorithms are widely used in fixation clustering analysis due to their computational efficiency and interpretability [58]. The K-means++ algorithm improves the selection of initial centroids, enhancing stability [62]. Compared to other methods, K-means generates clustering results more quickly, and its straightforward interpretability makes it highly advantageous for real-time analysis [63]. Empirical studies show that K-means performs consistently in fixation data analysis and provides easily interpretable visual results.
2.3. Extremum Point Methods and Their Applications
Extremum Points (EPs), defined as the extreme coordinate positions in a data distribution (e.g., x_min, x_max, y_min, y_max), are widely used in visual data analysis, particularly in geometric feature extraction, visual region segmentation, and spatial boundary modeling. They provide an efficient and intuitive way of representing data. The core concept involves identifying extreme positions in the data distribution (e.g., x_min, x_max, y_min, y_max) to construct range-defining models in a simple manner, without relying on computationally expensive regression or density estimation techniques. They provide an efficient and intuitive way of representing data. The core concept involves identifying extreme positions in the data distribution (e.g., x_min, x_max, y_min, y_max) to construct range-defining models in a simple manner, without relying on computationally expensive regression or density estimation techniques. In the field of geometric feature extraction, Cuong and Hoang [64] utilized a dynamic threshold binarization technique combined with extremum point detection at the eye corners to improve the accuracy of eye-tracking localization. Ince and Yang [65] applied blob extraction techniques and extremum point algorithms to achieve sub-pixel-level eye localization at a low computational cost. These studies demonstrate that extremum point techniques effectively assist in the geometric representation of visual data while reducing computational costs. In the field of spatial boundary modeling, Becker and Fuchs [66] revealed the dynamic characteristics of eye movement, showing that the boundaries of visual regions can be modeled through the distribution of specific point sets. Kasprowski et al. [67] compared various boundary estimation techniques and found that high-order regression models (e.g., quadratic polynomial regression and support vector regression) could describe visual boundaries with higher accuracy. However, these methods are often computationally intensive and less suitable for real-time applications. Additionally, Ince and Yang [65] demonstrated that by integrating OpenCV’s blob detection with geometric extremum point methods, an efficient eye movement range model can be constructed while significantly reducing computational resource requirements. Overall, extremum point methods exhibit potential advantages in visual data analysis due to their low computational cost and high intuitiveness. Although previous research has rarely employed the extremum point method as the core method for visual region modeling, their application in geometric feature extraction and boundary estimation provides a feasible foundation for future studies. From a perceptual standpoint, the construction of spatial boundaries around fixation clusters parallels the cognitive process of defining meaningful perceptual units. According to Palmer [68], human visual perception organizes input into structured regions based on boundary cues and spatial coherence. By modeling visual boundaries through extremum-based envelopes, the method preserves not only the geometric footprint of gaze concentration, but also reveals how viewers segment and interpret scenes into cognitively coherent regions.
2.4. Boundary Construction and Linear Interpolation
Accurately defining fixation boundaries is crucial for understanding users’ visual behavior in eye-tracking technology. From a cognitive standpoint, fixation boundaries can be interpreted as externalized representations of perceptual grouping, reflecting how viewers segment scenes into meaningful spatial units. As Palmer [68] suggests, the human visual system uses boundary cues to organize visual input into coherent structures, which facilitates higher-level interpretation and learning. Ensuring boundary continuity and precision is, therefore, essential, not only for computational stability, but also for preserving the integrity of spatial perception and attentional organization. While traditional fixation boundary methods rely on discrete sampling points to represent fixation locations, they often fail to capture spatial smoothness and local continuity within fixation distributions, which may affect the geometric stability of boundary construction [69]. Regarding boundary construction, Morimoto and Mimica [70] first proposed a linear interpolation-based boundary construction method, which connects adjacent sampling points to form enclosed fixation regions. While this method is computationally simple, it overlooks the curvature characteristics of eye movement trajectories, potentially leading to inaccurate boundary fitting. To improve boundary-fitting accuracy, Hansen et al. [71] introduced a polynomial interpolation method using quadratic polynomials to describe trajectories between sampling points more precisely, thereby significantly enhancing boundary construction accuracy. However, polynomial interpolation may lead to overfitting issues, especially when data points are unevenly distributed. To address this, Narcizo et al. [72] proposed a technique that combines linear interpolation with local optimization to mitigate the problem of overly large boundaries caused by traditional convex hull algorithms. In high-precision ranges (−0.5° to 0.5°), this method achieved an accuracy rate of 60–99%. However, it may still produce discontinuities in boundary fitting when handling rapid eye movements. To tackle the issues of boundary continuity and accuracy, Das et al. [73] introduced piecewise linear interpolation, applying local smoothing constraints to optimize boundary shapes. Hecht et al. [74] further extended this approach to adaptive interpolation techniques, dynamically adjusting interpolation parameters based on sampling point density to accommodate eye movement trajectories at varying speeds. Additionally, Borji and Itti [75] proposed a real-time algorithm based on local linear interpolation, significantly improving processing efficiency through parallel computation. However, Tractinsky [76] pointed out that balancing real-time performance and accuracy remains a challenge, particularly in high-frequency eye movement data processing, where boundary update latency is an unresolved issue. It is worth noting that most of the above methods rely on a single interpolation function for boundary calculations. Recent studies by Martinez-Marquez et al. [77] and Krassanakis and Cybulski [78] have proposed multi-function or hybrid interpolation strategies to enhance computational accuracy and robustness in boundary construction. In this study, we propose a novel approach using two complementary functions (LimitX and LimitY) to calculate specific positions on the boundary. This method enhances continuity and numerical robustness in cases with irregular fixation distributions, aligning with recent advances in hybrid interpolation strategies for boundary modeling [79]. Although most modern eye-tracking systems include algorithms to handle common artifacts such as blinks, traditional modeling approaches often do not explicitly account for residual calibration errors or transient drifts, which may still impact boundary accuracy [80,81]. Narcizo et al. [72] highlighted that invalid data points (e.g., zero-coordinate points) may distort boundary shapes, leading to erroneous visual envelopes. Against this backdrop, this study proposes a linear interpolation method based on extremum points to address the accuracy and stability issues in boundary fitting. By employing two complementary functions (LimitX and LimitY) to calculate precise positions on the boundary, this approach enhances boundary construction reliability. Furthermore, this method automatically filters out invalid data points caused by instrument errors or blinking events, ensuring the robustness of analytical results. These improvements not only simplify the analysis of large-scale fixation data but also provide more precise technical support for subsequent quantitative spatial analyses.
2.5. Relationship Strength Quantification Methods
In eye-tracking research, quantifying the relationships between Areas of Interest (AOIs) is essential for understanding users’ visual behavior. With advancements in research, effectively handling AOI transition regions and accurately quantifying relationship strength have become critical issues in static scene analysis. Early studies primarily quantified relationship strength based on the distance between AOIs or the frequency of fixation point transitions. For example, Kang et al. [82] proposed the Area Gap Tolerance (AGT) method, which evaluates the association between AOIs by setting a fixed tolerance range. Although this method is intuitive, it struggles to accurately capture transitional relationships between AOIs in dense AOI distributions or complex visual scenes. Additionally, it does not account for the dynamic distribution of visual attention, and thus, potentially overlooks subtle visual flow patterns between AOIs. Kübler et al. [83] introduced an analysis framework based on a buffering mechanism, specifically addressing the handling of overlapping AOI regions. They found that adaptive buffer zones enhance AOI relationship identification. However, this method faces computational efficiency challenges, particularly when processing large-scale data, as buffer zone settings may increase computational costs. Therefore, improving computational efficiency while maintaining accuracy remains a key research challenge. Loyola and Velásquez [84] introduced a graph-based analytical framework, treating AOIs as nodes and measuring relationship strength through fixation transition frequencies. While this method captures the flow patterns of visual attention, it focuses on node connections and does not directly consider the spatial distribution of AOIs. Instead of a graph-based method, Rim et al. [85] proposed the Point-of-Interest (POI) approach, which describes visual attention distribution using a gradual transition method, overcoming the rigid boundary constraints of traditional AOI methods. However, when fixation point distributions are scattered, this method may fail to accurately capture visual attention flow relationships. Regarding the representation of relationship strength, Constantinides et al. [86] explored the distribution characteristics of visual attention from a statistical modeling perspective and used numerical calculations to estimate relationship strength. However, they did not provide an intuitive visualization tool to illustrate the strength of relationships between AOIs, making it challenging to interpret results in applied contexts. Although these studies provide an important foundation for AOI analysis, several key challenges remain in relationship strength quantification, including how to adaptively adjust the analysis range based on different stimulus scenes, how to integrate spatial and temporal dimensions into relationship strength representations, and how to provide more intuitive visual representations. Particularly in dynamic scenes, accurately capturing the flow of visual attention between AOIs while considering the influence of temporal variations remains a pressing issue. From a cognitive perspective, the visual connections between AOIs reflect more than spatial adjacency or transition frequency—they represent the viewer’s exploratory strategies and the internal structure of attentional shifts. According to Alexander, Nahvi, and Zelinsky [87], the precision of guiding features plays a central role in visual search by shaping saccadic targeting and influencing the allocation of attention. By quantifying these inter-AOI relationships, researchers can infer how viewers navigate scenes, prioritize diagnostic information, and construct task-relevant visual pathways. To address these challenges, this study focuses not only on the fixation characteristics of individual AOIs but also on the visual relationship strength between AOIs. We propose an adaptive buffer zone analysis method, which quantifies relationships by computing the visual connection strength between AOIs. Although this method involves additional computational cost, as noted earlier, it was selected for its ability to more precisely capture spatial transitions between AOIs. The data scale in this study remains manageable, and the accuracy of spatial modeling was prioritized. This method does not alter the original AOI boundaries but instead identifies visual attention flow trends through inter-block connection patterns. Additionally, by mapping relationship strength using line width, the visual attention flow patterns become more intuitively visible. The next chapter details the computational process and application examples of this method.
3. Research Design
3.1. Proposed Algorithm
3.1.1. Fixation Point Coordinate Transformation Method
This study proposes a fixation point coordinate transformation method based on geometry, which relies on calculating the shortest distance between a point and a line segment while incorporating the precise derivation of vertical projection point positions. This method can handle various image transformation scenarios, including rotation, scaling, and perspective distortion, as illustrated in the coordinate transformation process shown in Figure 1b, while ensuring computational accuracy and flexibility. The following section provides a detailed description of the design and computational process of this method.
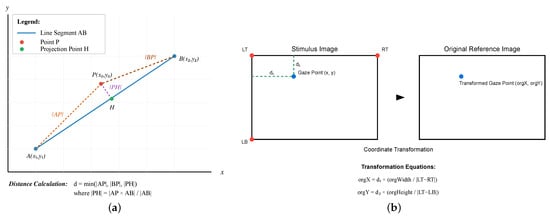
Figure 1.
(a) An illustration of distance calculation from a point to a line segment. (b) An illustration of fixation point coordinate transformation.
3.1.2. Calculation of the Shortest Distance from a Point to a Line Segment
To determine the position of a fixation point within the stimulus image (i.e., the visual content presented to the participant), it is first necessary to calculate its distance from the image boundary. In this study, the term “reference image” refers to the same stimulus image used in the eye-tracking experiment, which serves as the coordinate basis for fixation localization and transformation.
Let P(x0, y0) be the fixation point in the image, as shown in Figure 1a. The shortest distance d from P to the line segment AB can be determined according to the following three possible cases:
- The distance between point P and endpoint A, |AP|;
- The distance between point P and endpoint B, |BP|;
- The distance between projection point H of P on AB and P, |PH|.
If the projection point H of P lies on the line segment , the shortest distance is , which can be calculated using the following formula:
(where × represents the vector cross-product). If H does not lie on , then the shortest distance d is the smaller value of or .
3.1.3. Coordinate Transformation Steps
As shown in Figure 1b, we need to calculate the distances between the fixation point and the left and top edges of the image, denoted by and , respectively. These two distances can be computed using the aforementioned method and are applicable to four different reference point combinations: LTRTLB, RTLBRB, LTLBRB, and LTRTRB. Each combination consists of three key boundary points from the stimulus image.
Figure 2 provides a practical demonstration of this transformation process, illustrating how fixation points are processed from raw eye-tracking data Figure 2a through the computational transformation Figure 2b to the final coordinate system representation Figure 2c.
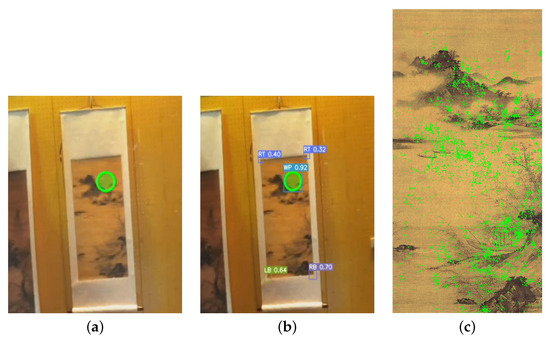
Figure 2.
(a) Eye-tracker fixation visualization. (b) Computation process after transformation. (c) Static representation of fixation points.
As an example, consider the LTRTLB (Left-Top, Right-Top, Left-Bottom) reference combination. Once the distances and have been determined, the fixation point can be mapped to the original image coordinate system using the following formula. To clarify these reference points, Table 1 defines their coordinates, and Figure 3 illustrates their positions.
where and represent the distances from the top-left corner of the stimulus image to the top-right and bottom-left corners, respectively.

Table 1.
Definition of reference points in the stimulus image.
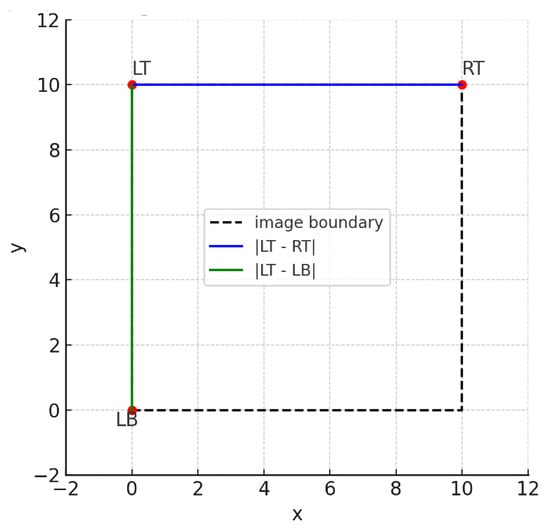
Figure 3.
Schematic diagram illustrating the positions of LT, RT, and LB, and the distances used in Equations (1) and (2).
3.1.4. Projection Point Calculation and Error Control
To ensure the precise localization of the projection point, this method calculates the equation of the line perpendicular to a given segment. If the slope of the segment is m, the perpendicular slope is given by .
Thus, the equation of the perpendicular line can be expressed as
3.2. Fixation Point Coordinate Transformation
The main advantage of this method lies in its high flexibility and adaptability, allowing it to handle various image transformations, including rotation, scaling, and perspective distortion. This not only improves the accuracy of eye-tracking data analysis but also provides greater flexibility in experimental design. To evaluate the accuracy of the proposed method, we conducted a comparative analysis with a standard homography-based transformation approach. Specifically, three representative video frames (frames 126, 350, and 2710) were selected from the experimental dataset, and both methods were applied to the same fixation point (1190, 865) for coordinate mapping. The resulting transformed coordinates revealed spatial deviations, calculated as Euclidean distances, of 130.9, 141.6, and 239.4 pixels, respectively. The root-mean-square error (RMSE) across the three frames was 177.45 pixels. Given the resolution of the reference image (10,000 × 10,000 pixels), this error accounts for less than 2% of the total image dimensions. Such precision is considered acceptable for visualization-based structural modeling and exploratory analysis in eye-tracking studies, especially in contexts where real-time performance and operational flexibility are prioritized over sub-pixel geometric accuracy. These results support the spatial consistency of the proposed method and confirm its applicability for analyzing gaze distributions across complex visual stimuli.
3.3. Spatial Analysis Framework for Visual Attention
In this study, a spatial analysis framework was constructed to segment fixation points into interpretable visual Areas of Interest (AOIs). We adopted a clustering-based approach to transform the continuous fixation distribution into discrete, structured regions, supporting subsequent structural analysis of visual attention. The selection of cluster numbers and validation methods are detailed in Section 3.3.1.
3.3.1. K-Means Clustering Implementation
This study employed the K-means clustering algorithm based on the scikit-learn library. The K-Means Fit function was defined to take two basic parameters: data ∈, representing the fixation point coordinates, and count ∈, specifying the desired number of clusters. The clustering process transforms the continuous distribution of fixation points into discrete clusters using the following model:
Each cluster denotes a focal region of visual attention. This discretization method allows precise control over granularity via the count parameter while providing more interpretable visual results.
To determine an appropriate number of clusters, we conducted multiple parameter tests and visually compared the clustering outcomes. The clustering results with different k values are illustrated in Figure 4, demonstrating the visual differences between under-segmentation (k = 3), optimal segmentation (k = 5), and over-segmentation (k = 8). As shown in Figure 4a (3 clusters), too few clusters tended to merge visually distinct regions, leading to under-segmentation and reduced interpretability. In Figure 4b (5 clusters) offered a more balanced representation, achieving a reasonable trade-off between structural coherence and visual clarity. In contrast, in Figure 4c (8 clusters) resulted in excessive fragmentation and structural noise due to over-segmentation. Based on this comparison, five clusters were selected for the current analysis.
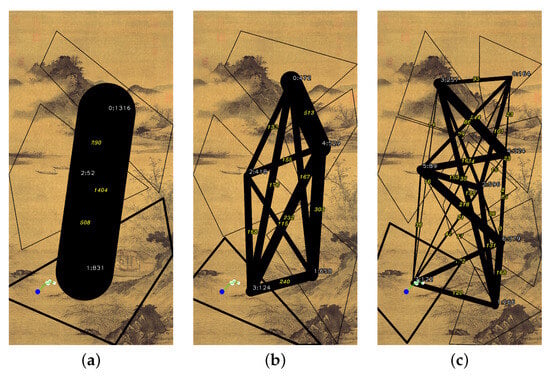
Figure 4.
Clustering results comparison with different k values: (a) k = 3 clusters (under-segmentation), (b) k = 5 clusters (optimal segmentation), (c) k = 8 clusters (over-segmentation).
The resulting clusters represent data-driven centers calculated by the K-means algorithm. In addition, while quantitative validation results presented in Table 2 and in Figure 5 showed that k = 2 achieved the highest silhouette coefficient (0.497) and k = 7 minimized WCSS (1609.02), these purely statistical indicators do not fully meet the semantic and interpretive requirements of this study. Clustering with k = 2 created overly broad regions that failed to separate meaningful visual elements, while k = 6 and k = 7 produced fragmented and hard-to-interpret micro-clusters despite their lower WCSS. Similarly, k = 3 and k = 4 partially improved semantic segmentation but still merged critical Areas of Interest, such as the boat with the riverside or the village with the distant mountain, which would compromise subsequent gaze–verbal alignment. Therefore, we selected k = 5 as the optimal balance. It maintained a reasonable silhouette score (0.432), achieved a substantial WCSS reduction, and preserved five semantically coherent and interpretable regions necessary for downstream structural modeling and multimodal analysis. This rationale demonstrates how domain-driven interpretability was carefully balanced with clustering performance metrics.

Table 2.
Silhouette coefficients and WCSS values for different cluster numbers (k = 2 to 7).

Figure 5.
Validation curves showing (a) silhouette coefficient and (b) within-cluster sum of squares (WCSS) across –7, supporting the trade-off choice of .
3.3.2. Extreme Point Algorithm
This study applies the Extremum Points (EPs) algorithm to construct geometric representations of fixation distributions for analyzing the spatial distribution characteristics of fixation points. The algorithm processes the classified set of fixation points , where , and identifies four key extremum points to construct boundaries:
3.3.3. Boundary Construction and Linear Interpolation
To accurately construct the boundary of the fixation envelope, this study proposes a position calculation method based on linear interpolation. This method determines precise boundary positions using two complementary functions, with its visual representation shown in Figure 6a–c. The process is based on the linear relationship between consecutive extremum points, using analytical geometry methods to derive exact coordinates.
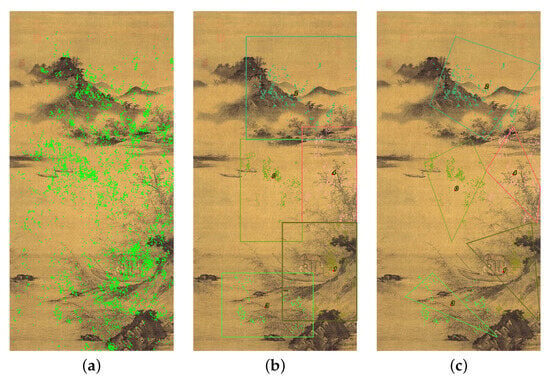
Figure 6.
K-means clustering analysis results: (a) Raw fixation point distribution, (b) Segmented visual regions with different colored boundaries for cluster differentiation, (c) Constructed fixation envelopes with cluster-specific boundary delineation. Different colors are used solely for visual distinction between cluster groups.
Given the linear relationship between two extremum points, the point position calculation is defined as follows:
where the LimitX function calculates the X-coordinate corresponding to a specific Y value:
where and .
Similarly, the LimitY function calculates the Y-coordinate corresponding to a specific X value:
where and .
Finally, the fixation envelope can be represented by the following closed polygon:
In Figure 7, the blue and orange polygons represent different categories of fixation envelopes, while extremum points (, , , ) are marked as red circles. This method not only simplifies the analysis of large-scale fixation data, but also provides a solid foundation for subsequent quantitative spatial analysis. The algorithm can automatically filter out invalid data points (e.g., zero-coordinate points) potentially caused by instrument errors or blink events, ensuring the reliability and stability of the analysis results.
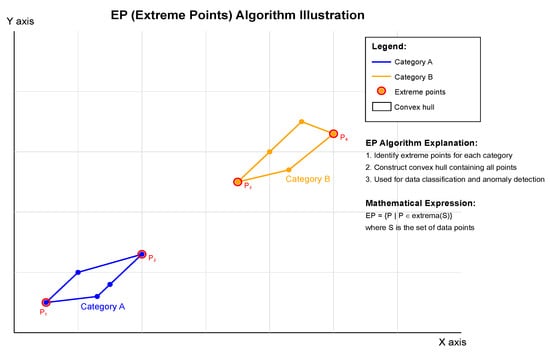
Figure 7.
Illustration of the extremum points classification algorithm.
3.3.4. Boundary Method Validation
To empirically validate the effectiveness and limitations of our AOI boundary definition approach, we conducted a comparative analysis between the Extremum Points (EPs) method and the Convex Hull (CH) method based on actual gaze data from the five AOI regions identified in our study.
Area Over-Coverage Quantification
The results show that the EP method consistently produces AOI boundaries that are approximately 33.3% larger in area than those produced by the CH method. This over-coverage is systematic and predictable across all five regions, as shown inTable 3.

Table 3.
Comparison of EP and CH boundary metrics for five AOI regions.
Such regularity suggests that the EP method introduces a conservative buffer zone rather than random distortion.
Relationship Strength Comparison
Despite the increased area, the EP-based boundaries preserve the core structure of inter-AOI visual relationships:
- The correlation between EP- and CH-based relationship strengths is .
- The top three strongest inter-AOI connections are identical across both methods.
- The average strength values using the EP method are approximately 18.5% higher, reflecting consistent, controlled inflation.
These findings confirm that while the EP method leads to conservative boundary definitions, it does not substantially alter the structural interpretation of the data.
Methodological Justification
The EP method was selected for its computational efficiency (4 vertices vs. 8 for CH on average), parameter-free operation, and reproducibility. Furthermore, in the context of design cognition, the over-coverage serves practical functions:
- It accommodates transitional fixations that cross AOI boundaries.
- It captures exploratory gaze patterns typical in aesthetic viewing.
- It maintains spatial coherence for visual network interpretation.
Although the EP method introduces systematic bias, its analytical impact is measurable and controllable. Future developments may include a hybrid boundary approach or adaptive method selection based on fixation density or task context.
3.4. Relationship Strength Quantification Methods
At this stage, a precise analysis of fixation point distribution among objects is conducted to effectively quantify the potential relationship strength between objects. This method consists of two main components: relationship strength calculation and visual representation.
3.4.1. Relationship Strength Function
The function is formally defined as follows. Let
be a function that computes the relationship strength between two Areas of Interest, defined by
where
- , are regions of interest with centroids ;
- is the set of fixation points;
- is the buffer zone width parameter;
- denotes the line segment connecting centroids and ;
- is the expanded buffer region centered on with width w.
The core implementation of this function consists of three main steps: buffer zone definition, fixation point counting, and strength quantification. First, the function defines an adaptive buffer zone with a width of one-tenth of the image size:
The algorithm iterates over all possible AOI center pairs and creates a connection line between each pair , extending it into a buffer zone. As shown by the red points in Figure 8, the system counts the number of fixation points that fall within the buffer zone as an indicator of relationship strength, while gray points represent fixation points outside the buffer zone that are not considered. This method not only accounts for the direct connection between AOI centers but also incorporates the surrounding distribution of visual attention, providing a more comprehensive evaluation of relationship strength.
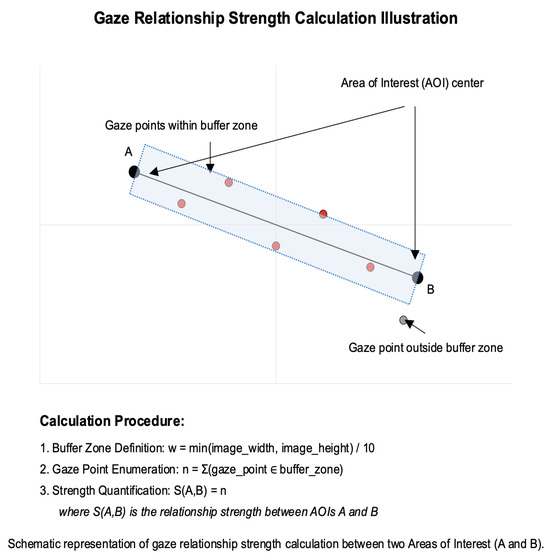
Figure 8.
Calculationof fixation relationship strength.
The calculation of relationship strength can be described by the following mathematical expression:
where is the relationship strength between AOIs i and j, G denotes the set of fixation points, and defines the expanded area centered on line segment with a width of w.
3.4.2. Visual Representation
The visualization module overlays a connection network on the original stimulus image to represent the relative strength between AOI pairs. The width of each connection line dynamically adjusts according to the normalized fixation count, with thicker lines indicating stronger connections and thinner lines representing weaker ones. The normalization is performed by dividing the fixation count between each AOI pair by the maximum fixation count observed across all pairs, yielding a value between 0 and 1. This approach ensures consistent visual scaling and facilitates the comparative interpretation of spatial relationships across regions.
This method was developed in this study to highlight the relative intensity of spatial co-occurrence, rather than to indicate directional gaze transitions or attentional shifts. Specifically, line width is mapped using the following function:
where s is the relationship strength value, and and are the boundary values of the strength range. This mapping ensures that the line width remains within a reasonable range of 0.5 to 5.0, providing good visual differentiation while maintaining overall visual harmony. The final visual representation is shown in Figure 9a–c.
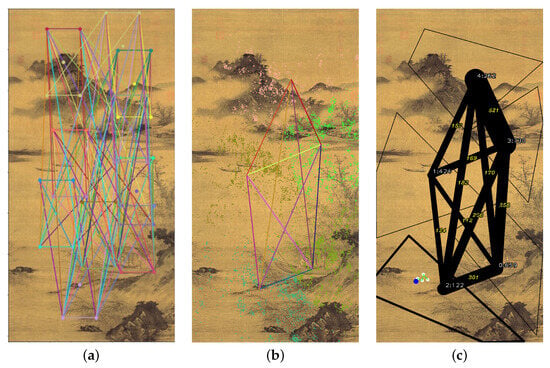
Figure 9.
(a) Distribution of fixation clusters. (b) Relationship pathways between AOI pairs. (c) Structural connection strength visualization. Different colors are used solely for visual distinction between connection lines.
4. Experimental Design
4.1. Experimental Process
This study was divided into two main phases: the first phase involved collecting data on the viewing process, while the second phase focused on the structured processing of eye-tracking data. In the first phase, we used an eye-tracker and the think-aloud method to record visual information generated during the viewing process. The second phase centered on the structured analysis of fixation point data. Initially, fixation points were converted into a structured data format. Then, the center points of each fixation block were linked to establish relationships between blocks. Additionally, fixation duration and fixation frequency were calculated to reflect the weight of fixation blocks and the strength of their connections.
As illustrated in Figure 10, the research process integrates both data collection and data structuring phases to comprehensively analyze viewing behavior. The following sections provide a detailed explanation of the experimental procedure for collecting viewing data and present relevant research findings.

Figure 10.
Visualization of viewing process information—visual selection.
4.2. Participants and Equipment
This experiment is based on the eye-tracking data of a single participant with normal vision, enabling a detailed dynamic analysis. While most eye-tracking studies tend to focus on group-level pattern analysis [88], an in-depth case study of an individual participant holds unique value during the methodological development phase. To strengthen the presentation of the proposed method and to examine its preliminary stability, two additional participants were included in the study, and their data were analyzed using the same computational process. All three participants were graduate students in design from National Yunlin University of Science and Technology, with backgrounds in visual literacy and an interest in art appreciation. The resulting visual structures are presented in Figure 11a–c. While some individual variations in gaze behavior were observed, the overall segmentation, connection layout, and fixation clustering patterns remained highly consistent, suggesting that the proposed framework is replicable and potentially extensible. In addition to eye-tracking data, think-aloud verbal utterances were collected throughout the viewing process. All twenty utterances were initially categorized according to a semantic classification framework developed in our prior study [37], which includes four types: evaluative judgment, spatial context, image–text interaction, and object recognition. Importantly, the selection of segments for detailed analysis was determined by a dual criterion: semantic relevance and noticeable gaze dynamics. Only segments that satisfied both conditions were included, resulting in eight key segments for integrative analysis. Notably, each utterance was temporally aligned with a specific segment of the eye-tracking data, allowing time to serve as the binding element connecting linguistic and visual streams. This temporal alignment ensured that the multimodal analysis was anchored in precise gaze–verbal correspondence. The study employs the ETVision eye-tracking system by Argus Science, a lightweight (56 g) wearable binocular tracking device that accommodates participants who wear glasses. ETVision features a high refresh rate of 180 Hz and a dual-eye accuracy of 0.5°, allowing for precise tracking of gaze movements. The system is equipped with a 720 p high-resolution scene camera and includes an automatic dual-eye orientation correction function. Additionally, the system supports single-point or multi-point calibration options, provides real-time left and right eye movement data visualization, and features network connectivity for external devices. These attributes collectively ensure both participant comfort and the reliability of the experimental data.
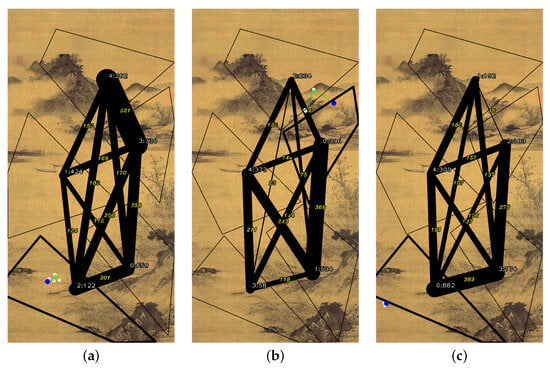
Figure 11.
(a) Distribution of fixation clusters. (b) Relationship pathways. (c) Structural connection strength.
Experimental Setting
Before the experiment began, the participant familiarized themselves with the display space and experimental procedures. The wireless eye-tracking device was then worn, and ETVision was activated to capture binocular pupil images. Chinese landscape paintings were selected as the viewing material in this study due to their unique artistic expression, which elicits rich visual exploration behaviors [37]. Compared to Western artworks, Chinese landscape paintings adopt a more scattered perspective and layered spatial composition, which guide viewers to generate diverse browsing trajectories rather than forming concentrated fixation points [37]. This visual exploration pattern is particularly well suited for studying the relational connections between fixation blocks.
The experiment was conducted in an exhibition space at Yunlin University of Science and Technology. The participant determined their own viewing duration. To ensure a complete recording of the visual scene, the participant maintained an approximate distance of one meter from the painting and moved within the designated viewing area. During the viewing process, the participant verbalized their observations and thoughts using the think-aloud method, while the built-in recording function of the eye-tracker synchronously captured the audio. The entire experiment proceeded without interruptions until completion, as shown in Figure 12a,b.
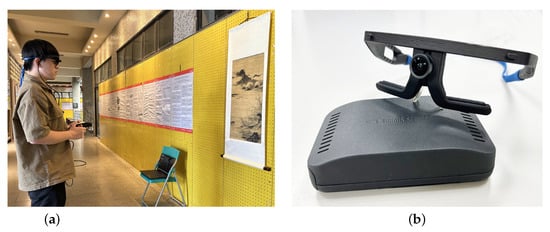
Figure 12.
Data collection equipment and environment. (a) Participant wearing eye-tracking glasses viewing materials in laboratory setting. (b) ARGUS SCIENCE ETVision wearable 180 Hz eye-tracking device.
4.3. Research Results Analysis
Transforming viewing process information into a computable form allows originally scattered eye-tracking data to be structured, with participants’ verbal feedback aiding in data interpretation. The research results include a structured analysis of eye-tracking data, an analysis of think-aloud content, and a comprehensive discussion. The following sections provide detailed explanations.
4.3.1. Fixation Regions
Five primary fixation regions were generated based on early-stage gaze data to serve as the initial AOIs for subsequent structural modeling. These regions are labeled sequentially as follows: Region 1 presents the boatman and riverside scenery; Region 2 includes the vast river surface with scattered boats; Region 3 represents the foreground riverside; Region 4 covers distant settlements and tree clusters; and Region 0 showcases layered mountain landscapes.The resulting fixation cluster distribution is illustrated in Figure 13a. In terms of fixation point distribution, Region 1 (boatman and riverside scenery) accumulated the highest number of 658 fixation points, followed by Region 4 (distant settlements and tree clusters) with 529 fixation points, and Region 2 (distant mountains) with 472 fixation points. These three primary areas of focus are all centrally located in the composition. Notably, although Regions 4 and 1 contain more complex visual elements, the viewer’s attention is not strictly limited to specific objects. Specifically, Region 2, despite being predominantly composed of blank space with only a few painted elements, still received a significant amount of viewing attention. In parallel with the gaze-based analysis, twenty think-aloud verbal utterances were collected during the viewing process. Each utterance was mapped to a specific time segment within the eye-tracking dataset, allowing for integrated multimodal alignment. Using the semantic classification framework established in Chen et al. [37], these utterances were categorized into four types: evaluative judgment, spatial context, image–text interaction, and object recognition. However, for the purposes of detailed structural modeling, only eight utterance–gaze segments were selected, based on the dual condition of semantic relevance and observable gaze dynamics within the corresponding time window. This dual-filtering approach ensured that the analytical focus was placed on integrated verbal–visual moments of cognitive significance, providing a robust foundation for the subsequent time-series analysis. Notably, some analytic segments were formed by merging adjacent utterances when they collectively marked a dynamic gaze transition, ensuring that the segmentation reflected multimodal coherence rather than strictly adhering to individual sentence boundaries.
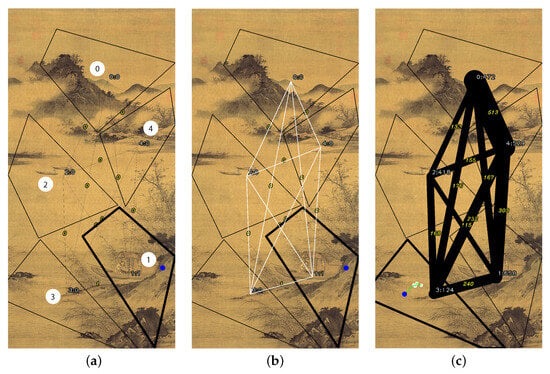
Figure 13.
(a) Distribution of fixation clusters. (b) Relationship pathways. (c) Structural connection strength.
4.3.2. Relationships
The way that visual elements are organized plays a crucial role in visual representation, providing an intuitive means to convey relationships between components within an image. These relationships are visualized through lines connecting spatial regions that were automatically generated by clustering fixation points. Based on the spatial distribution of gaze data, the image was segmented into five data-driven visual regions, with the centroid of each cluster computed for subsequent structural analysis. By further linking the central positions of each fixation region point-to-point, the resulting connections represent the relationship pathways between visual blocks, as shown in Figure 13b. These connections not only illustrate the direct links between central points but also symbolize the process of structural organization, integrating visual elements into a cohesive whole. Ultimately, these connections effectively reflect the strength and significance of relationships between elements within the structure.
4.3.3. Weight
The relationship pathways between fixation regions exhibit a clear hierarchical structure, as shown in Figure 13c. In the quantitative analysis of interregional connection strength, the most densely connected regions are the distant mountains (Region 0) and the mountain settlement (Region 4), with a total of 513 gaze transitions. The viewer’s gaze also frequently shifted between the foreground riverside (Region 3) and the riverside boatman (Region 1), accumulating 240 gaze transitions. A slightly weaker but still significant level of visual interaction was observed between the mountain settlement (Region 4) and the riverside boatman (Region 1) with 303 gaze transitions, as well as between the mountain settlement (Region 4) and the foreground riverside (Region 3) with 232 transitions. In contrast, the lake surface with scattered boats (Region 2) exhibited the weakest visual connections to other regions, with transition frequencies ranging between only 115 and 155 times. This distinct hierarchical structure of relationships highlights the varying degrees of visual guidance exerted by different areas of the painting.
4.3.4. Time: Integrative Analysis of Visual Structure and Verbal Utterances in the Temporal Dimension
This section adopts a time-series perspective to examine the evolving rhythm of gaze behavior during the viewing process and to assess whether the timing of verbal utterances coincides with dynamic adjustments in gaze patterns. While these utterances do not explicitly reference specific visual objects, some appear before or after transitions in gaze, concentrated fixations, or changes in exploration rhythm. As such, in this section, utterances are treated not as explanations of visual behavior but as temporal markers indicating potential turning points or phase shifts within the viewing process. To illustrate the interplay between verbal expression and gaze behavior over time, eight paired segments of utterance and gaze data were selected for in-depth analysis. These segments were chosen based on two criteria: (1) the utterance had already been categorized using a grounded-theory-based semantic classification framework; and (2) the surrounding eye-tracking data exhibited notable gaze transitions, focused fixations, or structural changes in gaze behavior. The semantic categories used followed the framework of Chen et al. [37], comprising three relevant types for this study—evaluative judgment, spatial description, and object identification—excluding graphic–textual interaction, which was not applicable to the image used. It is important to note that some analytic units consist of adjacent utterances grouped together, as they collectively indicate dynamic changes in gaze behavior. Thus, the eight analytic segments encompass 18 utterances in total, rather than a one-to-one mapping with the originally recorded 20 utterances. Utterances excluded from this analysis primarily occurred during periods of micro-adjustments within a single region and lacked significant gaze transitions. Additionally, this section centers exclusively on the temporal alignment between utterances and gaze; it does not attempt to infer semantic-gaze correspondences or propose causal relationships between language and visual attention. The objective here is to explore how the appearance of verbal utterances temporally intersects with shifts in gaze structure, thereby offering auxiliary insight into the staged evolution of the viewing process.
As summarized in Table 4, the eight analytical phases were selected based on both semantic categories and observable gaze transitions. This table provides an overview of the utterances included in each phase, their temporal boundaries, semantic classifications, and a brief description of the corresponding gaze patterns. This summary aims to improve the transparency and reproducibility of the phase segmentation process.

Table 4.
Summary of the eight analytical phases.
4.3.5. Quantitative Validation of Temporal Dynamics
To complement the narrative-based segmentation outlined in Section 4.3.5, Section 4.3.6, Section 4.3.7, Section 4.3.8, Section 4.3.9, Section 4.3.10, Section 4.3.11 and Section 4.3.12, we conducted a quantitative validation of temporal dynamics surrounding utterance production. Specifically, we aligned eye-tracking data to the onset of eight semantically categorized utterances and computed time-series metrics across a ±1000 ms window. The analysis was performed on three key gaze parameters: saccade rate, fixation stability (inverse variance of gaze coordinates), and gaze dispersion (mean deviation from centroid).
Figure 14 presents the average trajectory of these metrics across all utterances. A consistent three-phase structure emerges:
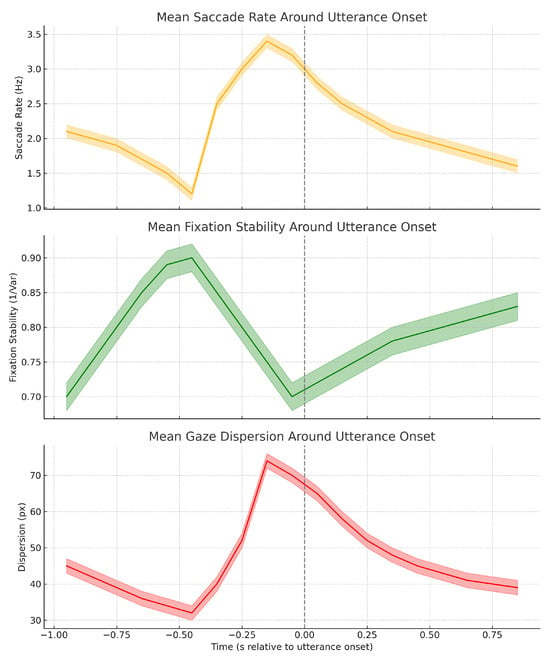
Figure 14.
Mean trajectories of saccade rate, fixation stability, and gaze dispersion (±1 SEM) aligned to utterance onset (). The temporal pattern reveals a consistent three-phase structure: pre-speech convergence, speech-coupled modulation, and post-speech recovery.
- Pre-speech convergence (−1000 ms to −200 ms): Saccade rate decreases, fixation stability increases, and gaze dispersion narrows—indicating attentional focusing before speech.
- Speech initiation (−200 ms to +200 ms): All parameters show sharp transitions—saccade rate peaks, fixation stability dips, and dispersion expands—suggesting strong visual–cognitive engagement.
- Post-speech decay (+200 ms to +1000 ms): A clear recovery pattern occurs, with exponential normalization of all gaze metrics over approximately 800 ms, reflecting cognitive reset and re-stabilization.
This structured modulation pattern validates our phase segmentation with empirical gaze signatures. Notably, affective utterances consistently produced the strongest modulation, supporting the hypothesis that emotionally expressive language enhances multimodal coupling. These results confirm that verbal production is temporally synchronized with systematic visual reorganization, and that the segmentation used in our study reflects robust underlying attentional dynamics.
4.3.6. Phase 1 (00:00:07:31–00:00:10:12)
In the initial stage of the viewing process, the participant remarked, “Okay, I see a painting.” Although brief, this utterance marked the point of cognitive entry into the viewing experience and conveyed a preparatory tone, indicating the viewer’s readiness to engage with the image. According to the semantic classification framework by Chen et al. [37], this statement falls under the “affective impression” category, serving as a marker of the viewer’s subjective perception of the overall visual scene. As shown in Figure 15, the viewer’s gaze initially fixated on the distant mountain area (Region 0), then shifted sequentially to the village (Region 4) and the boatman (Region 1), before returning once again to Region 0. This formed a gaze trajectory of “0 → 4 → 1 → 0.” This path traversed both upper and lower spatial layers of the composition and featured a distinct return behavior. Through this cyclical movement—exploration, transition, and reinspection—the viewer demonstrated a non-linear viewing process, constructing visual understanding through back-and-forth integration. The spatial transitions evident in this phase reflect a sweeping scan of the compositional structure and a preliminary segmentation of visual zones. The cross-regional gaze movements suggest that the viewer was beginning to establish relational links between local elements and the overall scene. While the utterance itself did not specify any visual details, the corresponding gaze pattern reveals an emergent structural tendency. This included early recognition of spatial depth, transitions between focal regions, and an integrative return behavior—all of which laid the foundation for the visual organization that followed.
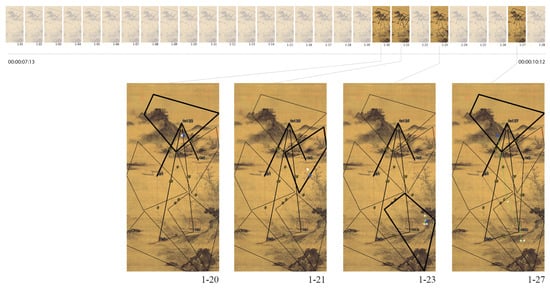
Figure 15.
Initial Gaze tracking analysis: trajectory 0 → 4 → 1 → 0. Selected frames show key transition points in eye movement.
4.3.7. Phase 2 (00:00:21:12–00:00:27:26)
In the second phase of the viewing process, the participant stated, “Ah…this painting also has…in the distance, there’s a group of fishing boats.” The utterance began with a hesitation marker, indicating a delayed initiation and an intent to extend the prior narrative. Words such as “also” and “in the distance” suggest that the viewer’s attention was shifting toward previously unexplored areas of the image, directing focus to the background zone, where the visual element of “fishing boats” introduces a sense of motion and narrative. According to the semantic classification framework proposed by Chen et al. [37], this statement falls under the category of “object identification,” as it directly references a specific visual entity located in the water region of the background. The spatial cue “in the distance” also signals a perceptual shift in depth, indicating the viewer’s cognitive adjustment from foreground to background layers. As illustrated in Figure 16, the corresponding gaze trajectory initiated in Region 2 (water surface), briefly swept across Region 4 (village), and then returned promptly to Region 2, where it remained for an extended period. The gaze subsequently transitioned to Region 1 (boatman area), forming a sequence of “2 → 4 → 2 (prolonged) → 1.” This pattern reflects a repeated, localized reorientation of attention, with prolonged fixation on the water region suggesting an effortful act of visual concentration and re-identification focused on a specific compositional element. Notably, there is a high degree of overlap between the utterance and the gaze behavior—both are centered on the left portion of the painting, particularly the water surface. This temporal alignment between language and gaze indicates that the verbal statement was generated shortly after the gaze fixation, serving as a descriptive marker of the viewer’s immediate visual focus. Overall, this phase exhibits a marked shift in both viewing rhythm and gaze organization compared to the previous phase. Rather than broadly scanning across compositional zones, the viewer engaged in repeated transitions and prolonged fixations among a limited set of key areas. This pattern signifies a convergence in the visual structure and indicates a transition from general spatial exploration to object-specific recognition in the viewing process.
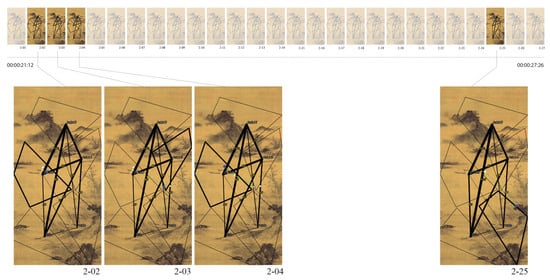
Figure 16.
trajectory 2 → 4 → 2 → 1. Selected frames show key transition points in eye movement. Thematic shift and redirection of attentional focus from middle water region to nearby water region.
4.3.8. Phase 3 (00:00:36:26–00:00:40:09)
In the third phase of the viewing process, the participant added, “There are also many bamboo groves around there.” This utterance extended the previous narrative and, through relational markers such as “there” and “also,” conveyed a supplemental tone, indicating that the viewer’s attention remained focused on the prior visual region while further elaborating its spatial context. According to the semantic classification framework proposed by Chen et al. [37], this utterance falls under the category of “composite semantics,” incorporating both spatial context (“around there”) and object identification (“bamboo groves”). As shown in Figure 17, the viewer’s gaze during this phase was concentrated between Region 4 (village) and Region 1 (boatman), with multiple short-range transitions occurring between the two zones. The gaze trajectory followed a pattern of “4 ← → 1,” reflecting a localized back-and-forth movement. Rather than expanding into new areas or exploring distant regions, the viewer’s gaze remained confined within a specific segment of the image, exhibiting fine-grained adjustments indicative of dynamic stability under focused attention. Importantly, the bamboo groves referenced in the utterance are located on the right side of the painting, precisely along the boundary between Regions 4 and 1—directly corresponding to the viewer’s gaze path at this stage. The spatial and temporal alignment of the utterance with the gaze trajectory indicates a phenomenon of localized visual reinforcement and semantic anchoring, with language serving not as the initiation of new visual exploration, but as a reinforcement and verbal clarification of ongoing perceptual processing. Overall, this phase is characterized by short-range gaze oscillations, temporal–gaze synchrony with the utterance, and the absence of new exploratory shifts. The viewer did not initiate a new scanning phase but instead engaged in semantic elaboration and detailed verification within an existing visual zone. This reflects a process of structural deepening and spatial consolidation within the localized domain of the viewing experience.
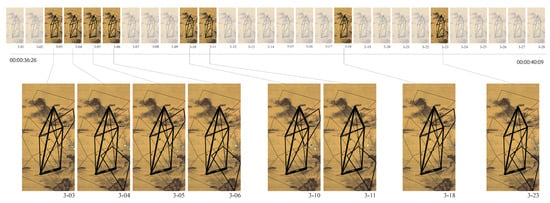
Figure 17.
Semantic elaboration and localized reinforcement of attentional focus between Regions 4 and 1.
4.3.9. Phase 4 (00:00:41:10–00:00:47:25)
In the fourth phase of the viewing process, the participant stated, “It looks like a tree…and many trees.” This utterance continued the narrative tone of the previous segment and, through the phrase “it looks like,” conveyed a degree of uncertainty in the initial visual recognition. The shift in structure from “a tree” to “many trees” illustrates a cognitive transition from identifying a singular object to recognizing a recurring visual motif. According to the semantic classification framework developed by Chen et al. [37], the utterance can be categorized as a “composite semantic type,” encompassing both object identification and spatial contextualization. As shown in Figure 18, the gaze trajectory during this phase followed a sequence of “4 (prolonged) → 0 → 4 → 1,” engaging Region 4 (village), Region 0 (distant mountains), and Region 1 (boatman area)—all areas within the painting that contain prominent tree elements. While the scan path did not exhibit a clear directional intent, it involved multiple transitions and return fixations, suggesting that the viewer’s attention remained distributed across several zones with dense vegetation. The repeated shifting and revisiting behavior indicates an ongoing process of visual verification among regions sharing similar natural features. Although the utterance “many trees” did not specify a precise location, it overlapped significantly with the gaze range. Each of the involved regions contains representative clusters of trees. Rather than focusing on a single object, the viewer’s gaze moved among multiple sites with similar visual characteristics, eventually returning to the original fixation point. This pattern suggests that the viewer was engaging in cross-regional comparison and content matching, gradually constructing an impression of how similar natural elements are distributed across the image. Overall, this phase is marked by a high degree of spatiotemporal alignment between verbal expression and gaze behavior. The viewer shifted from isolated object recognition to a broader visual scan of analogous elements. The scanpath featured short-range transitions and inter-regional returns, while the progression from singular to plural phrasing in the utterance mirrored the visual strategy of extending from individual object identification to comparative distributional observation.
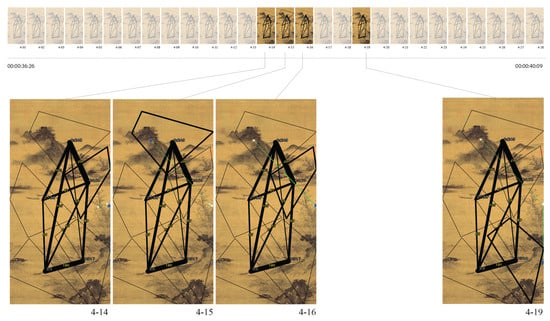
Figure 18.
Interregional gaze dynamics during the expansion of natural themes. Trajectory 4 → 0 → 4 → 1 demonstrates distinct connections between 0–4 and 1–3 regional clusters.
4.3.10. Phase 5 (00:00:50:02–00:00:57:10)
In the fifth phase of the viewing process, the participant remarked, “There are ripples in the foreground.” Although concise in structure, the utterance clearly indicated a shift in attentional direction. The term “foreground” suggested a downward shift in the viewer’s focus toward the lower portion of the image, while “ripples” referred to a specific visual texture within the composition. According to the semantic classification framework by Chen et al. [37], this utterance falls under the category of “object identification,” as it denotes a distinct visual feature along with a spatial cue. As shown in Figure 19, the corresponding gaze behavior began with an extended fixation in Region 3 (near-shore area), where the viewer demonstrated a pattern of short-range scanning and repeated fixations, focusing on the texture of the water and shoreline at the bottom of the image. The gaze then transitioned rapidly to Region 1 (boatman area), followed by Region 2 (water surface), completing a scanpath of “3 (prolonged) → 1 → 2.” This trajectory reflected a spatial flow that moved upward across the composition, encompassing a progression from foreground to midground, and demonstrating a perceptual shift in depth. The utterance’s reference to “foreground” and “ripples” closely aligned with the distribution of those features in the image, and the viewer’s gaze and verbalization were nearly simultaneous in targeting the lower edge of the composition. The subsequent gaze transitions toward the central and upper portions of the water area further suggest that the viewer’s attention was no longer restricted to a single point but had begun to expand across the broader aquatic surface. Overall, this phase exhibited a clear sense of directionality and spatial hierarchy within the gaze behavior: moving from bottom to top, and from near to far. The viewer transitioned from detailed inspection of rippling textures to a more integrative scan of the full water surface. The temporal and spatial synchrony between gaze and language highlighted a multi-scale visual processing pattern, in which a single utterance accompanied cross-regional attentional shifts and reflected an unfolding structural awareness of the image’s spatial layers.
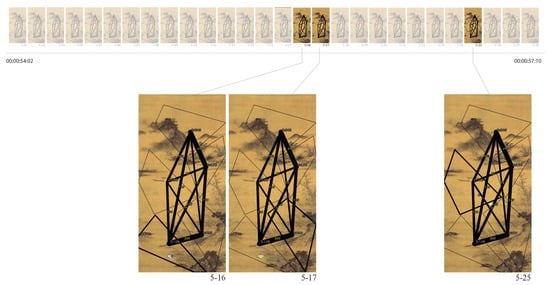
Figure 19.
Visual expansion from foreground water to boatman scene to calm water surface. Trajectory 3 → 1 → 2 demonstrates sequential attention shifts across distinct aquatic zones.
4.3.11. Phase 6 (00:01:10:26–00:01:13:06)
In the sixth phase of the viewing process, the participant remarked, “What the artist is trying to express is…” Although the utterance was incomplete, its linguistic structure revealed an attempt to transition from concrete observation to higher-level interpretive judgment. According to the semantic classification framework proposed by Chen et al. [37], this utterance is categorized as “affective impression,” marking a moment in which the viewer sought to synthesize meaning across the visual composition. As illustrated in Figure 20 the viewer’s gaze initially fixated on Region 4 (village area), then moved to Region 2 (water surface), where it remained for a prolonged period with focused, short-range scanning. The gaze then returned to Region 4, forming a trajectory of “4 → 2 (prolonged fixation) → 4.” This path represents a dynamic of departure from a specific visual region, deep engagement in a focal area, and eventual return to the original point of observation. Although the utterance did not explicitly reference any particular visual element, the gaze was clearly concentrated on Region 2, where several small boats are located. The scanning behavior in this area was tight and sustained, suggesting a careful visual examination of localized details. This visual behavior occurred in temporal proximity to the verbal expression, forming a sequence in which the language addressed the artist’s intent while the gaze simultaneously engaged in detailed exploration—possibly in search of visual cues to support the emerging interpretive judgment. While not directly aligned in content, the co-occurrence of the utterance and the gaze pattern indicates a moment of interplay between linguistic reflection and visual attention. Overall, this phase is characterized by a scanpath of local focus, expansion, and return. Despite the abstract and open-ended nature of the utterance, the gaze behavior exhibited discernible patterns of attentional concentration and regional specificity. The viewer’s visual strategy appeared to support an interpretive process in progress, integrating spatial structure and cognitive inference within the viewing experience.
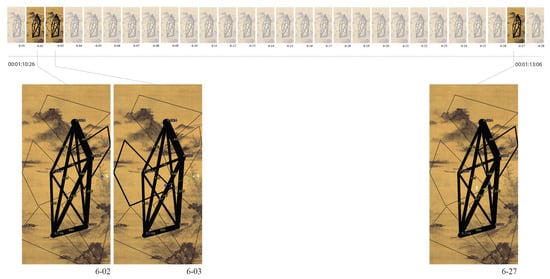
Figure 20.
Convergence of abstract meaning and visual focus through prolonged gaze and return. Trajectory 4 → 2 → 4 demonstrates cyclical attention pattern with extended focus duration.
4.3.12. Phase 7 (00:01:17:04–00:01:19:06)
In the seventh phase of the viewing process, the participant briefly remarked, “Calm.” This utterance did not reference any specific visual object and is categorized as an “affective impression.” According to the semantic classification framework proposed by Chen et al. [37], this type of utterance reflects the viewer’s subjective emotional response to the current visual experience but lacks explicit referential content. As shown in Figure 21, the gaze trajectory began in Region 4 (village area), passed through Region 1 (boatman area), and ultimately settled in Region 2 (water surface), where sustained fixations and repeated scanning were observed. Compared to the previous regions, the viewer’s gaze was more densely concentrated in the water surface area, with broader scan coverage and multiple focal fixations often accompanied by short-range oscillations. The utterance “Calm” occurred concurrently with the period of prolonged fixation in Region 2, indicating temporal synchrony between language and gaze. Although the gaze was not directed toward any specific visual detail, its sustained presence within the open, undisturbed water region, combined with relatively infrequent saccades, suggests an extended mode of visual absorption rather than active search or recognition. This gaze pattern may be interpreted as an expansive attentional state oriented toward the central and lower portions of the image. Overall, this phase represents a transition from dynamic multi-regional scanning to focused visual stability. The gaze behavior settled into a consistent pattern of attention on the water surface, while the utterance—though semantically abstract—served as a temporal marker aligned with this shift. The spatial and temporal overlap between gaze and language highlights a phase in which the viewer’s attention shifted from motion to stillness, marking a moment of perceptual consolidation within the viewing process.
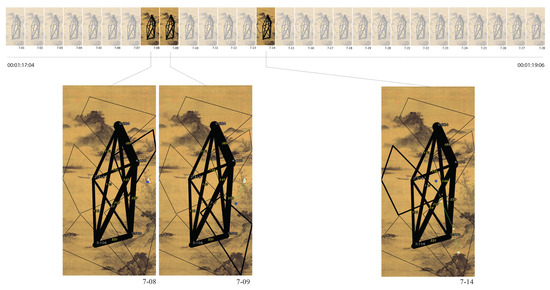
Figure 21.
Emergence of affective language through deep gaze into the lower right quadrant. Trajectory 4 → 1 → 2 demonstrates progressive attention convergence toward emotional focal points.
4.3.13. Phase 8 (00:01:21:04–00:01:22:01)
In the eighth phase of the viewing process, the participant uttered a single word: “Riverside.” According to the semantic classification framework proposed by Chen et al. [37], this statement falls under the category of “object identification,” as it refers to a clearly defined visual element located along the boundary between the water surface (Region 2) and the boatman area (Region 1). As illustrated in Figure 22, the viewer’s gaze during this phase exhibited rapid cross-regional movement, progressing through Region 4 (village), Region 1 (boatman), and Region 2 (water surface), then returning to Region 4 before extending to Region 0 (distant mountains). This scanpath—“4 → 1 → 2 → 4 → 0”—demonstrates a spatial progression from the middle ground, across the foreground, and into the background, covering at least four major Areas of Interest (AOIs) and involving both return and forward transitions. Although the term “riverside” semantically corresponds to the boundary zone between Regions 2 and 1, the viewer’s gaze did not pause in that area at the moment of verbalization. Instead, the gaze quickly transitioned through it and extended to other parts of the image. This does not indicate a temporal synchrony but spatial divergence between the verbal utterance and gaze behavior. This phase is characterized by three distinct features in gaze activity: first, a rapid scanning rhythm with broad spatial coverage; second, a layered trajectory that spans from near to far visual depths; and third, a structured sequence involving initial scanning, return, and extension. While the utterance itself was minimal in content, the associated scanpath revealed a dynamic and multi-layered visual exploration. Rather than remaining limited to the referential zone implied by the term “riverside,” the viewer’s gaze exhibited a broader interpretive movement across the composition, emphasizing the contrast between linguistic brevity and visual complexity.
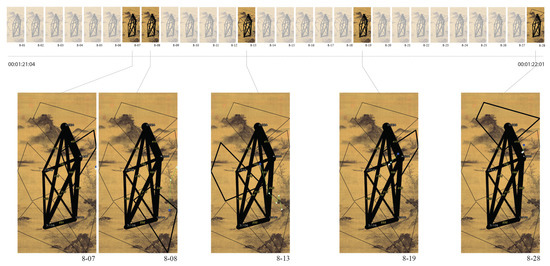
Figure 22.
Complex trajectory 4 → 1 → 2 → 4 → 0 showing emergence of affective language through deep gaze into the lower right quadrant. Multiple return patterns indicate sustained emotional processing.
4.4. Comprehensive Analysis: Unveiling the Expression of Structured Visual Behavior
This section integrates the findings from the eight analyzed segments of gaze and verbal data, examining four key dimensions—region distribution, inter-regional relations, attentional weight, and temporal structure—to characterize the structural tendencies present in the designer’s viewing behavior. It further discusses how these patterns reflect the viewer’s underlying visual strategies. Region: In terms of spatial distribution, the viewer’s gaze was not evenly dispersed across the image but was instead concentrated around specific compositional nodes, including the boatman area (Region 0), the village (Region 3), and the water surface (Region 1). These regions consistently recurred across different phases and frequently coincided with the timing of verbal utterances. This suggests the establishment of stable visual anchor zones that served as reference points throughout the viewing process. Notably, in Phases 6 and 7—where verbal expressions were abstract and lacked specific referents—the gaze nevertheless remained focused on these pre-established key regions, indicating a viewing strategy anchored in focal consistency and cumulative attention. Relation: From the perspective of inter-regional transitions, the gaze behavior often featured short-range shifts and return movements. For instance, the sequences “4 → 1 → 2 → 4 → 0” in Phase 8 and “0 → 4 → 1 → 0” in Phase 1 reflect a pattern of outward exploration followed by a return to the original focus area. This non-linear trajectory highlights a structure of comparison, validation, and integration. Certain regions—particularly the water surface and village—formed high-frequency pairings, suggesting a stable visual linkage potentially corresponding to formal compositional relationships or narrative cohesion within the artwork. Weight: The dimension of attentional weight is reflected in the frequency of fixations across regions. Regions with higher fixation counts—such as the village and boatman areas—emerged as central zones of concentrated attention and frequently coincided with the timing of verbal utterances. In contrast, regions with fewer total fixations—such as the distant mountains or the water surface—appeared repeatedly as transitional nodes within scanpaths, serving as conduits for gaze shifts. These observations suggest that fixation strength is influenced not only by the visual features within each region, but also by the viewer’s moment-to-moment visual organization and sequencing strategies throughout the viewing process. Time: The temporal structure of the gaze trajectory reveals a rhythmic progression throughout the viewing experience. Across the eight phases, gaze behavior transitioned through distinct stages—global impression, detail recognition, regional comparison, spatial expansion, and emotional articulation. Verbal utterances often coincided with moments of gaze concentration, region-to-region shifts, or changes in viewing tempo. For example, the utterance “Calm” followed an extended fixation on the water surface, while the remark “There are also many bamboo groves around there” aligned with rapid back-and-forth movements between two specific zones. While not always directly synchronized, these overlaps indicate that both gaze and language collaboratively marked significant structural transitions over time. Taken together, the results of this analysis reveal a distinctly structured pattern in the designer’s viewing process. The viewer tended to concentrate on specific compositional nodes, construct stable relational paths between them, and organize gaze behavior into hierarchically layered, temporally phased, and integratively looping patterns. Through the proposed analytical framework, these latent structural features were rendered explicit, shedding light on the non-random, organized, and compositionally sensitive nature of the designer’s visual engagement. The findings demonstrate that structured viewing is not only detectable but also meaningfully reflects how designers interpret and navigate pictorial content.
4.5. Framework Validation Through Cross-Participant Analysis
This chapter extends the results presented in Section 4 by further validating the consistency and identification performance of the proposed visual translation workflow across multiple participants. Through a standardized analysis mechanism and consistent visualization rules, the viewing processes of three participants produced structurally differentiated images, demonstrating the system’s stability and applicability in handling diverse behavioral characteristics. The following sections explain these results in terms of methodological consistency and observations of individual differences.
4.5.1. System Stability and Visual Structure Consistency
Cross-Participant Computational Stability
The same analytical workflow—including the k = 5 clustering configuration verified through multiple indicators, the coordinate transformation algorithm, and the relationship strength quantification method—was applied consistently across all three participants and was able to stably execute, generating structurally differentiated yet comparable visual structure maps. The system maintained consistent and reliable computations regardless of differences in viewing duration or verbal expression.
Consistency of Visual Translation Results
Despite clear differences in the participants’ viewing behaviors, the system was able to accurately translate these into structural diagrams that displayed clear regional segmentation, stable connection networks, and quantified weight distributions, demonstrating operational stability in processing cross-individual data. These structural diagrams maintained consistent analytical logic, indicating that the observed differences genuinely originated from the viewing behavior itself, rather than from computational artifacts or subjective interpretation. On the data processing level, all participants’ eye-tracking data underwent the same unified procedures, including region encoding, fixation segmentation, jump-sequence construction, and connection strength calculation. The relational lines shown in each diagram were converted into visual intensities based on the number of gaze points falling within regions and buffer zones, while the visual centers of gravity were weighted by the spatial distribution of fixation points and marked graphically. This workflow ensured that the logic of data translation was fully consistent across participants, meaning that the visual differences arose from the viewing behavior itself rather than from inconsistencies in computation or interpretative biases.
4.6. Observations of Differences
4.6.1. Systematic Identification of Three-Dimensional Differences
Based on the analysis results shown in Figure 11, the proposed visual structure analysis framework demonstrated a clear capacity for identifying individual differences. After applying the same computational and translation workflow, the participants’ viewing behaviors displayed structural differences that could be categorized across three critical dimensions: spatial center-of-gravity locations, inter-regional connection strength, and cognitive organizational centers. These features not only described the structural forms of the viewing process but also provided an operational basis for comparing viewing behaviors and identifying individuals.
4.6.2. Differences in Spatial Center-of-Gravity Distribution
The three participants showed clear differences in the spatial distribution of attentional focus. Participant A’s visual structure was centered in the upper-left area of the image, reflecting a strong focus on the upper landscape elements; Participant B’s center of gravity was located near the middle of the image, showing a relatively balanced spatial attention distribution; Participant C’s center of gravity shifted downward, indicating a concentration of attention on the foreground elements. Further observations of gaze distribution revealed that Participant B’s gaze was clustered between central blocks, forming a concentrated structure overlapping with the visual backbone, while Participant C’s gaze was distributed around the periphery, with relatively sparse connections in the center, resulting in a divergent visual organization characterized by a dense periphery and sparse center.
4.6.3. Differences in Inter-Regional Connection Strength
An analysis of the strongest connections revealed three different spatial cognitive construction strategies. Participant A established a dominant connection with a strength of 513 between Regions 4 and 0, integrating the layered mountain landscape with the distant settlement and trees, reflecting a deep cognitive construction of natural environmental hierarchies. Participant B built a core connection with a strength of 366 between Regions 4 and 1, linking the distant settlement with the riverside boatman, indicating a combined understanding of human activity and spatial context. Participant C formed a tight connection with a strength of 398 between Regions 1 and 3, focusing on the interactive relationship between the near-shore area and the boatman, reflecting a foreground detail-oriented cognitive organizational style.
4.6.4. Divergent Structures in Weaker Connections
Beyond the main strong connections, the weaker connections also revealed non-typical behaviors during compositional understanding and visual exploration. Although these connections did not carry the strength of primary pathways, they frequently appeared when participants were confirming, doubting, jumping, or scanning boundaries, reflecting low-frequency yet meaningful exploratory segments. Participant B’s weaker connections primarily appeared between Region 0 (distant mountains), Region 3 (near-shore), and Region 1 (boatman). Although these regions were occasionally involved in gaze jumps, their overall number of transitions and continuity were low, and they did not form an integrated structural network with the main strong connection (such as Region 4 and Region 1). The jumping relationships between the distant mountains and other regions were significantly weaker, with no further verbal descriptions or elaborations, indicating that the participant scanned these areas but did not integrate them into the core spatial understanding or develop them into a cognitive framework. Participant C’s weaker connections were concentrated between Region 4 (distant settlement and trees) and Region 0 (mountains), extending to Region 1 (near-shore), forming combinations such as 0–3, 3–4, and 4–0. These transitions created a visual structure emerging in the upper right and extending toward the lower middle of the image. However, these inter-regional links were mostly short-lived and scattered, failing to develop stable connections with the participant’s main 3–1 structure. The corresponding verbal statements also showed a primary focus on foreground details, with little engagement with the distant background elements. Therefore, these weaker connections should be regarded as non-core structures that emerged during local confirmation, comparison, or spatial extension, supplementing aspects of viewing behavior not covered by the main path analysis.
4.6.5. Differences in Cognitive Organizational Centers
An analysis of relational centers further revealed fundamental differences in participants’ cognitive spatial organization. Participant A used Region 4 (the distant settlement) as the core cognitive node, forming a radial network centered on the settlement, with other spatial elements referencing it. Both Participant B and Participant C took Region 1 (the riverside boatman) as their organizational center, but demonstrated distinct network patterns: Participant B developed a human-activity-oriented relational network centered on the boatman, while Participant C constructed a foreground-detail-oriented relational system using the boatman as a base. These organizational centers not only supported the main gaze pathways but also extended through weaker connections to other regions, effectively maintaining the participant’s cognitive grasp and structural control over the entire visual scene.
5. Conclusions
This study proposed a structured analytical workflow for interpreting viewing behavior, demonstrated through the case of observing traditional Chinese landscape paintings. The analysis focused on a participant with a design background, whose visual behavior revealed distinctive patterns of regional organization and inter-regional connectivity. These findings suggest that even under free-viewing conditions, designers tend to actively explore and construct spatial structures. To further evaluate the feasibility and application potential of the proposed system, the study also incorporated data from three participants, confirming its stability and identification performance across individuals. Unlike conventional eye-tracking analyses that remain within the framework of statistical descriptions, this method establishes a new pathway from statistical analysis to cognitive structure modeling. By transforming viewing behavior into four structural dimensions—Region, Relation, Weight, and Time—the framework reveals the structural tendencies and exploratory pathways embedded in visual processes. Through this visual translation, researchers can understand the organizational logic of viewing on three levels. First, in terms of spatial distribution and regional connectivity, the distribution of fixation points was not random or discrete, but formed multi-layered links around certain visual focal points, indicating a progressive expansion from local exploration to global organization. Second, regarding attentional intensity and functional differentiation, certain regions (such as the boatman and village) emerged as visual cores with high fixation density and verbal correspondence, while others (such as the water surface and distant mountains) had lower fixation frequencies but acted as transitional nodes or intermediaries, reflecting their auxiliary functions in the viewing structure. Third, from a temporal perspective, the viewing process exhibited phases of exploration, expansion, and return, with verbal utterances appearing after shifts in gaze, functioning as delayed semantic markers that provided retrospective cognitive cues for integration. The most significant contribution of this study is the verification of the replicability and generalizability of the analytical framework. After extending the system to multiple participants, it maintained a consistent translation process and visual outputs while efficiently identifying individual differences, demonstrating stable performance and recognition capabilities in cross-individual applications. Using the same processing workflow, differentiated visual structure maps can be generated even without relying on verbal semantic information. This highlights the framework’s capacity to reveal potential features of individual differences in situations where semantic cues are limited, serving as a practical tool for the rapid identification and comparison of visual behavior. In summary, this research opens new possibilities for discovering structural organization within eye-tracking data, and the proposed system demonstrates practical potential for observing and interpreting the structural tendencies of viewing behavior. Future work could further test the system’s applicability and scalability by incorporating more diverse stimulus content and task types.
Limitations
The primary limitation of this study lies in its research design, which involved a single participant and a single stimulus image. Although additional data from two other participants were included to validate the system’s cross-individual consistency and differentiation capabilities, the overall sample size remains exploratory and is insufficient for inferring group-level behavioral characteristics. Considering that the core objective of this study was to propose and validate a method and workflow for structural visual analysis, the current design was sufficient for preliminary validation and demonstration. Future research should expand both the range of stimuli and the participant pool to comprehensively assess the system’s stability and applicability across diverse contexts. In addition, although this study focused on methodological demonstration and exploratory analysis, it proposes a preliminary hypothesis that designers’ viewing structures are significantly more clustered and hierarchically organized than those of novices or random viewers. This hypothesis was not formally tested in the current study due to sample size and design constraints but offers a clear direction for future research with confirmatory statistical testing and larger, more diverse participant groups.
Author Contributions
Research design and original draft, K.-C.C.; supervision and editing, C.-F.L. and T.-W.C.; technical support, T.-W.C.; software development, C.-G.W.; data collection, J.-R.L. All authors have read and agreed to the published version of the manuscript.
Funding
This research was partially funded by National Science and Technology Council, Taiwan in project NSTC 112-2410-H-224-016-MY2.
Institutional Review Board Statement
The study was conducted in accordance with the Declaration of Helsinki, and approved by the Institutional Review Board of National Cheng Kung University Human Research Ethics Committee.
Informed Consent Statement
Informed consent was obtained from all subjects involved in the study.
Data Availability Statement
The data presented in this study are available on request from the corresponding author. The data are not publicly available due to privacy considerations and ongoing research.
Conflicts of Interest
The authors declare potential conflicts of interest as the research team may apply for patents related to the developed system and tools. However, no commercial benefits or distribution plans are currently involved. All authors have disclosed their potential interests and this does not affect the objectivity of the research. The funders had no role in the design of the study; in the collection, analyses, or interpretation of data; in the writing of the manuscript; or in the decision to publish the results.
References
- Cross, N. Designerly Ways of Knowing; Springer: Berlin/Heidelberg, Germany, 2006. [Google Scholar]
- Dorst, K. The core of design thinking’and its application. Des. Stud. 2011, 32, 521–532. [Google Scholar] [CrossRef]
- Bryan, L. How Designers Think: The Design Process Demystified; Architectural Press: Oxford, UK; Elsevier: Amsterdam, The Netherlands, 2005. [Google Scholar]
- Buchanan, R. Wicked problems in design thinking. Soc. Des. Read. 2008, 8, 5–21. [Google Scholar]
- Razzouk, R.; Shute, V. What is design thinking and why is it important? Rev. Educ. Res. 2012, 82, 330–348. [Google Scholar] [CrossRef]
- Yarbus, A.L. Eye movements during perception of complex objects. In Eye Movements and Vision; Springer: Boston, MA, USA, 1967; pp. 171–211. [Google Scholar]
- Hayhoe, M.; Ballard, D. Eye movements in natural behavior. Trends Cogn. Sci. 2005, 9, 188–194. [Google Scholar] [CrossRef] [PubMed]
- Henderson, J.M. Human gaze control during real-world scene perception. Trends Cogn. Sci. 2003, 7, 498–504. [Google Scholar] [CrossRef] [PubMed]
- Holmqvist, K.; Nyström, M.; Andersson, R.; Dewhurst, R.; Jarodzka, H.; Van de Weijer, J. Eye Tracking: A Comprehensive Guide to Methods and Measures; OUP: Oxford, UK, 2011. [Google Scholar]
- Rayner, K. Eye movements in reading and information processing: 20 years of research. Psychol. Bull. 1998, 124, 372. [Google Scholar] [CrossRef] [PubMed]
- Tatler, B.W.; Hayhoe, M.M.; Land, M.F.; Ballard, D.H. Eye guidance in natural vision: Reinterpreting salience. J. Vis. 2011, 11, 5. [Google Scholar] [CrossRef] [PubMed]
- Kundel, H.L.; Nodine, C.F.; Conant, E.F.; Weinstein, S.P. Holistic component of image perception in mammogram interpretation: Gaze-tracking study. Radiology 2007, 242, 396–402. [Google Scholar] [CrossRef] [PubMed]
- Torralba, A.; Oliva, A.; Castelhano, M.S.; Henderson, J.M. Contextual guidance of eye movements and attention in real-world scenes: The role of global features in object search. Psychol. Rev. 2006, 113, 766. [Google Scholar] [CrossRef] [PubMed]
- Kurzhals, K.; Fisher, B.; Burch, M.; Weiskopf, D. Eye tracking evaluation of visual analytics. Inf. Vis. 2016, 15, 340–358. [Google Scholar] [CrossRef]
- Unema, P.J.; Pannasch, S.; Joos, M.; Velichkovsky, B.M. Time course of information processing during scene perception: The relationship between saccade amplitude and fixation duration. Vis. Cogn. 2005, 12, 473–494. [Google Scholar] [CrossRef]
- Noton, D.; Stark, L. Scanpaths in eye movements during pattern perception. Science 1971, 171, 308–311. [Google Scholar] [CrossRef] [PubMed]
- Desimone, R.; Duncan, J. Neural mechanisms of selective visual attention. Annu. Rev. Neurosci. 1995, 18, 193–222. [Google Scholar] [CrossRef] [PubMed]
- Wolfe, J.M. Guided search 2.0 a revised model of visual search. Psychon. Bull. Rev. 1994, 1, 202–238. [Google Scholar] [CrossRef] [PubMed]
- Posner, M.I. Orienting of attention. Q. J. Exp. Psychol. 1980, 32, 3–25. [Google Scholar] [CrossRef] [PubMed]
- Treisman, A.M.; Gelade, G. A feature-integration theory of attention. Cogn. Psychol. 1980, 12, 97–136. [Google Scholar] [CrossRef] [PubMed]
- Egeth, H.E.; Yantis, S. Visual attention: Control, representation, and time course. Annu. Rev. Psychol. 1997, 48, 269–297. [Google Scholar] [CrossRef] [PubMed]
- Locher, P. The usefulness of eye movement recordings to subject an aesthetic episode with visual art to empirical scrutiny. Psychol. Sci. 2006, 48, 106. [Google Scholar]
- Itti, L.; Koch, C. A saliency-based search mechanism for overt and covert shifts of visual attention. Vis. Res. 2000, 40, 1489–1506. [Google Scholar] [CrossRef] [PubMed]
- Parkhurst, D.; Law, K.; Niebur, E. Modeling the role of salience in the allocation of overt visual attention. Vis. Res. 2002, 42, 107–123. [Google Scholar] [CrossRef] [PubMed]
- Corbetta, M.; Shulman, G.L. Control of goal-directed and stimulus-driven attention in the brain. Nat. Rev. Neurosci. 2002, 3, 201–215. [Google Scholar] [CrossRef] [PubMed]
- Theeuwes, J. Top-down and bottom-up control of visual selection. Acta Psychol. 2010, 135, 77–99. [Google Scholar] [CrossRef] [PubMed]
- Pomplun, M.; Reingold, E.M.; Shen, J. Investigating the visual span in comparative search: The effects of task difficulty and divided attention. Cognition 2001, 81, B57–B67. [Google Scholar] [CrossRef] [PubMed][Green Version]
- Rothkegel, L.O.; Schütt, H.H.; Trukenbrod, H.A.; Wichmann, F.A.; Engbert, R. Searchers adjust their eye-movement dynamics to target characteristics in natural scenes. Sci. Rep. 2019, 9, 1635. [Google Scholar] [CrossRef] [PubMed]
- Wolfe, J.M.; Horowitz, T.S.; Kenner, N.M. Rare items often missed in visual searches. Nature 2005, 435, 439–440. [Google Scholar] [CrossRef] [PubMed]
- Grüner, M.; Goller, F.; Ansorge, U. Top-down knowledge surpasses selection history in influencing attentional guidance. Atten. Percept. Psychophys. 2023, 85, 985–1011. [Google Scholar] [CrossRef] [PubMed]
- Dolci, C.; Boehler, C.N.; Santandrea, E.; Dewulf, A.; Ben-Hamed, S.; Macaluso, E.; Chelazzi, L.; Rashal, E. Integrated effects of top-down attention and statistical learning during visual search: An EEG study. Atten. Percept. Psychophys. 2023, 85, 1819–1833. [Google Scholar] [CrossRef] [PubMed]
- Rashal, E.; Santandrea, E.; Ben-Hamed, S.; Macaluso, E.; Chelazzi, L.; Boehler, C.N. Effects of top-down and bottom-up attention on post-selection posterior contralateral negativity. Atten. Percept. Psychophys. 2023, 85, 705–717. [Google Scholar] [CrossRef] [PubMed]
- Wolfe, J.M. Guided Search 6.0: An updated model of visual search. Psychon. Bull. Rev. 2021, 28, 1060–1092. [Google Scholar] [CrossRef] [PubMed]
- Chen, K.C.; Lee, C.F.; Chang, T.W. Visualization of the relationship between void and eye movement scan paths in shan shui paintings. In Proceedings of the 26th International Conference Information Visualisation (IV), Vienna, Austria, 19–22 July 2022; pp. 199–203. [Google Scholar]
- Chang, T.W.; Tsai, S.T.; Huang, H.Y.; Wu, Y.S.; Chang, C.C.; Datta, S. Slow well-being gardening: Creating a sensor network for radiation therapy patients via horticultural therapeutic activity. Sensors 2024, 24, 3771. [Google Scholar] [CrossRef] [PubMed]
- Chang, T.W.; Chen, C.Y.; Huang, H.Y.; Hsieh, T.L.; Huang, W.; Datta, S. ViDA: Developing a visualization system for a Design-Fabrication-Assembly (D-F-A) process. Multimed. Tools Appl. 2022, 81, 14617–14639. [Google Scholar] [CrossRef]
- Chen, K.C.; Lee, C.F.; Hwang, S.H. Scan-paths and semantic deconstruction of Chinese Landscape paintings. J. Des. Stud. 2022, 6. [Google Scholar]
- Hahn, L.; Klein, P. Clustering eye-movement data uncovers students’ strategies for coordinating equations and diagrams of vector fields. Educ. Stud. Math. 2025, 118, 359–385. [Google Scholar] [CrossRef]
- Santella, A.; DeCarlo, D. Robust clustering of eye movement recordings for quantification of visual interest. In Proceedings of the 2004 Symposium on Eye Tracking Research & Applications, San Antonio, TX, USA, 22–24 March 2004; pp. 27–34. [Google Scholar]
- Goldberg, J.H.; Kotval, X.P. Computer interface evaluation using eye movements: Methods and constructs. Int. J. Ind. Ergon. 1999, 24, 631–645. [Google Scholar] [CrossRef]
- Le Meur, O.; Baccino, T. Methods for comparing scanpaths and saliency maps: Strengths and weaknesses. Behav. Res. Methods 2013, 45, 251–266. [Google Scholar] [CrossRef] [PubMed]
- Yang, H.; Zelinsky, G.J. Visual search is guided to categorically-defined targets. Vis. Res. 2009, 49, 2095–2103. [Google Scholar] [CrossRef] [PubMed]
- Zemblys, R.; Niehorster, D.C.; Holmqvist, K. gazeNet: End-to-end eye-movement event detection with deep neural networks. Behav. Res. Methods 2019, 51, 840–864. [Google Scholar] [CrossRef] [PubMed]
- Locher, P.J. Empirical investigation of an aesthetic experience with art. In Aesthetic Science: Connecting Minds, Brains, and Experience; Oxford University Press: New York, NY, USA, 2012; pp. 163–188. [Google Scholar]
- Onuchin, A.; Kachan, O. Individual topology structure of eye movement trajectories. In Advances in Neural Computation, Machine Learning, and Cognitive Research VI, Proceedings of the International Conference on Neuroinformatics, Moscow, Russia, 17–21 October 2022; Springer: Cham, Switzerland, 2022; pp. 45–55. [Google Scholar]
- Marin, M.M.; Leder, H. Gaze patterns reveal aesthetic distance while viewing art. Ann. N. Y. Acad. Sci. 2022, 1514, 155–165. [Google Scholar] [CrossRef] [PubMed]
- Ishiguro, C.; Yokosawa, K.; Okada, T. Eye movements during art appreciation by students taking a photo creation course. Front. Psychol. 2016, 7, 1074. [Google Scholar] [CrossRef] [PubMed][Green Version]
- Schwetlick, L.; Backhaus, D.; Engbert, R. A dynamical scan-path model for task-dependence during scene viewing. Psychol. Rev. 2023, 130, 807. [Google Scholar] [CrossRef] [PubMed]
- Vasilyev, A. Control of fixation duration during visual search task execution. arXiv 2020, arXiv:2004.10832. [Google Scholar] [CrossRef]
- König, P.; Wilming, N.; Kietzmann, T.C.; Ossandón, J.P.; Onat, S.; Ehinger, B.V.; Gameiro, R.R.; Kaspar, K. Eye movements as a window to cognitive processes. J. Eye Mov. Res. 2016, 9, 1–16. [Google Scholar] [CrossRef]
- Land, M.F. Vision, eye movements, and natural behavior. Vis. Neurosci. 2009, 26, 51–62. [Google Scholar] [CrossRef] [PubMed]
- Guestrin, E.D.; Eizenman, M. General theory of remote gaze estimation using the pupil center and corneal reflections. IEEE Trans. Biomed. Eng. 2006, 53, 1124–1133. [Google Scholar] [CrossRef] [PubMed]
- Hennessey, C.A.; Lawrence, P.D. Improving the accuracy and reliability of remote system-calibration-free eye-gaze tracking. IEEE Trans. Biomed. Eng. 2009, 56, 1891–1900. [Google Scholar] [CrossRef] [PubMed]
- Luo, K.; Jia, X.; Xiao, H.; Liu, D.; Peng, L.; Qiu, J.; Han, P. A New Gaze Estimation Method Based on Homography Transformation Derived from Geometric Relationship. Appl. Sci. 2020, 10, 9079. [Google Scholar] [CrossRef]
- Lowe, D.G. Distinctive image features from scale-invariant keypoints. Int. J. Comput. Vis. 2004, 60, 91–110. [Google Scholar] [CrossRef]
- Leonardis, A. Computer Vision-ECCV 2006: 9th European Conference on Computer Vision, Graz, Austria, 7–13 May 2006: Proceedings; Springer Science & Business Media: Berlin/Heidelberg, Germany, 2006; Volume 3951. [Google Scholar]
- Rublee, E.; Rabaud, V.; Konolige, K.; Bradski, G. ORB: An efficient alternative to SIFT or SURF. In Proceedings of the 2011 International Conference on Computer Vision, Barcelona, Spain, 6–13 November 2011; pp. 2564–2571. [Google Scholar]
- Kołodziej, M.; Majkowski, A.; Rak, R.J.; Francuz, P.; Augustynowicz, P. Identifying experts in the field of visual arts using oculomotor signals. J. Eye Mov. Res. 2018, 11, 3. [Google Scholar] [CrossRef] [PubMed]
- Karthikeyan, B.; George, D.J.; Manikandan, G.; Thomas, T. A comparative study on k-means clustering and agglomerative hierarchical clustering. Int. J. Emerg. Trends Eng. Res. 2020, 8, 1600–1604. [Google Scholar] [CrossRef]
- Gao, B.; Wei, K.; Tong, L. An eye diagram parameters measurement method based on K-means clustering algorithm. In Proceedings of the 2019 IEEE MTT-S International Microwave Symposium (IMS), Boston, MA, USA, 2–7 June 2019; pp. 901–904. [Google Scholar]
- Singh, N.; Singh, D. Performance evaluation of k-means and heirarichal clustering in terms of accuracy and running time. IJCSIT Int. J. Comput. Sci. Inf. Technol. 2012, 3, 4119–4121. [Google Scholar]
- Arthur, D.; Vassilvitskii, S. k-means++: The advantages of careful seeding. In Proceedings of the SODA ’07: Proceedings of the Eighteenth Annual ACM-SIAM Symposium on Discrete Algorithms, New Orleans, LA, USA, 7–9 January 2007; Society for Industrial and Applied Mathematics: Philadelphia, PA, USA, 2007; pp. 1027–1035. [Google Scholar]
- Raviya, K.H.; Dhinoja, K. An empirical comparison of k-means and DBSCAN clustering algorithm. PARIPEX Indian J. Res. 2013, 2, 153–155. [Google Scholar]
- Cuong, N.H.; Hoang, H.T. Eye-gaze detection with a single WebCAM based on geometry features extraction. In Proceedings of the 11th International Conference on Control Automation Robotics & Vision, Singapore, 7–10 December 2010; pp. 2507–2512. [Google Scholar]
- Ince, I.F.; Yang, T.C. A new low-cost eye tracking and blink detection approach: Extracting eye features with blob extraction. In Proceedings of the Emerging Intelligent Computing Technology and Applications: 5th International Conference on Intelligent Computing, ICIC 2009, Ulsan, Republic of Korea, 16–19 September 2009; Proceedings 5. Springer: Berlin/Heidelberg, Germany, 2009; pp. 526–533. [Google Scholar]
- Becker, W.; Fuchs, A.F. Further properties of the human saccadic system: Eye movements and correction saccades with and without visual fixation points. Vis. Res. 1969, 9, 1247–1258. [Google Scholar] [CrossRef] [PubMed]
- Kasprowski, P.; Harężlak, K.; Stasch, M. Guidelines for the eye tracker calibration using points of regard. In Information Technologies in Biomedicine; Springer: Cham, Switzerland, 2014; Volume 4, pp. 225–236. [Google Scholar]
- Palmer, S.E. Vision Science: Photons to Phenomenology; MIT Press: Cambridge, MA, USA, 1999. [Google Scholar]
- Hansen, D.W.; Ji, Q. In the eye of the beholder: A survey of models for eyes and gaze. IEEE Trans. Pattern Anal. Mach. Intell. 2009, 32, 478–500. [Google Scholar] [CrossRef] [PubMed]
- Morimoto, C.H.; Mimica, M.R. Eye gaze tracking techniques for interactive applications. Comput. Vis. Image Underst. 2005, 98, 4–24. [Google Scholar] [CrossRef]
- Hansen, D.W.; Roholm, L.; Ferreiros, I.G. Robust glint detection through homography normalization. In Proceedings of the Symposium on Eye Tracking Research and Applications, Safety Harbor, FL, USA, 26–28 March 2014; pp. 91–94. [Google Scholar]
- Narcizo, F.B.; Dos Santos, F.E.D.; Hansen, D.W. High-accuracy gaze estimation for interpolation-based eye-tracking methods. Vision 2021, 5, 41. [Google Scholar] [CrossRef] [PubMed]
- Das, V.E.; Thomas, C.W.; Zivotofsky, A.Z.; Leigh, R.J. Measuring eye movements during locomotion: Filtering techniques for obtaining velocity signals from a video-based eye monitor. J. Vestib. Res. 1996, 6, 455–461. [Google Scholar] [CrossRef] [PubMed]
- Hecht, R.M.; Hillel, A.B.; Telpaz, A.; Tsimhoni, O.; Tishby, N. Information constrained control analysis of eye gaze distribution under workload. IEEE Trans. Hum.-Mach. Syst. 2019, 49, 474–484. [Google Scholar] [CrossRef]
- Borji, A.; Itti, L. State-of-the-art in visual attention modeling. IEEE Trans. Pattern Anal. Mach. Intell. 2012, 35, 185–207. [Google Scholar] [CrossRef] [PubMed]
- Tractinsky, N. Visual aesthetics. In The Encyclopedia of Human-Computer Interaction, 2nd ed.; Interaction Design Foundation: Aarhus, Denmark, 2014; Available online: https://www.interaction-design.org/literature/book/the-encyclopedia-of-human-computer-interaction-2nd-ed/visual-aesthetics (accessed on 15 January 2025).
- Martinez-Marquez, D.; Pingali, S.; Panuwatwanich, K.; Stewart, R.A.; Mohamed, S. Application of eye tracking technology in aviation, maritime, and construction industries: A systematic review. Sensors 2021, 21, 4289. [Google Scholar] [CrossRef] [PubMed]
- Krassanakis, V.; Cybulski, P. Eye tracking research in cartography: Looking into the future. ISPRS Int. J. Geo-Inf. 2021, 10, 411. [Google Scholar] [CrossRef]
- Xu, H.; Yu, S.; Jin, S.; Sun, R.; Chen, G.; Sun, L. Enhancing robustness in asynchronous feature tracking for event cameras through fusing frame steams. Complex Intell. Syst. 2024, 10, 6885–6899. [Google Scholar] [CrossRef]
- Harezlak, K.; Kasprowski, P.; Stasch, M. Towards accurate eye tracker calibration–methods and procedures. Procedia Comput. Sci. 2014, 35, 1073–1081. [Google Scholar] [CrossRef]
- Komogortsev, O.V.; Karpov, A. Automated classification and scoring of smooth pursuit eye movements in the presence of fixations and saccades. Behav. Res. Methods 2013, 45, 203–215. [Google Scholar] [CrossRef] [PubMed]
- Kang, Z.; Mandal, S.; Crutchfield, J.; Millan, A.; McClung, S.N. Designs and algorithms to map eye tracking data with dynamic multielement moving objects. Comput. Intell. Neurosci. 2016, 2016, 9354760. [Google Scholar] [CrossRef] [PubMed]
- Kübler, T.C.; Bukenberger, D.R.; Ungewiss, J.; Wörner, A.; Rothe, C.; Schiefer, U.; Rosenstiel, W.; Kasneci, E. Towards automated comparison of eye-tracking recordings in dynamic scenes. In Proceedings of the 5th European Workshop on Visual Information Processing (EUVIP), Paris, France, 10–12 December 2014; pp. 1–6. [Google Scholar]
- Loyola, P.; Velásquez, J.D. Characterizing web user visual gaze patterns: A graph theory inspired approach. In Proceedings of the Brain Informatics and Health: International Conference, BIH 2014, Warsaw, Poland, 11–14 August 2014; Springer: Cham, Switzerland, 2014; pp. 586–594. [Google Scholar]
- Rim, N.W.; Choe, K.W.; Scrivner, C.; Berman, M.G. Introducing Point-of-Interest as an alternative to Area-of-Interest for fixation duration analysis. PLoS ONE 2021, 16, e0250170. [Google Scholar] [CrossRef] [PubMed]
- Constantinides, A.; Belk, M.; Fidas, C.; Pitsillides, A. An eye gaze-driven metric for estimating the strength of graphical passwords based on image hotspots. In Proceedings of the 25th International Conference on Intelligent User Interfaces, Cagliari, Italy, 17–20 March 2020; pp. 33–37. [Google Scholar]
- Alexander, R.G.; Nahvi, R.J.; Zelinsky, G.J. Specifying the precision of guiding features for visual search. J. Exp. Psychol. Hum. Percept. Perform. 2019, 45, 1248–1264. [Google Scholar] [CrossRef] [PubMed]
- Pietruski, P. Reply: Analysis of the visual perception of female breast aesthetics and symmetry: An eye-tracking study. Plast. Reconstr. Surg. 2020, 146, 502e. [Google Scholar] [CrossRef] [PubMed]
Disclaimer/Publisher’s Note: The statements, opinions and data contained in all publications are solely those of the individual author(s) and contributor(s) and not of MDPI and/or the editor(s). MDPI and/or the editor(s) disclaim responsibility for any injury to people or property resulting from any ideas, methods, instructions or products referred to in the content. |
© 2025 by the authors. Licensee MDPI, Basel, Switzerland. This article is an open access article distributed under the terms and conditions of the Creative Commons Attribution (CC BY) license (https://creativecommons.org/licenses/by/4.0/).