1. Introduction
Free-Space Optical (FSO) communication is emerging as a key enabler for high-data-rate wireless transmission in access, backhaul, and satellite applications. FSO systems offer advantages such as a license-free spectrum, enhanced security, low power consumption, and high-speed performance, with commercially available systems already supporting data rates up to 10 Gbps. The growing interest in FSO communication is largely driven by its ability to complement fiber-optic infrastructure and support the increasing demand for high-capacity backhaul in 5G networks and beyond. The adoption of FSO communication is expected to accelerate with advances in adaptive optics, hybrid RF/FSO systems, and alignment technologies, making it a promising solution for future wireless communication systems [
1]. Recent research highlights the potential of integrating FSO communication with terrestrial, aerial, and satellite platforms to meet the requirements of 5G/6G systems [
2,
3,
4] and complementary technologies such as terahertz (THz) communication. THz offers ultra-wide bandwidth for short-range links and is expected to coexist with FSO communication to support diverse 6G use cases, with recent advances including enhanced channel estimation techniques and intelligent resource management strategies [
5].
Atmospheric conditions pose a significant challenge to the reliability of FSO communication systems. The propagation of signals through the atmosphere is strongly affected by absorption and scattering caused by weather phenomena such as turbulence, fog, rain, snow, and dust storms [
6,
7]. Among these, fog and dust are particularly detrimental due to having particle sizes comparable to the optical wavelength, leading to severe scattering. These environmental factors can significantly affect signal quality, link availability, and throughput, especially in arid and semi-arid regions where dust storms are frequent and visibility fluctuates rapidly [
8,
9]. Several probabilistic models have been proposed to analyze the behavior of the FSO channel under conditions of turbulence and fog. Turbulence is typically modeled based on its severity using statistical distributions such as the Lognormal, Gamma–Gamma, and Málaga distributions [
10,
11]. These models capture the statistical variation of the intensity of the received signal due to fluctuations in the refractive index. On the other hand, the available literature is limited on the probabilistic modeling of FSO links under fog conditions. In [
12], the authors modeled the FSO channel using the Kumaraswamy distribution, identifying it as a suitable candidate for characterizing attenuation under settled continental fog scenarios. In [
13], the Johnson SB distribution was employed to model signal attenuation under varying fog severity levels, demonstrating its flexibility in capturing different atmospheric conditions.
Despite the growing deployment of FSO systems in regions prone to dust storms, there remains a notable lack of standardized models specifically addressing dust-induced attenuation in optical wireless communication. While standardization bodies such as the International Telecommunication Union Radiocommunication Sector (ITU-R) have published models for attenuation due to fog, rain, and turbulence [
14], these guidelines do not comprehensively account for dust-related impairments in FSO links. This gap poses challenges for system designers who require accurate link budget estimates and risk assessments in dusty environments. By developing a data-driven probabilistic model validated through controlled measurements, this study contributes toward addressing this modeling gap and offers a basis for future standardization efforts.
The propagation challenges faced by FSO links in dusty environments bear a resemblance to those encountered in radio-frequency (RF) systems operating at millimeter-wave and terahertz frequencies. In both domains, particulate matter such as dust alters the propagation characteristics through absorption and scattering, leading to signal attenuation and distortion. In RF systems, especially those operating at millimeter-wave and terahertz frequencies, dust affects propagation through absorption and changes in dielectric properties. Deterministic models such as ITU-R P.840 have been used in RF domains to estimate atmospheric impairments [
15].
In the context of FSO communication, research on modeling the FSO channel under dust storm conditions remains at an early stage. In our previous work [
16], we introduced a deterministic model for FSO link attenuation based on visibility range during dust storms. In a related study [
17], the authors employed radiation propagation theory and the small-angle approximation method to model FSO signal attenuation, concluding that the attenuation follows a negative exponential distribution. While these studies represent important initial steps, they also underscore a significant research gap, highlighting the need for deeper understanding and more comprehensive modeling of the FSO channel under dusty conditions. Probabilistic models are vital, capturing the inherent variability and uncertainty in real-world FSO performance. Unlike deterministic models, which yield average estimates, probabilistic approaches enable system designers to assess risk and design for robust performance under varying atmospheric conditions. We propose developing a probabilistic model based on data collected under controlled environmental conditions. Similar methodologies have proven effective in other domains—such as underwater optical communication and turbulence modeling—where controlled experimental setups were used to establish probabilistic frameworks [
18,
19], further validating the soundness of our approach.
The main contribution of this work is the development of a probabilistic attenuation model for FSO links operating under dust storm conditions. Analyzing empirical histograms and fitting metrics reveals that signal attenuation exhibits statistical variability across different visibility levels. The key contributions are as follows:
Development of a probabilistic model for dust-induced attenuation in FSO communication links, applicable to varying dust storm intensities.
Comprehensive performance evaluation of multiple statistical distributions, showing that the Johnson SB distribution achieves the best fit under dense, moderate, and light dust conditions.
The remainder of the paper is organized as follows:
Section 2 presents the experimental setup and outlines the data collection procedure.
Section 3 discusses the modeling results and provides statistical insights.
Section 4 concludes the paper by summarizing the main findings and outlining directions for future research.
2. Experimental Setup
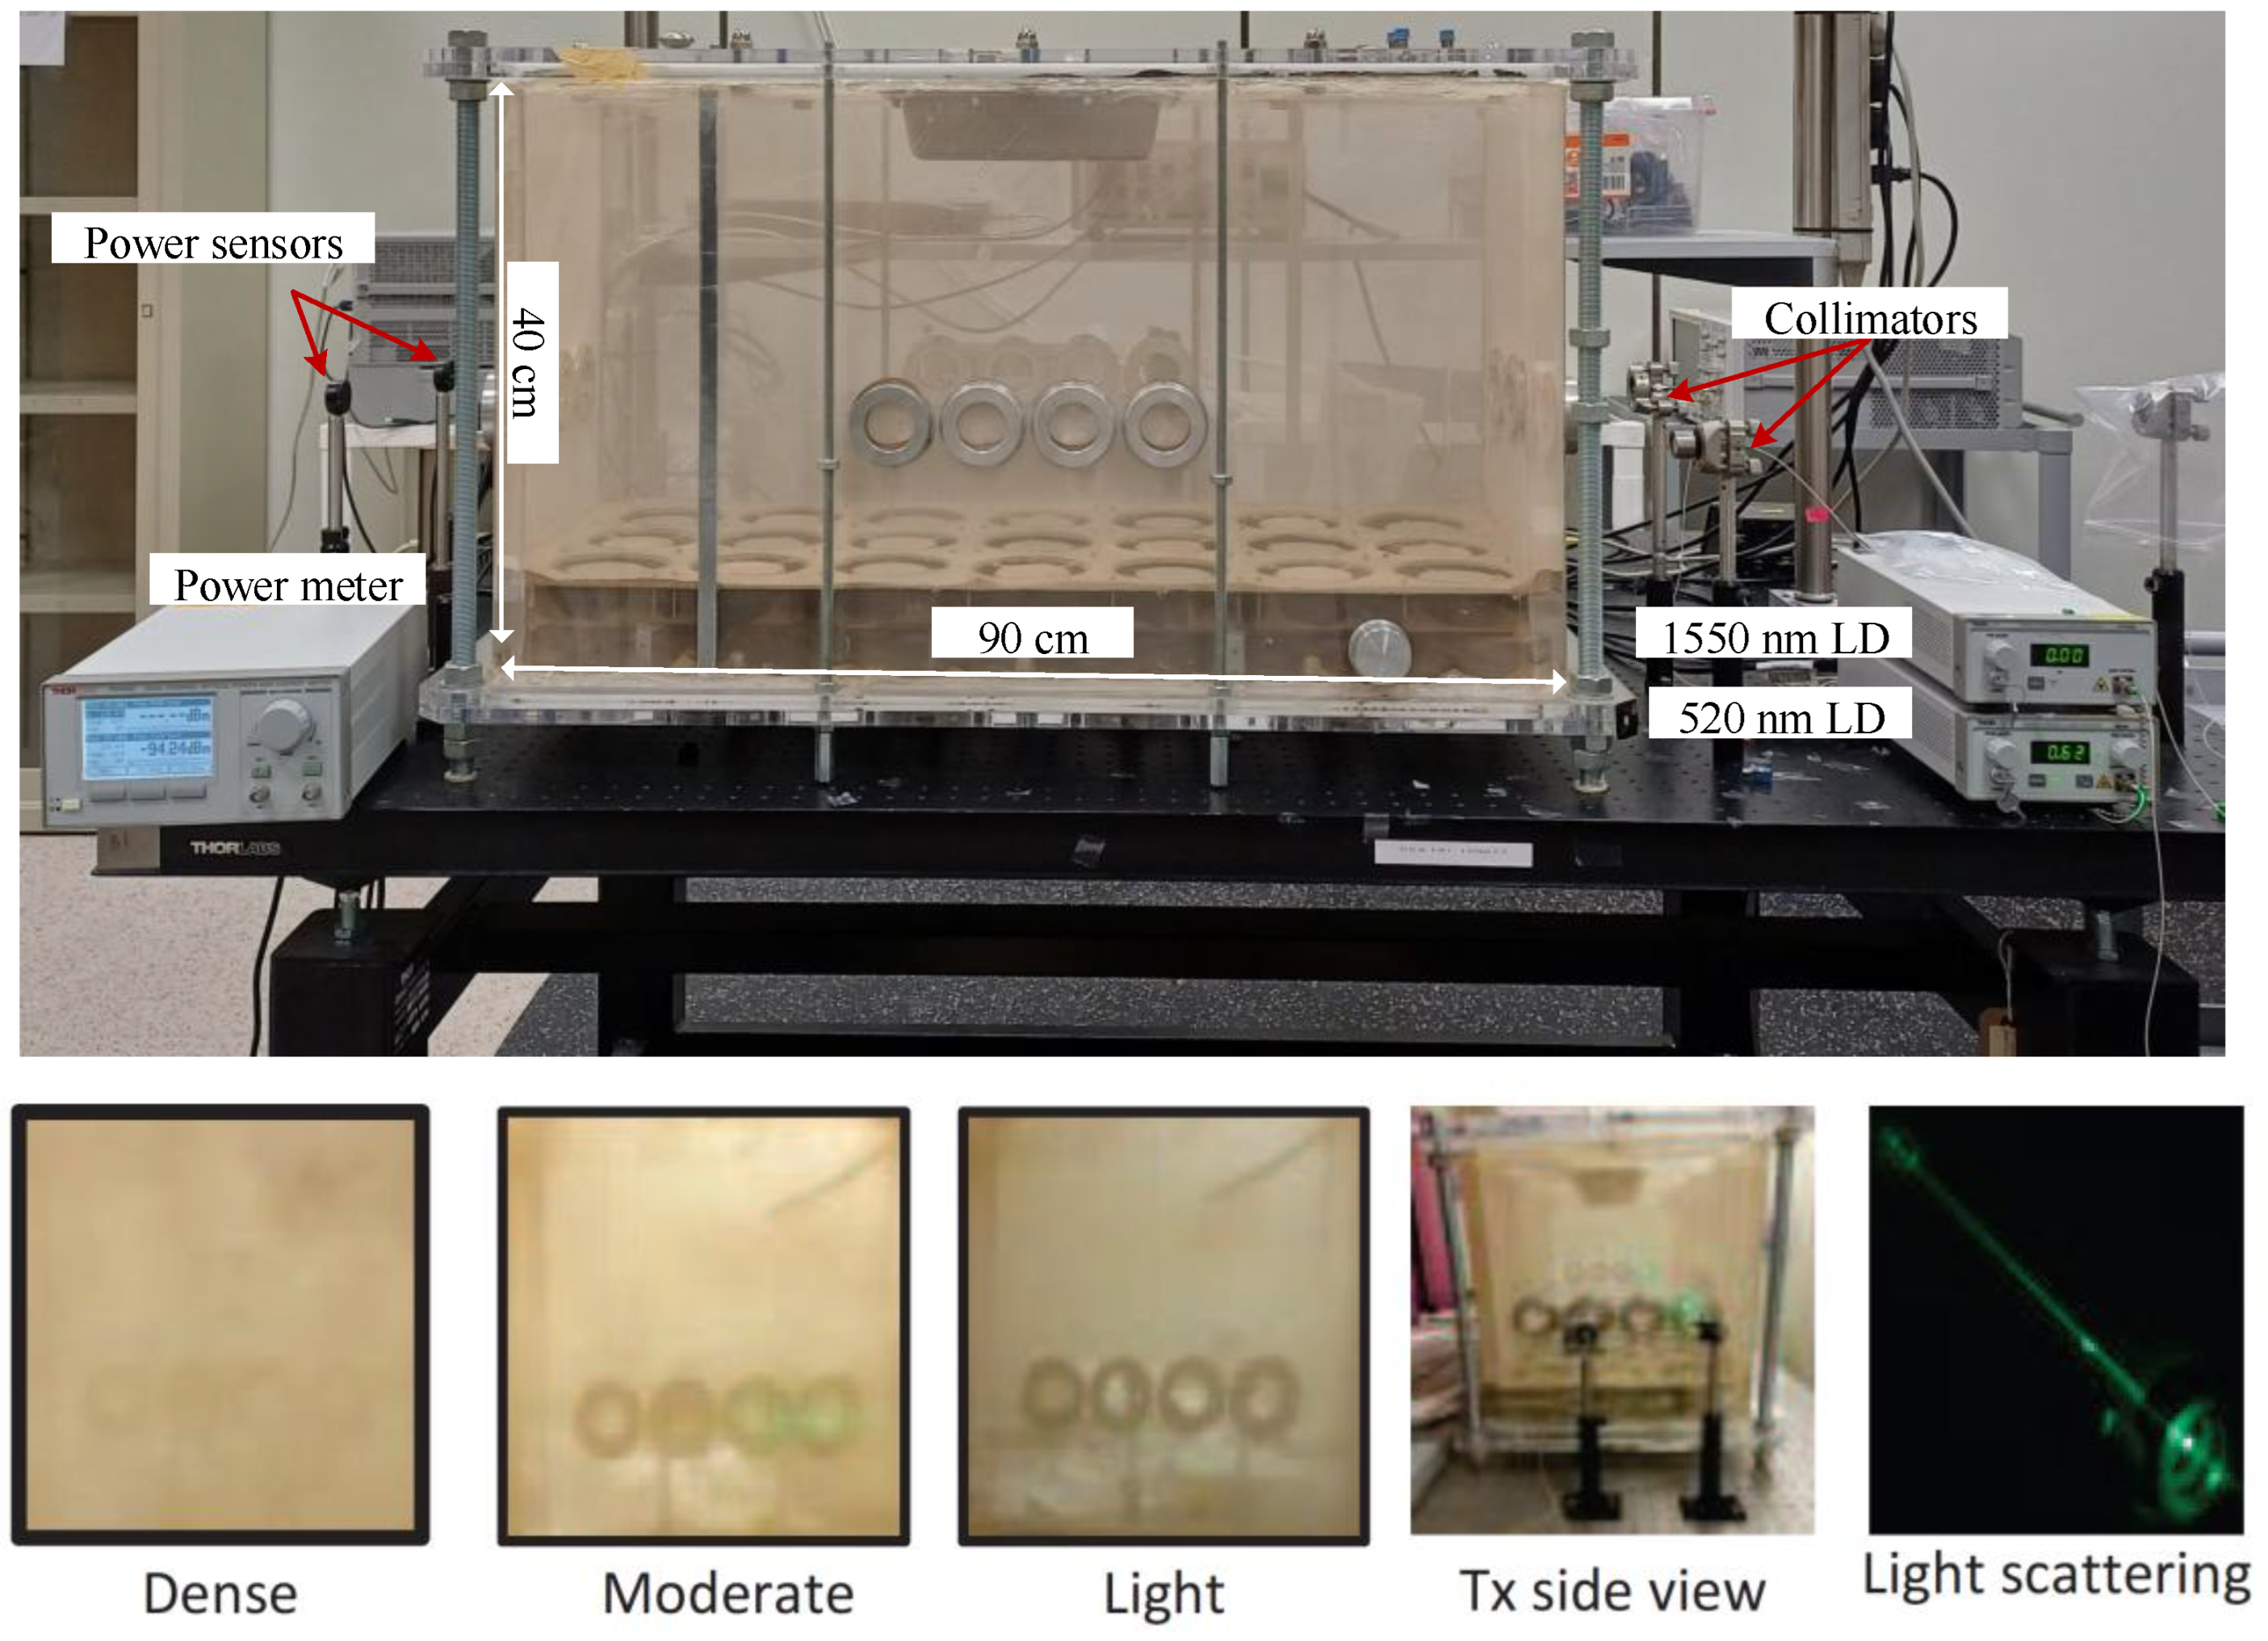
The experimental system consists of a rectangular dust chamber with dimensions of 90 cm × 40 cm × 40 cm, as shown in
Figure 1, designed to emulate dusty atmospheric conditions in a repeatable manner. The dust sample used in this study was collected from a real dust storm event. The particle size distribution was analyzed using a particle size analyzer (SALD 2300, Shimadzu Corporation, Kyoto, Japan), which indicated a Lognormal distribution with a mean diameter of 17.3 µm and a standard deviation of 11.7 µm. Fans were installed to blow up the dust after injection, and uncoated precision windows (with a loss of ∼4% per surface) were used to transmit optical signals. Two single-mode fiber-coupled laser diodes (LDs) were used: a 1550 nm LD (Keysight, Santa Rosa, CA, USA, N7714A) with 4 mW output power for the primary FSO link and a 520 nm Fabry–Pérot LD (Thorlabs, Newton, NJ, USA) for visibility measurements. Each beam was collimated using aspheric lens collimators, and the received optical power was detected using Thorlabs photodiodes (PDs) (S122C for the 1550 nm LD and S120C for the 520 nm LD) with −43 dBm sensitivity connected to a Thorlabs PM320E power meter. The S120C and S122C PD power sensors offer a typical measurement accuracy of
and resolutions of 1 nW and 2 nW, respectively. These specifications, combined with built-in shielding and a large sensor aperture, support high precision and stability in detecting low-power optical signals such as those used in our experiments.
The received signal power was recorded during eight independent measurement sessions, each conducted under identical controlled conditions to ensure consistency. Data acquisition was performed every 0.1 s without applying temporal averaging, which yielded a high-resolution time series that captured the complete decay of airborne dust in the chamber. Each session lasted approximately 40 min, continuing until the particles had settled completely. To eliminate ambient light interference, all experiments were conducted in a dark room. The resulting data were stored in CSV format for further analysis. During preprocessing, a small number of ‘NaN’ (Not a Number), caused by occasional sensor read interruptions, were detected and removed programmatically. These instances were rare and did not affect the overall statistical integrity of the dataset. Additional extreme or aberrant values were not observed. The cleaned dataset was then used for the fitting of the probabilistic distribution and modeling.
The experiments were conducted in a dark room to eliminate ambient light noise. This process was repeated eight times under identical conditions to ensure consistency across measurements and to collect sufficient data for robust probabilistic model fitting. To assess repeatability, we evaluated the attenuation statistics within a fixed visibility bin centered at 500 m (±25 m) across all eight sessions. The specific attenuation values showed consistent behavior across sessions, with mean values ranging from 138.2 to 149.8 dB/km and standard deviations between 14.1 and 16.0 dB/km. These results demonstrate that the measurements remained stable and reproducible under equivalent dust conditions.
The signal attenuation was calculated using the dataset for the 1550 nm FSO link. The severity of dust storms can be classified based on the visibility range, defined as the maximum distance at which objects can be distinguished. Visibility was estimated from the 520 nm measurements and used to classify attenuation into three visibility categories: dense dust (visibility
m), moderate dust (200 m ≤ visibility ≤ 1 km), and light dust (visibility
km). This classification is based on widely accepted meteorological standards and their relevance to real-world dust storm scenarios in arid regions. While particle concentration per unit volume was not directly measured, the visibility-based classification provides a practical proxy for dust density levels in the controlled environment. The visibility range
V under atmospheric conditions can be estimated from the extinction coefficient
and the visual threshold
, as expressed by the following equation [
20]:
The threshold value
is commonly set to 0.02 according to the Koschmieder law. The extinction coefficient
, which characterizes signal loss due to scattering and absorption, is computed using the following equation:
where
T denotes the transmittance of the optical signal and
L (
L = 90 cm in this work) is the physical length of the transmission path.
3. Results and Discussions
The distributions selected for this study—Lognormal, Gamma, Weibull, Exponentiated Gamma, and Johnson SB—were chosen based on their widespread application in modeling positively skewed and bounded physical phenomena, including those in optical and atmospheric communication channels. These distributions provided varying levels of shape flexibility and tail behavior, allowing us to assess their effectiveness in modeling empirical attenuation data under different dust visibility levels [
13,
21,
22]. These distributions are mathematically defined as follows:
Lognormal Distribution [
21,
22]:
where
is the mean and
is the standard deviation of the variable’s natural logarithm.
Gamma Distribution [
23]:
where
is the shape parameter and
is the rate parameter (inverse scale).
Weibull Distribution [
23]:
where
k is the shape parameter and
is the scale parameter.
Exponentiated Gamma Distribution [
24]:
where
a is the rate parameter,
b is the shape parameter, and
c is the exponentiation parameter controlling the tail behavior.
Johnson SB Distribution [
13,
25]:
The Johnson SB distribution, a member of the Johnson system of distributions, has four parameters—shape parameters and and bounded range parameters and —which allow the distribution to model various degrees of skewness and kurtosis flexibly.
A critical parameter in histogram-based probability density function (PDF) fitting is the number of bins used for visualizing and computing the distribution fit. In this study, we selected 75 bins for the dense and light dust data and 60 bins for the moderate dust data. These numbers were empirically determined to balance resolution and noise suppression. Too few bins may smooth out important variations in the data, while too many bins may lead to overfitting or erratic fit quality. The chosen bin numbers produced stable and visually interpretable histograms, facilitating effective model fitting.
Three commonly used statistical metrics were employed to evaluate the accuracy of the distribution fitting to the empirical FSO attenuation data: the RMSE, MAE, and . Additionally, the Log Likelihood (LogL) was included to assess the likelihood of the observed data, thereby providing a probabilistic evaluation of model fit. These metrics are defined as follows:
Root Mean Square Error (RMSE): Measures the square root of the average squared differences between the observed and predicted data values. It is computed as follows:
where
n is the total number of data points,
is the actual (measured) value, and
is the predicted value from the model. A lower RMSE value indicates a better fit. Values approaching zero suggest minimal deviation from the measured data.
Mean Absolute Error (MAE): Computes the average of the absolute differences between the predicted and observed values. It is given mathematically by the following:
where
n is the number of observations,
is the actual (measured) value, and
is the predicted value. Similar to the RMSE, a lower MAE value indicates a better fit. The MAE is generally less sensitive to outliers compared to the RMSE.
Coefficient of Determination (): Reflects the proportion of variance in the observed data that is predictable from the fitted model. It is mathematically defined as follows:
where
n is the number of observations,
is the actual (measured) value,
is the predicted value, and
is the mean of the actual values. An
value close to 1 indicates an excellent fit. Typically, values above 0.90 are considered very good in modeling physical data.
Log Likelihood (LogL): Represents the logarithm of the likelihood function and quantifies how well a statistical model explains the observed data. A higher LogL value indicates a better fit of the model to the data. LogL is mathematically defined as follows:
where
is the PDF evaluated at the observed data
given the model parameter
, and
n is the number of observations.
Using all these metrics provides a more comprehensive evaluation of model performance than relying on a single measure. While the RMSE highlights the presence of large deviations, the MAE offers an intuitive measure of average error, and indicates the proportion of variance explained by the model. LogL reflects the overall likelihood of observing the data under the fitted distribution model. Together, these four metrics ensure a balanced assessment by capturing error magnitude, explanatory power, and statistical likelihood.
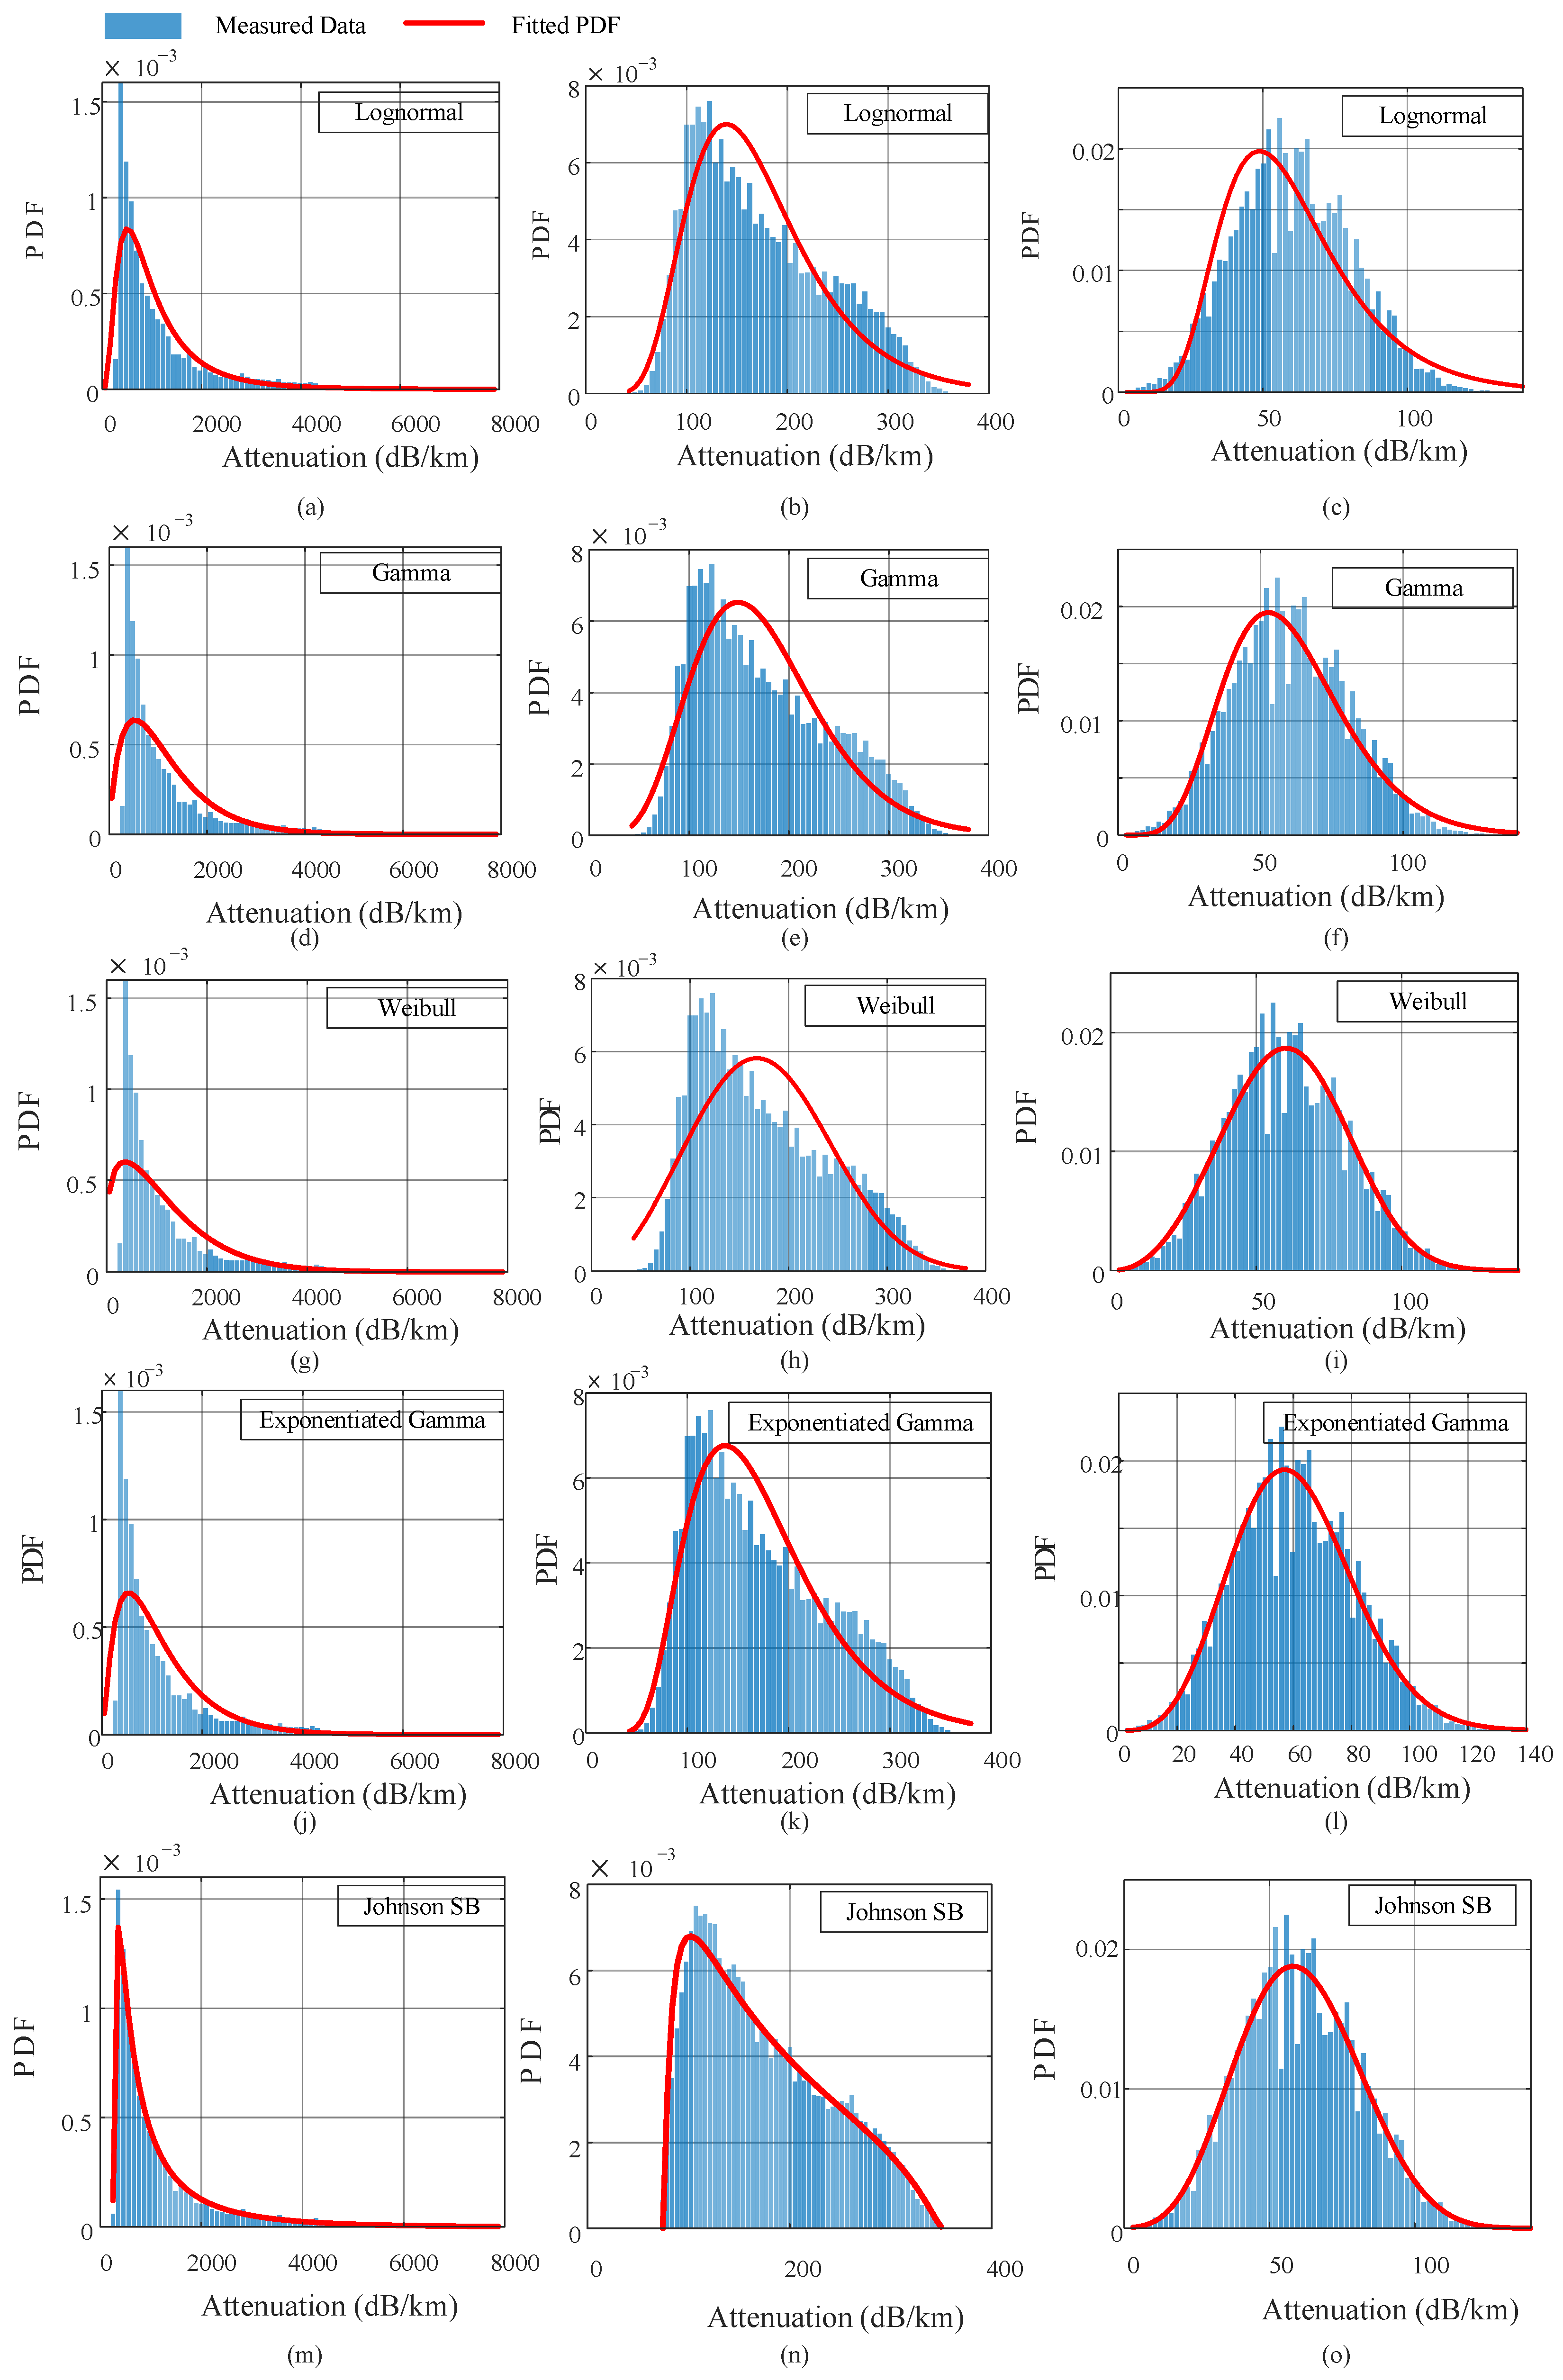
Figure 2 presents the fitted PDFs overlaid on histograms for each dust visibility regime: dense (first column), moderate (second column), and light (third column). In dense dust conditions, most candidate distributions fail to adequately model the sharp peak and long right tail present in the data. The Johnson SB distribution stands out, as it closely follows the measured histogram’s behavior, maintaining alignment across central and extreme attenuation values. In the moderate dust regime, the Lognormal, Gamma, and Johnson SB distributions perform well visually; however, Johnson SB demonstrates a better fit in the central region and avoids the over-smoothing observed in the tails of the others. For light dust, several distributions—including the Weibull, Gamma, and Exponentiated Gamma—exhibit strong visual correspondence with the measured data. However, the Johnson SB again offers the most consistent and balanced representation. These visual comparisons highlight the superior adaptability of the Johnson SB distribution in fitting varying dust conditions, a trend that matches the quantitative goodness-of-fit metrics discussed below.
Table 1 presents the performance metrics—the RMSE, MAE,
, and LogL—for each fitted distribution in the three dust visibility regimes. Among all models, the Johnson SB distribution consistently achieved the best results, with RMSE and MAE values approaching zero and an
under all conditions, indicating excellent agreement with the empirical data. However, under dense dust conditions, the Johnson SB distribution exhibited a more negative LogL value, likely due to its heavy-tailed structure capturing extreme attenuation values, which slightly reduced its statistical likelihood compared to other models in this specific regime.
The Lognormal distribution provided reasonable fits compared to the other distributions, particularly for dense and moderate dust conditions, with values of 0.78 and 0.85, respectively. However, its performance declined under light dust, where the model underestimated the peak of the distribution, resulting in a higher RMSE of 0.0025 and a lower of 0.87 compared to the other models. The LogL for the Lognormal distribution yielded the highest LogL value under dense dust conditions, indicating the best statistical likelihood among all fitted models under dense dust.
Although commonly used for positively skewed data, the Gamma and Weibull distributions demonstrated a moderate performance across all conditions. The Gamma distribution exhibited a stronger fit under light dust (), while the Weibull distribution achieved its best performance under light dust (), albeit with weaker fits in the dense and moderate ranges. They also demonstrated comparable performance in terms of the LogL metric.
The Exponentiated Gamma distribution showed improved flexibility over the standard Gamma, with better fitting under light dust (), although its performance was still below Johnson SB’s in all cases. It achieved a moderate-to-high across conditions. In terms of the LogL test, the Exponentiated Gamma distribution showed the weakest performance among all models.
It is worth mentioning that all data processing and statistical analyses were conducted using MATLAB software, ver. 2022b (MathWorks Inc., Natick, MA, USA).
The flexibility in the Johnson SB distribution enables it to outperform simpler models when fitting attenuation data with sharp peaks and heavy tails. This bounded and highly configurable distribution provides a powerful mechanism to capture the empirical characteristics of attenuation under all observed dust regimes.
Table 2 presents the estimated parameters
,
,
, and
for each visibility condition. These parameters were selected to optimize the fit based on the histogram shape and statistical performance indicators (e.g., the RMSE, MAE, and
). The variation in parameter values reflects the changing statistical nature of the attenuation across different dust levels.
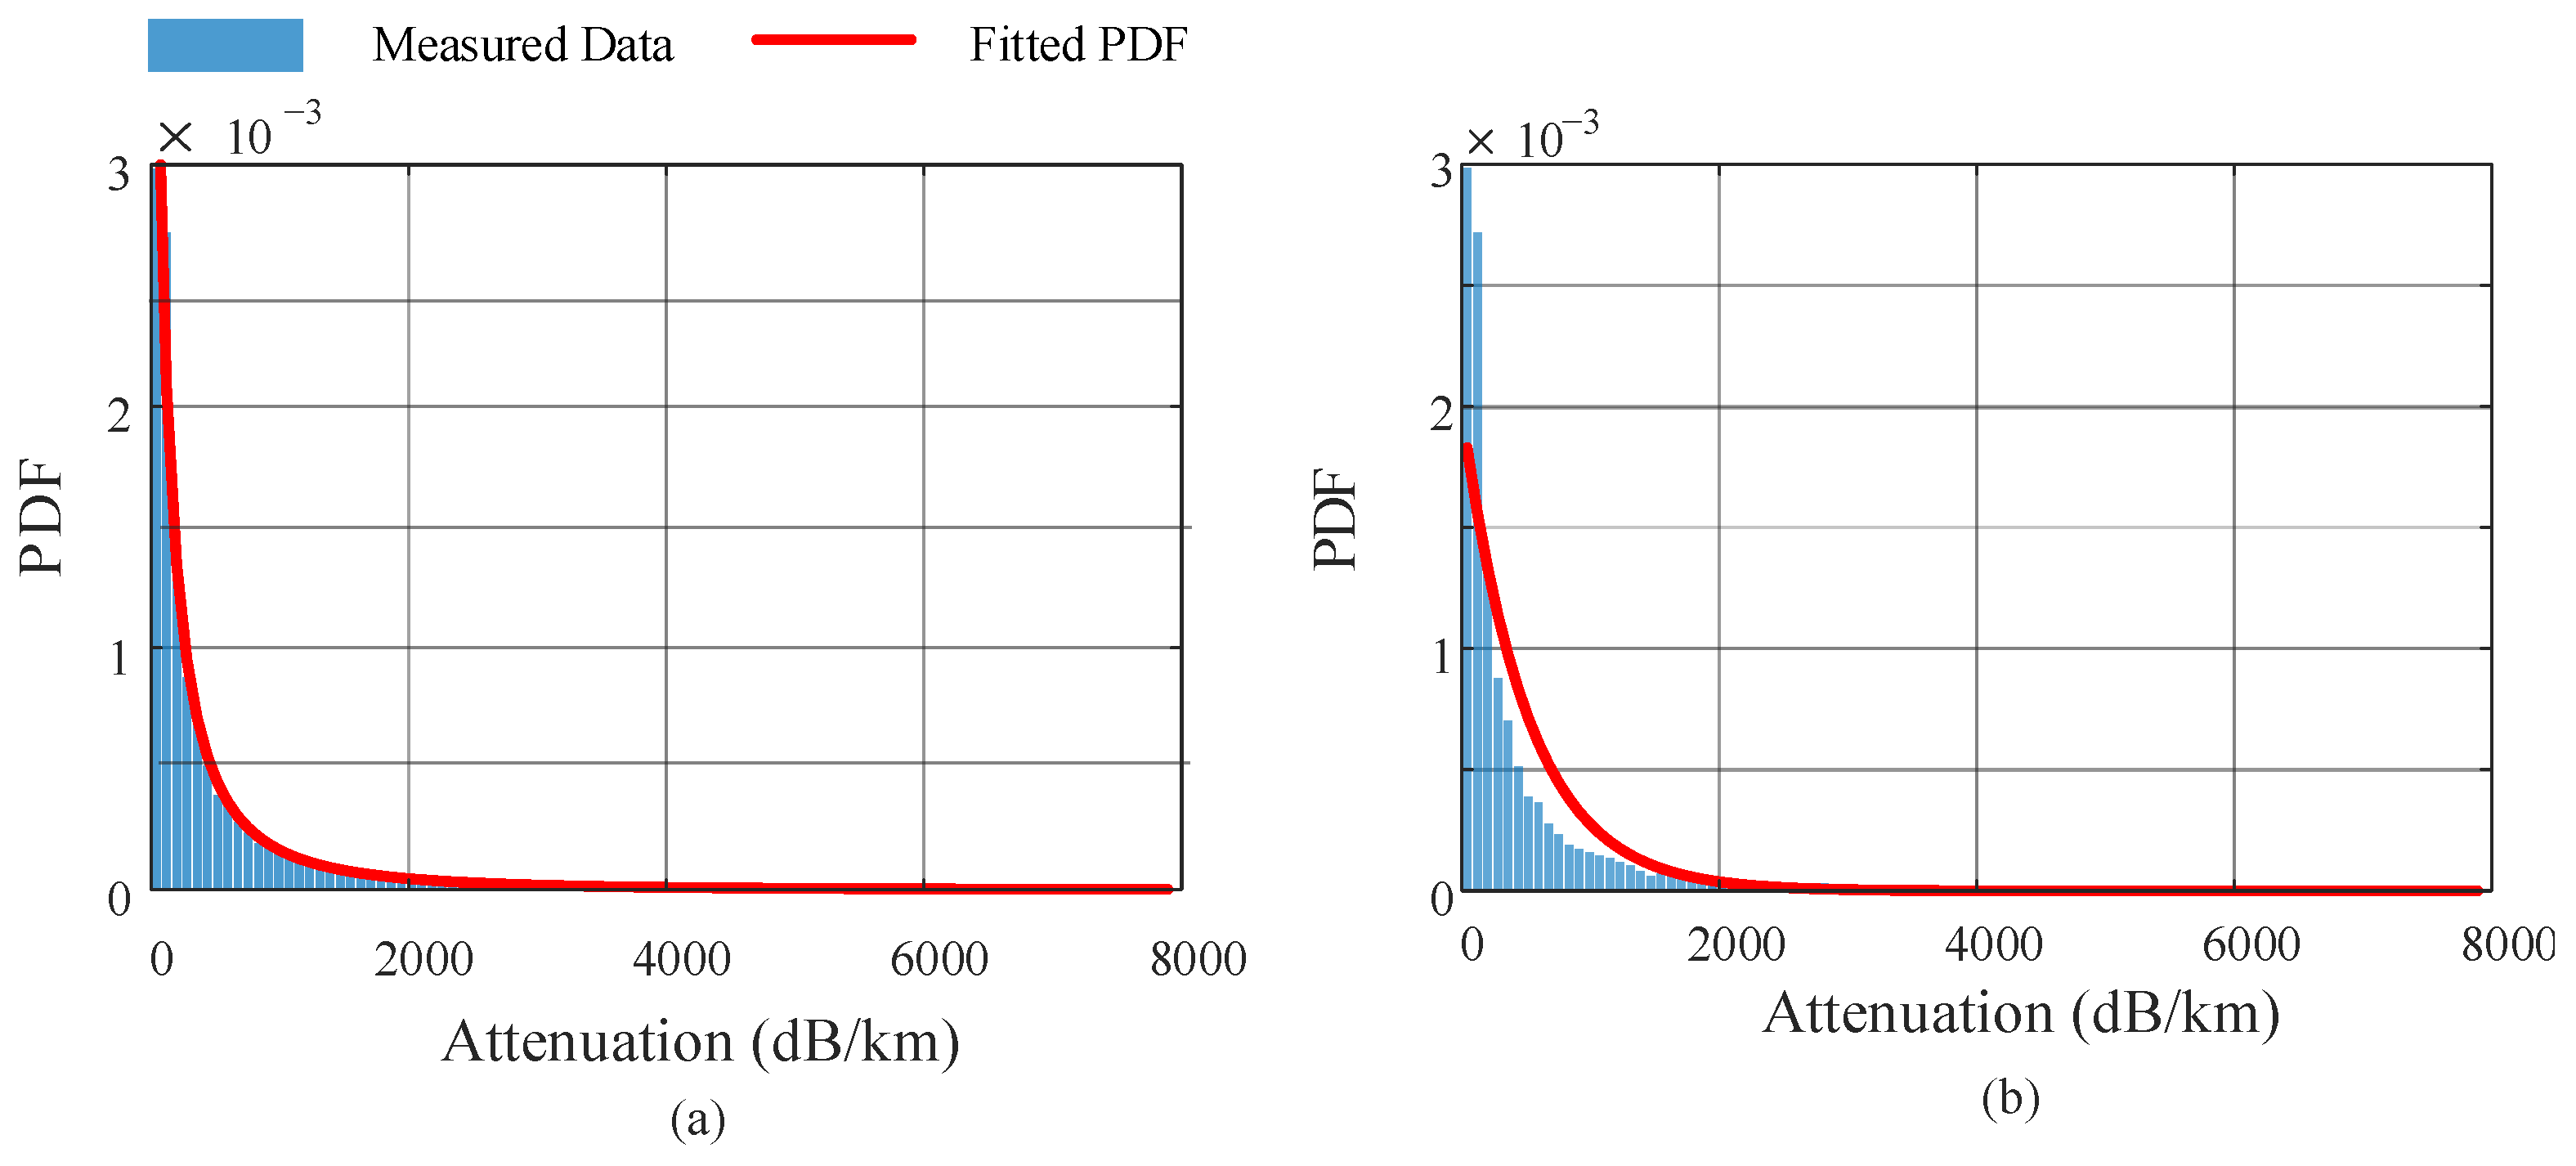
To assess the feasibility of unified probabilistic modeling over the full range of dust-induced attenuation, we fitted the entire dataset without classifying it into discrete visibility regimes. Specifically, we compared the Johnson SB distribution—which demonstrated strong performance in earlier segmented cases—with the negative exponential distribution proposed in [
17].
Figure 3 illustrates the resulting histogram and fitted PDFs for both models using a consistent bin count of 100, which provides a good trade-off between histogram resolution and fitting stability.
The Johnson SB distribution offers a superior visual fit, capturing the sharp peak near the origin as well as the extended heavy tail of the empirical data. In contrast, the negative exponential distribution underestimates the peak and over-smooths the tail, indicating limited flexibility in adapting to skewed and heavy-tailed attenuation data. Quantitatively, although both models yield comparable RMSE and MAE values, the for the Johnson SB distribution reaches 0.95, significantly outperforming the negative exponential model’s . These findings reinforce that the Johnson SB distribution is a more accurate and adaptable choice for modeling FSO attenuation under complex dust conditions across the full visibility spectrum.


