Abstract
In order to deeply investigate the effects of various factors on the shear behavior of RC beams strengthened with fiber-reinforced polymer (FRP) grid–polymer cement mortar (PCM) composite, and to construct a more accurate formula for the shear behavior of reinforced concrete beams, the following work is carried out in this investigation: Firstly, the finite element numerical simulation of FRP grid–PCM composite RC beams model is carried out using ABAQUS and compared with the test results to verify the correctness of the model; then, the effects of the amount of FRP grid reinforcement, the elastic modulus of the FRP grid, the shear span ratio of the beam, the concrete strength, and the shear reinforcement ratio on the shear performance of the strengthened beams are analyzed; finally, based on the effective strain of the FRP grid to quantify its actual shear contribution, a calculation formula of the shear behavior Capacity of RC Beams Strengthened with an FRP grid–PCM composite is proposed. The results show that the model established in this paper can effectively simulate the shear behavior of the beams in the test; additionally, the effects of the amount of FRP grid reinforcement, the shear span ratio, and the concrete strength are more significant. Finally, the theoretical results of the calculation formula fit well with the collected experimental ones.
1. Introduction
Fiber-reinforced polymer (FRP), with its excellent mechanical properties, is widely applied in the repair and reinforcement of bridges and various civil and industrial building projects [1,2]. In the early days, externally bonded FRP strengthening was widely used [3]. However, in practical applications, FRP materials have poor fire resistance, and organic adhesives such as epoxy resin used for external bonding are susceptible to high temperatures, prone to aging, have poor bonding effects with the concrete interface, and are likely to cause peeling failure, resulting in high maintenance costs. To overcome the above drawbacks, scholars have used inorganic materials to replace organic adhesives [4], thus giving birth to Fiber-Reinforced Cementitious Matrix Composite (FRCM). FRCM is a new type of reinforcement material for reinforced concrete structures, which is composed of a fiber fabric grid and a cementitious matrix. It is externally bonded to existing structural members to play roles such as flexural resistance and shear resistance, so as to improve their performance [5]. Among them, the commonly used cement-based matrix is polymer cement mortar (PCM), which is more effective in improving shear strength compared with traditional cement mortar [6].
Shear failure has brittle characteristics and occurs without obvious signs, which needs to be strongly avoided in structural design. The research on the shear behavior of RC beams strengthened with the FRP grid–PCM composite system is still in the development stage in both domestic and international academic circles, and some achievements have been made. Guo et al. [7] conducted an experimental investigation and found that increasing the cross-section area of the FRP grid or reducing its spacing can increase the ultimate load of the beam, but this strengthening effect is not linearly related to the cross-section area or spacing. Then, based on the effective strain of the CFRP grid, a formula for the shear behavior capacity of the strengthened beam was proposed; subsequent research [8] further analyzed and presented a calculation formula that comprehensively considers the shear contributions of the horizontal and vertical grids. The experimental investigation by Azam et al. [9] found that embedding a CFRP in the mortar can effectively improve the shear behavior capacity of the beam. But it will increase the slope of the shear diagonal cracks and fewer stirrups can be crossed by the cracks, reducing the shear contribution of the stirrups. With a sufficient mortar layer covering the grid, the failure mode of the strengthening layer can be transformed into grid fracture. Wakjira et al. [10] conducted an experimental investigation on the shear reinforcement of reinforced concrete deep beams using FRCM of different grid types and found that the shear behavior capacities of beams strengthened with different fabric grids are different, decreasing in the order of carbon fiber, PBO fiber, and glass fiber. The peeling of the composite layer was significantly observed in the first two types of strengthened beams. The investigation by Wang et al. [11] found that the stress characteristics of the horizontal and vertical CFRP grids are similar to those of longitudinal reinforcement and stirrups, respectively, and there is a synergistic effect among them. The experimental investigation by Zheng et al. [12] found that the FRP/ECC composite layer can effectively suppress the formation and development of diagonal cracks in concrete, and as the thickness of the FRP grid increases, both the shear behavior capacity of the strengthened beam and the strain of the FRP grid increase, while as the shear span ratio increases, both the shear behavior capacity and the grid strain decrease. The experimental investigation by He et al. [13] found that the angle between the grid and the axis of the longitudinal beam has an impact on the shear behavior capacity of the reinforcement system, and the arrangement angle of 45° is superior to the 90° arrangement in terms of restricting the development of diagonal cracks and suppressing the degradation of flexural stiffness. Jiang et al. [14] considered the influence of different stirrup spacings and found that as the stirrup ratio increases the ultimate load increases, but the strain of the BFRP grid decreases.
Current studies on the shear performance of reinforced concrete beams strengthened with FRP grid–PCM composites mainly focus on experiments. However, experiments are restricted by numerous conditions and have a cumbersome process. It is difficult to precisely control variables, and conducting large-scale comparative experiments requires a substantial investment of time, effort, and financial resources. In contrast, the finite element method can simulate experimental results with relatively high accuracy. Moreover, parametric analysis and other subsequent research based on it are cost-effective and efficient, making it more convenient to carry out follow-up expandable research [15]. Fang et al. [16] conducted a static performance analysis of the concrete damage plasticity model in ABAQUS and verified that this model can accurately simulate the mechanical properties of concrete materials under various stress states, and can also well predict the flexural and shear properties and failure characteristics of reinforced concrete components. Zheng et al. [12] conducted finite element analysis based on experimental results and confirmed the effectiveness of introducing a cohesive model of bond slip at the interface between the composite strengthening layer and concrete during modeling. Sharifi et al. [17] used finite element software to model and analyze the strengthened beams. After verifying the correctness of the model, they carried out research on the influencing factors of the CFRP grid size. Through comparison, it was found that the difference in the shear behavior capacity between the strengthened beam in the numerical simulation and that in the theoretical model is tiny.
Existing studies have, respectively, considered the influence of various parameters such as the thickness, spacing, and arrangement angle of the FRP grid, the elastic modulus of the FRP grid, the shear span ratio of the beam, the strength of the concrete, and the shear reinforcement ratio of the strengthened beam. For the beam, each part of the system jointly affects the strengthening effect. However, there are numerous influencing factors, the dominant factors are not clear, and there is a lack of comprehensive analysis. Therefore, it is of great significance to make up for the above deficiencies and obtain a more comprehensive and reliable formula for the shear behavior capacity.
This paper uses ABAQUS to conduct numerical simulations of FRP grid–PCM-composite-strengthened RC beams, focusing on the effects of the amount of FRP grid reinforcement, the elastic modulus of the FRP grid, the shear span ratio of the beam, the concrete strength, and the shear reinforcement ratio on the shear performance of the strengthened beams. Based on the effective strain of the FRP grid to quantify its actual shear contribution, a calculation formula of the shear behavior Capacity of RC Beams Strengthened with an FRP grid–PCM composite is proposed, providing a solid theoretical basis for the development of the composite reinforcement technology of this system.
2. Finite Element Modeling and Validation
2.1. Experimental Introduction
In order to investigate the shear behavior of RC beams strengthened with an FRP grid–PCM composite, this paper uses the test beams in Reference [13] for finite element simulation. The loading method, cross-sectional dimensions, reinforcement details, and strengthening positions of the test beams are shown in Figure 1. The strengthening method is to embed the BFRP grid in the PCM and externally bond it to the two side surfaces of the shear span zone of the beam. The cross-sectional dimension of the test beam is b × h = 150 mm × 300 mm, and the effective height is 270 mm, the shear reinforcement ratio is 0.19%, and the thickness of the PCM layer is 20 mm. There are three different shear span ratios of 1.6, 2.0, and 2.4, and the distances from the support to the loading point are 432, 540, and 648 mm, respectively. The naming rule is as follows: C represents the unstrengthened beam, S represents the strengthened beam, and the following number is the shear span ratio. For the strengthened beam, among the subsequent three fields, P refers to PCM, G refers to the grid, and 0 indicates the arrangement angle where the grid is vertically placed. In this section, a total of four beams are simulated, including one unstrengthened beam with a shear span ratio of 2.0 and three strengthened beams with different shear span ratios. The unstrengthened beam is used as a reference to compare and evaluate the performance improvement of the strengthened beams, and the accuracy of its simulation is the key to judging the strengthening effect; the three strengthened beams provide a basis for the subsequent analysis of influencing factors, and the shear span ratio is one of the important parameters in shear research. All the strengthened beams are strengthened with a BFRP grid with a thickness of 5 mm, a width of 10 mm, and a spacing of 50 mm × 50 mm. The mechanical properties of various materials are shown in Table 1.
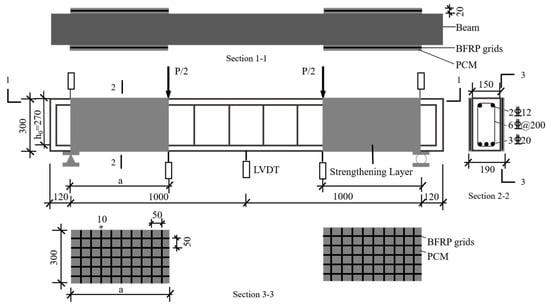
Figure 1.
The dimensions and reinforcement of the test beams.

Table 1.
Mechanical properties of the tested materials.
2.2. Establishment of the Finite Element Model
In this section, the finite element software ABAQUS CAE 2020 is used to numerically simulate the test beam described in Section 2.1.
2.2.1. Material Constitutive Model
When simulating RC beams strengthened with an FRP grid–PCM composite, the constitutive model provided in the Code for Design of Concrete Structures (GB50010-2010) [18] is adopted. Among them, the uniaxial tension constitutive relation of concrete can be determined according to Equations (1) to (4), and the uniaxial compression constitutive relation can be determined according to Equations (5) to (9). The constitutive relation curve is shown in Figure 2. In view of the fact that there is relatively little research on the constitutive relation of PCM, considering that it mainly plays the role of bonding with the FRP grid and transferring forces in the shear span zone, and it belongs to cement-based composite materials just like concrete with similar mechanical properties, the same constitutive model as that of concrete is selected for calculation as follows:
where is the tensile stress of concrete when it reaches ; is the parameter value of the descending branch of the uniaxial tensile stress–strain curve of concrete; is the representative value of the uniaxial tensile strength of concrete; is the peak tensile strain of concrete corresponding to the peak stress; and is the damage evolution parameters of concrete under uniaxial tension as follows:
where is the compressive stress of concrete when it reaches ; is the elastic modulus of concrete; is the parameter value of the descending branch of the uniaxial compressive stress–strain curve of concrete; is the design value of the axial compressive strength of concrete; is the peak compressive strain of concrete corresponding to the peak stress; is the damage evolution parameter of concrete under uniaxial compression; and is the coefficient.
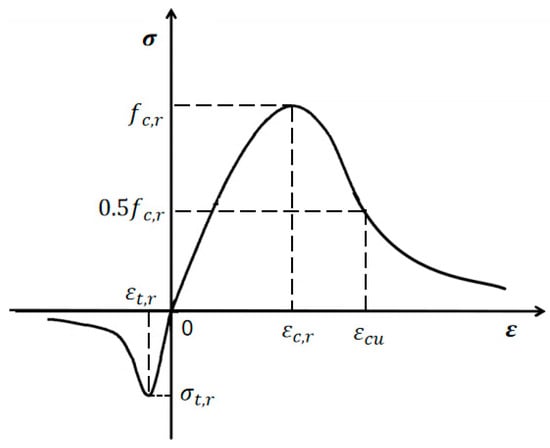
Figure 2.
Stress–strain relation curve of concrete.
To avoid the difficulty in the convergence of finite element calculations caused by stress concentration, which may affect the numerical calculation results, rigid pads are placed at the supports and loading points, respectively, during the modeling process. The rigid pads are set as steel materials, and their stress–strain relationship is regarded as a completely linear elastic relationship. The yield stress is taken as 1000 MPa, and the elastic modulus is the same as that of the steel bars, which is 200 GPa. The steel bars adopt an ideal elastic–plastic model, and its expression and relationship curve are shown in Figure 3a. The FRP grid is an anisotropic material. When it is subjected to forces along the fiber direction, it can be regarded as an ideal linear elastic material. It fails when it reaches the uniaxial ultimate tensile strain. Its expression and relationship curve are shown in Figure 3b.
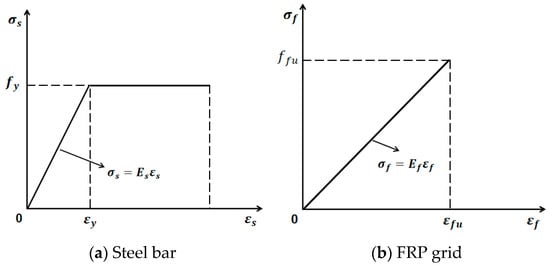
Figure 3.
Stress–strain relation curve of steel bar and the FRP grid.
2.2.2. Bond–Slip Model at the Strengthening Layer–Concrete Interface
The FRP grid and the RC beam achieve bonding and force transfer through the use of polymer cement mortar. Therefore, in the finite element modeling of this section, the FRP grid is embedded in the PCM to form an integral strengthening layer, and the interaction relationship between the two is reflected by adding a bonding layer between the concrete and the strengthening layer. Existing research [19,20] shows that the bilinear bond slip constitutive model has relatively high accuracy in simulating the mechanical response between the strengthening layer and the concrete. Among them, the calculation method of the interfacial bond slip constitutive model proposed by Lu et al. [21] is simple and has a wide application range, and it has been widely used by domestic and foreign researchers. The calculation formulas are shown in Equations (10)–(14), and the relationship curve is shown in Figure 4. In order to represent the above-mentioned bonding layer in ABAQUS, a Cohesive Element component with a thickness of 1 mm is established and placed between the strengthening layer and the concrete, and is tied to both of them using the Tie constraints. To characterize the performance of this bonding layer, it is necessary to determine key parameters such as the interfacial shear stiffness , the maximum interfacial shear stress , the interfacial ultimate slip , or the interfacial fracture energy . They obtained these parameters by substituting the relevant parameters of the test beam into the formula. The interface shear stiffness is the ratio of to , .
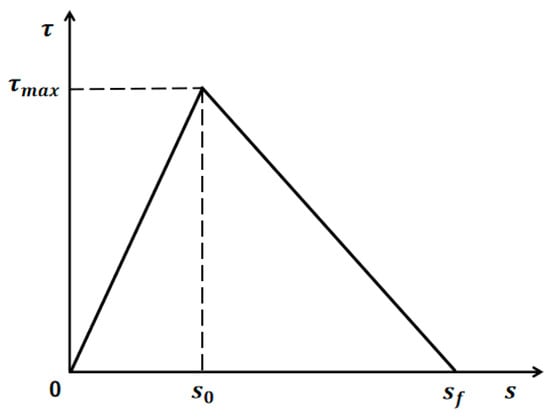
Figure 4.
Constitutive relation of bond slip behavior at the interface.
In the post-processing of ABAQUS, the debonding of the interface is judged by the SDEG (Scalar Stiffness Degradation) in the output file. The value of SDEG generally ranges from 0 to 1. The closer the value is to 1, the more severe the damage degree is. When SDEG is 1, it indicates that debonding has occurred:
where and are the local interfacial shear stress and relative slip; and are the local interfacial shear stress and relative slip; is the corresponding slip when the interfacial shear stress is 0; is the interfacial fracture energy; is the tensile strength of concrete; is the finite element method to calculate the regression parameters, and its value is taken as 1.5; is taken as the width influence coefficient; and and are the width of the FRP grid and the concrete section, respectively.
2.2.3. Modeling Details and Parameter Settings
During modeling, it is assumed that no bond slip occurs at the steel–concrete interface. Rigid pads are set at the supports and loading points. The nodes at the mid-lines of the bottoms of the rigid pads at the lower parts of the left and right sides of the beam are restrained in 5 degrees of freedom (, , , , ) and 4 degrees of freedom (, , , ), respectively, and the deflection-controlled loading mode is adopted. An embedded constraint is used between the steel bars and the concrete; a Tie constraint is used between the pads and the concrete. The rigid pads and the concrete are divided at intervals of 30 mm. The PCM with relatively small dimensions and the bonding layer are divided at intervals of 15 mm. To more clearly demonstrate the stress of the FRP grid, it is divided at intervals of 10 mm. The grid checking function built into ABAQUS shows that the meshing of the simulated beam is reasonable and there are no incorrect elements. The finite element model of the strengthened beam is shown in Figure 5. The concrete, FRP grid, PCM, and pads are all simulated by three-dimensional solid elements with the element type C3D8R; steel bars are simulated by truss elements with the element type T3D2; and a Cohesive Element is used between the concrete and the strengthening layer with the element type COH3D8 (an eight-node three-dimensional bonding element).
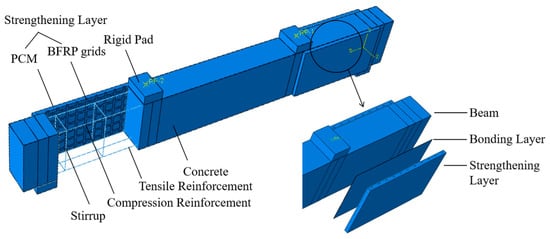
Figure 5.
Finite element model of the reinforced beam.
2.3. Simulation Results and Correctness Verification
To verify the reliability of the finite element model of the test beams in Section 2.1, in this section, the equivalent plastic strain distribution map and the load–midspan deflection curve at the time of simulated beam failure are compared with the test results, as shown in Figure 6 and Figure 7, respectively. The comparison between the shear cracking load, ultimate load, and midspan deflection values of the strengthened beams and the specific test values is listed in Table 2.
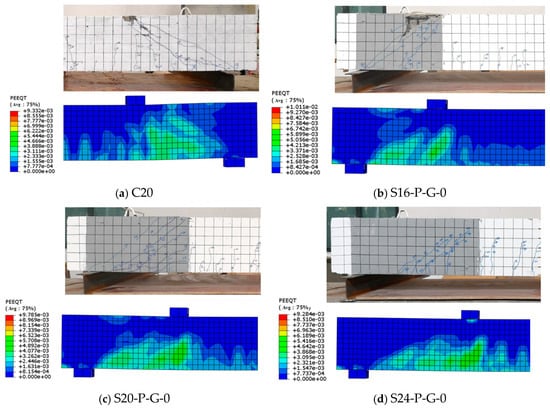
Figure 6.
Equivalent plastic strain distribution map.
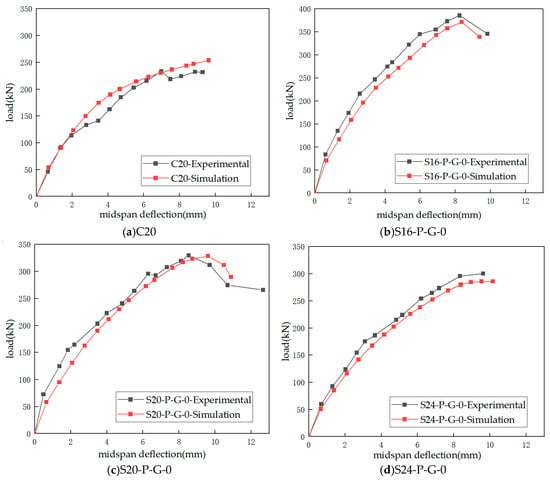
Figure 7.
Load–midspan deflection curve.

Table 2.
Comparison between test results and finite element simulation results.
Both the test beams and the simulated beams suffered shear–compression failure. As can be seen from Figure 6, the equivalent plastic strain of the simulated beam is in good agreement with the distribution and propagation of cracks on the beam surface. Compared with the unstrengthened beam C20, the equivalent plastic tensile strain area in the shear span zone of the strengthened beam is more concentrated and smaller in area. This is because the presence of the FRP grid increases the number of cracks and reduces the crack width and extension height. Therefore, the externally bonded FRP grid–PCM composite layer can effectively inhibit the formation and propagation of cracks during the shear process of RC beams. The strengthened beams with smaller shear span ratios have higher shear resistance and deformation capacity, and there are more diagonal cracks in the shear span zone. Therefore, the corresponding equivalent plastic strain values in the figure are larger and more concentrated in range. Before the final failure of the beam, diagonal shear cracks appear and develop, the equivalent plastic strain of the concrete in the shear span zone increases, and the bonding capacity with the strengthening layer is weakened. These factors jointly lead to the descending section of the load–midspan deflection curve of the strengthened beam.
It can also be seen from Figure 7 that the curve shapes of the four beams are generally consistent with the test results. Compared with the unstrengthened beam, the shear behavior capacities of the strengthened beams are increased to varying degrees, indicating that pasting the FRP grid–PCM composite strengthening layer in the shear span zone can effectively improve the capacity of RC beams. Table 2 shows the comparison between the test results and the finite element simulation results. As the shear span ratio increases, the increases in the ultimate loads of beams S16-P-G-0, S20-P-G-0, and S24-P-G-0 compared with that of C20 gradually decrease. This is because as the distance from the support to the loading point increases, the internal force arm of the bending moment increases, the stress state on the diagonal section of the shear span zone changes, and the compressive stress of the concrete in the shear span zone decreases while the tensile stress increases, resulting in a decrease in the bearing capacity of the beam. The errors between the shear cracking loads, ultimate loads, and the deflections corresponding to the ultimate loads of the specimens and the finite element results are all within 15%, which is within the allowable range. Based on the analysis, the author believes that the reasons for the errors are as follows:
- (1)
- During the numerical simulation, the boundary conditions of the strengthened beam are treated as ideal simply supported, while it is difficult to ensure that the beam is in an ideal simply supported state in the test.
- (2)
- The constitutive relations of materials such as concrete and FRP used in the model are idealized, and there are differences between them and the actual constitutive relations of the materials.
- (3)
- In the actual test, bond slip occurs between the steel bars and the concrete, and the slip also occurs between the FRP grid and the PCM layer, which are not considered in the simulation, leading to errors between the test and the simulation.
Overall, the finite element model established in this paper is feasible, and the calculation results of the model in this paper are safer than the test values. Therefore, in the case of limited experimental research, further analysis of the influencing factors on the shear behavior of RC beams strengthened with FRP grid–PCM composites can be carried out.
3. Analysis of Factors Affecting Shear Behavior of Reinforced Concrete Beams
Considering that finite element simulation can overcome the limitations of cumbersome experimental research processes, as well as large investments in labor, time, and material costs, in this section, the ABAQUS software will be employed to conduct an in-depth investigation into the influence of various parameters on the shear behavior performance of strengthened beams strengthened with the FRP grid–PCM composite system. As described in Section 1, existing experimental studies have shown that the factors affecting the shear behavior of strengthened beams include the thickness, spacing, and arrangement angle of the FRP grid, the elastic modulus of the FRP grid, the shear span ratio of the beam, the strength of the concrete, and the shear reinforcement ratio, etc. Among them, the reinforcement amount and elastic modulus of the FRP grid directly affect the shear behavior capacity it can provide; the shear span ratio will change the failure mode of the beam, thus affecting the shear contribution of the strengthening layer; and the shear resistance of the beam is mainly provided by four parts: concrete, stirrups, FRP grid, and PCM, which influence each other. However, the PCM mainly plays a bonding role, and its shear contribution is less compared with other parts. Based on the feasibility of numerical simulation, this section will focus on studying the influence of the reinforcement amount of the FRP grid, the elastic modulus of the FRP grid, the shear span ratio of the beam, the strength of the concrete, and the shear reinforcement ratio. In order to conveniently refer to each simulated beam and present the variables of each beam, they are uniformly named as “B—variable and serial number”. B represents the beam, R represents the shear span ratio, and R1, R2, and R3 represent the shear span ratios of 1.6, 2.4, and 2.8, respectively; T represents the grid thickness, and the thicknesses of T1–T4 are 4, 3, 2, and 1 mm, respectively; I represents the grid spacing, and the spacings of I1–I4 are 75, 100, 125, and 150 mm, respectively; E represents the elastic modulus of the FRP grid, and the elastic modulus values of E1–E5 are 10, 15, 30, 40, and 50 GPa, respectively; H represents the concrete strength and H1–H3 represent 41, 33, and 29 MPa, respectively; and S represents the shear reinforcement ratio, and S1 and S2 represent the shear reinforcement ratios of 0.15% and 0.13%, respectively. For example, the reference beam S20-P-G-0 is now named B-1. The beam with a grid thickness change of 4 mm compared with the reference beam is named B-T1. The parameters of each simulated beam are summarized in Table 3, and the unstrengthened beam used for comparison is still represented by C20.

Table 3.
Details of tested beams.
Table 3 presents the FRP grid reinforcement amounts of each simulated beam, and its calculation formula is as follows:
where is the total cross-sectional area of all FRP grid limbs; b is the width of the beam; and is the spacing of the FRP grid.
3.1. Effect of the Amount of FRP Grid Reinforcement
3.1.1. Effect of the Thickness of the FRP Grid
To investigate the effect of the thickness of the FRP grid on the shear behavior of strengthened beams, taking the strengthened beam B-1 as the reference, keeping the original parameters unchanged, the FRP grid thickness is changed to 1, 2, 3, 4, 6, and 7 mm. The specific parameters are shown in Table 3. Figure 8 is a comparison diagram of the load–midspan deflection curves of the unstrengthened beam and the strengthened beams with different grid thicknesses. The detailed data and comparison are listed in Table 4. As the thickness decreases, the ultimate load of the strengthened beam gradually decreases, and the effective strain of the FRP grid increases significantly, which intuitively reflects that the thickness is positively correlated with the shear behavior capacity and negatively correlated with the grid strain. Compared with the reference beam B-1, for beam B-T3, the grid reinforcement amount decreases from 1.33% to 1.07%, a reduction of 20%, and the ultimate bearing capacity only decreases by 4.43 kN, while the grid effective strain changes from 0.0054 to 0.0083, an increase of 54%, indicating that the grid efficiency of beam B-T3 is more fully exerted. It can be clearly seen from Figure 8 that beams B-T5 and B-T6 have poor overall ductility, and there is no descending section in the load–deflection curve. The author believes that the possible reasons are as follows. First, Section 2.3 determined that the appearance and development of diagonal shear cracks will increase the plastic strain of the concrete in the shear span zone, and the bonding ability with the strengthening layer will be weakened, resulting in a descending section in the load–midspan deflection curve. The presence of the FRP grid will increase the number of cracks, and reduce the crack width and extension height, and the larger the reinforcement amount, the more obvious this effect is, that is, the more obvious the descending section is. As the thickness decreases, the failure characteristics of the strengthened beam and the corresponding failure curves gradually approach those of the unstrengthened beam. This trend provides an explanation for the differences in the curves in Figure 8: when the load reaches about 200 kN, that is, close to the ultimate load level of the unstrengthened beam, the curves show obvious divergence.
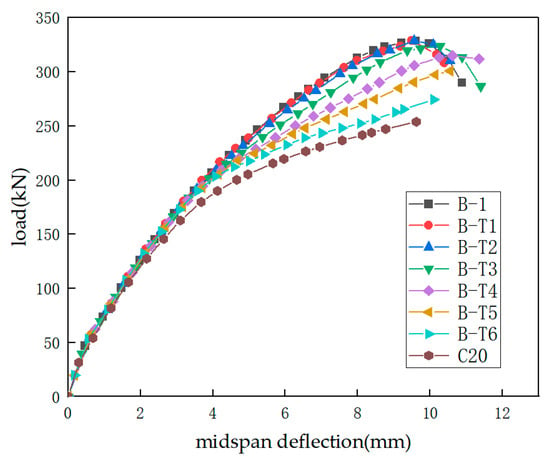
Figure 8.
Effect of FRP grid thickness.

Table 4.
Effect of FRP grid thickness on reinforced beams.
3.1.2. Effect of the Spacing of the FRP Grid
To investigate the effect of the spacing of the FRP grid on the shear behavior of strengthened beams, taking the strengthened beam B-1 as the reference, keeping the original parameters unchanged, the spacing was adjusted to 75, 100, 125, and 150 mm. The specific parameters are shown in Table 3. Figure 9 is a comparison diagram of the load–midspan deflection curves of the unstrengthened beam and the strengthened beams with different grid spacings. The detailed data and comparison are listed in Table 5. As the grid spacing increases, the ultimate load of the strengthened beam gradually decreases and the effective strain of the FRP grid increases significantly, which intuitively reflects that the spacing is negatively correlated with the shear behavior capacity and positively correlated with the grid strain. Compared with the reference beam B-1, the reinforcement amount of beam B-I1 decreased from 1.33% to 0.89%, a reduction of 33%, and the ultimate bearing capacity only decreased by 6.3 kN, while the effective strain increased from 0.0054 to 0.0104, an increase of 93%, indicating that the grid efficiency of beam B-I1 was more fully exerted. In Figure 9, except for beams B-1 and B-I1, the beams have obvious descending sections. The author believes that the reason is the same as that in Section 3.1.1. As the spacing increases, the failure characteristics of the strengthened beam and the corresponding failure curves gradually approach those of the unstrengthened beam. When approaching the ultimate load value of the unstrengthened beam, there is a clear divergence in the load–midspan deflection curves.
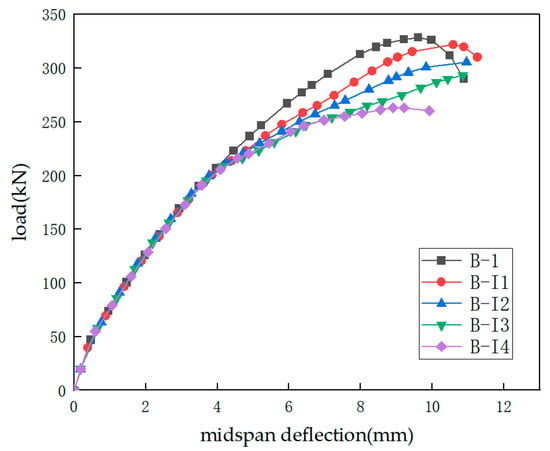
Figure 9.
Effect of FRP grid spacing.

Table 5.
Effect of FRP grid spacing on reinforced beams.
3.1.3. Summary of the Effect of Strengthening Amount
According to the FRP grid reinforcement amount calculation, Formula (16), , given in Section 2, when the number of layers is 1, thus n = 1. The reinforcement amounts of beam B-T5 are a grid thickness of 2 mm, a width of 10 mm, and a spacing of 50 mm. The reinforcement amounts of beam B-I3 are a grid thickness of 5 mm, a width of 10 mm, and a spacing of 125 mm. Their reinforcement amounts are all 0.53%. As described in Section 3.1.1 and Section 3.1.2, the shear behavior capacity of beam B-I3 is 5.23% lower than that of beam B-T5. Thus, under the condition of the same reinforcement amount, the beam B-T3 with a smaller thickness and a smaller spacing has a higher shear behavior capacity. It can be inferred that the combination of a small thickness and a small spacing contributes more to the shear behavior capacity of the strengthened beam. The author believes that the possible reason is that when the grid spacing is smaller, the probability of the cracks at the bottom of the beam encountering the grid during the expansion process increases significantly, increasing its utilization rate, which can more effectively delay the crack expansion and, to a certain extent, enhance the stiffness and bearing capacity of the beam. It is also found from the charts in the previous two sections that as the reinforcement amount increases, the shear behavior capacity of the strengthened beam gradually increases. However, this enhancement effect is not completely linear. When the reinforcement amount has reached a certain value, that is, about 1.33%, further increasing the thickness will result in an increase rate of the beam’s shear behavior capacity within 1%.
3.2. Effect of the Elastic Modulus of the FRP Grid
To investigate the effect of the elastic modulus of the FRP grid on the shear behavior of strengthened beams, taking the strengthened beam B-1 as the reference, keeping the original parameters unchanged, the elastic modulus was changed to 10, 15, 30, 40, and 50 GPa. The specific parameters are shown in Table 3. The elastic modulus of the FRP grid described in this paper refers to the elastic modulus of the FRP grid calculated based on the cross-sectional area of a single limb, rather than the elastic modulus of the FRP material. Figure 10 is a comparison diagram of the load–midspan deflection curves of the strengthened beams under different elastic modulus values. The detailed data and comparison are listed in Table 6. As the elastic modulus increases, the ultimate load of the strengthened beam increases slightly, and the effective strain of the FRP grid decreases significantly, which intuitively reflects that the elastic modulus of the grid is positively correlated with the shear behavior capacity and negatively correlated with the grid strain. Further analysis shows that when the elastic modulus increases, the grid stiffness increases and its ability to resist deformation improves. Therefore, the overall stiffness of the strengthened beam is enhanced, and at the same time, the ductility of the beam deteriorates, and the midspan deflection at failure becomes smaller. Compared with the reference beam B-1 with an elastic modulus of 21 GPa, the strengthened beams B-E2, B-E3, and B-E4 with an elastic modulus of 15, 30, and 40 GPa in Table 6 have a change rate of the ultimate load less than 1%, but the change in the grid effective strain is relatively significant, ranging from 10% to 40%. This indicates that, under the same shear behavior capacity level, choosing a more suitable elastic modulus, that is, a more appropriate type of FRP, can increase its utilization rate.
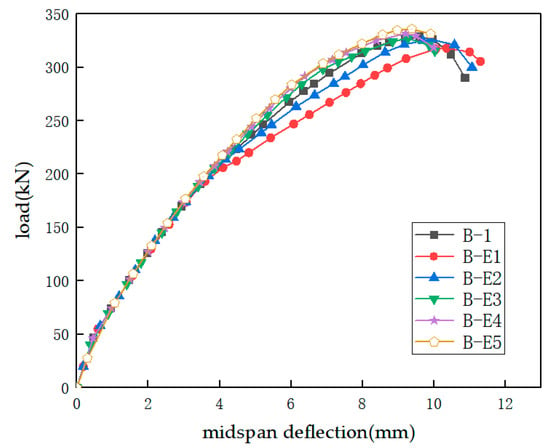
Figure 10.
Effect of FRP elastic modulus.

Table 6.
Effect of FRP elastic modulus on reinforced beams.
3.3. Effect of the Shear Span Ratio
In Section 1, the test beams with shear span ratios of 1.6, 2.0, and 2.4 were simulated. To further investigate the effect of the shear span ratio on the shear behavior of strengthened beams, taking the strengthened beam B-1 as the reference, keeping the original parameters unchanged, the shear span ratio of the beam is adjusted to 2.8, that is, a = 756 mm. The parameters of the relevant specimens are shown in Table 3. Figure 11 is a comparison diagram of the load–midspan deflection curves of the strengthened beams under different shear span ratios. The detailed data and comparison are listed in Table 7. As the shear span ratio increases, the ultimate load of the strengthened beam decreases significantly, and the effective strain of the FRP grid also decreases, which intuitively reflects that the shear span ratio is negatively correlated with both the shear behavior capacity and the grid strain. The failure mode of beam B-R3 is different from the shear compression failure of other beams, and it changes to the typical compressive concrete crushing failure in the compression zone. It can be clearly seen in Figure 11 that for beams B-R2 and B-R3 with shear span ratios of 2.4 and 2.8, there is no obvious descending section in the load–midspan deflection curve. The author believes that as the shear span ratio increases, the failure mode of the strengthened beam gradually begins to change, and the failure position shifts from the shear span zone to the vicinity of the midspan loading point, that is, the position without FRP grid reinforcement, and the shear contribution of the grid decreases. The longitudinal tensile reinforcement reaches its yield strength before the stirrups so that the effect of the stirrups cannot be fully exerted. As the load increases, the compressive strain of the concrete at the top of the beam increases rapidly, and finally, the concrete is crushed and the beam reaches its ultimate bearing capacity.
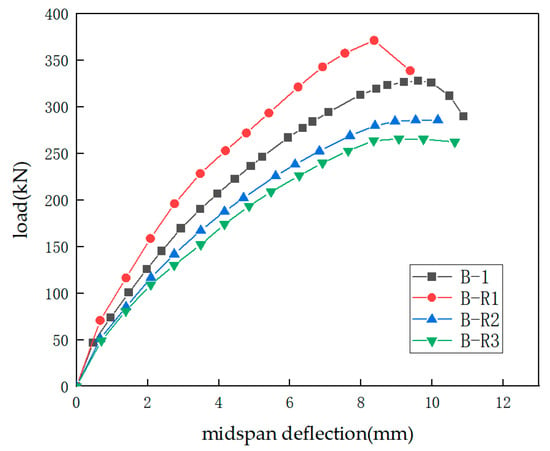
Figure 11.
Effect of shear span ratio.

Table 7.
Effect of shear span ratio on reinforced beams.
3.4. Effect of the Concrete Strength
To investigate the effect of the concrete strength on the shear behavior of strengthened beams, taking the strengthened beam B-1 as the reference, and keeping the original parameters unchanged, the concrete strength was adjusted to 29, 33, and 41 MPa. The parameters of the relevant specimens are shown in Table 3. Figure 12 is a comparison diagram of the load–midspan deflection curves of the strengthened beams under different concrete strengths. The detailed data and comparison are listed in Table 8. As the concrete strength increases, the ultimate load of the strengthened beam increases, and the effective strain of the FRP grid increases, which intuitively reflects that the concrete strength is positively correlated with both the shear behavior capacity and the grid strain. Before the shear cracking of the strengthened beam, the stiffness of each simulated beam is basically the same, and the curves have a high degree of coincidence. After shear cracking, the curves begin to diverge. With the increase in the concrete strength, the stiffness of the beam increases, the effect of resisting shear force is enhanced, the appearance and development of flexural cracks and diagonal cracks are slowed down, and both the slope and the peak value of the curves increase. It can also be found from Figure 8 that the midspan deflections of the four simulated beams at failure are basically the same, indicating that the concrete strength has little effect on the ductility of the strengthened beam.
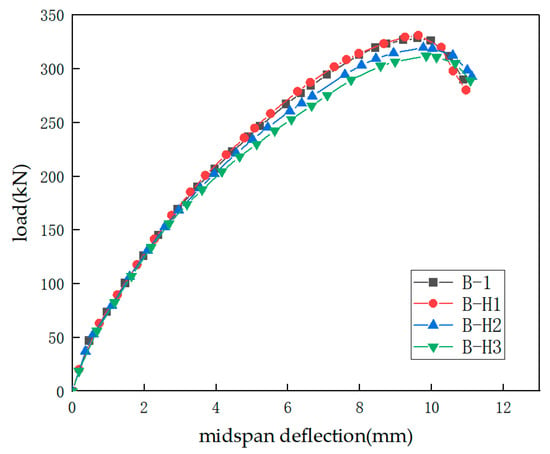
Figure 12.
Effect of concrete strength.

Table 8.
Effect of concrete strength on reinforced beams.
3.5. Effect of the Shear Reinforcement Ratio
To investigate the effect of the shear reinforcement ratio on the shear behavior of strengthened beams, taking the strengthened beam B-1 as the reference, keeping the original parameters unchanged, the stirrup spacing was adjusted to 250 and 300 mm, with the corresponding reinforcement ratios being 0.15% and 0.13%. The parameters of the relevant specimens are shown in Table 3. Figure 13 is a comparison diagram of the load–midspan deflection curves of the strengthened beams under different shear reinforcement ratios. The detailed data and comparison are listed in Table 9. As the ratio increases, both the ultimate load of the strengthened beam and the effective strain of the FRP grid increase slightly, which intuitively reflects that the shear reinforcement ratio is positively correlated with both the shear behavior capacity and the grid strain. When the stirrup spacing decreases and the reinforcement ratio increases, the range of restraining diagonal cracks becomes larger, which can better delay the appearance and expansion of diagonal cracks. Compared with the reference beam B-1 with a shear reinforcement ratio of 0.19%, for beams B-S1 and B-S2 with ratios of 0.15% and 0.13%, the ultimate loads decrease by 2.37% and 4.51%, respectively. Thus, it can be seen that the influence of the shear reinforcement ratio on the shear behavior capacity of the strengthened beam is indeed smaller compared with that of the shear span ratio and the concrete strength. However, the grid strain change rates of beams B-S1 and B-S2 are −7.85% and −13.03%, respectively, indicating that the reinforcement ratio has a certain influence on the effective strain of the FRP grid, which cannot be ignored. Therefore, to ensure the correctness and practicality of the effective strain formula derived later, its effect should be taken into account.
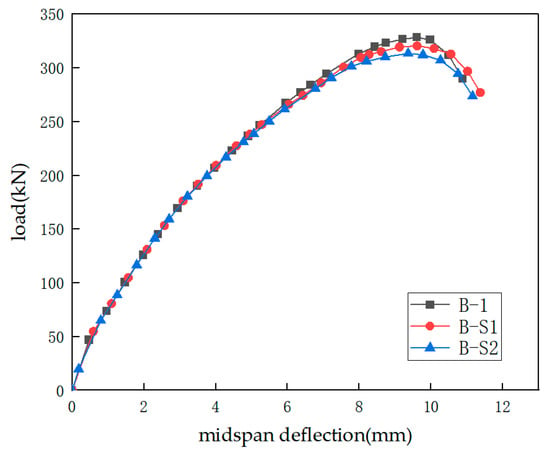
Figure 13.
Effect of shear reinforcement ratio.

Table 9.
Effect of shear reinforcement ratio on reinforced beams.
3.6. Summary
In this section, the shear behavior of strengthened beams under the influence of factors such as the amount of FRP grid reinforcement, the elastic modulus of the FRP grid, the shear span ratio of the beam, the concrete strength, and the shear reinforcement ratio is studied in detail. An increase in the FRP grid thickness or a decrease in the grid spacing will increase the reinforcement amount, leading to an increase in the shear behavior capacity of the strengthened beam and a decrease in the effective strain of the FRP grid, but the influencing effect will gradually weaken. When the reinforcement amount is constant, the combination of small thickness and small spacing is more effective in increasing the shear behavior capacity. As the elastic modulus of the FRP grid increases, the overall stiffness of the beam increases, the ductility decreases, the ultimate load increases slightly, and the effective strain of the FRP grid decreases significantly. As the shear span ratio increases, the stiffness of the beam decreases, and both the shear behavior capacity and the effective strain of the FRP grid decrease. An increase in the concrete strength and the shear reinforcement ratio can both increase the shear behavior capacity and the effective strain of the FRP grid, but the influencing effect of the latter is relatively small.
Based on the analysis of the influencing effects of the above factors, it is clear that they have significant impacts on the shear behavior capacity of the strengthened beam and the effective strain of the FRP grid, which provides an important basis for deriving the formula for the effective strain of the FRP grid and the calculation formula for the shear behavior capacity of the beam.
4. Calculation Formula of Shear Behavior Capacity
In Section 3, an in-depth investigation was conducted on the influence of multiple factors on the shear behavior of strengthened beams. Through the analysis of the finite element model, it was found that these factors are closely related to the strain of the FRP grid. The stress distribution and deformation capacity of the FRP grid under stress have a significant impact on the shear contribution of the composite strengthening system. So far, based on the research on the calculation models and methods of shear behavior capacity, scholars from various countries have proposed a variety of theoretical models. Among them, the truss model is the most widely used due to its clear mechanical model, simple calculation, and good universality. China’s structural design code [18] also adopts this model, calculating the shear behavior capacity of the inclined section of the beam as the superposition of the shear contributions of concrete and stirrups. This model is also applicable to RC beams strengthened with FRP grid–PCM composites, and the shear behavior capacity is calculated as the superposition of the shear contributions of concrete, stirrups, the FRP grid, and PCM. Currently, the basic forms used to calculate the behavior capacity of beams shear-strengthened with FRP grids are quite similar. This paper refers to the calculation formula proposed in the ACI 440.2R-08 code [22] to quantify the contribution of the FRP grid in the shear process. Section 2.2.1 analyzes that both the PCM and concrete belong to cementitious composite materials. Therefore, the calculation method used for the shear resistance contribution of the PCM is the same as that for concrete. Due to the unclear influence mechanism of FRP strengthening on the shear contributions of concrete and stirrups and the limited research on quantifying the shear contributions of each part of the original beam, the shear contribution of the original beam in this paper is still calculated according to China’s code.
Based on the above analysis, in this section, a mathematical model of the effective strain of the FRP grid is established using regression analysis. Then, this model is substituted into the ACI 440.2R-08 code to quantify the shear contribution of the FRP grid. Finally, combined with the shear contributions of other parts, the shear behavior capacity formula for RC beams strengthened with FRP grid–PCM composites is derived, aiming to provide an accurate theoretical basis for practical engineering applications.
The ACI 440.2R-08 code gives the calculation formula for the shear contribution of externally bonded FRP materials based on the effective strain theory:
where is the shear behavior capacity of the FRP grid; is the total cross-sectional area of all FRP grid limbs, ; is the number of grid layers; is the grid thickness; is the width of a single grid limb; is the effective stress of the FRP grid; , is the effective strain of the FRP grid, that is the strain of the FRP grid when a failure occurs during strengthening; is the angle between the main stress-bearing direction of the FRP grid and the axis of the beam; is the effective height of the FRP grid, and the effective height of the beam is selected; and is the spacing of the FRP grid.
The calculation expression for the shear behavior capacity of the strengthened beam is obtained by superimposing the shear contributions of concrete, PCM, stirrups, and the FRP grid as follows:
where and are the cross-sectional width and effective height of the beam, respectively; and are the cross-sectional width and effective height of the PCM, respectively. Let be taken as ; and is the tensile strength of concrete and PCM; is the tensile strength of stirrups; and and s are the cross-sectional area and spacing of stirrups.
Based on the model of the RC beam specimen strengthened with the FRP grid–PCM composite established in this paper, finite element analysis was carried out by taking the research content in Chapter 3 as the variable parameters. Through the regression analysis of the strain data of the FRP grid in the model, it was found that there is a power function relationship between the FRP grid and the combination of concrete strength, the shear reinforcement ratio, shear span ratio, grid spacing and thickness, and grid elastic modulus. The fitting process is shown in Figure 14 to determine the coefficients A and B. Therefore, the effective strain of the FRP grid can be calculated by Equation (19). The value of is 0.944, the value of A is 75.410, and the value of B is 0.856. All the above coefficients are retained in three significant figures.
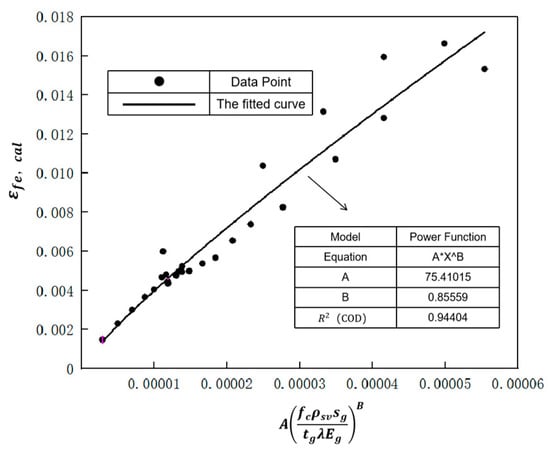
Figure 14.
Regression analysis of the effective strain of the FRP grid.
The expression for the FRP effective strain is as follows:
where is the compressive strength of concrete, with the unit of ; is the shear reinforcement ratio; is the spacing of the FRP grid, with the unit of mm; is the thickness of the FRP grid, with the unit of mm; λ is the shear span ratio of the beam; and is the elastic modulus of the FRP grid, with the unit of . When using the above formula for calculations, each variable should be directly substituted into the formula with the specified units, and no unit conversion is required.
In this paper, a total of 25 beams were simulated. Among them, 24 beams suffered from shear–compression failure and 1 beam experienced concrete crushing failure. Since this paper mainly focuses on the shear resistance performance of beams, when deriving the formula for the shear resistance bearing capacity of reinforced concrete beams strengthened with FRP grid–PCM composite materials, the beams that suffered shear failure were selected as the research objects for data fitting. Therefore, this formula is mainly applicable to beams that have undergone shear failure. For beams exhibiting the concrete crushing failure mode, due to the significant difference in their stress mechanism from shear failure, when applying this formula, it is recommended to carefully evaluate the adaptability between their failure characteristics and the applicable conditions of the formula in combination with specific engineering conditions.
To verify the rationality of the shear behavior capacity formula established in this paper, this study collected multiple groups of experimental data of RC beams strengthened with FRP grids from domestic and international academic circles, and compared the experimental values with the calculated values from the formula. Standards for selecting test beams for verification: To ensure consistency with the research objects of this paper, all test beams were reinforced concrete beams strengthened with FRP grids. Secondly, specimens with complete relevant test data were preferentially selected to ensure accurate calculations. In addition, the test results of scholars at home and abroad were taken into account to ensure the breadth and diversity of data sources, thus enabling a more comprehensive verification of the rationality of the formula. Table 10 presents a comparison between the calculated values from the effective strain formula and shear capacity formula proposed in this study against the experimental values of specimens reported in the relevant literature. Three statistical measures, namely the mean value of the ratio, the standard deviation, and the coefficient of variation, were selected to evaluate the fitting results. It can be seen that they fit well. In conclusion, the shear behavior capacity calculation formula for RC beams strengthened with FRP grid–PCM composites considering multiple-parameter influences proposed in this paper can effectively predict the shear behavior capacity of strengthened beams.

Table 10.
Comparison of calculated values of shear capacity of reinforced beams and experimental values.
5. Conclusions
In this paper, finite element software was used to establish a model of 1 unstrengthened beam and 24 RC beams strengthened with an FRP grid–PCM composite. The influence of different parameters on the shear behavior of the strengthened beams was studied. The actual shear contribution was quantified based on the effective strain of the FRP grid. Finally, a shear behavior capacity formula for RC beams strengthened with an FRP grid–PCM composite was proposed.
- (1)
- The established finite element model has high accuracy. The error between the finite element analysis results and the test results is within a reasonable range, indicating that this model can well simulate the shear behavior of RC beams strengthened with FRP grid–PCM composites.
- (2)
- Compared with the unstrengthened beams, the shear behavior capacities of all simulated RC beams strengthened with the FRP grid–PCM composite were improved to varying degrees, with the improvement ranging from 4% to 31%, which indicates that the FRP grid plays an important role.
- (3)
- As the reinforcement amount of the FRP grid increases, the shear behavior capacity of the strengthened beam increases, and the effective strain of the FRP grid decreases, and this influencing effect gradually weakens. When the reinforcement amount is constant, the combination of small thickness and small spacing is more effective in increasing the shear behavior capacity. As the elastic modulus of the FRP grid increases, the shear behavior capacity and the effective strain of the FRP grid increase slightly. As the shear span ratio increases, both the shear behavior capacity and the effective strain of the FRP grid decrease. An increase in the concrete strength and the shear reinforcement ratio can both increase the shear behavior capacity and the effective strain of the FRP grid, but the influence of the shear reinforcement ratio is relatively small.
- (4)
- Based on the finite element simulation research, through the regression analysis of the simulation result data, an expression for the effective strain of the FRP grid was established. It was substituted into the ACI 440.2R-08 to quantify its actual shear contribution. Combined with the contributions of concrete and stirrups, a shear behavior capacity formula for RC beams strengthened with FRP grid–PCM composites was proposed. The calculated values of the proposed formula were compared with the collected relevant experimental results. The standard deviations of the effective strain formula and shear capacity formula are 0.100 and 0.110, respectively, with COV of 0.109 and 0.104. These values demonstrate good agreement between the calculated results and the experimental data.
Author Contributions
Conceptualization, Z.Z.; methodology, Z.Z.; software, J.L.; validation, J.L.; formal analysis, J.L.; data curation, J.L.; writing—original draft preparation, J.L.; writing—review and editing, Z.Z.; visualization, J.L.; supervision, Z.Z. All authors have read and agreed to the published version of the manuscript.
Funding
This research received no external funding.
Institutional Review Board Statement
Not applicable.
Informed Consent Statement
Not applicable.
Data Availability Statement
The data cannot be shared at this time due to being part of future studies.
Conflicts of Interest
The authors declare no conflicts of interest.
References
- Editorial Department of China Journal of Highway and Transport. Review on China’s Bridge Engineering Research: 2020. J. China J. Highw. Transp. 2021, 34, 1–97. [Google Scholar]
- Guo, C.; Zhou, B.; Wang, G.; Lu, D.; Du, X. Uniaxial tensile performance of an engineered cementitious composite reinforced by carbon and basalt textile grids. J. Tunnel Constr. 2024, 44, 1950–1960. [Google Scholar]
- Pei, S. Preparation and Experiments Properties Study of Modified Fiber Reinforced Polymer Cement Mortar. Master’s Thesis, Changsha University of Science & Technology, Changsha, China, 2014. [Google Scholar]
- Dai, J.; Munir, S.; Ding, Z. Comparative study of different cement-based inorganic pastes towards the development of FRIP strengthening technology. J. Compos. Constr. 2014, 18, A4013011. [Google Scholar] [CrossRef]
- Hadad, H.A.; Erickson, B.; Nanni, A. Flexural analysis and design of FRCM-strengthened RC beams. J. Constr. Build. Mater. 2020, 244, 18371. [Google Scholar]
- Al-Salloum, Y.A.; Elsanadedy, H.M.; Alsayed, S.H.; Iqbal, R.A. Experimental and numerical study for the shear strengthening of reinforced concrete beams using textile-reinforced mortar. J. Compos. Constr. 2012, 16, 74–90. [Google Scholar] [CrossRef]
- Guo, R.; Cai, L.; Hino, S.; Wang, B. Experimental study on shear strengthening of RC beams with an FRP grid-PCM reinforcement layer. J. Appl. Sci. 2019, 9, 2984. [Google Scholar] [CrossRef]
- Guo, R.; Ren, Y.; Pan, Y.; Cai, L. Shear strengthening effect and analytical model of RC beams reinforced by CFRP grid-PCM. J. China Civil. Eng. J. 2020, 53, 1–10. [Google Scholar]
- Azam, R.; Soudki, K.; West, J.; Noël, M. CFRP grid embedded in mortar for strengthening of shear-critical RC beams. J. Mag. Concrete. Res. 2019, 71, 761–772. [Google Scholar] [CrossRef]
- Wakjira, T.G.; Ebead, U. Internal transverse reinforcement configuration effect of EB/NSE-FRCM shear strengthening of RC deep beams. Compos. B Eng. 2019, 166, 758–772. [Google Scholar] [CrossRef]
- Wang, B.; Wang, Z.; Uji, K.; Zhang, J.; Guo, R. Experimental investigation on shear behavior of RC beams strengthened by CFRP grids and PCM. Structures 2020, 27, 1994–2010. [Google Scholar] [CrossRef]
- Zheng, Y.; Wang, W.; Mosalam, K.; Fang, Q.; Chen, L.; Zhu, J. Experimental investigation and numerical analysis of RC beams shear strengthened with FRP/ECC composite layer. J. Compos. Constr. 2020, 246, 112436. [Google Scholar] [CrossRef]
- He, W.; Wang, X.; Monier, A.; Wu, Z. Shear behavior of RC beams strengthened with side-bonded BFRP grids. J. Compos. Constr. 2020, 24, 04020051. [Google Scholar] [CrossRef]
- Jiang, H.; Zhao, Z. Experiment on shear performance of RC beams strengthened with basalt fiber grid cement-based composites. J. Jilin Univ. (Eng. Technol. Ed.). 2025, 55, 211–220. [Google Scholar] [CrossRef]
- Elbelbisi, A.H.; El-Sisi, A.A.; Hassan, H.A.; Salim, H.A.; Shabaan, H.F. Parametric Study on Steel–Concrete Composite Beams Strengthened with Post-Tensioned CFRP Tendons. Sustainability 2022, 14, 15792. [Google Scholar] [CrossRef]
- Fang, Q.; Huan, Y.; Zhang, Y.; Chen, L. Investigation into static properties of damaged plasticity model for concrete in ABAQUS. J. PLA Univ. Sci. Technol. 2007, 8, 254–260. [Google Scholar]
- Ghalehnoei, M.S.; Javanmardi, A.; Izadifar, M.; Ukrainczyk, N.; Koenders, E. Finite Element Analysis of Shear Reinforcing of Reinforced Concrete Beams with Carbon Fiber Reinforced Polymer Grid-Strengthened Engineering Cementitious Composite. J. Build. 2023, 13, 1034. [Google Scholar] [CrossRef]
- GB 50010-2010; Design Code for Concrete Structures. China Construction Industry Press: Beijing, China, 2011.
- Smith, S.T.; Teng, J.G. FRP-strengthened RC beams. Ӏ: Review of debonding strength models. J. Eng. Struct. 2002, 24, 385–395. [Google Scholar] [CrossRef]
- Smith, S.T.; Teng, J.G. FRP-strengthened RC beams. ІІ: Assessment of debonding strength models. J. Eng. Struct. 2002, 24, 397–417. [Google Scholar] [CrossRef]
- Lu, X.; Ye, L.; Teng, J. Bond-slip constitutive modeling of FRP-concrete interface. J. Build. Struct. 2005, 26, 10–18. [Google Scholar]
- ACI 440.2R-08; Guide for the Design and Construction of Externally Bonded FRP Systems for Strengthening Concrete Structures. American Concrete Institute: Farmington Hills, MI, USA, 2008.
- Zhou, J.; Wang, X.; Liu, X.; Tao, J.; Wu, Z. Investigation on the shear behavior of RC beams strengthened with BFRP grids and PCM. J. Eng. Struct. 2025, 322, 119173. [Google Scholar] [CrossRef]
- Cai, L. Mechanical Behavior and Calculated Methods of RC Beams Strengthened in Shear with FRP Grid and Cementitious Matrix. Master’s Thesis, Southwest Jiaotong University, Chengdu, China, 2020. [Google Scholar]
- Wang, X. Study on the Shear Performance of RC Beams Reinforced with Basalt Fiber Grid-Enhanced ECC. Master’s Thesis, Jilin Jianzhu University, Changchun, China, 2023. [Google Scholar]
Disclaimer/Publisher’s Note: The statements, opinions and data contained in all publications are solely those of the individual author(s) and contributor(s) and not of MDPI and/or the editor(s). MDPI and/or the editor(s) disclaim responsibility for any injury to people or property resulting from any ideas, methods, instructions or products referred to in the content. |
© 2025 by the authors. Licensee MDPI, Basel, Switzerland. This article is an open access article distributed under the terms and conditions of the Creative Commons Attribution (CC BY) license (https://creativecommons.org/licenses/by/4.0/).