1. Introduction
Methane (CH
4), as an important greenhouse gas, has attracted extensive global attention due to its potential impact on climate change [
1,
2,
3]. The greenhouse effect in the atmosphere has been increasing due to the CH
4 concentration steadily rising. CH
4 emissions are gradually becoming an urgent environmental problem in different areas, including natural gas extraction, landfills, and agriculture [
4,
5,
6]. Therefore, the development of an accurate, efficient, and sensitive method for CH
4 concentration measurement is of critical importance. Such methods not only enable precise environmental monitoring, but also provide data support for the management and mitigation of greenhouse gas emissions [
7,
8,
9].
Absorption spectroscopy has been widely applied in chemical analysis [
10,
11], environmental monitoring [
12,
13], and life sciences [
14,
15] due to its high selectivity and sensitivity. Among them, the off-axis integrated cavity output spectroscopy (OA-ICOS) has demonstrated outstanding measurement accuracy and sensitivity in gas measurement, and has become an advanced technology in the gas concentration measurement [
16,
17,
18]. By extending the effective optical interaction path between light and matter, which significantly improves the measurement of low concentration gases. Zheng et al. [
19] proposed a wavelength modulation spectroscopy (WMS) combined with the OA-ICOS for the measurement of CH
4 concentration. The 60 cm cavity with an effective absorption path length of 2150 m was fabricated, and the minimum detection limit (MDL) of 13 ppb was obtained. He et al. [
20] developed an open-based OA-ICOS sensor system for the measurement of oxygen concentration. The light from a distributed feedback (DFB) laser around 761 nm was coupled into a Fabry–Perot cavity, and the MDL of 0.0038% was obtained at 20 s. Zhang et al. [
21] demonstrated a portable carbon dioxide sensor system based on the OA-ICOS. Fluid dynamics were used to establish a stable optical resonance cavity with an optical path length of 891 m and a physical length of 30 cm. The sensor exhibited a wide dynamic measurement range of 0.011–800 ppm and an MDL of 11 ppm.
However, cavity mode noise as the main noise source in the OA-ICOS systems seriously affects the measurement accuracy and sensitivity [
22,
23,
24]. To meet this challenge, various methods are proposed to suppress the cavity mode noise. Liu et al. [
25] proposed a method combining Variational-Mode-Decomposition (VMD) and Savitzky–Golay (SG) algorithms to effectively filter out optical noise and improve the signal-to-noise ratio (SNR). The received photoelectric signals were decomposed into multiple frequency components by the VMD algorithm and subsequently reconstructed by the SG algorithm. The Extreme Learning Machine algorithm optimized by the Dragonfly Algorithm was applied to CH
4 concentration inversion for further improving the measurement accuracy. Zheng et al. [
26] presented a multi-input multi-output laser-to-cavity coupling scheme for suppressing cavity mode noise. The validation of the measurement scheme was confirmed by simulations and experiments. Nadeem et al. [
27] developed a comprehensive 3D ray tracing model to simulate the optical re-injection process. The re-injection effect was improved by the larger diameter re-injection mirrors. The transmission intensity and SNR were also improved. Wang et al. [
28] injected RF white noise into the current driving of the laser to broaden the laser emission linewidth. The cavity mode noise was effectively suppressed.
In this work, a CH4 sensor based on direct absorption off-axis integrated cavity output spectroscopy (DA-OA-ICOS) and wavelength modulation off-axis integrated cavity output spectroscopy (WM-OA-ICOS) was presented. The sensor was designed with a compact optical resonance cavity to enable rapid and efficient CH4 concentration measurements with minimal gas samples. To improve the measurement stability and accuracy of the sensor, the white noise perturbations were introduced to effectively suppress the cavity mode noise. The performance of both measurement modes was analyzed in detail through experiments. The results demonstrated that the sensor exhibited excellent stability and high accuracy.
2. Measurement Theory
The measurement theory of DA-OA-ICOS: when a laser beam passes through a stable optical resonant cavity filled with gas, the gas molecules will absorb the light at a specific wavelength resulting in the attenuation of the light intensity. The gas volume fraction
C in the cavity can be expressed as [
28]:
In Equation (1), N is the molecular density of the gas absorption medium; NT is the total number of molecules per cubic centimeter; NL is the Loschmidt number; P0 is the gas pressure under the standard condition; T0 is the gas temperature under the standard condition; P and T are the pressure and temperature in the optical resonance cavity, respectively; A is the absorption integral area of the absorption spectroscopy; S is the line intensity; L is the effective optical path. It can be obtained that the direct absorption integral area is proportional to the gas concentration.
The measurement theory of WM-OA-ICOS: according to the Beer–Lambert law, when a light beam with the frequency of
ν and the light intensity of
I0 through a substance with thickness of
L (i.e., effective optical path), the absorption in the substance will lead to the attenuation of the transmitted light intensity. The transmitted light intensity
I(
ν) can be expressed as follows:
In Equation (2),
σ(
ν) is the absorption cross section of the absorbing molecule. If a signal with frequency
ω is used to demodulate the laser current with output center frequency
ν0, the instantaneous frequency of the output signal is
ν =
ν0 +
δνcos
ωt. And
δν is the demodulated signal amplitude. The output signals were further processed by the Cosine Fourier Series expansion. The harmonic component of the level number
An is then obtained [
29]:
In Equation (3), θ = ωt and the amplitude of the harmonic component is proportional to the concentration of the absorbing molecule when the effective absorbed optical path is kept constant.
For an OA-ICOS with a cavity lens distance of
d and a cavity lens reflectivity of
R, the effective optical path
L can be expressed as
In Equation (4),
α(
ν) is the absorption coefficient. When the absorption intensity is weak and the one-way absorption of light in the cavity satisfies 1−
R >>
α(
ν),
L can be expressed as
It can be concluded that the effective optical path is constant and the optical resonance cavity can be equated to a multi-pass cell. The concentration can be inverted on the direct absorption integral area or the harmonic signal amplitude.
3. Experimental Setups
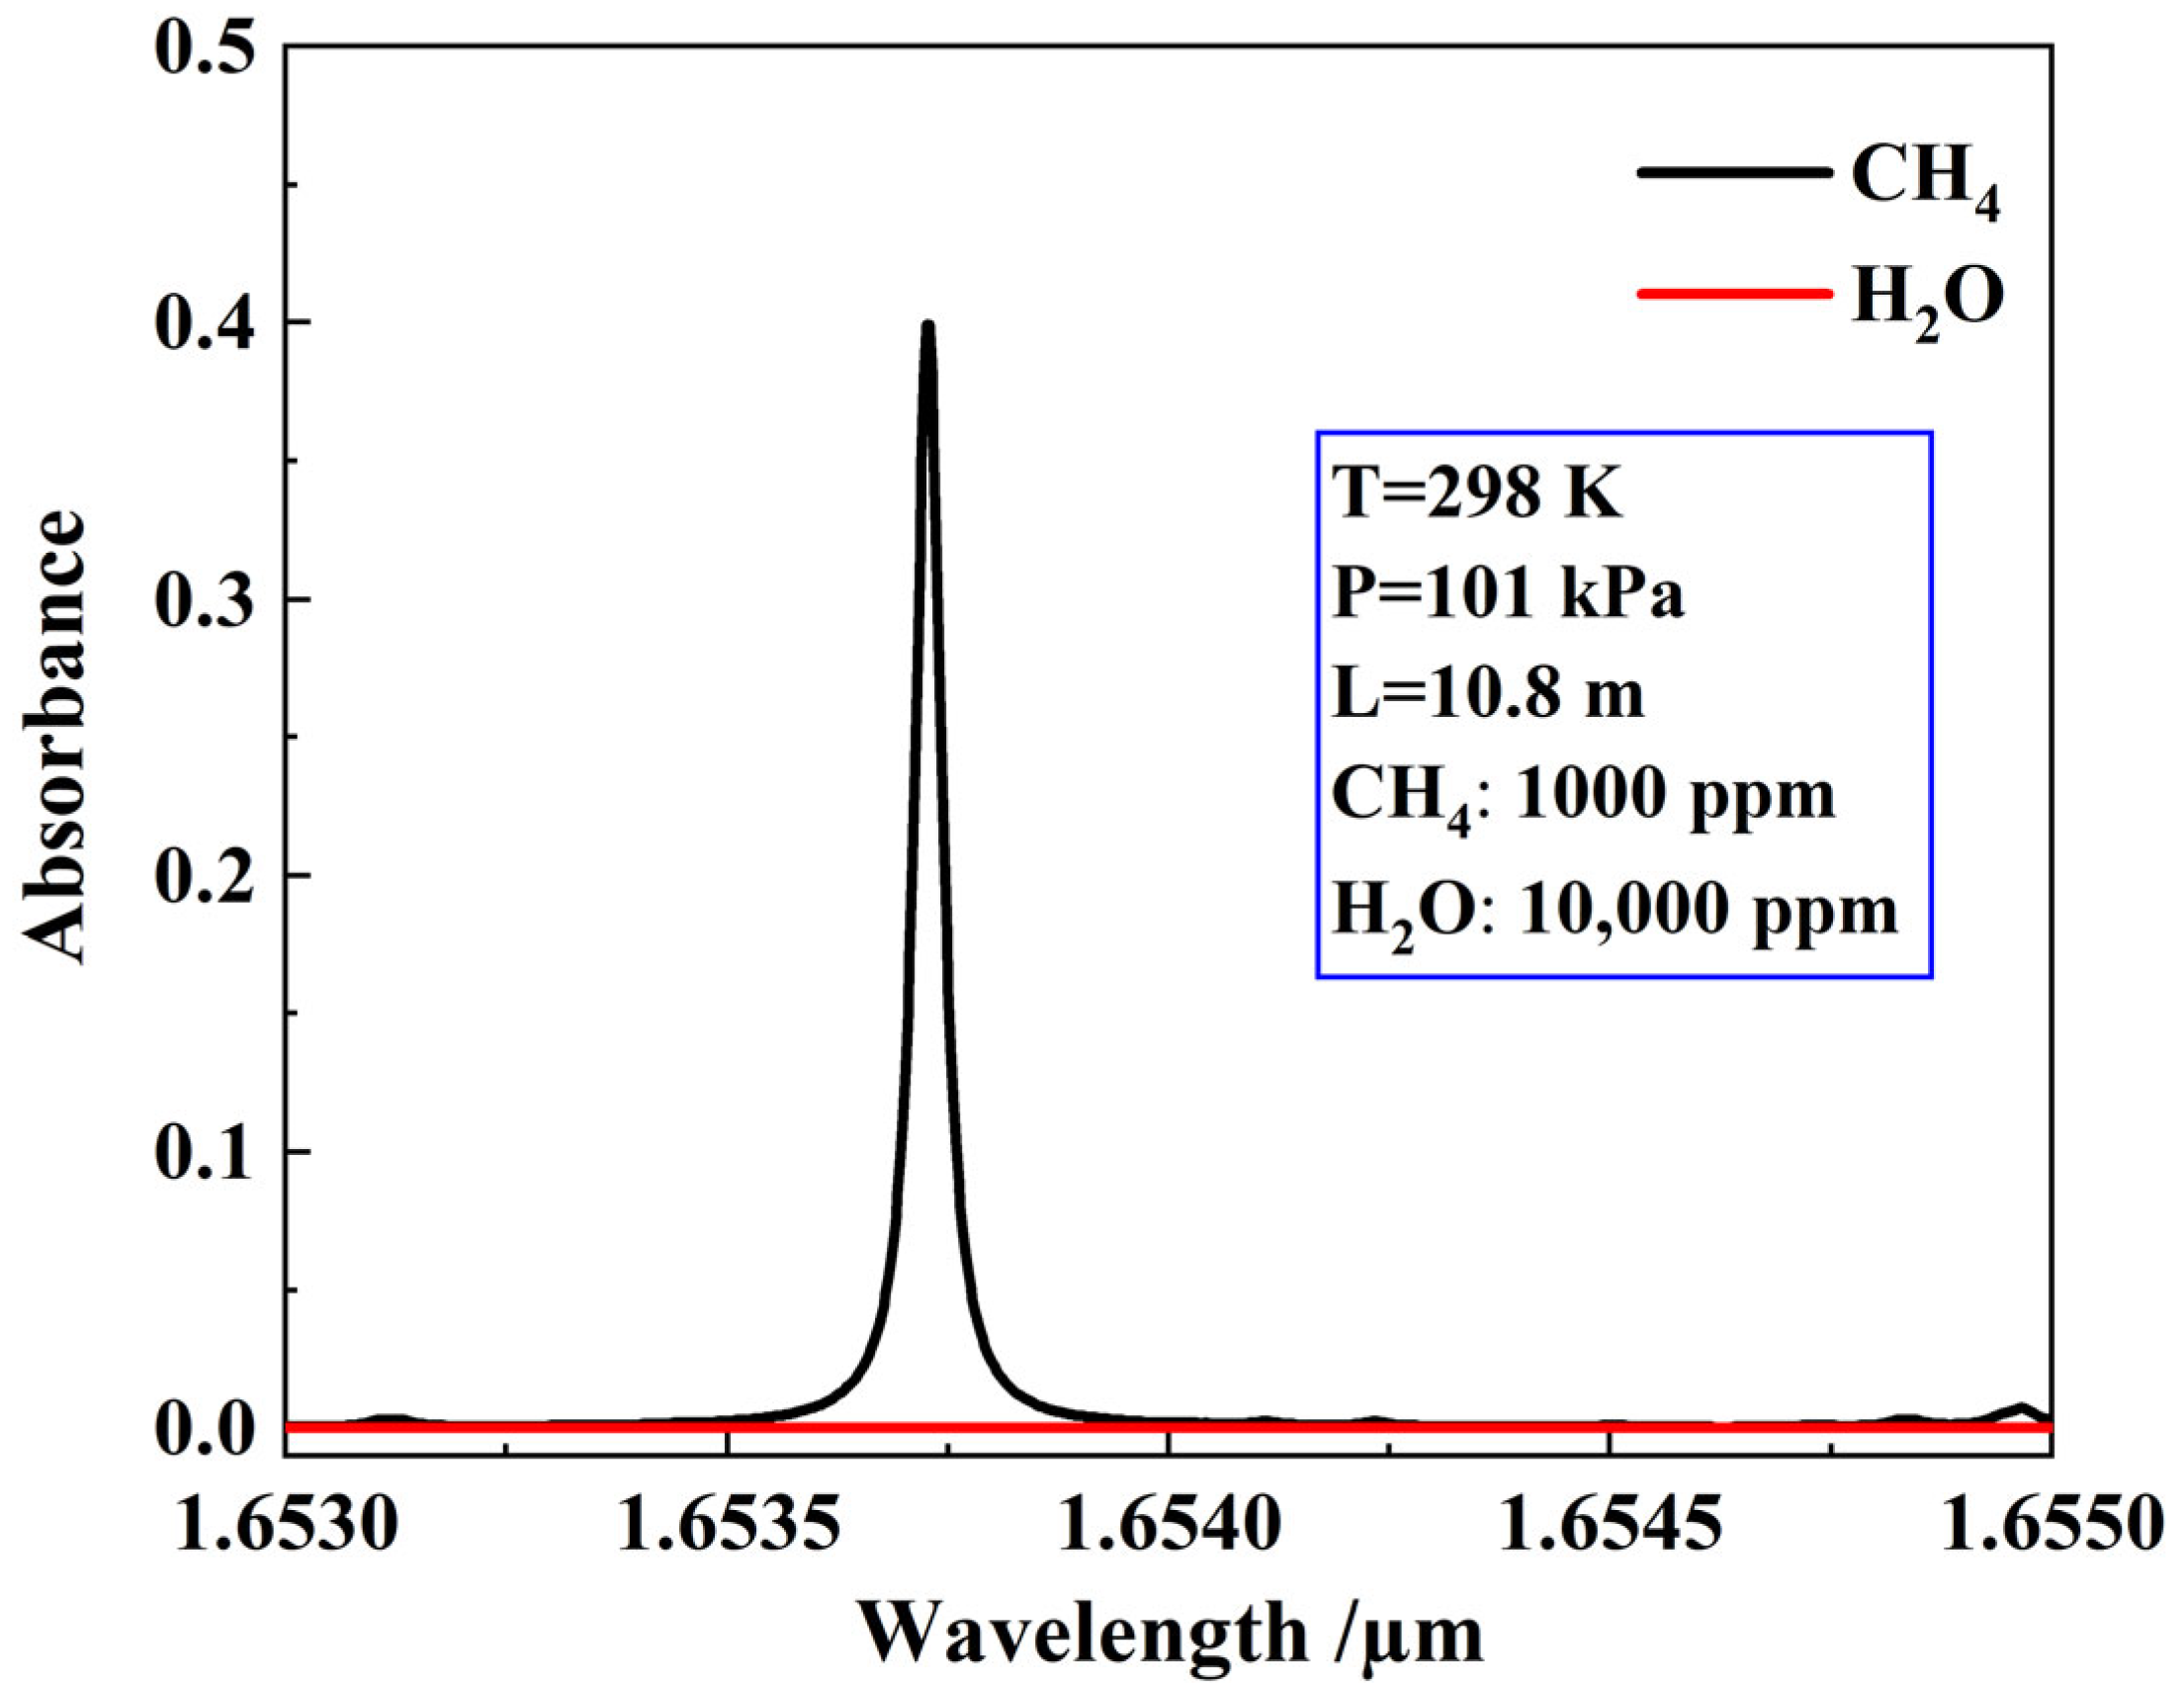
Water vapor was the main interference gas in the CH
4 absorption spectroscopy during the near-infrared band. In order to evaluate the effect on the CH
4, the absorption spectroscopy of CH
4 in the 1.653–1.655 µm band were simulated by the HITRAN database. Simulation parameters were as follows: the temperature of 298 K, the pressure of 101 kPa, the path length of 10.8 m, the CH
4 concentration of 1000 ppm, and the water vapor concentration of 10,000 ppm. The simulation results are shown in
Figure 1. Although water vapor also exhibited some absorption features in the 1.653–1.655 µm band, the interference effect on the CH
4 absorption spectroscopy was minimal. It could be concluded that the effect of water vapor on the absorption intensity of CH
4 was negligible. Therefore, 1.6537 µm was chosen as the center absorption wavelength for CH
4 in this paper.
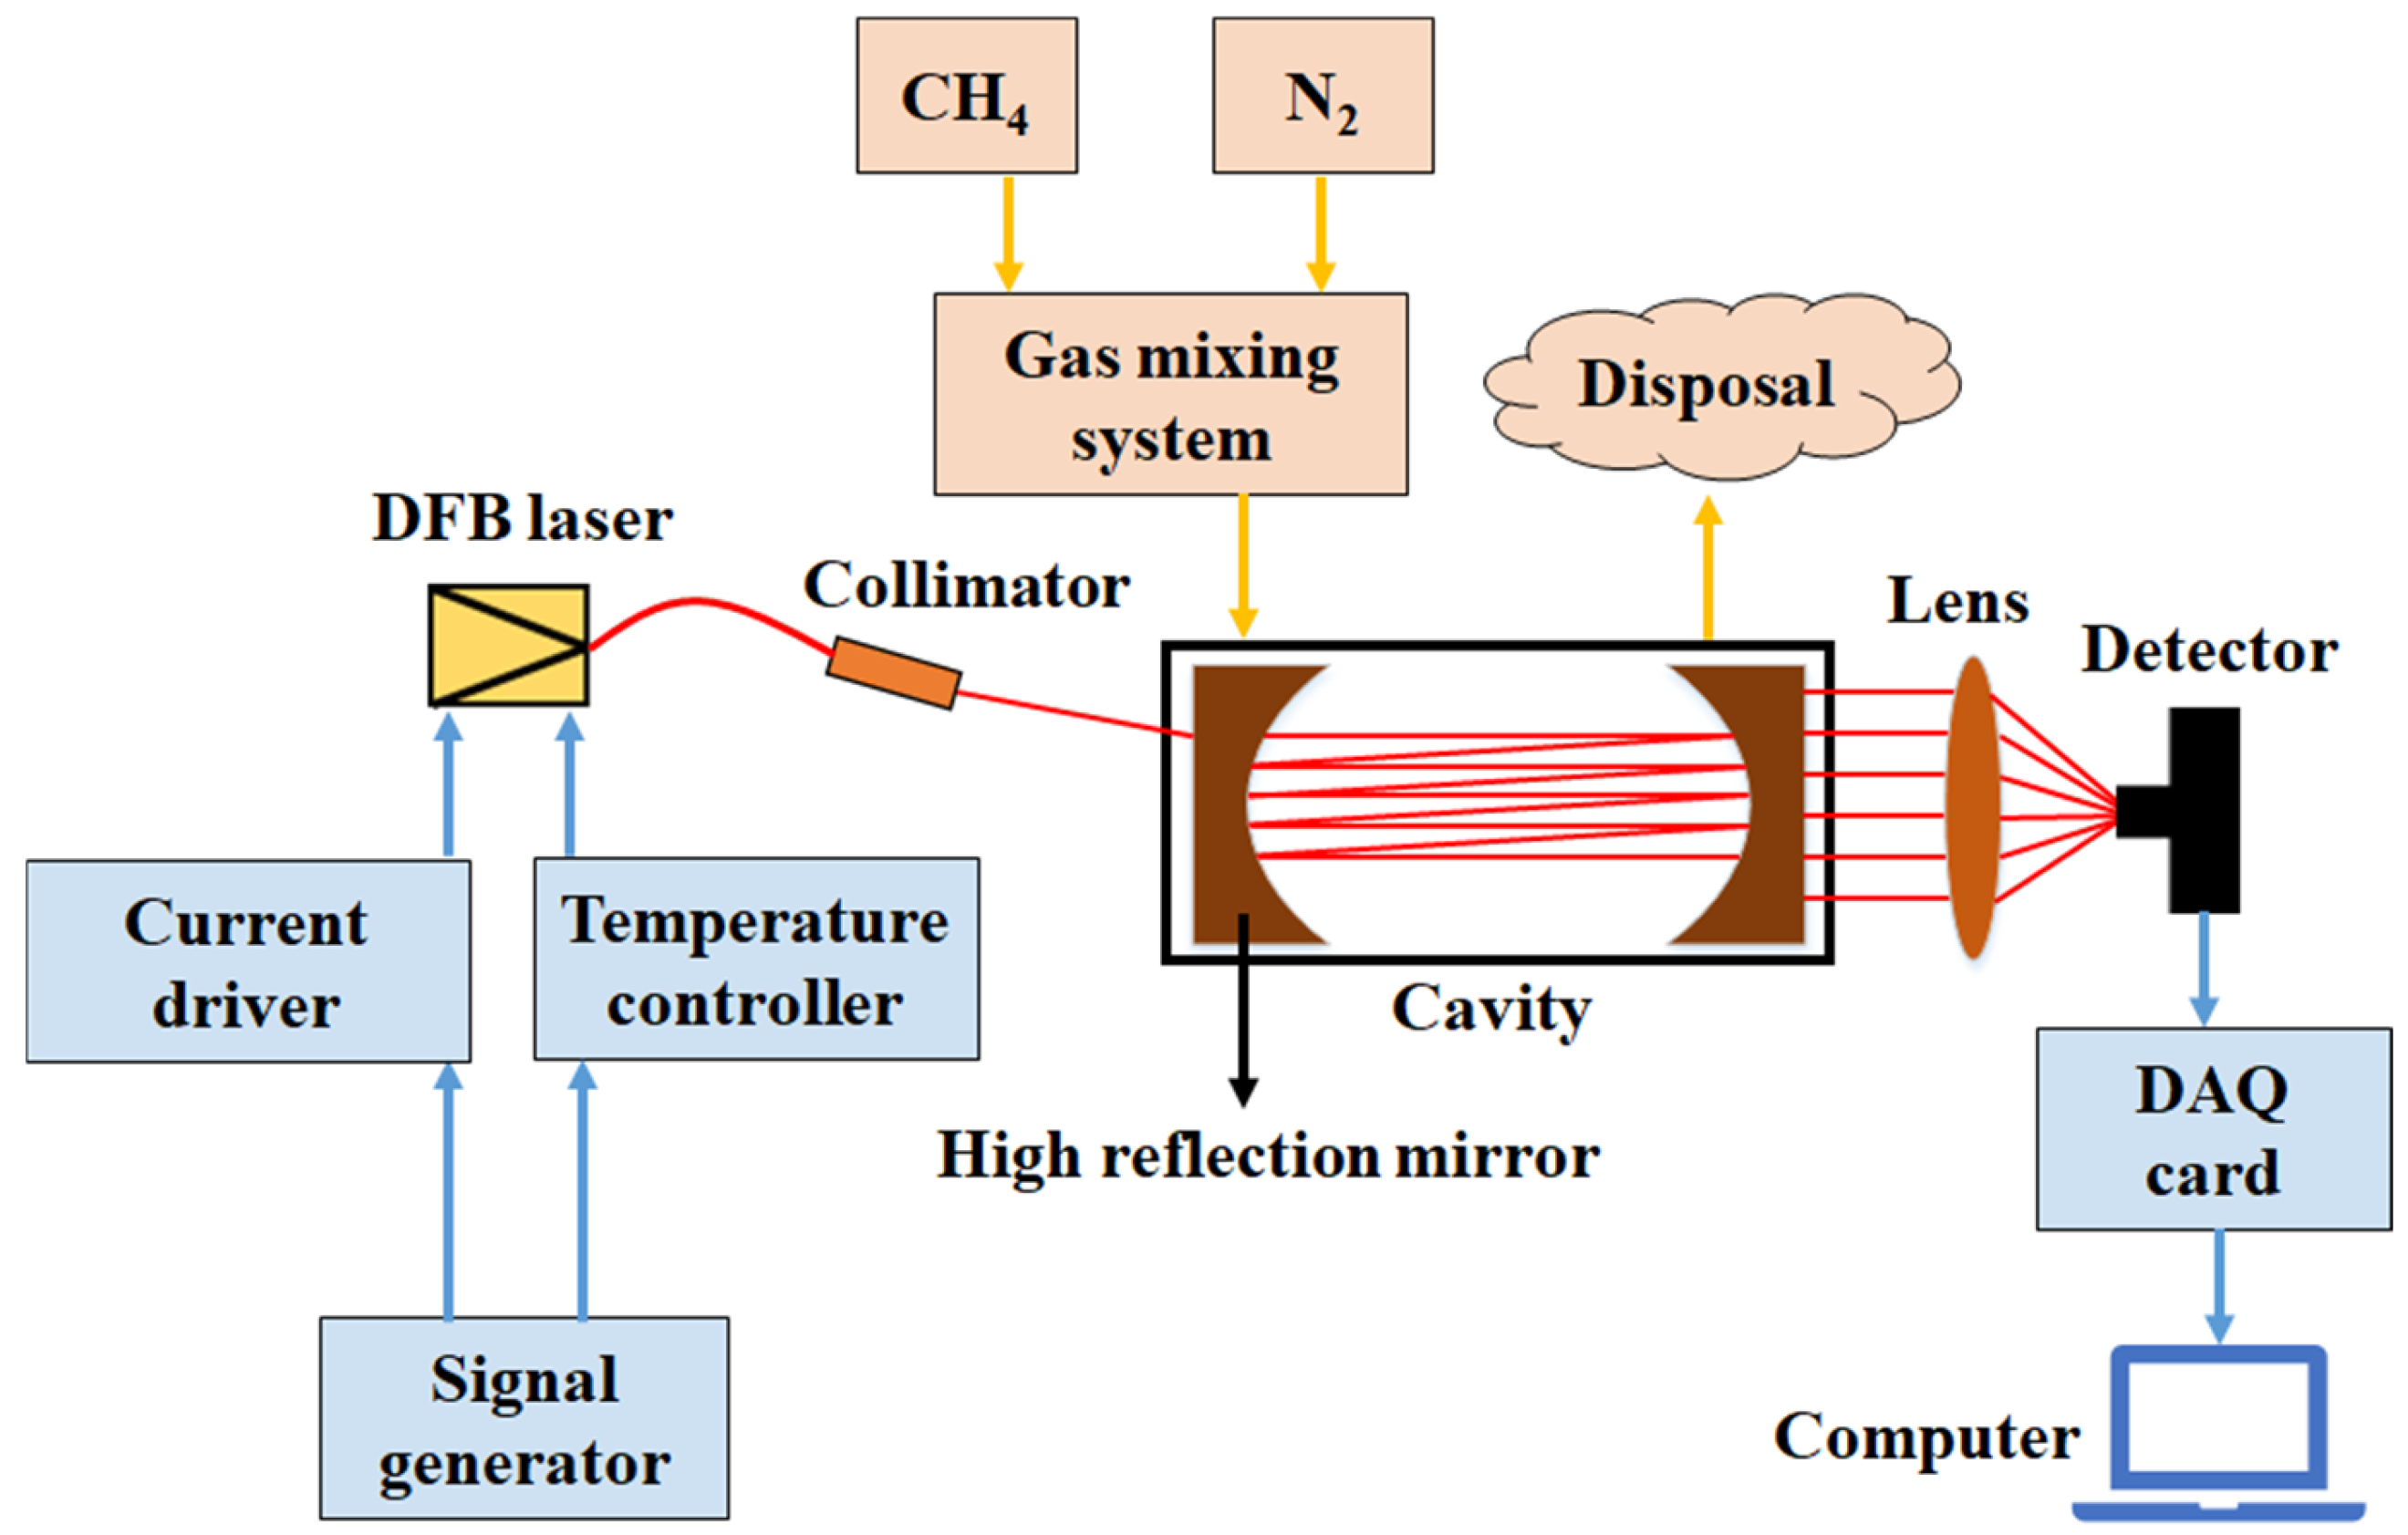
The structure of the CH
4 sensor with a compact gas cavity based on OA-ICOS is shown in
Figure 2. The sensor consists of an optical part, an electrical part, and a gas path part. The sensor can support two measurement modes: DA-OA-ICOS and WM-OA-ICOS. In the optical part, a DFB laser with a center wavelength of 1.6537 µm was used as the light source. The laser provided a stable light source with high single mode output characteristics. The light beam was collimated by a collimator before entering an optical resonance cavity. The optical noise of the system could be reduced by adjusting the position of the collimator. The optical resonance cavity consisted of two high reflection mirrors (band of 1450–1670 nm, curvature radius of 20 cm, reflectivity > 99%), which enabled multiple reflections of the beam inside the cavity. Based on the required optical path, the cavity length was designed to be 7 cm by MATLAB r2019b program. An effective optical path length of 10.8 m with a cavity volume of 8.9 mL was obtained, satisfying the design requirements of compact sensor. The output beam enhanced by the optical resonance cavity was focused by the lens (focal length of 6 cm) onto an InGaAs amplified detector.
In the electrical part, different scanning signals were generated by a signal generator for DA-OA-ICOS, WM-OA-ICOS and white noise perturbation. The white noise perturbations were generated by the broadband random noise from the signal generator. The special customized narrowband RF noise source was not required. (1) The random broadband white noise could more efficiently integrate various noise sources due to the randomness of the spectra, and the cavity mode noise was dispersed. Under low signal intensity, the randomness of broadband white noise contributed to prevent the accumulation of noisy signals at specific frequencies. The RF narrowband white noise tended to excessive focus on the noise within a limited frequency range, thus affecting the measurement accuracy and stability. (2) Since the broadband white noise provided the richer frequency component, the automatic compensation of baseline noise was improved to enhance baseline stability. The RF narrowband white noise only covered a specific frequency band, which made it difficult to cope with various frequency interferences, resulting in baseline drift or instability. (3) The random broadband white noise could suppress the effect of external environmental noise by introducing signals in multiple frequency bands, thereby increasing the robustness of the system. The RF narrowband white noise might be interfered with the specific frequency bands, resulting in the system more susceptible to high-frequency noise. The DFB laser was precisely controlled by a laser temperature controller and a current driver simultaneously. The operating temperature was controlled to 10 °C by the temperature controller and the current driver was used to generate a 10 Hz sawtooth wave. A data acquisition (DAQ) card was used to collect spectroscopy data from the detector. The spectroscopy data were then transferred to a computer for post-processing. The repetition rate of the laser was 10 Hz and the acquisition rate of the DAQ card was 10 kHz/s.
In the gas path part, nitrogen was mixed with CH4 through a gas mixing system to produce CH4 samples with different concentrations.
4. Results and Discussion
4.1. DA-OA-ICOS Combined with White Noise Perturbation
Currently, white noise perturbation was considered an effective method to improve the measurement accuracy of the OA-ICOS [
28,
29,
30], particularly in suppressing the cavity mode noise. The generation of cavity mode noise was mainly caused by the coherence of the laser. The narrower the laser bandwidth, the better the laser coherence, and the greater the cavity mode noise generated [
29]. When the control current of the laser was interfered with by white noise perturbation, the laser linewidth would be increased and the coherence would be decreased. The change effectively reduced the effect of cavity mode noise, thereby improving the SNR and measurement sensitivity [
31].
4.1.1. Effect of White Noise Perturbation on Sawtooth Wave Signals
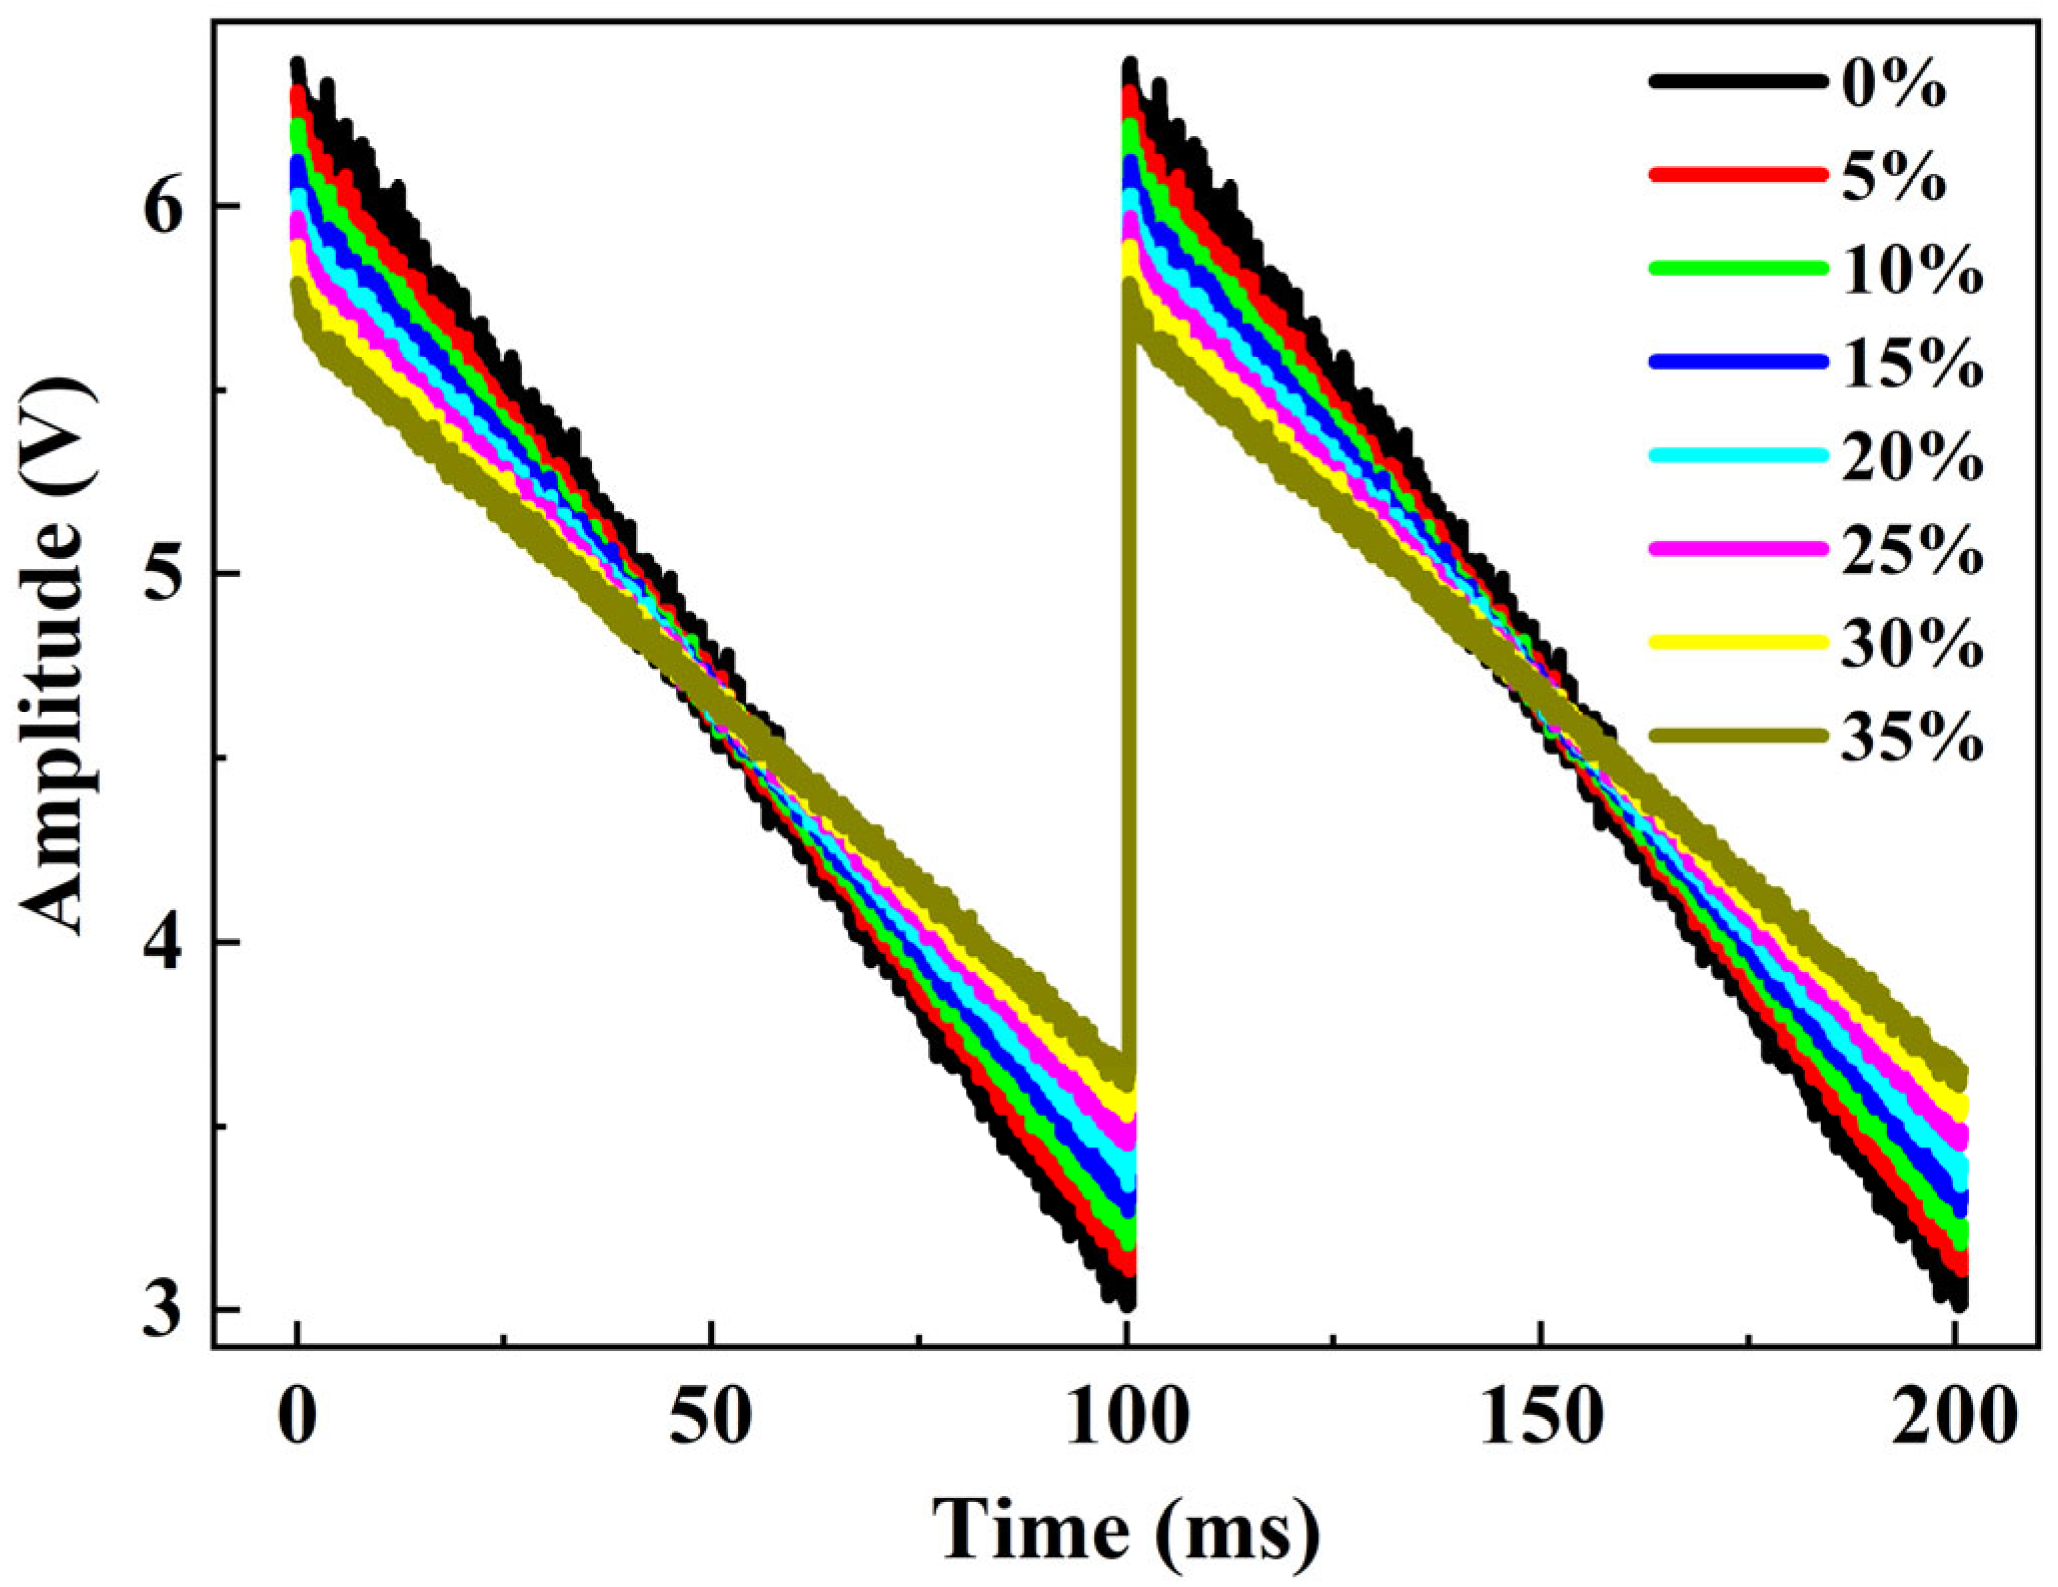
The DA-OA-ICOS were generated by the signal generator with white noise perturbation of different modulation depths (0%/5%/10%/15%/20%/25%/30%/35%). The experimental temperature and pressure were maintained at 298 K and 101 kPa, respectively. Under the white noise perturbation with different modulation depths, the measured sawtooth wave signals showed different fluctuating waveforms as shown in
Figure 3. The results indicated that the original sawtooth wave signal (black) without white noise perturbation showed obvious noise fluctuations. The fluctuations showed a regular noise distribution, which mainly originated from the cavity mode noise [
29]. As the modulation depth of the white noise perturbation increased, the noise fluctuations in the sawtooth wave signal reduced significantly. Simultaneously, the amplitude of the sawtooth wave signal also decreased, and the suppression effect of cavity mode noise was gradually enhanced. It was demonstrated that the white noise perturbation played a key role in reducing the cavity mode noise.
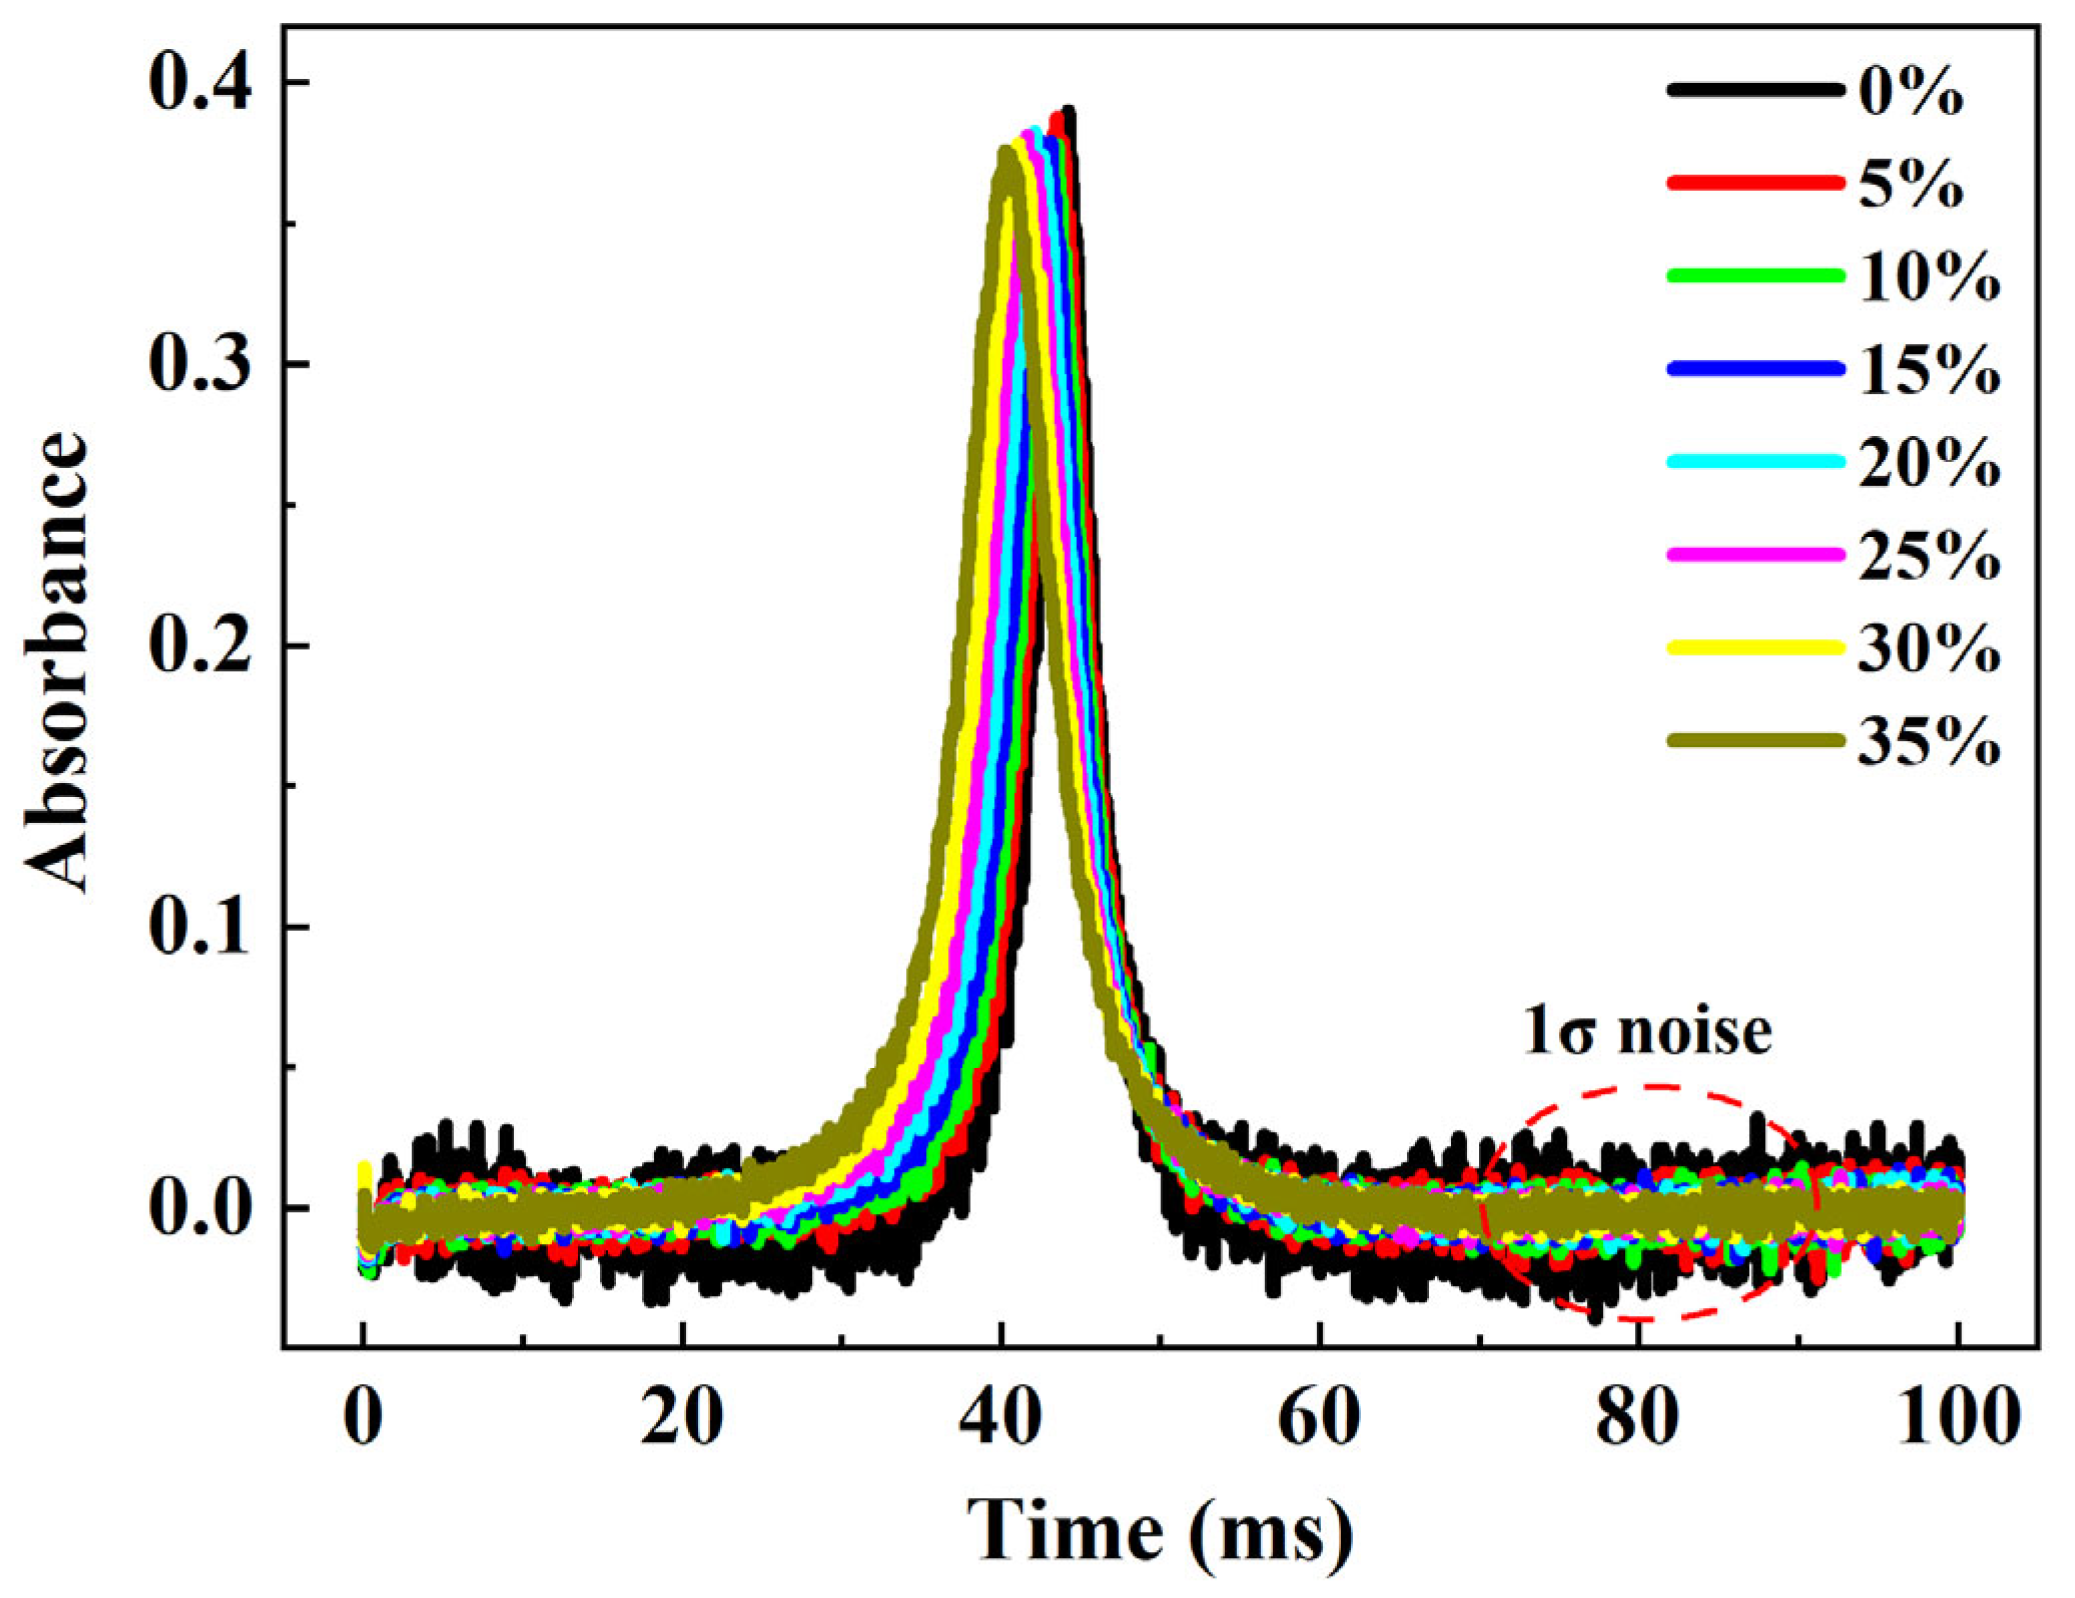
4.1.2. Effect of White Noise Perturbation on Absorption Spectroscopy
The gas mixing system was equipped with 1000 ppm CH
4 and the absorption spectroscopy of the DA-OA-ICOS was measured with the white noise perturbation of different modulation depths (0%/5%/10%/15%/20%/25%/30%/35%). The DAS of 1000 ppm CH
4 with white noise perturbation of different modulation depths showed different waveforms, as shown in
Figure 4. The results showed that the fluctuation characteristics of the DAS exhibited significant differences with different white noise perturbation [
32]. In particular, the absorbances of the absorption spectroscopy at different white noise perturbations were 0.390, 0.387, 0.378, 0.378, 0.382, 0.381, 0.378, and 0.376, respectively. The absorbance showed little significant difference. The system noise levels (1σ) at different white noise perturbations were 0.09884, 0.05215, 0.04361, 0.03444, 0.02982, 0.02541, 0.02338, and 0.02324, respectively. Based on the noise levels, the calculated SNRs were 4.0, 7.4, 8.7, 11.0, 12.8, 15.0, 16.2, and 16.2, respectively. Since the improvement in SNR was minimal after the modulation depth beyond 30%, the modulation depth of 30% was chosen. Compared with the original system, the SNR of the white noise perturbation was increased 4.1 times. The effect of white noise perturbation on absorbance was minimal, but the cavity mode noise level of the system was effectively reduced.
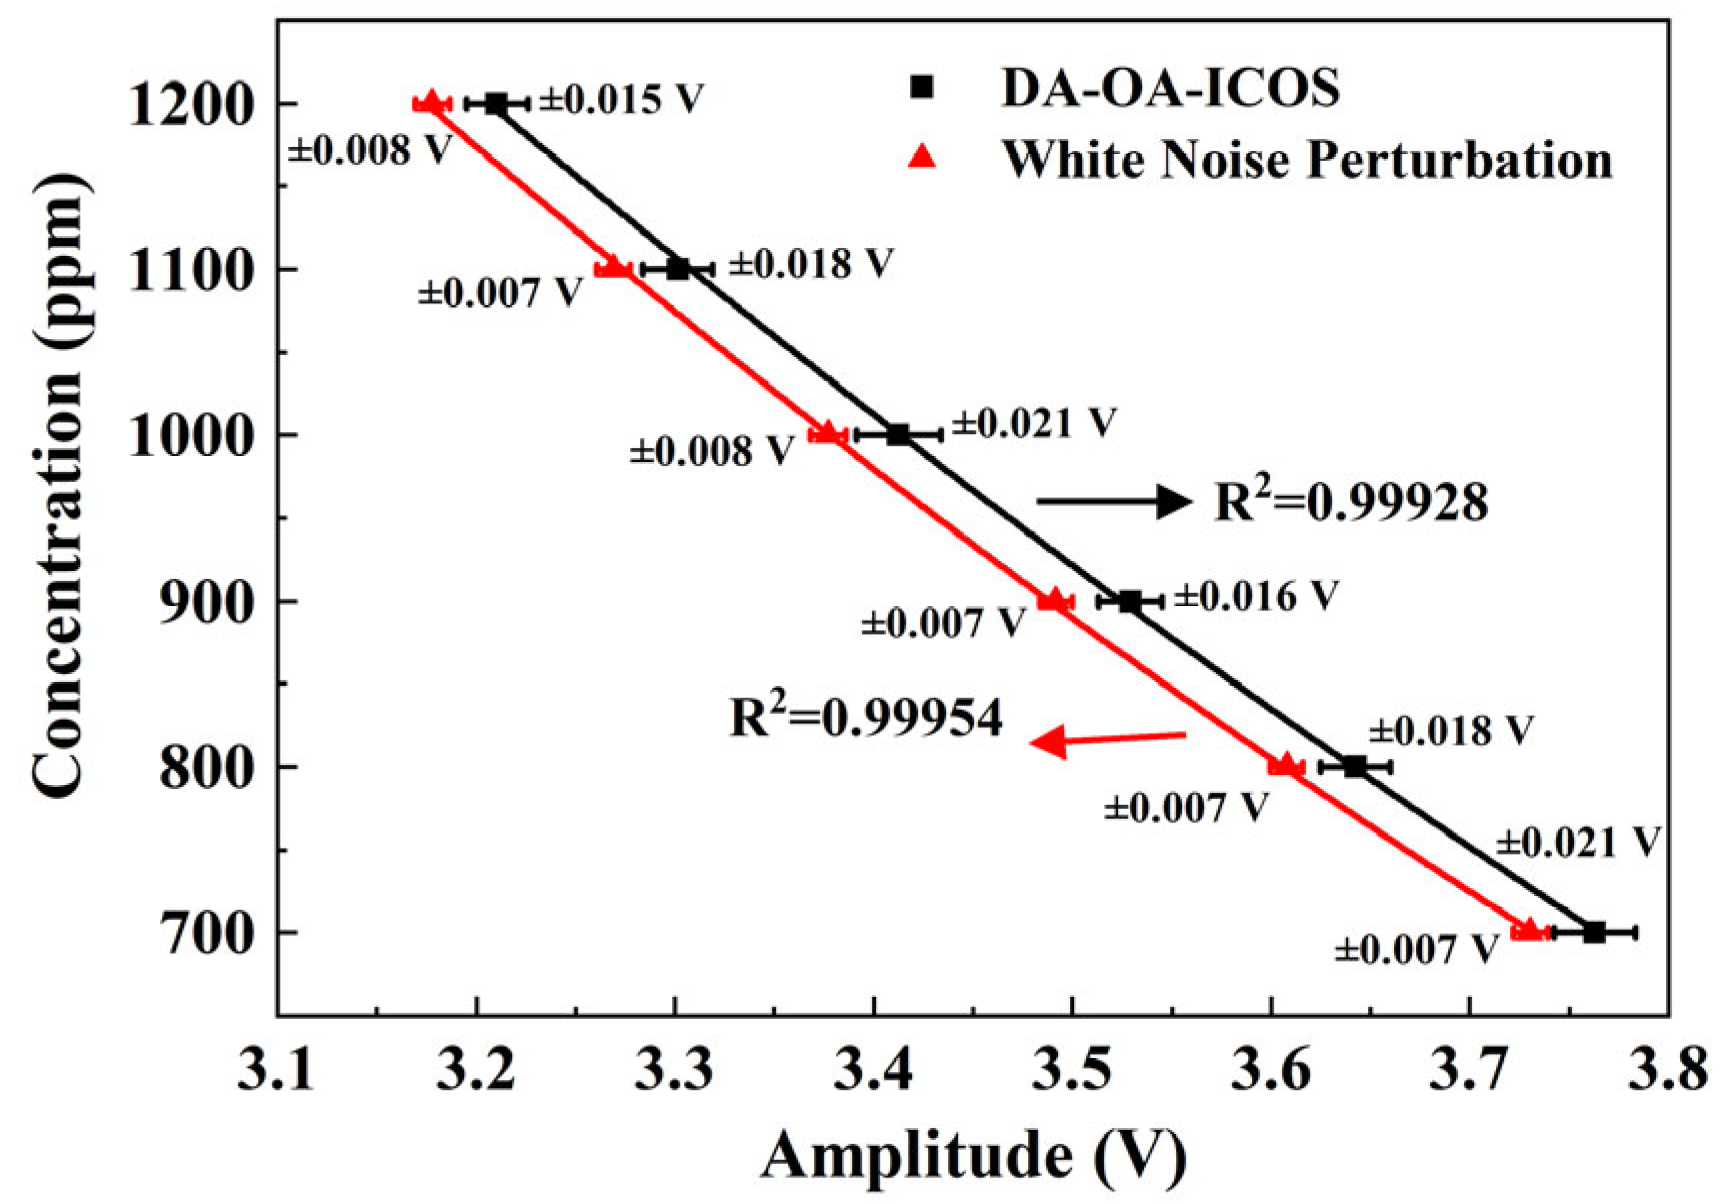
4.1.3. Data Calibration for DA-OA-ICOS
Following these experiments, the white noise perturbation of 30% modulation depth was finally chosen for system optimization. During the further calibration, standard CH
4 gas was mixed with nitrogen by the gas mixing system to prepare seven gas mixtures with concentrations in the range of 700 ppm to 1200 ppm. The gas mixtures were then used to measure the direct absorption amplitude with the original signal and the white noise perturbation. Each concentration was measured 20 times. It could be concluded that the direct absorption amplitudes of the original signal and the white noise perturbation at different concentrations were significantly different, and these differences could be used for concentration inversion analysis. By fitting the experimental data with the quadratic polynomial, the data fitting curves for the original signal and the white noise perturbation were obtained. The fitting curves between CH
4 concentration and the direct absorption peak under original signal and white noise perturbation are shown in
Figure 5, and the relationship can be expressed by Equation (6). It could be concluded that the curve fitting of the original signal (black) was 0.99928, while the curve fitting of the white noise perturbation (red) was 0.99954. The ranges of relative deviation for the original signal and the white noise perturbation were 0.015–0.021 V and 0.007–0.008 V, respectively. The results showed that the optimization method with the white noise perturbation of 30% modulation depth significantly improved the curve fitting and enhanced the accuracy of the concentration inversion.
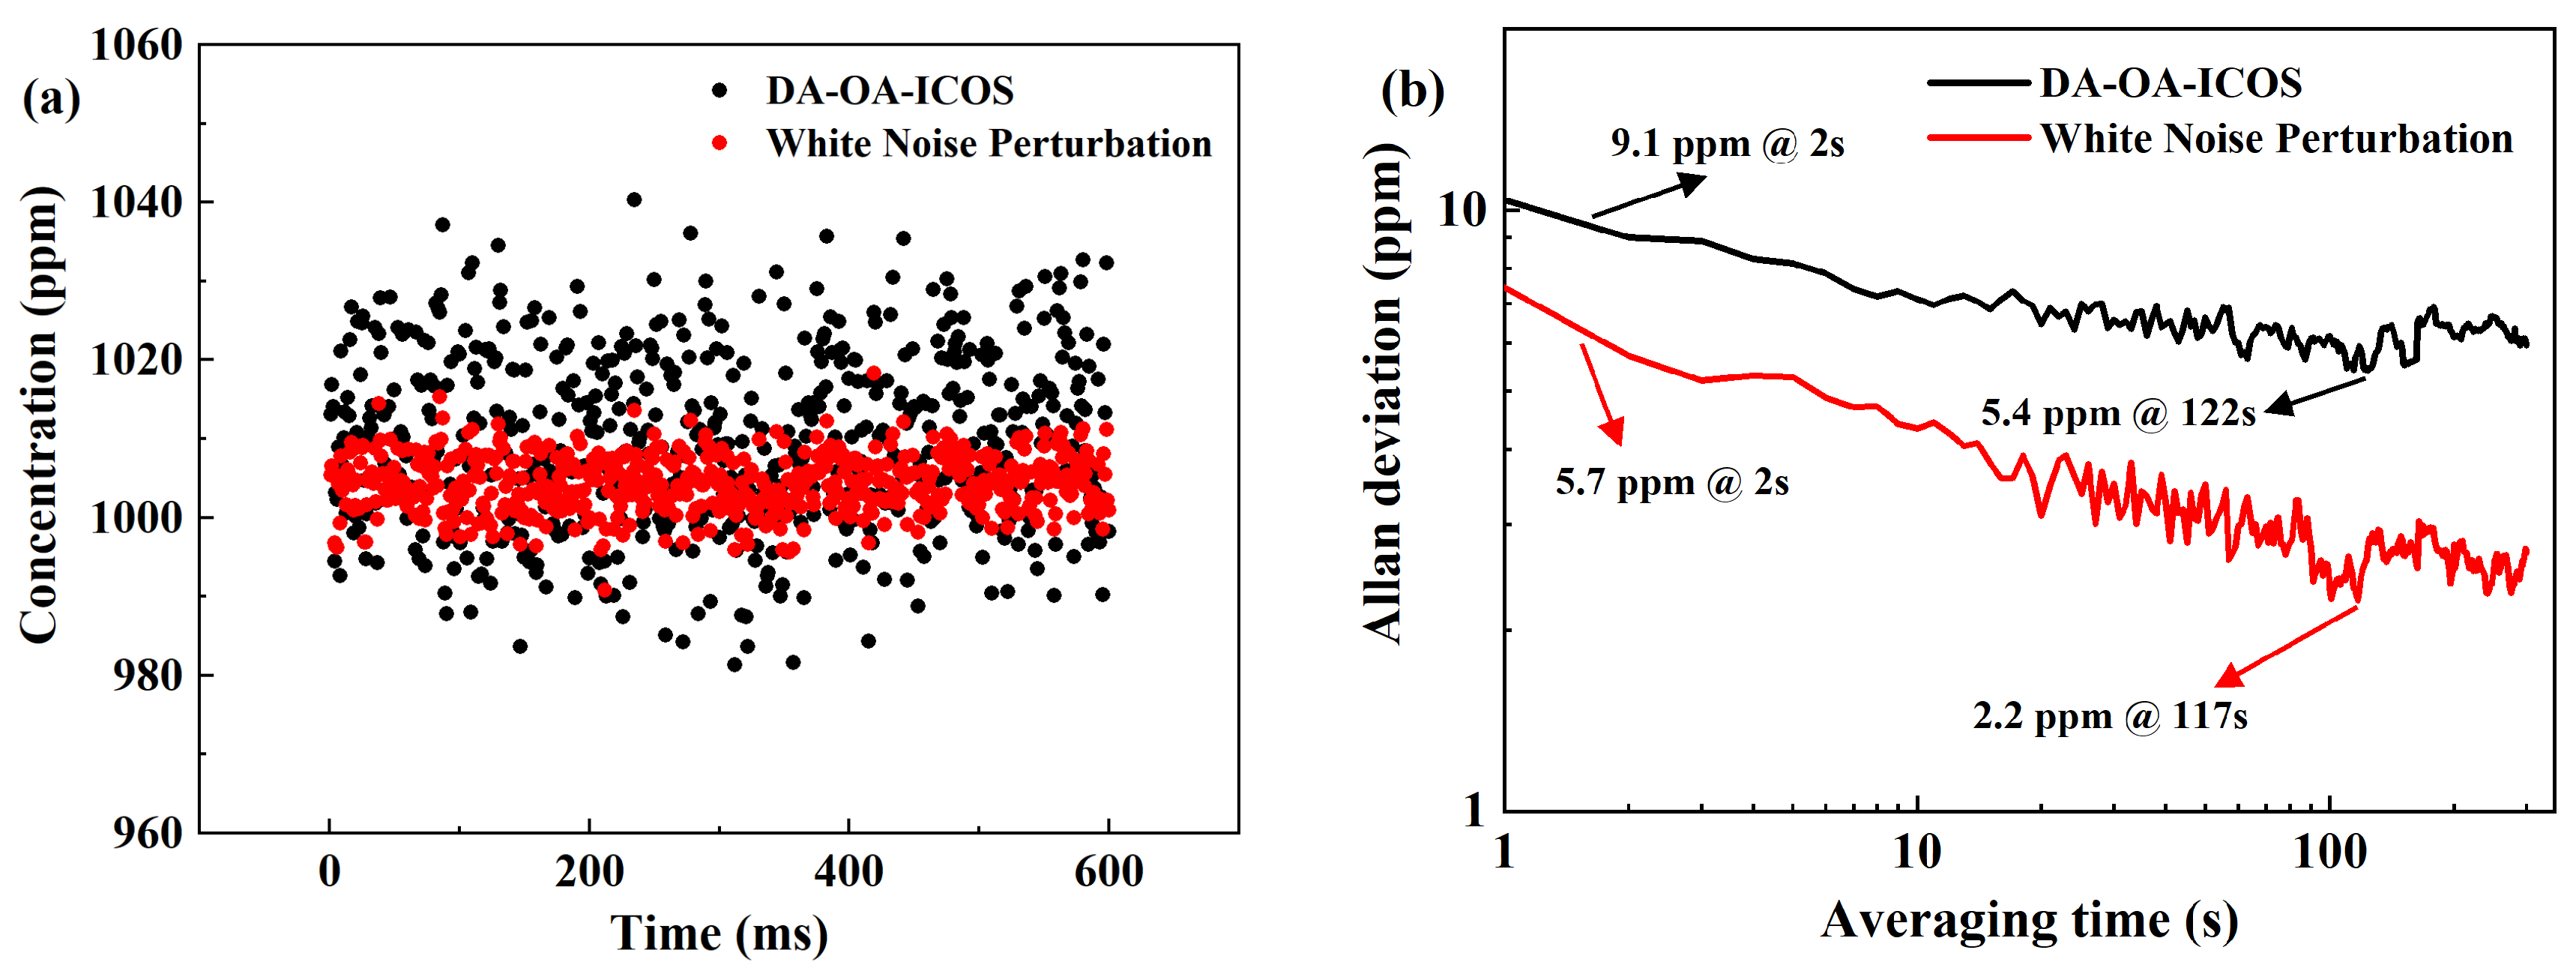
4.1.4. Measurement Stability and MDL for DA-OA-ICOS
In order to fully evaluate the performance of the sensor, measurements were conducted on standard CH
4 gas with a concentration of 1000 ppm for 10 min with 1 s sampling intervals. The MDL was analyzed in detail by the Allan deviation. The concentration data were collected by the sensor under the original signal and the white noise perturbation, as shown in
Figure 6a. The results showed that the concentration fluctuation range of the original signal (black) was less than 60 ppm, while the fluctuation range of the white noise perturbation (red) was reduced to 30 ppm. The average concentration, standard deviation, and maximum uncertainty obtained by the original system were 1009.5 ppm, 11.1 ppm, and 4.0%, respectively. The average concentration, standard deviation, and maximum uncertainty obtained after adding the white noise perturbation were 1004.3 ppm, 3.6 ppm, and 1.8%, respectively. The Allan deviation was further calculated for both the original signal and the white noise perturbation, as shown in
Figure 6b. The detection limit of the original signal (black) was 9.1 ppm at 2 s integration time, and the MDL was 5.4 ppm at 122 s integration time. The detection limit of the white noise perturbation (red) was 5.7 ppm at 2 s integration time, and the MDL was 2.2 ppm at 117 s integration time. Compared to the original system under the same conditions, the sensing system with the white noise perturbation of 30% modulation depth improved the MDL by 2.5 times. It was shown that the addition of white noise perturbation not only enhanced the stability of the sensor, but also substantially improved the measurement sensitivity.
4.2. WM-OA-ICOS Combined with White Noise Perturbation
In WM-OA-ICOS, the choice of an appropriate modulation amplitude was critical to optimize system performance [
33]. The measured amplitude of the 2f signal was recorded for the 1000 ppm CH
4 sample with different modulation depth. An optimal modulation depth of 0.3 V was chosen, resulting in a modulation factor of 2.1 for the best signal response.
The white noise perturbation of 30% modulation depth was chosen for system optimization. The gas mixing system was equipped with 1000 ppm CH4 and the absorption spectroscopy of the WM-OA-ICOS was measured with the white noise perturbation of different modulation depths (0%/30%). The calculated SNRs were 31.2 and 113.9, respectively. And the SNR was significantly increased 3.65 times. By adding white noise perturbation, the cavity mode noise level of the system was effectively reduced and the SNR was significantly improved.
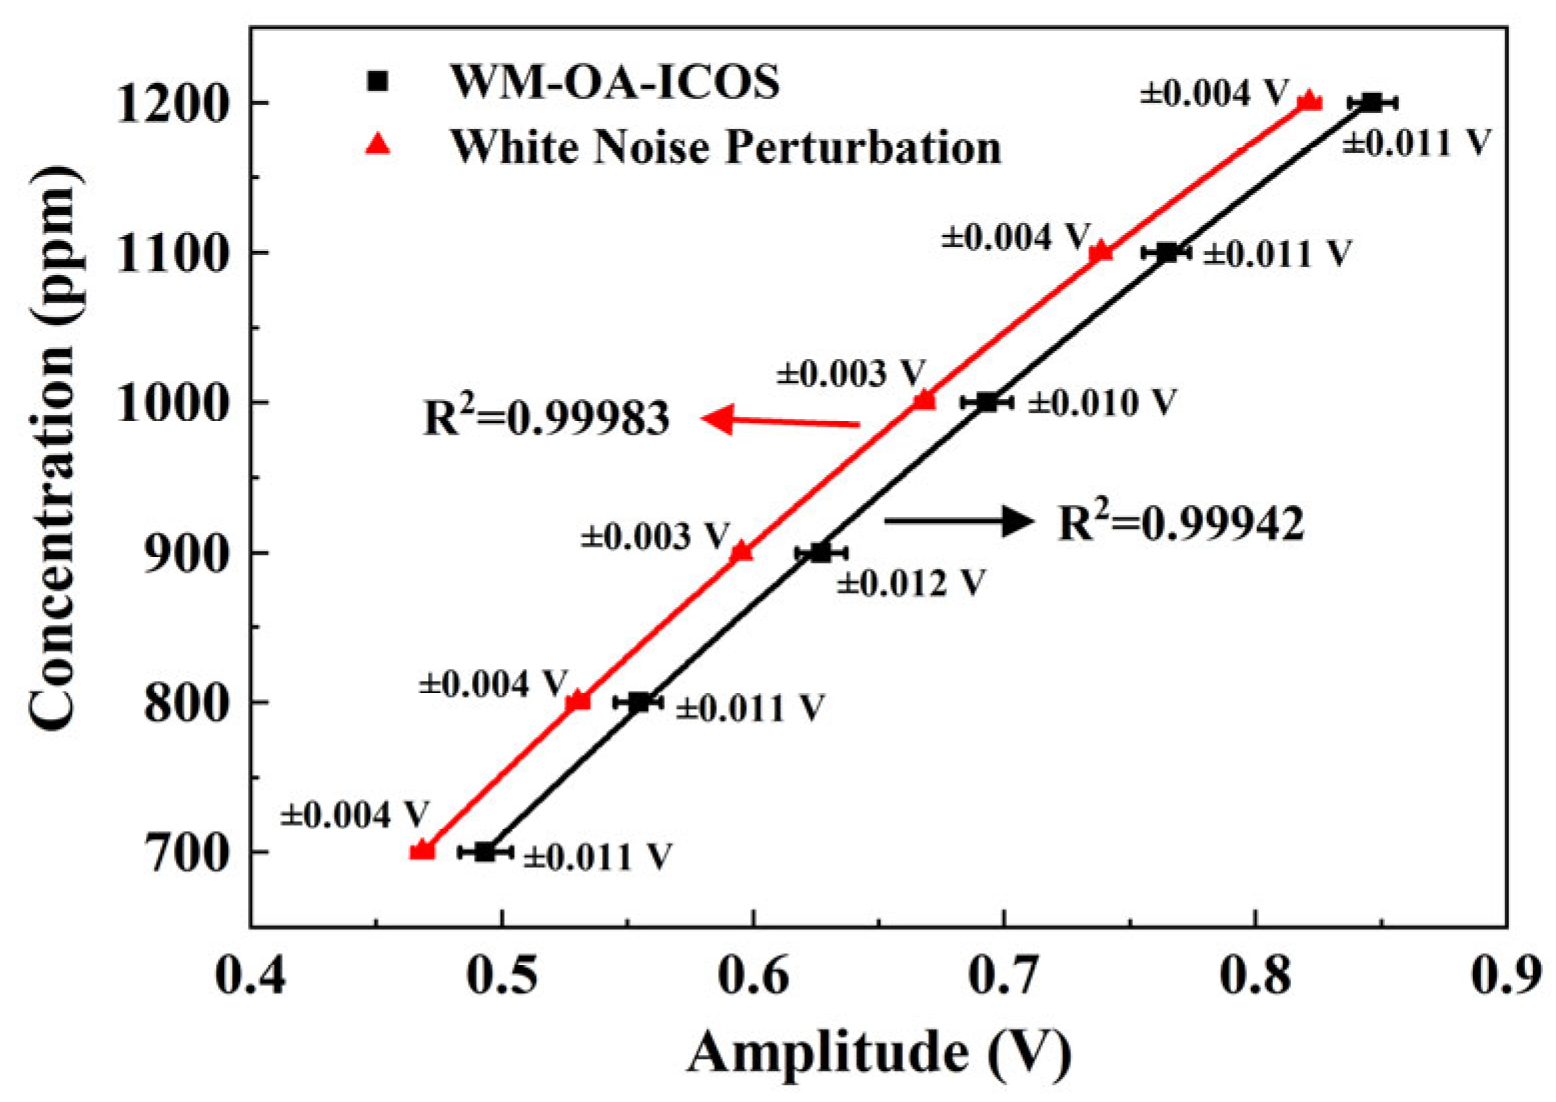
4.2.1. Data Calibration for WM-OA-ICOS
During the further calibration, the CH
4 standard gas was mixed with nitrogen by the gas mixing system to prepare seven gas mixtures with concentrations in the range of 700 ppm to 1200 ppm. The gas mixtures were used to measure the 2f signal amplitude with the original signal and the white noise perturbation. Each concentration was measured 20 times. It could be concluded that the 2f signal absorption peaks of the original signal and the white noise perturbation at different concentrations were significantly different, and these differences could be used for concentration inversion analysis. By fitting the experimental data with the quadratic polynomial, the data fitting curves for the original signal and the white noise perturbation were obtained. The fitting curves between CH
4 concentration and the 2f signal absorption peaks under original signal and white noise perturbation are shown in
Figure 7, and the relationship can be expressed by Equation (7). It could be concluded that the curve fitting of the original signal (black) was 0.99942, while the curve fitting of the white noise perturbation (red) was 0.99983. The average relative deviation of the original signal and the white noise perturbation were 0.010–0.012 V and 0.003–0.004 V, respectively. The results showed that the optimization method with the white noise perturbation of 30% modulation depth significantly improved the curve fitting and enhanced the accuracy of the concentration inversion.
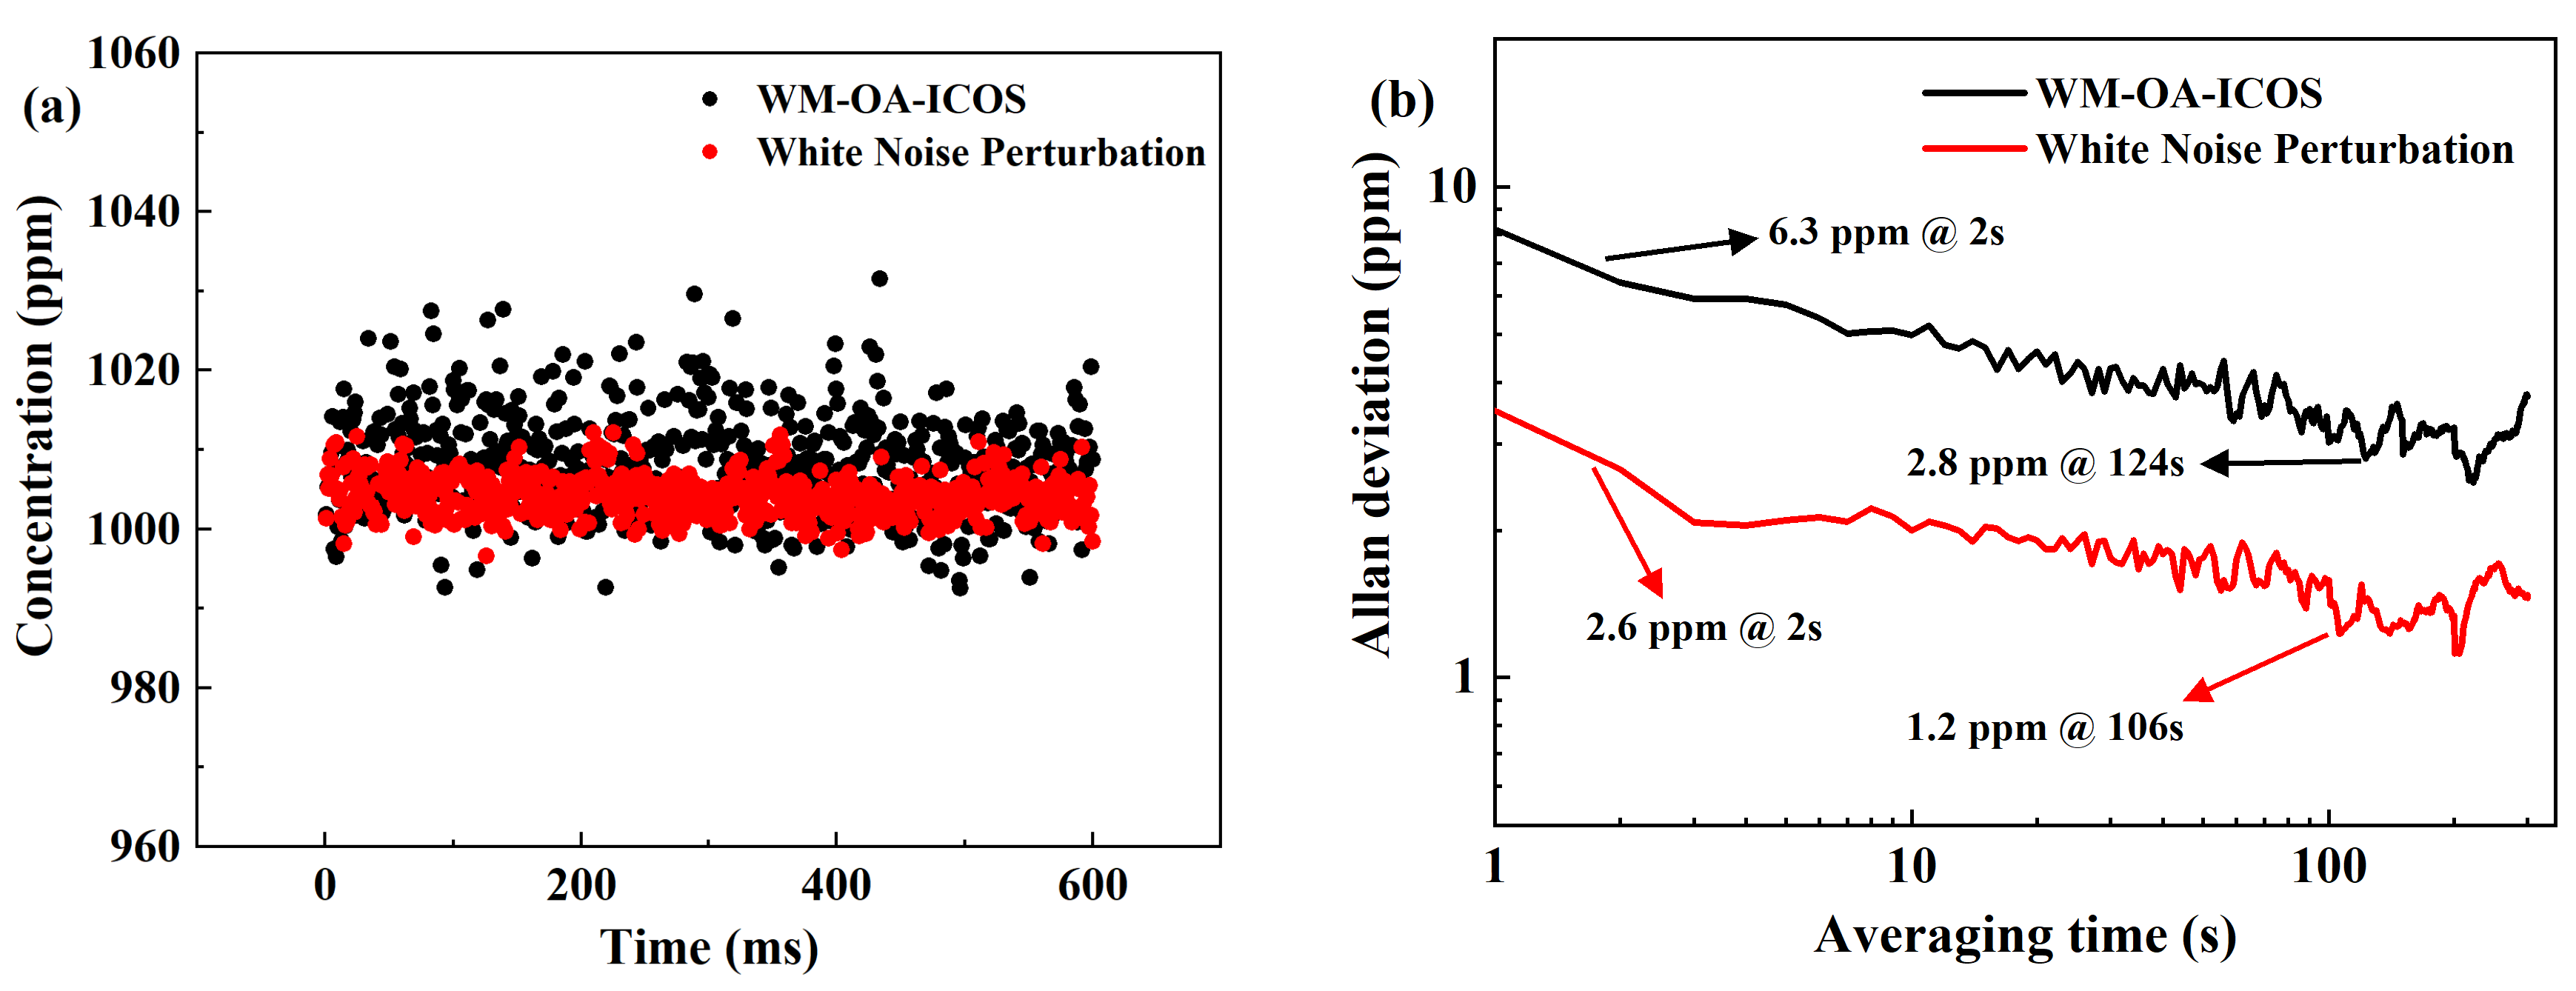
4.2.2. Measurement Stability and MDL for WM-OA-ICOS
In order to fully evaluate the performance of the sensor, measurements were conducted on standard CH
4 gas with the concentration of 1000 ppm for 10 min with 1 s sampling intervals. The MDL was analyzed in detail by the Allan deviation. The concentration data were collected by the sensor under the original signal and the white noise perturbation of 30% modulation depth, as shown in
Figure 8a. The results showed that the concentration fluctuation range of the original signal (black) was less than 40 ppm, while the fluctuation range of the white noise perturbation (red) was reduced to 25 ppm. The average concentration, standard deviation, and maximum uncertainty obtained by the original system were 1008.2 ppm, 6.2 ppm, and 3.1%, respectively. The average concentration, standard deviation, and maximum uncertainty obtained after adding the white noise perturbation were 1004.1 ppm, 2.6 ppm, and 1.2%, respectively. The Allan deviation was further calculated for the original signal and the white noise perturbation, as shown in
Figure 8b. The detection limit of the original signal (black) was 6.3 ppm at 2 s integration time, and the MDL was 2.8 ppm at 124 s integration time. The detection limit of the white noise perturbation of 30% modulation depth (red) was 2.6 ppm at 2 s integration time, and the MDL was 1.2 ppm at 106 s integration time. Compared to the original system under the same conditions, the sensing system with the white noise perturbation of 30% modulation depth improved the MDL by 2.3 times. It was shown that the addition of white noise perturbation not only enhanced the stability of the sensor, but also substantially improved the measurement sensitivity.
4.3. Performance Comparison Between DA-OA-ICOS and WM-OA-ICOS
The performance comparison between DA-OA-ICOS and WM-OA-ICOS is summarized in
Table 1. For the DA-OA-ICOS, an SNR of 16.2 and an MDL was 2.2 ppm at 117 s integration time were achieved. In contrast, the WM-OA-ICOS exhibited a higher SNR of 113.9 and an improved MDL of 1.2 ppm at 106 s integration time. Compared to the DA-OA-ICOS under the same experimental conditions, the WM-OA-ICOS improved the SNR by 7.0 times and the MDL by 1.8 times. The key for the performance improvement was the application of the WMS. The advantage of WMS was that the absorption peak amplitude of the acquired 2f signal was proportional to the gas concentration. In addition, through the selection of the optimal modulation depth, WMS was able to effectively suppress the 1f laser noise and the baseline slope, thereby significantly reducing the excess noise [
34]. As a result, the WM-OA-ICOS sensor could realize better SNR and MDL.
4.4. Long-Term (3 h) Measurements Stability
In order to fully evaluate the long-term measurements stability of the sensor, measurements of standard CH
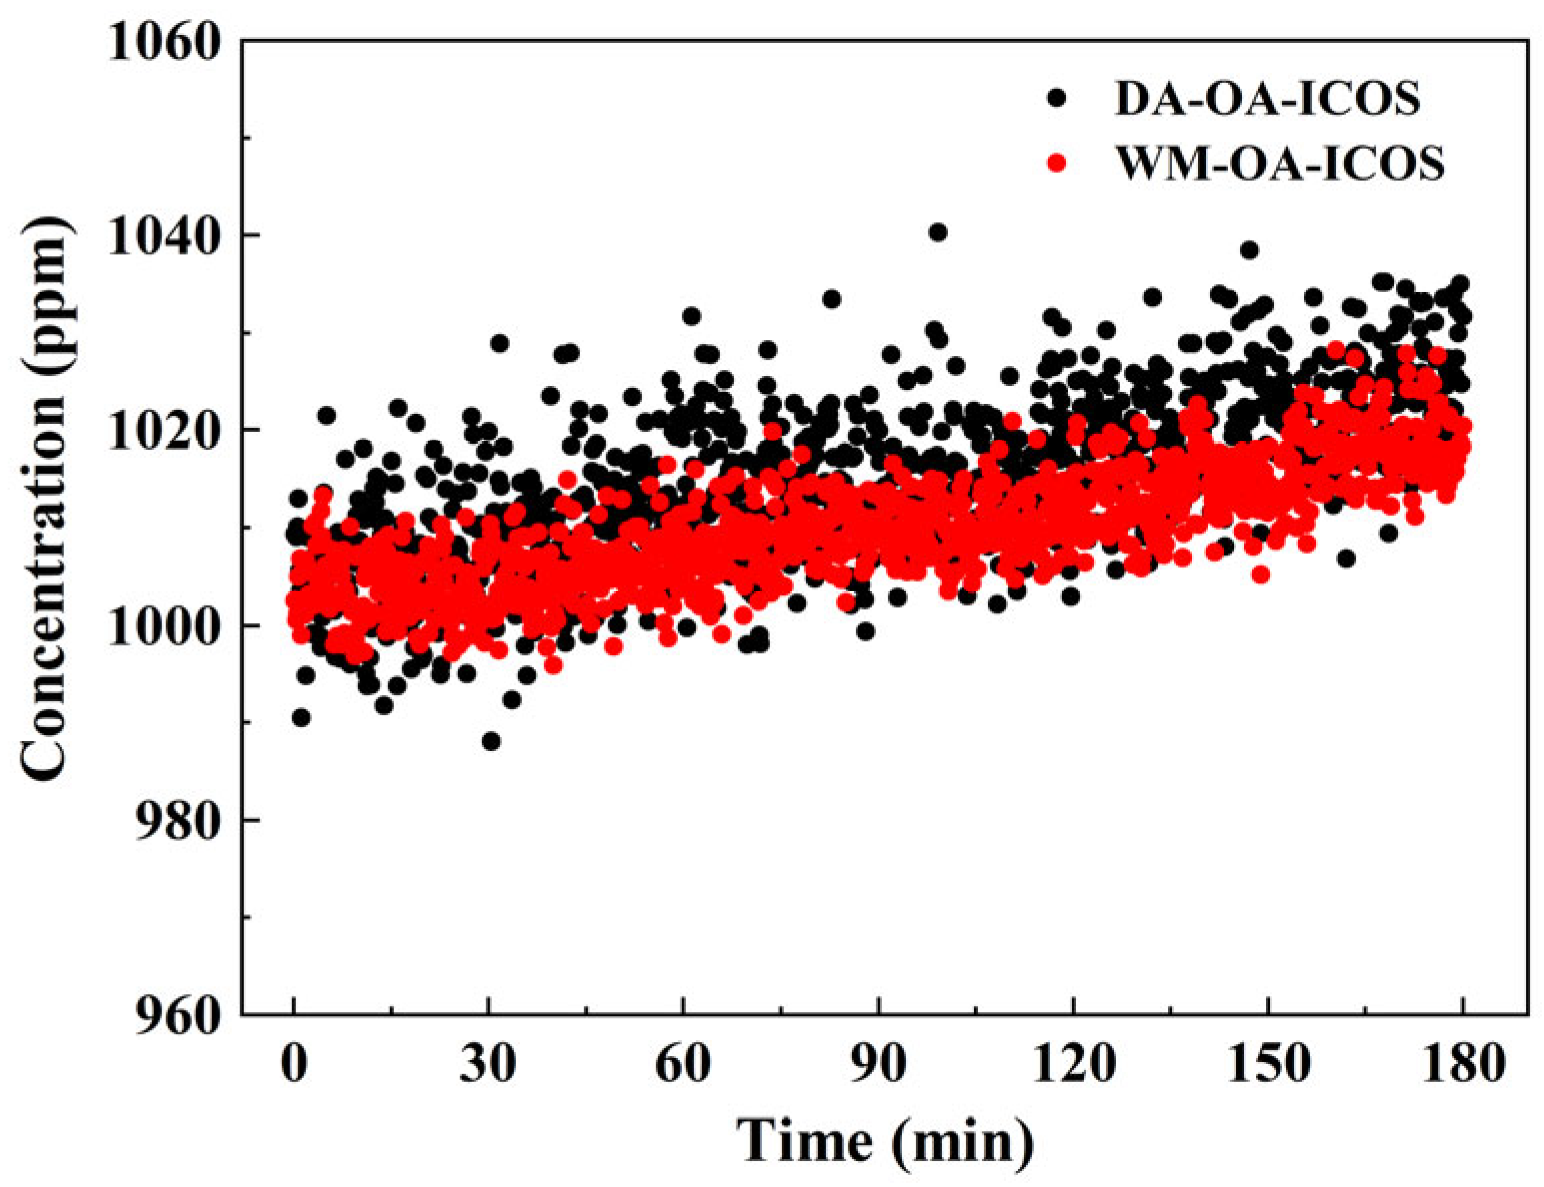
4 gas with the concentration of 1000 ppm were performed for 3 h with 1 s sampling intervals. Every 10 s, data were averaged to form a total of 1080 data. The concentration data were collected by the sensor under the DAS mode with the white noise perturbation and the WMS mode with the white noise perturbation, as shown in
Figure 9. The results indicated that the concentration measurement in WMS mode was more stable than DAS mode. The largest measurement errors for WMS mode and DAS mode were 20 ppm and 40 ppm, respectively. The measured concentration had shifted with the long-term operation of the sensor. It might have been the system temperature rising.
5. Conclusions
In this work, a CH4 sensor with the DA-OA-ICOS and WM-OA-ICOS measurement modes was proposed. To enhance the performance of the sensor, a small-size optical resonance cavity with a length of 7 cm was designed. An effective optical path length of 10.8 m and a cavity volume of 8.9 mL were obtained, which could realize rapid and efficient gas measurements with minimal gas samples. In addition, the cavity mode noise of the CH4 sensor could be effectively suppressed by the application of the white noise perturbation of 30% modulation depth. The performance of the two measurement modes was compared by experiments. In DAS mode, the SNR of the OA-ICOS was 16.2 and the Allan deviation analysis of MDL was 2.2 ppm at 117 s. In WMS mode, the SNR of the OA-ICOS was 113.9 and the Allan deviation analysis of MDL was 1.2 ppm at 106 s. The results of the WM-OA-ICOS compared to the DA-OA-ICOS were improved 7.0 times in SNR and 1.8 times in MDL. The significant advantages of the WMS mode for CH4 measurement were demonstrated. The long-term (3 h) measurement experiments showed that the concentration measurement in WMS mode was more stable than in DAS mode. The developed sensor achieved high sensitivity measurement at low concentrations and demonstrated wide application potential. In future work, the performance of the sensor can be further enhanced by optimizing the structural design of the optical resonance cavity and combining with the software for noise reduction.
Author Contributions
Writing-review and editing, C.Y., M.W. and C.C.; software, C.L.; validation, J.H.; formal analysis, L.S.; investigation, Y.L. All authors have read and agreed to the published version of the manuscript.
Funding
This work was supported in part by the National Key R&D Program of China under (Grant No. 2024YFC2814300), in part by the Science and Technology Department of Jilin Province of China under Grant 20240304195SF, in part by the Industrial Technology Research and Development Project of Jilin Provincial Development and Reform Commission under Grant 2024C007-5.
Institutional Review Board Statement
Not applicable.
Informed Consent Statement
Not applicable.
Data Availability Statement
The data presented in this study are available on request from the corresponding author. The data are not publicly available due to data must not be used for commercial purposes.
Conflicts of Interest
The authors declare no conflicts of interest.
References
- Malerba, M.E.; Kluyver, T.D.; Wright, N.; Omosalewa, O.; Macreadie, P.I. Including methane emissions from agricultural ponds in national greenhouse gas inventories. Environ. Sci. Technol. 2024, 58, 8349–8359. [Google Scholar] [CrossRef] [PubMed]
- Abbadi, S.H.E.; Chen, Z.L.; Burdeau, P.M.; Rutherford, J.S.; Chen, Y.L.; Zhang, Z.; Sherwin, E.D.; Brandt, A.R. Technological maturity of aircraft-based methane sensing for greenhouse gas mitigation. Environ. Sci. Technol. 2024, 58, 9591–9600. [Google Scholar] [CrossRef] [PubMed]
- Agún, B.; Abánades, A. Comprehensive review on dry reforming of methane: Challenges and potential for greenhouse gas mitigation. Int. J. Hydrogen Energy 2025, 103, 395–414. [Google Scholar] [CrossRef]
- Liu, S.X.; Xue, M.; Cui, X.Y.; Peng, W.Z. A review on the methane emission detection during offshore natural gas hydrate production. Front. Energy Res. 2023, 11, 1130810. [Google Scholar] [CrossRef]
- Delgado, M.; López, A.; Esteban, A.L.; Lobo, A. Some findings on the spatial and temporal distribution of methane emissions in landfills. J. Clean. Prod. 2022, 362, 132334. [Google Scholar] [CrossRef]
- Das, S.R.; Nayak, B.K.; Dey, S.; Sarkar, S.; Chatterjee, D.; Saha, S.; Sarkar, D.; Pradhan, A.; Saha, S.; Nayak, A.K. Potential soil organic carbon sequestration vis-a-vis methane emission in lowland rice agroecosystem. Environ. Monit. Assess. 2023, 195, 1099. [Google Scholar] [CrossRef]
- Riddick, S.N.; Mauzerall, D.L.; Celia, M.; Allen, G.; Pitt, J.; Kang, M.; Riddick, J.C. The calibration and deployment of a low-cost methane sensor. Atmos. Environ. 2020, 230, 117440. [Google Scholar] [CrossRef]
- Sekhar, P.K.; Kysar, J.; Brosha, E.L.; Kreller, C.R. Development and testing of an electrochemical methane sensor. Sensor. Actuators B-Chem. 2016, 228, 162–167. [Google Scholar] [CrossRef]
- Xia, J.B.; Zhu, F.; Zhang, S.S.; Kolomenskii, A.; Schuessler, H. A ppb level sensitive sensor for atmospheric methane detection. Infrared Phys. Technol. 2017, 86, 194–201. [Google Scholar] [CrossRef]
- Shastri, A.; Das, A.K.; Rajasekhar, B.N. The electronic absorption spectrum of Anisole studied by photoabsorption spectroscopy and quantum chemical calculations. J. Quant. Spectrosc. Radiat. 2020, 242, 106782. [Google Scholar] [CrossRef]
- Huang, W.; Sun, H.; Zhao, C.; Wang, K.; Yang, J.; Fang, Y.J.; Yang, H.N. Investigation into ethanol film thicknesses in the evaporation, injection, and flow processes by an online measurement system based on absorption spectroscopy. Measurement 2024, 238, 115285. [Google Scholar] [CrossRef]
- Yang, H.Q.; Bu, X.Z.; Cao, Y.H.; Song, Y. A methane telemetry sensor based on near-infrared laser absorption spectroscopy. Infrared Phys. Technol. 2021, 114, 103670. [Google Scholar] [CrossRef]
- Huang, W.; Sun, H.; Liu, Z.Y.; Wang, K.; Su, M.X.; Yang, H.N. Investigation into injection and falling film flow processes of diesel. Measurement 2023, 218, 113120. [Google Scholar] [CrossRef]
- Koldaev, V.M.; Manyakhin, A.Y. Numerical indicators of absorption spectra of green leaf extract obtained from plants of different life forms. Spectrochim. Acta A 2018, 203, 404–407. [Google Scholar] [CrossRef]
- Czapla-Masztafiak, J.; Szlachetko, J.; Milne, C.J.; Lipiec, E.; Sá, J.; Penfold, T.J.; Huthwelker, T.; Borca, C.; Abela, R.; Kwiatek, W.M. Investigating DNA Radiation Damage Using X-Ray Absorption Spectroscopy. Biophys. J. 2016, 110, 1304–1311. [Google Scholar] [CrossRef] [PubMed]
- Shao, L.G.; Mei, J.X.; Chen, J.J.; Tan, T.; Wang, G.S.; Liu, K.; Gao, X.M. Recent advances and applications of off-axis integrated cavity output spectroscopy. Microw. Opt. Technol. Lett. 2022, 65, 1489–1505. [Google Scholar] [CrossRef]
- Ko, K.H.; Kim, Y.H.; Kim, T.S.; Lee, L.; Park, H. Measurement of 14CO2 using off-axis integrated cavity output spectroscopy. Appl. Phys. B 2022, 128, 149. [Google Scholar] [CrossRef]
- Yang, X.; Zhang, Z.R.; Xia, H.; Sun, P.S.; Pang, T.; Wu, B.; Liu, X.; Guo, Q. Re-injection off-axis integrated cavity output spectroscopy for the simultaneous detection of N2O, H2O and CO with a mid-infrared QCL laser. Analyst 2024, 149, 909–916. [Google Scholar] [CrossRef]
- Zheng, K.Y.; Zheng, C.T.; Zhang, H.P.; Li, J.H.; Liu, Z.D.; Chang, Z.Y.; Zhang, Y.; Wang, Y.D.; Tittel, F.K. Near-infrared off-axis integrated cavity output spectroscopic gas sensor for real-time, in situ atmospheric methane monitoring. IEEE Sens. J. 2020, 21, 6830–6838. [Google Scholar] [CrossRef]
- He, Q.X.; Chang, J.Q.; Li, J.K.; Zheng, C.T.; Tittel, F.K. On-line measurement of atmospheric oxygen by an open-path OA-ICOS based sensor with high accuracy at ambient pressure. Infrared Phys. Technol. 2023, 131, 104699. [Google Scholar] [CrossRef]
- Zhang, L.; Hua, Y.; Zhou, Y.S.; Zheng, K.Y.; Song, F.; Chang, Z.Y.; Zheng, C.T. Near-Infrared Mobile Cloud OA-ICOS Sensor System for Atmospheric Carbon Dioxide Monitoring. Anal. Chem. 2025, 97, 4021–4030. [Google Scholar] [CrossRef] [PubMed]
- Zheng, K.Y.; Zheng, C.T.; Li, J.H.; Ma, N.N.; Liu, Z.D.; Zhang, Y.; Wang, Y.D.; Tittel, F.K. Near-infrared methane sensor system using off-axis integrated cavity output spectroscopy with novel dual-input dual-output coupling scheme for mode noise suppression. Sens. Actuators B Chem. 2020, 308, 127674. [Google Scholar] [CrossRef]
- Kumar, N.; Pal, A.K.; Kshirsagar, R.J. Near-infrared detection and line intensity measurements of H2S with ECDL source based off-axis integrated cavity output spectroscopy. Chem. Phys. 2023, 567, 111804. [Google Scholar] [CrossRef]
- Zheng, K.Y.; Zheng, C.T.; Li, J.H.; Ma, N.N.; Liu, Z.D.; Li, Y.Y.; Zhang, Y.; Wang, Y.D.; Tittel, F.K. Novel gas-phase sensing scheme using fiber-coupled off-axis integrated cavity output spectroscopy (FC-OA-ICOS) and cavity-reflected wavelength modulation spectroscopy (CR-WMS). Talanta 2020, 213, 120841. [Google Scholar] [CrossRef]
- Li, G.L.; Zhang, S.Y.; Liu, Y.J.; Dong, E.T.; Jia, L.P.; Zhao, F.L.; Zhao, Y.J.; Li, L.J.; Yuan, H.R.; Cui, G.Z.; et al. Near-infrared dual-range methane sensor using the OAIC-HC mode based on VMD-SG-assisted optical noise suppression. Anal. Chem. 2024, 96, 16891–16899. [Google Scholar] [CrossRef] [PubMed]
- Zheng, K.Y.; Zheng, C.T.; Zhang, H.P.; Guan, G.Y.; Zhang, Y.; Wang, Y.D.; Tittel, F.K. A novel gas sensing scheme using near-infrared multi-input multi-output off-axis integrated cavity output spectroscopy (MIMO-OA-ICOS). Spectrochim. Acta Part A Mol. Biomol. Spectrosc. 2021, 256, 119745. [Google Scholar] [CrossRef] [PubMed]
- Nadeem, F.; Mandon, J.; Cristescu, S.M.; Harren, F.J.M. Intensity enhancement in off-axis integrated cavity output spectroscopy. Appl. Opt. 2018, 57, 8536–8542. [Google Scholar] [CrossRef]
- Wang, J.J.; Tian, X.; Dong, Y.; Zhu, G.D.; Chen, J.J.; Tan, T.; Liu, K.; Chen, W.D.; Gao, X.M. Enhancing off-axis integrated cavity output spectroscopy (OA-ICOS) with radio frequency white noise for gas sensing. Opt. Express 2019, 27, 30517–30529. [Google Scholar] [CrossRef]
- Liu, Y.X.; Wang, Z.B.; Wei, X.X.; Wang, J.J.; Meng, X.; Mao, G.L. Simultaneous detection of CH4 and CO2 through dual modulation off-axis integrated cavity output spectroscopy. Chin. Phys. B 2023, 32, 104209. [Google Scholar] [CrossRef]
- Ciaffoni, L.; Couper, J.; Hancock, G.; Peverall, R.; Robbins, P.A.; Ritchie, G.A.D. RF noise induced laser perturbation for improving the performance of non-resonant cavity enhanced absorption spectroscopy. Opt. Express 2014, 22, 17030–17038. [Google Scholar] [CrossRef]
- Wang, J.J.; Tian, X.; Dong, Y.; Chen, J.J.; Tan, T.; Zhu, G.D.; Chen, W.D.; Gao, X.M. High-sensitivity off-axis integrated cavity output spectroscopy implementing wavelength modulation and white noise perturbation. Opt. Lett. 2019, 44, 3298–3301. [Google Scholar] [CrossRef] [PubMed]
- Wang, J.J.; Dong, Y.; Tian, X.; Chen, J.J.; Tan, T.; Zhu, G.D.; Mei, J.X.; Gao, X.M. Application of white noise perturbation in wavelength modulated off-axis integrated cavity spectroscopy. Spectrosc. Spect. Anal. 2020, 40, 2657–2663. [Google Scholar]
- He, Q.X.; Zheng, C.T.; Zheng, K.Y.; Tittel, F.K. Off-axis integrated cavity output spectroscopy for real-time methane measurements with an integrated wavelength-tunable light source. Infrared Phys. Technol. 2021, 115, 103705. [Google Scholar] [CrossRef]
- Zheng, K.Y.; Zheng, C.T.; He, Q.X.; Yao, D.; Hu, L.; Zhang, Y.; Wang, Y.D.; Tittel, F.K. Near-infrared acetylene sensor system using off-axis integrated-cavity output spectroscopy and two measurement schemes. Opt. Express 2018, 26, 26205–26216. [Google Scholar] [CrossRef]
| Disclaimer/Publisher’s Note: The statements, opinions and data contained in all publications are solely those of the individual author(s) and contributor(s) and not of MDPI and/or the editor(s). MDPI and/or the editor(s) disclaim responsibility for any injury to people or property resulting from any ideas, methods, instructions or products referred to in the content. |
© 2025 by the authors. Licensee MDPI, Basel, Switzerland. This article is an open access article distributed under the terms and conditions of the Creative Commons Attribution (CC BY) license (https://creativecommons.org/licenses/by/4.0/).


 ,
, 
