Article

Advanced Rheological Characterization of Asphalt Binders Modified with Eco-Friendly and Polymer-Based Additives Under Dynamic Loading

by
Ali Almusawi
1,* and
Shvan Tahir Nasraldeen Nasraldeen
1,2
1
Department of Civil Engineering, Faculty of Engineering, Çankaya University, Ankara 06815, Türkiye
2
Department of Civil Engineering, Faculty of Engineering, University of Kirkuk, Kirkuk 36013, Iraq
*
Author to whom correspondence should be addressed.
Appl. Sci. 2025, 15(10), 5552; https://doi.org/10.3390/app15105552
Submission received: 19 April 2025 / Revised: 13 May 2025 / Accepted: 13 May 2025 / Published: 15 May 2025
(This article belongs to the Special Issue Innovations in Binder and Asphalt Mixture Rheology)

Abstract

:
This study explores the rheological performance of bitumen modified with a synthetic polymer (styrene–butadiene–styrene, SBS) and two environmentally sustainable additives—animal bone ash (AB) and waste cooking oil (WCO)—to enhance durability and deformation resistance under dynamic loading. Frequency sweep and linear amplitude sweep (LAS) tests were conducted to evaluate viscoelastic and fatigue behavior. SBS at 5% showed the highest elasticity and fatigue life, making it optimal for heavily trafficked pavements. Among bio-waste additives, 6% AB provided the highest stiffness and rutting resistance in laboratory tests; however, 5% AB offered a better balance between structural integrity and cracking resistance, making it more suitable for general pavement applications. WCO-modified binders demonstrated improved flexibility, with 4% WCO achieving the best balance between elasticity and softening, ideal for low-load or temperate environments. These results highlight the potential of combining synthetic and bio-based waste materials to tailor bitumen properties for sustainable and climate-responsive pavement design.

1. Introduction

Bitumen modification has become a critical technique in the construction industry to improve the performance and durability of asphalt pavements. Conventional bitumen, although widely used, often lacks the mechanical robustness required to endure harsh environmental and loading conditions. This deficiency can lead to early-stage pavement failures such as rutting, cracking, and deformation. To address these challenges, various additives—such as polymers, fillers, and oils—are commonly introduced into the bitumen matrix to enhance its rheological properties. These modifications not only improve the mechanical properties of the asphalt but also contribute to its overall longevity [1,2,3,4,5].
One of the most widely used modifiers is styrene–butadiene–styrene (SBS), a thermoplastic elastomer known for its ability to improve the elasticity and thermal resistance of bitumen. The addition of SBS has proven effective in increasing the durability of bitumen under high-temperature and dynamic load conditions. In recent years, however, the focus has shifted towards more sustainable alternatives, such as waste materials and bio-based modifiers. Among these, animal bone ash (AB) and waste cooking oil (WCO) have gained attention due to their environmental benefits and their potential to further enhance bitumen properties. These sustainable modifiers provide an opportunity to not only improve performance but also reduce the environmental impact of road construction [6,7,8,9].
The incorporation of waste cooking oil into bitumen has been extensively studied, with promising results regarding its impact on the rheological properties of asphalt binders. Previous studies, such as those by Azahar et al. [10] and Wang et al. [11], have shown that chemically modified WCO can improve the viscosity, elasticity, and overall performance of asphalt, particularly in aged asphalt mixtures. Similarly, research conducted by Zhang et al. [12] highlighted the importance of the type and quality of WCO used, as these factors significantly influence the rheological properties of the modified bitumen. Furthermore, studies by Yuechao et al. [13] emphasized the complex interactions between WCO components and bitumen, which further underscore the need for a comprehensive understanding of these modifications.
The combination of WCO with SBS has also been explored as a means to enhance the performance of modified bitumen. Research by Zhao and Dong [14] demonstrated that SBS, when combined with WCO, not only improves high-temperature performance but also enhances low-temperature cracking resistance. These findings are crucial for extending the service life of asphalt pavements under varying temperature conditions. Additional studies, such as those by Ma et al. [15] and Liu et al. [16], have focused on optimizing preparation methods and examining the temperature-dependent behaviors of WCO-modified bitumen, further contributing to the understanding of how these sustainable additives influence bitumen performance across different climates.
Animal bone ash, though less studied, presents a promising avenue for enhancing the rheological properties of bitumen. While research has traditionally focused on other types of ash, such as palm oil fuel ash, the potential of animal bone ash as a modifier remains largely unexplored. Recent studies, such as those by Kadhim et al. [17], have demonstrated that animal bone ash can significantly improve the mechanical properties of asphalt concrete. The incorporation of animal bone ash into asphalt concrete has been shown to increase Marshall stability and improve the bond between bitumen and aggregate particles, which is crucial for durability under various loading conditions. Also, recent studies, such as those by Garedew [18], have analyzed the effects of waste animal bone ash and Portland cement on bitumen. These studies found that the incorporation of up to 3% animal bone ash significantly improved the resistance of asphalt binders to rutting, especially at high temperatures, by increasing the stiffness and shear modulus of the modified binder. This is attributed to the high calcium content in animal bone ash, which enhances the bonding within the binder, resulting in better mechanical properties. Moreover, Öntaş and Öner [19] explored the use of bone ash as an alternative to traditional filler materials in asphalt mixtures. Their findings indicate that a 5% addition of bone ash optimizes the stability and performance of asphalt, suggesting its potential for improving the mechanical and physical properties of bitumen. The chemical composition of bone ash, which consists predominantly of calcium and magnesium, may offer unique advantages when used in conjunction with other modifiers like Styrene–butadiene–styrene (SBS) and waste cooking oil (WCO), enhancing the overall performance of modified bitumen. Specifically, its high calcium phosphate content and porous structure act as a rigid mineral filler that improves binder stiffness, thermal stability, and resistance to deformation. Additionally, as a byproduct of animal waste, bone ash contributes to waste valorization, making it a cost-effective and environmentally sustainable additive [19].
Moreover, the linear amplitude sweep (LAS) test has gained significant attention in recent research as an effective tool for evaluating the fatigue characteristics of modified asphalt binders. According to Zhou et al. [20], the conventional parameter G*sinδ alone may lack sensitivity in distinguishing the fatigue resistance of various binders, highlighting LAS testing as a superior alternative for such assessments. This testing approach proves especially valuable when examining the performance of binders modified with materials like styrene–butadiene–styrene (SBS), bone ash, and cooking oil, as it provides a more nuanced insight into their performance across diverse stress conditions.
The aim of this study is to investigate the potential of three distinct additives—styrene–butadiene–styrene (SBS), animal bone ash (AB), and waste cooking oil (WCO)—in enhancing the rheological and mechanical performance of bitumen under various loading conditions. Each of these additives influences different aspects of bitumen behavior: SBS is known for improving elasticity and thermal resistance, AB enhances stiffness and structural strength, while WCO contributes to flexibility and workability. Although studies have explored the individual effects of these materials, a direct comparison under unified test conditions remains lacking. To our knowledge, no study has experimentally evaluated the simultaneous use of SBS, AB, and WCO together. However, several studies have investigated the interaction between two of these additives, particularly SBS and WCO, under various conditions. The combined use of styrene–butadiene–styrene (SBS) and waste cooking oil (WCO) has been widely investigated to enhance the performance of asphalt binders while improving sustainability. Çavdar et al. [21] observed that incorporating WCO into SBS-modified bitumen increased workability and fatigue resistance but slightly decreased rutting resistance. Importantly, low WCO dosages allowed reductions in mixing and compaction temperatures without significant performance loss. Jiménez et al. [22] reported that WCO lowers the upper and lower limits of the performance grade (PG) and alters its interaction with SBS, but SBS dosage remains the dominant factor in enhancing resistance to permanent deformation and fatigue. Zhang et al. [23] developed a reactive rejuvenation method combining WCO with methylene diphenyl diisocyanate (MDI), finding that WCO restores low-temperature performance, while MDI strengthens high-temperature properties by chemically reconstructing the SBS network. Yu et al. [24] used molecular dynamics simulations to show that WCO disperses among asphaltene molecules, disrupting their aggregation and improving binder dispersion in aged SBS asphalt, although it does not reverse oxidative aging. In addition, Rizvi et al. [25] demonstrated that bone glue significantly improves fatigue life, stiffness, and creep compliance of asphalt binders, with minimal changes to viscosity and processing temperatures. Collectively, these studies highlight the complementary effects of SBS for elasticity, WCO for flexibility and rejuvenation, and bone-derived additives for structural reinforcement, offering a promising approach to sustainable and high-performance asphalt binder design. By systematically evaluating their separate effects using consistent rheological methods, this study provides critical insights into the comparative effectiveness of conventional and sustainable modifiers. The findings serve as a foundation for future research on potential multi-additive systems, guiding the development of optimized, durable, and environmentally friendly bitumen formulations.
This research is notable for its environmental emphasis, utilizing external waste materials such as animal bone ash and used cooking oil—byproducts from other industries—which support sustainability goals and promote their valorization within road construction applications. The rheological assessments, particularly the frequency and amplitude sweep analyses, provide rigorous insights into the performance characteristics of these modifiers, setting a foundation for future applications in high-stress infrastructure. Through this study, the integration of sustainable additives in bitumen modification is highlighted as a path toward greener, longer-lasting, and adaptable pavement solutions.
In conclusion, this study identifies 5% SBS as the most effective modifier for enhancing bitumen’s rheological performance under various loading conditions, while 6% animal bone ash provides the greatest improvement in stiffness, and 4% waste cooking oil offers a balanced enhancement in flexibility. These findings offer valuable insights into the development of high-performance, eco-friendly pavement materials.

2. Materials

Bitumen: In this study, 40/50 penetration grade bitumen was used as the base binder, which is known for its high viscosity and stiffness, making it suitable for high-temperature regions. This selection aligns with real-world applications in hot climates where stiffer binders are required to resist rutting and deformation under heavy traffic loads. Moreover, using a stiff base binder allows for a more accurate assessment of the softening effects of waste cooking oil (WCO) and the reinforcing capabilities of SBS and animal bone ash. By observing the interaction of these additives with a high-viscosity binder, the study aims to reflect practical field scenarios and evaluate performance enhancements in a realistic context. Table 1 shows the physical properties of neat bitumen.
SBS (styrene–butadiene–styrene): SBS, obtained from Istanbul Teknik, is a widely used polymer modifier that enhances bitumen by increasing its elasticity, flexibility, and overall durability. It was incorporated into the asphalt binder at concentrations of 4% and 5% by weight to improve its rheological and mechanical properties [1,32]. Detailed technical data for SBS can be found in Table 2.
Waste cooking oil: the used cooking oil was gathered from multiple sources and filtered to eliminate impurities. After filtration, it was chemically treated to enhance its physical and rheological characteristics. The bitumen was heated to 130 °C, and the modified cooking oil was blended into the bitumen at a consistent temperature of 160 °C using a high-speed mixer operating at 1000 RPM. The oil was incorporated into the bitumen mixture at proportions of 3%, 4%, and 5% by weight [10].
Animal bone ash: Locally sourced cow bones were cleaned and sun-dried before being fired in a specialized furnace at 800 °C for 90 min, which turned them black. The fired bones were then ground into a fine powder and passed through a No. 200 sieve. This bone powder, rich in calcium oxide (CaO) and phosphorus pentoxide (P2O5), was added as a filler to the bitumen mixture at 4%, 5%, and 6% by weight [18,40]. The chemical composition of the bone ash, as reported by Garedew (2021) [18], includes approximately 42.92% CaO, 26.94% P2O5, 5.28% SiO2, and 0.94% MgO, which are known to enhance the stiffness and mechanical properties of the binder by improving the filler–binder interaction.

3. Methodology

3.1. Frequency Sweep Rheological Tests

Frequency sweep tests were carried out on bitumen samples to evaluate their viscoelastic properties at temperatures of 15 °C and 25 °C. These two temperatures were selected to represent intermediate service conditions commonly experienced by asphalt pavements. The lower temperature, 15 °C, corresponds to early spring or nighttime conditions in cooler regions, making it suitable for evaluating fatigue cracking behavior. The higher temperature, 25 °C, reflects typical daytime temperatures in moderate to warm climates. This selection is consistent with prior studies and testing guidelines and provides a reliable framework for comparing the temperature sensitivity of modified and unmodified binders.
The tests utilized an Anton Paar Rheometer with RheoCompass software (v. 1.35.1394) and were performed under two stress levels: Glover–Rowe (G–R) parameter = 180 kPa and G–R = 600 kPa. These stress levels were selected to simulate moderate and severe traffic loading conditions, respectively. Specifically, 180 kPa represents typical service-level stress experienced under standard vehicle loads, while 600 kPa reflects heavier axle loads encountered in more demanding traffic scenarios. This selection aligns with established practices in LAS testing, including recommendations in NCHRP Report 927 [41], to enable comprehensive evaluation of binder fatigue behavior under varied loading intensities. Sample preparation adhered to standardized rheological protocols, ensuring consistency across all experiments. The primary focus of the rheological tests was on three key aspects: G–R index analysis, the frequency-dependent behavior of storage and loss moduli, and the relationship between complex viscosity and the loss factor (tan δ). The tests employed a parallel plate setup to conduct dynamic frequency sweeps, covering a frequency range from 0.01 rad/s to 100 rad/s, providing a thorough evaluation of the material’s performance over a broad frequency spectrum.
All frequency sweep measurements—including storage modulus (G′), loss modulus (G″), complex viscosity (η), and phase angle (δ)—were conducted in accordance with ASTM D7175 [42] using a Dynamic Shear Rheometer (DSR) with parallel plate geometry.

3.2. G–R Index Analysis

In the initial set of tests, both the complex shear modulus (|G*|) and the phase shift angle (δ) were measured for samples at 15 °C and 25 °C. The G–R index was calculated to assess the damage potential of the bitumen under various conditions. The phase shift angle (δ) directly reflects the balance between the material’s elastic and viscous behaviors.
The G–R index was calculated using Equation (1):
G R = G * c o s 2 δ s i n δ
where |G*| is the complex shear modulus (in Pa), and δ is the phase angle (in degrees). This parameter quantifies the binder’s brittleness and its susceptibility to fatigue and thermal cracking, especially at intermediate service temperatures.
These results were used to generate Glover–Rowe (G–R) parameter plots, which delineate areas with no block cracking, potential damage zones, and block cracking risks. The complex shear modulus (|G*|) was plotted against the phase shift angle (δ), with different regions indicating the material’s vulnerability to damage under stress. Higher G–R values (above 180 kPa) indicate a brittle binder more susceptible to low-temperature and fatigue cracking, while lower G–R values (below 100 kPa) reflect a more flexible binder prone to rutting at elevated temperatures. The intermediate zone (100–180 kPa) represents a balance where the binder shows moderate resistance to both cracking and rutting.
The 15 °C results represent cooler climatic conditions, where binders with higher G–R values are more likely to experience thermal and fatigue cracking. In contrast, the 25 °C results simulate warmer environments where rutting is more critical; binders with low G–R values in this range may be more vulnerable to permanent deformation. This plot offered valuable insights into the bitumen’s ability to resist cracking and rutting, particularly under different climatic and loading conditions. The G–R index also helped to determine the material’s performance limits, highlighting when it transitions from an undamaged state to a damage-prone zone.

3.3. Storage and Loss Modulus Analysis

The second set of tests concentrated on assessing the storage modulus (G′) and loss modulus (G″) across the same frequency range. The storage modulus (G′) reflects the elastic component of the material’s response, indicating its ability to store energy during deformation, while the loss modulus (G″) represents the viscous component, showing how much energy is lost as heat.
These moduli were measured throughout the frequency sweep, and their values were plotted against angular frequency (ω) at both temperatures. The results illustrated whether the bitumen exhibited more elastic (solid-like) or viscous (liquid-like) behavior under dynamic conditions. Higher G′ values indicate greater energy storage elastically, whereas higher G″ values suggest a more viscous behavior.
This analysis offered detailed insights into how the bitumen’s energy storage and dissipation change with frequency, particularly under high-temperature and high-stress scenarios. The test results at 15 °C and 25 °C facilitated a comparative analysis of the material’s behavior across different temperatures.

3.4. Complex Viscosity and Loss Factor (Tan δ) Analysis

The third test examined the relationship between complex viscosity (η*) and the loss factor (tan δ). Complex viscosity (η*) characterizes the material’s resistance to deformation under oscillatory stress. The frequency sweep provided comprehensive insights into how viscosity varies with increasing frequency, highlighting the shear-thinning behavior of the bitumen. As frequency rose, complex viscosity (η*) decreased, indicating that the bitumen became less viscous and more susceptible to flow under dynamic loading.
The loss factor (tan δ), defined as the ratio of the loss modulus (G″) to the storage modulus (G′), was also evaluated. This parameter illustrates the balance between the material’s viscous and elastic characteristics. A higher tan δ signifies more viscous, fluid-like behavior, whereas a lower value points to a more elastic, solid-like response. By plotting tan δ against complex viscosity, the material’s transition between elastic and viscous behavior across various frequencies became apparent. Although tan δ values were not discussed in isolation, their influence is inherently captured through the analysis of G′ and G″ trends and their contribution to other rheological indicators such as the Glover–Rowe (G–R) index. This indirect approach provides a comprehensive understanding of binder behavior without duplicating the interpretation already derived from moduli and composite indices.
Through the analysis of complex viscosity and tan δ at both 15 °C and 25 °C, the material’s performance under different temperature conditions was assessed. These findings offered critical insights into the bitumen’s rheological behavior, emphasizing its ability to endure dynamic loads and its performance under varying temperatures and frequencies.

3.5. Fatigue Resistance Estimation Using Linear Amplitude Sweep and VECD Analysis

The fatigue resistance of asphalt binders was evaluated using the Linear Amplitude Sweep (LAS) test combined with the Viscoelastic Continuum Damage (VECD) model, following AASHTO T 391-20 [43]. To simulate in-service aging, binder samples were first conditioned using the Rolling Thin Film Oven Test (RTFOT).
The testing procedure consisted of two main phases. First, in the frequency sweep phase, a Dynamic Shear Rheometer (DSR) was used to measure the complex shear modulus (|G*|), phase angle (δ), and storage modulus over a range of frequencies at a constant strain amplitude. This phase helped establish the viscoelastic properties and stiffness of the binder.
Second, in the linear amplitude sweep phase, the strain amplitude was gradually increased from 0.1% to 30% under a constant loading frequency of 10 Hz, allowing for the continuous monitoring of shear stress, strain, complex modulus, and phase angle as the binder experienced incremental cyclic loading. The test was continued until a significant reduction in |G| indicated the initiation of fatigue damage, which served as the failure criterion.
VECD analysis was then applied to interpret the LAS test results. In this model, the complex modulus (|G*|) and phase angle data were used to calculate the damage parameter (D), reflecting the binder’s micro-damage accumulation under repeated loading. The damage evolution was modelled using the relationship (Equation (2)):
G * s i n θ = C 0 C 1 ( D ) C 2
where
G * is the complex shear modulus (Pa),
θ is the phase angle (degrees),
D is the damage parameter (dimensionless), representing the degree of fatigue-induced degradation,
and C0, C1, and C2 are regression parameters derived from experimental data.
The VECD model parameters, specifically the slope (α) (expressed in 1/% strain) and its adjusted value (α/(1 + α)), were computed to assess the binder’s fatigue life and resistance to crack propagation.
Integrating LAS testing with VECD analysis provides a detailed evaluation of asphalt binder fatigue resistance, offering valuable insights into the binder’s durability and expected performance under real-world cyclic loading conditions. This approach aids in predicting long-term pavement durability, enhancing the development of materials for more resilient infrastructure.

4. Results and Discussion

4.1. G–R Index Results

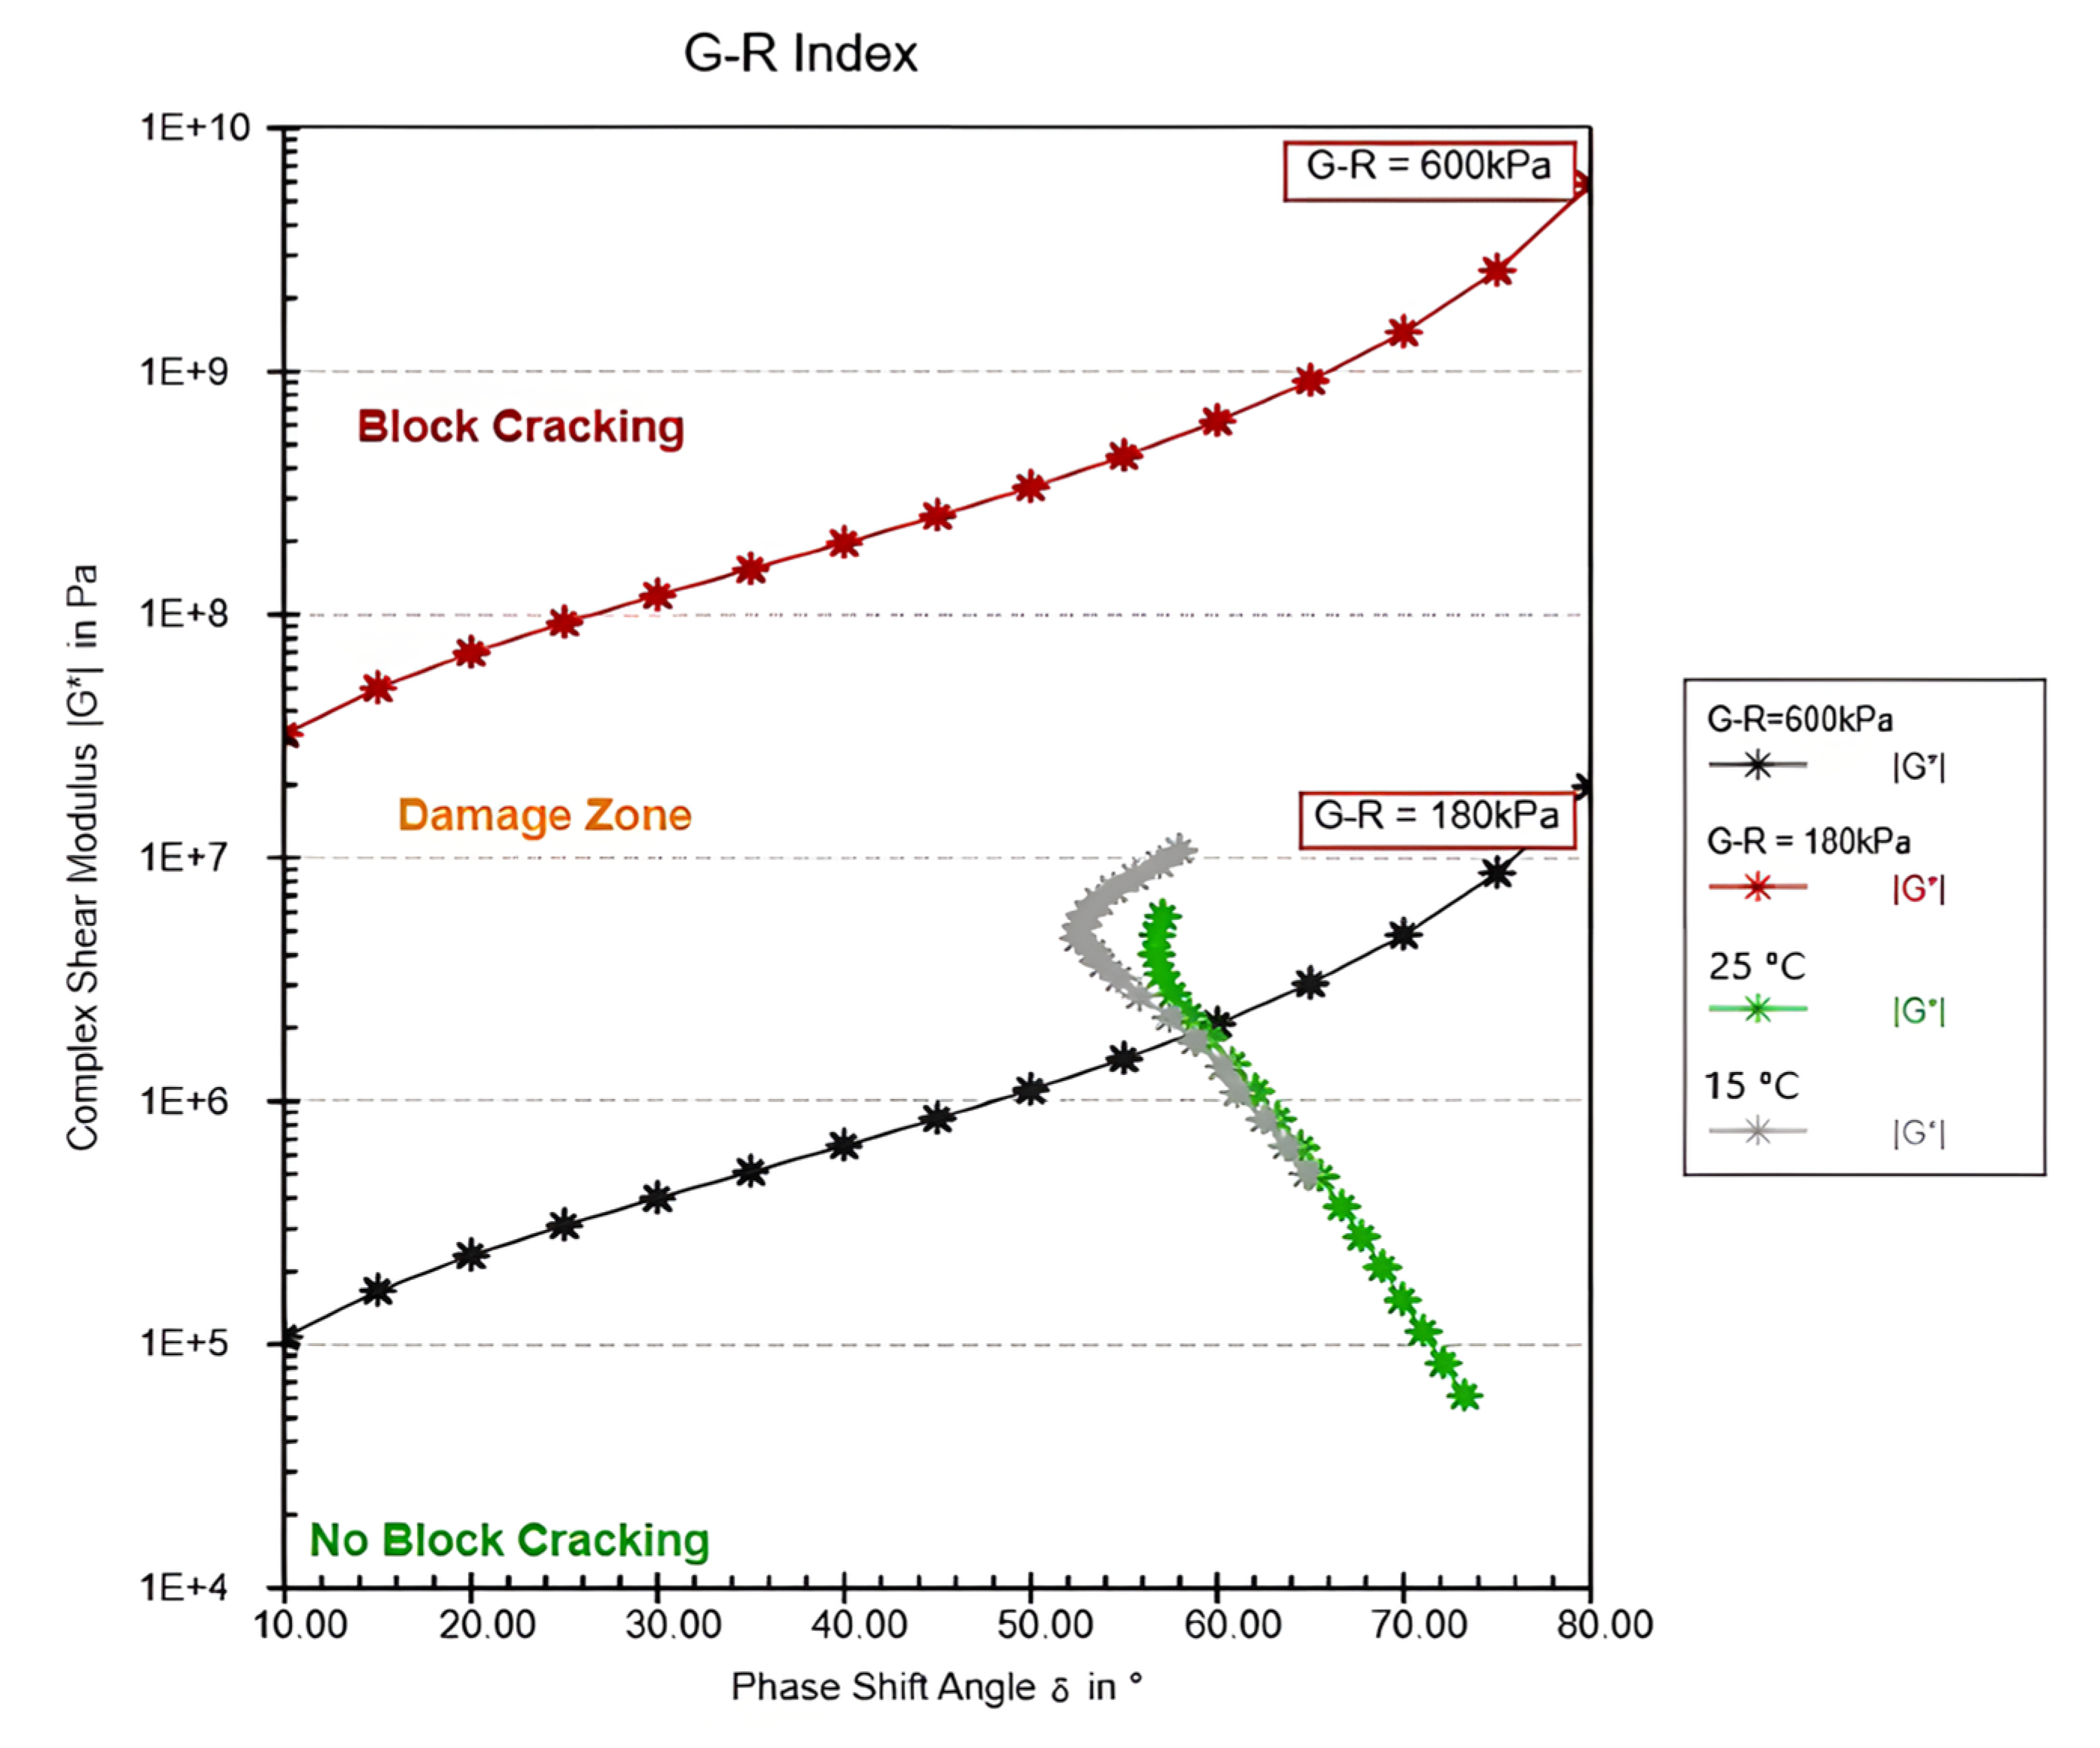
The G–R Index analysis provides important insights into the cracking susceptibility of modified bitumen at two temperatures, 15 °C and 25 °C, under stress levels of G–R = 180 kPa and G–R = 600 kPa. At 15 °C, the bitumen exhibited a higher complex shear modulus (|G*|), indicating increased stiffness and elasticity, which heightens the risk of block cracking, especially under higher stress. The shift of the curve towards the block cracking region suggests that the material’s rigidity at lower temperatures increases its susceptibility to cracking under applied stress. In contrast, at 25 °C, the bitumen showed more viscous behavior, with a lower complex shear modulus, resulting in greater flexibility and reduced susceptibility to block cracking (Figure 1). The curve remains within the no block cracking region, although it begins to approach the damage zone under higher stress (G–R = 600 kPa), reflecting the material’s reduced stiffness at higher temperatures but vulnerability under extreme stress. The differing behaviors at these temperatures stem from the temperature-dependent viscoelastic properties of bitumen, which stiffens at lower temperatures and softens at higher ones. Stress levels also play a key role, as higher stress increases the likelihood of cracking due to the material’s limited ability to store energy elastically under these conditions. It should be noted that Figure 1, Figure 2, Figure 3 and Figure 4 were generated directly by the DSR software (v. 1.35.1394) and, as such, do not allow the inclusion of standard deviation bars or user-inserted data annotations.
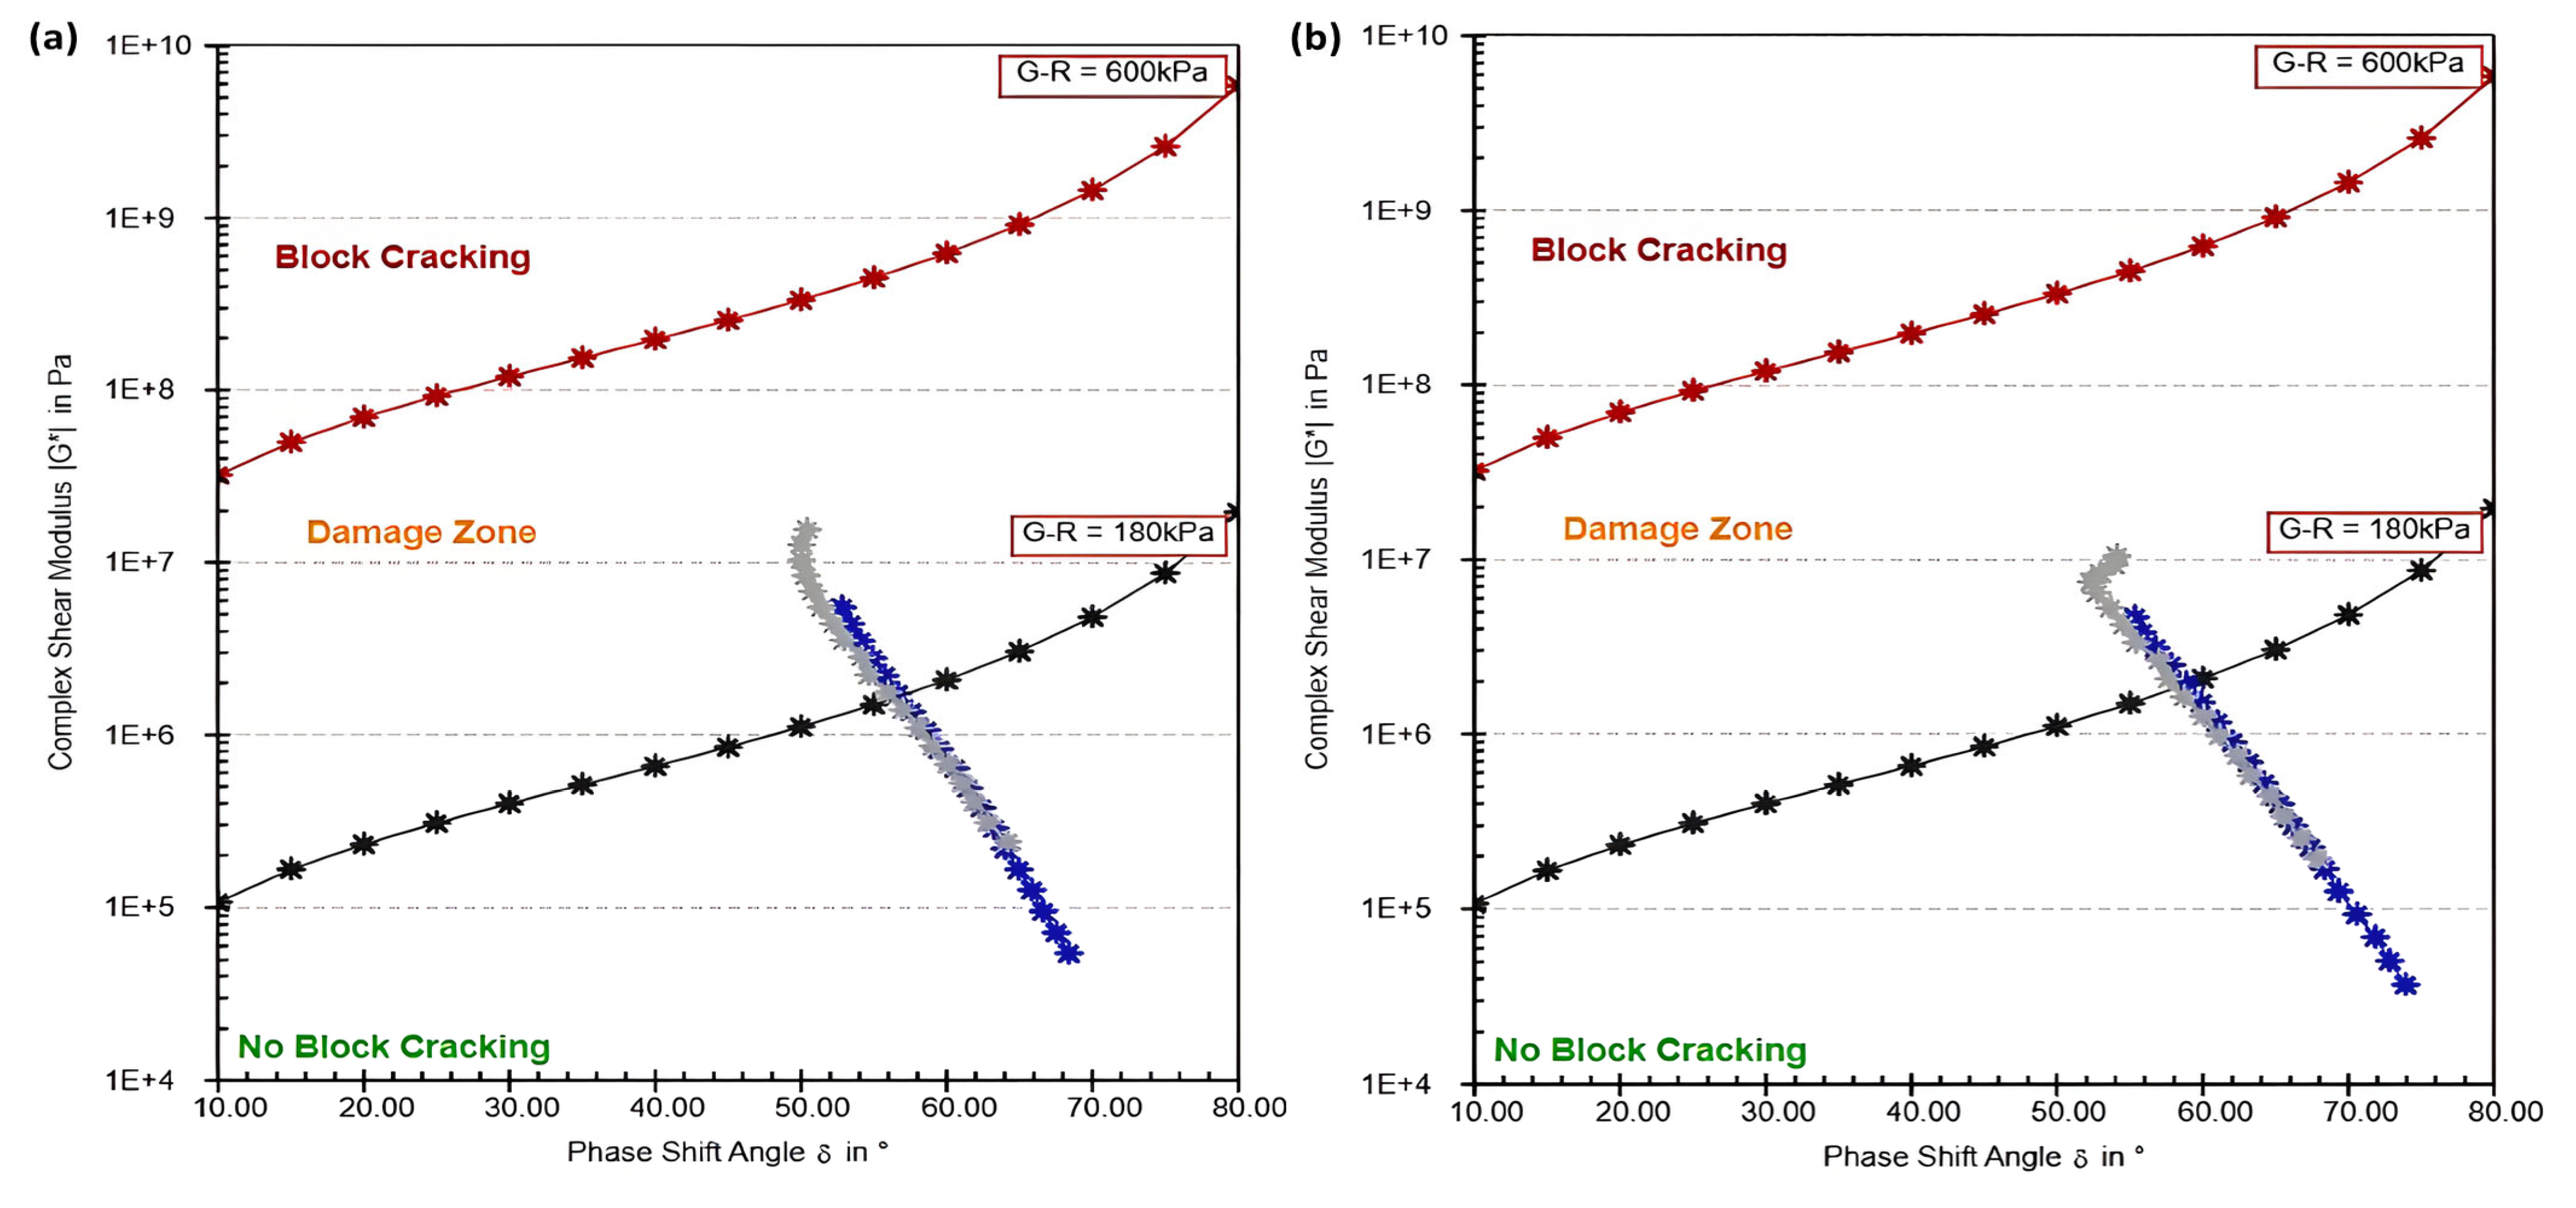
The G–R Index plots for SBS-modified bitumen samples at 4% and 5%, as shown in Figure 2, reveal how varying concentrations of styrene–butadiene–styrene (SBS) affect the bitumen’s resistance to block cracking across different stress levels and temperature conditions. These plots (a and b) correspond to SBS concentrations of 4% and 5%, respectively, and demonstrate the material’s behavior in terms of flexibility, stiffness, and overall performance under applied stress.
In the 4% SBS sample (Figure 2a), the bitumen shows improved flexibility compared to unmodified bitumen, as indicated by its position in the no block cracking region at both 15 °C and 25 °C under lower stress (G–R = 180 kPa). At 25 °C, the bitumen maintains its flexibility, staying in the no block cracking zone for most of the phase shift range. However, under higher stress conditions (G–R = 600 kPa), the material begins to approach the damage zone, reflecting some reduction in elasticity but still showing resilience compared to unmodified bitumen. The increased SBS content enhances the bitumen’s ability to deform without cracking, but at low temperatures, particularly at 15 °C, the material moves closer to the block cracking region, indicating increased stiffness under these conditions. Overall, the 4% SBS-modified bitumen offers significant improvement in flexibility, especially at higher temperatures, though some vulnerability to cracking remains at low temperatures and high stress.
The 5% SBS sample (Figure 2b) performs even better, demonstrating further improvement in flexibility and resistance to cracking. At both 15 °C and 25 °C, the bitumen largely stays in the no block cracking zone, even under the higher stress level of G–R = 600 kPa. The higher SBS content enhances the elasticity of the material, allowing it to store more energy elastically, which reduces the risk of block cracking. At 25 °C, the bitumen shows superior resistance to entering the damage zone, even under high stress, remaining flexible throughout the entire phase shift range. At 15 °C, while the bitumen shows more stiffness than at higher temperatures, the phase shift angle still reflects more flexibility than the 4% SBS sample, keeping it out of the block cracking region for a longer range. This suggests that the additional SBS content improves the bitumen’s capacity to withstand low-temperature cracking, although the material’s performance under extreme low-temperature conditions still requires consideration.
In summary, the progression from 4% to 5% SBS shows a clear enhancement in the bitumen’s flexibility and resistance to block cracking. The 4% SBS sample offers significant improvement in elasticity at higher temperatures, but some risk of cracking remains at low temperatures, particularly under high stress. The 5% SBS sample demonstrates superior performance, maintaining flexibility and avoiding the block cracking region across both temperature settings and stress levels. The higher SBS content improves the bitumen’s ability to deform under stress, reducing the risk of cracking, making it the most effective concentration for improving bitumen performance, particularly in high-stress and low-temperature environments.
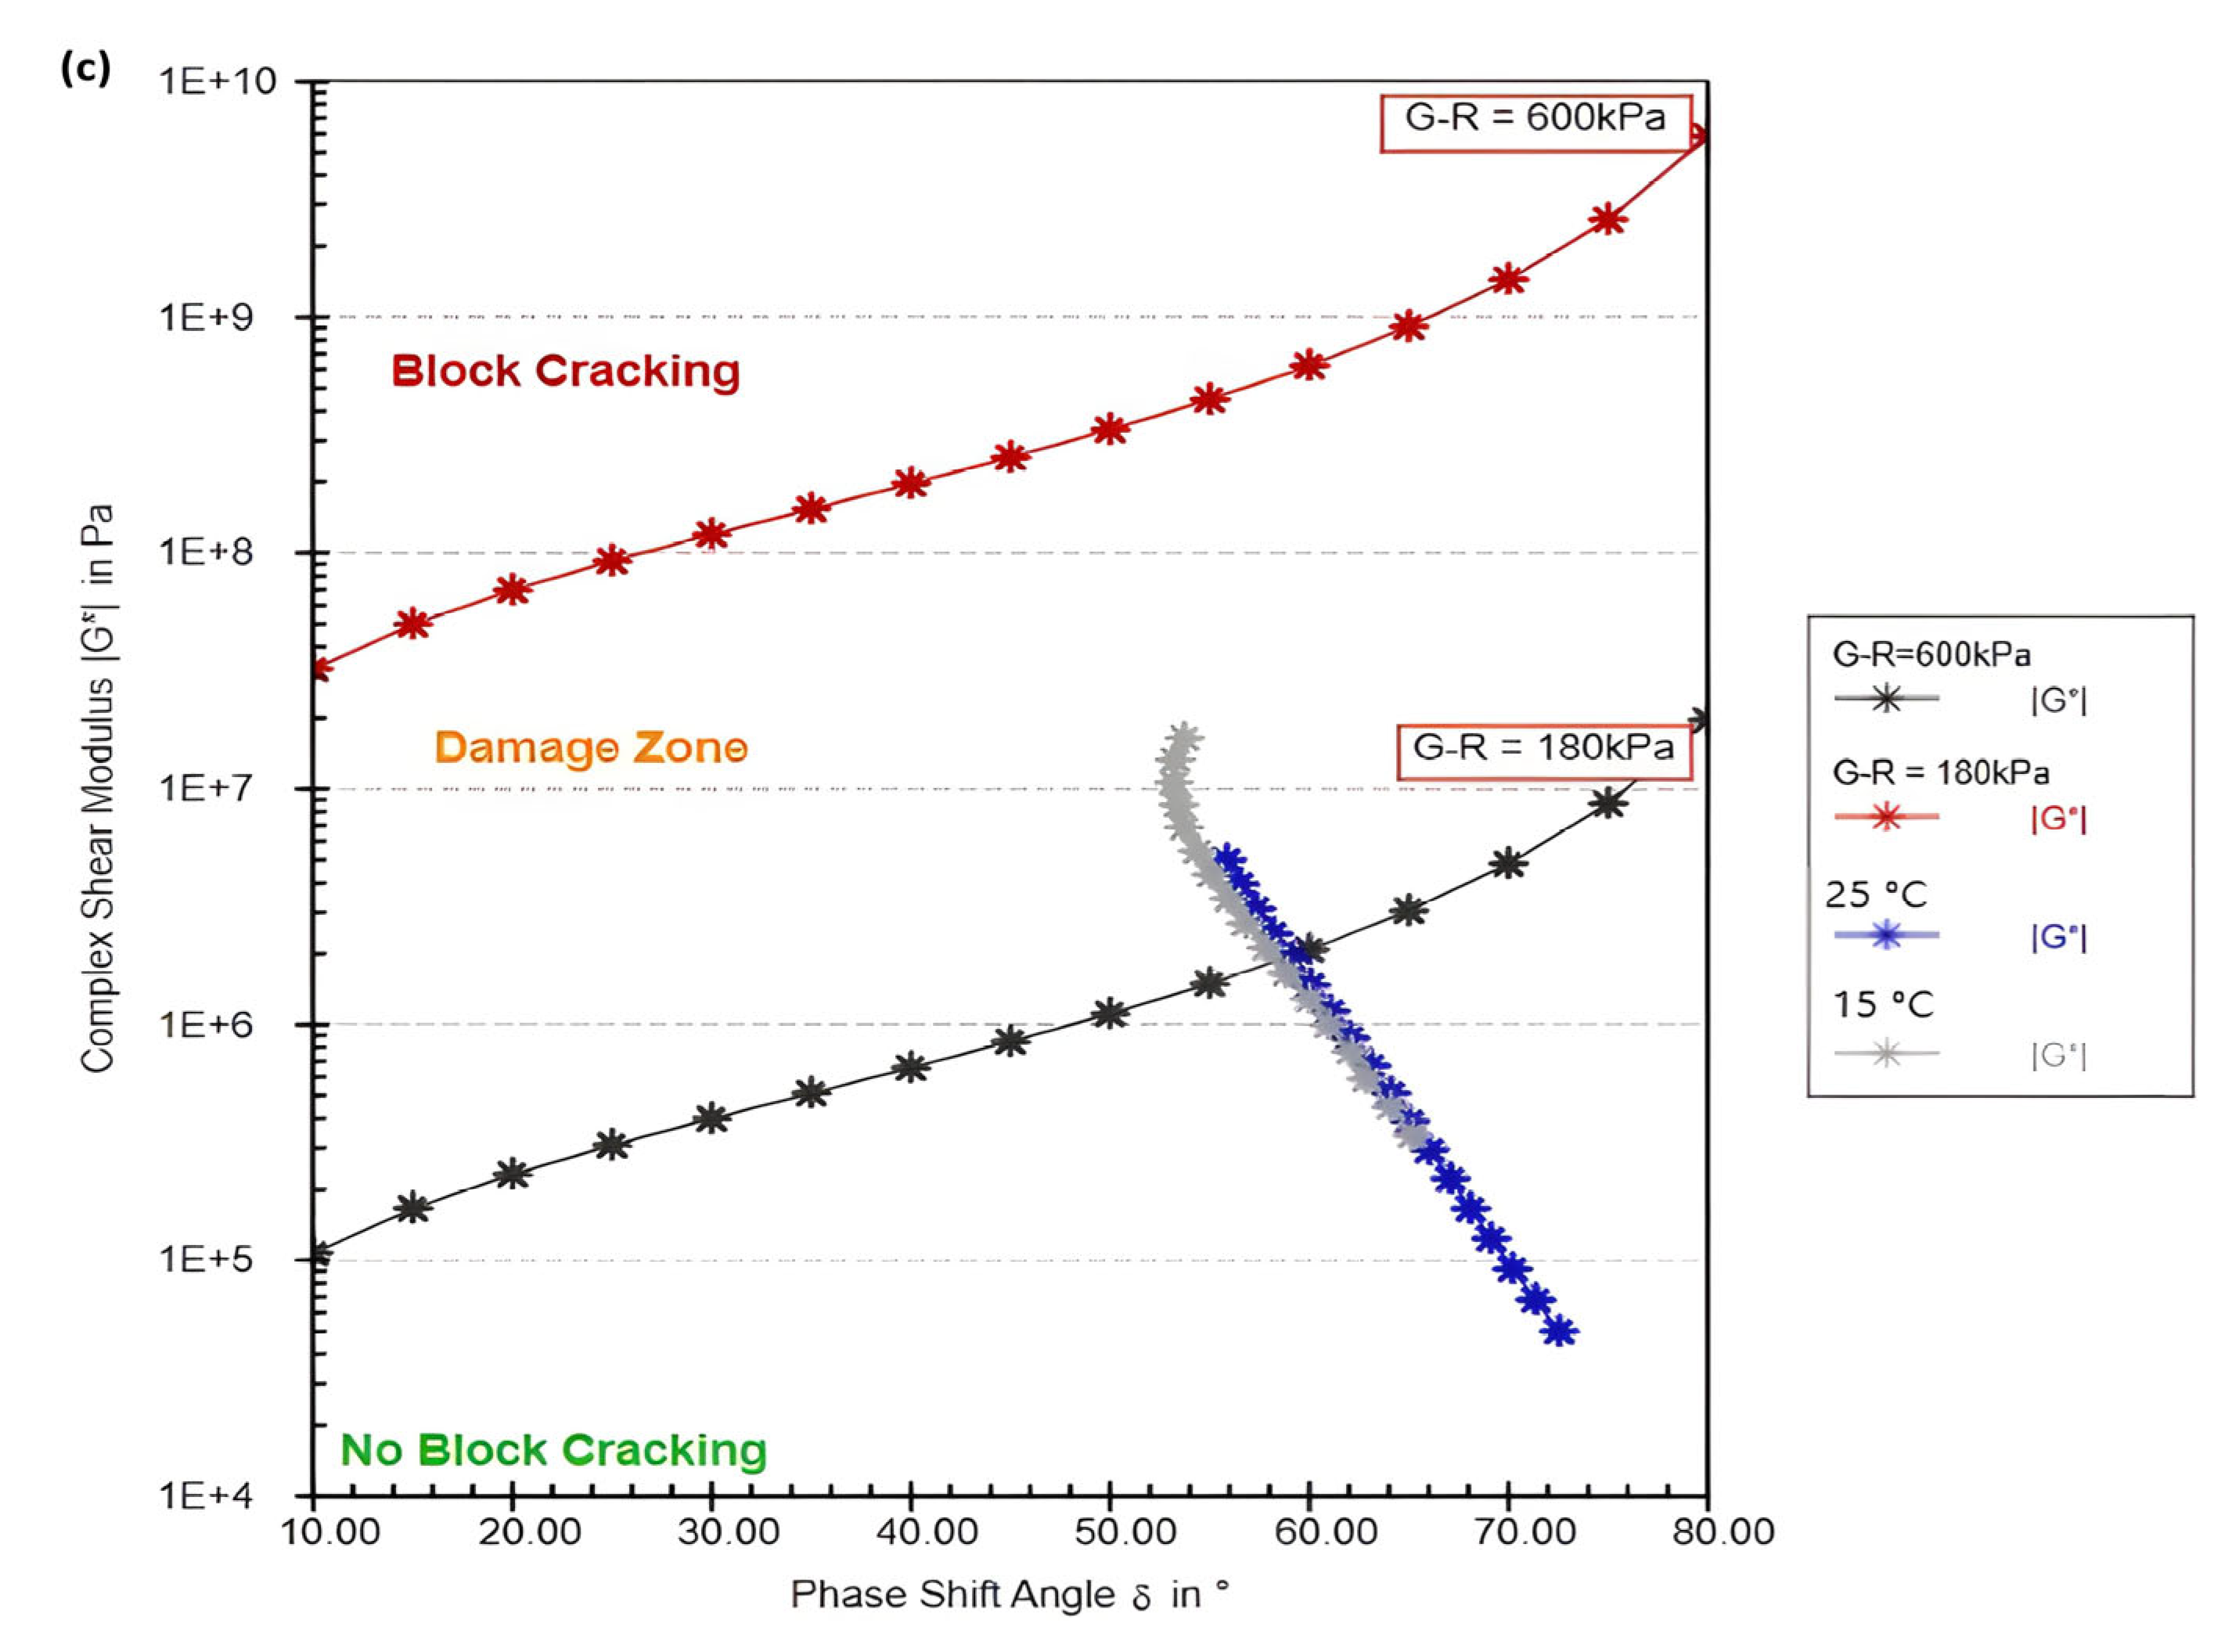
In the 4% animal bone ash sample (Figure 3a), the bitumen shows a noticeable shift toward the block cracking region, particularly at the lower temperature of 15 °C and higher stress levels of G–R = 600 kPa. The grey curve at 15 °C indicates that the material behaves stiffly under these conditions, increasing its susceptibility to cracking. At 25 °C, the bitumen shows improved flexibility, remaining mostly in the no block cracking zone, but as the stress increases, the curve begins to shift toward the damage zone, indicating that the bitumen still risks cracking under higher loads, despite the improvement in flexibility at warmer temperatures. The phase shift angle (δ) at lower temperatures reflects more solid-like behavior, making the bitumen more prone to block cracking under stress when using 4% animal bone ash.
For the 5% animal bone ash sample (Figure 3b), the material exhibits similar behavior to the 4% sample but with slightly increased stiffness. At 15 °C, the bitumen moves further into the block cracking region under G–R = 600 kPa, showing that the addition of more bone ash increases stiffness, reducing the bitumen’s ability to deform under stress. At 25 °C, the bitumen shows relatively better performance, staying in the no block cracking zone for a longer range. However, under high stress, it still approaches the damage zone, although the material demonstrates more rigidity than the 4% sample. This suggests that while animal bone ash improves the material’s structural integrity at higher temperatures, it increases the risk of block cracking at low temperatures and high stress levels due to the increased stiffness.
The 6% animal bone ash sample (Figure 3c) displays the most pronounced shift toward stiffness among the three samples. At 15 °C, the material moves even deeper into the block cracking region, indicating a significant reduction in flexibility due to the high concentration of animal bone ash. The bitumen becomes highly prone to cracking under stress, particularly at low temperatures. At 25 °C, the bitumen retains some flexibility but begins to approach the damage zone sooner under high stress, reflecting the fact that the increased rigidity from the bone ash modifier affects its performance, even at higher temperatures. While the 6% bone ash sample provides enhanced stiffness, this increased rigidity limits the bitumen’s ability to absorb stress without cracking.
In summary, the progression from 4% to 6% animal bone ash demonstrates increasing stiffness and reduced flexibility, especially at lower temperatures. The 4% animal bone ash shows the best balance between stiffness and flexibility, remaining in the no block cracking region at 25 °C, though it becomes prone to cracking at 15 °C under higher stress. The 5% animal bone ash offers more structural integrity but leads to more pronounced stiffness, especially at low temperatures, with a significant risk of cracking under stress. The 6% animal bone ash provides the most rigidity, increasing the risk of block cracking even at higher temperatures under high stress. Therefore, while animal bone ash is effective in enhancing stiffness, higher concentrations make the bitumen more susceptible to cracking, particularly in colder climates and under high-stress conditions.
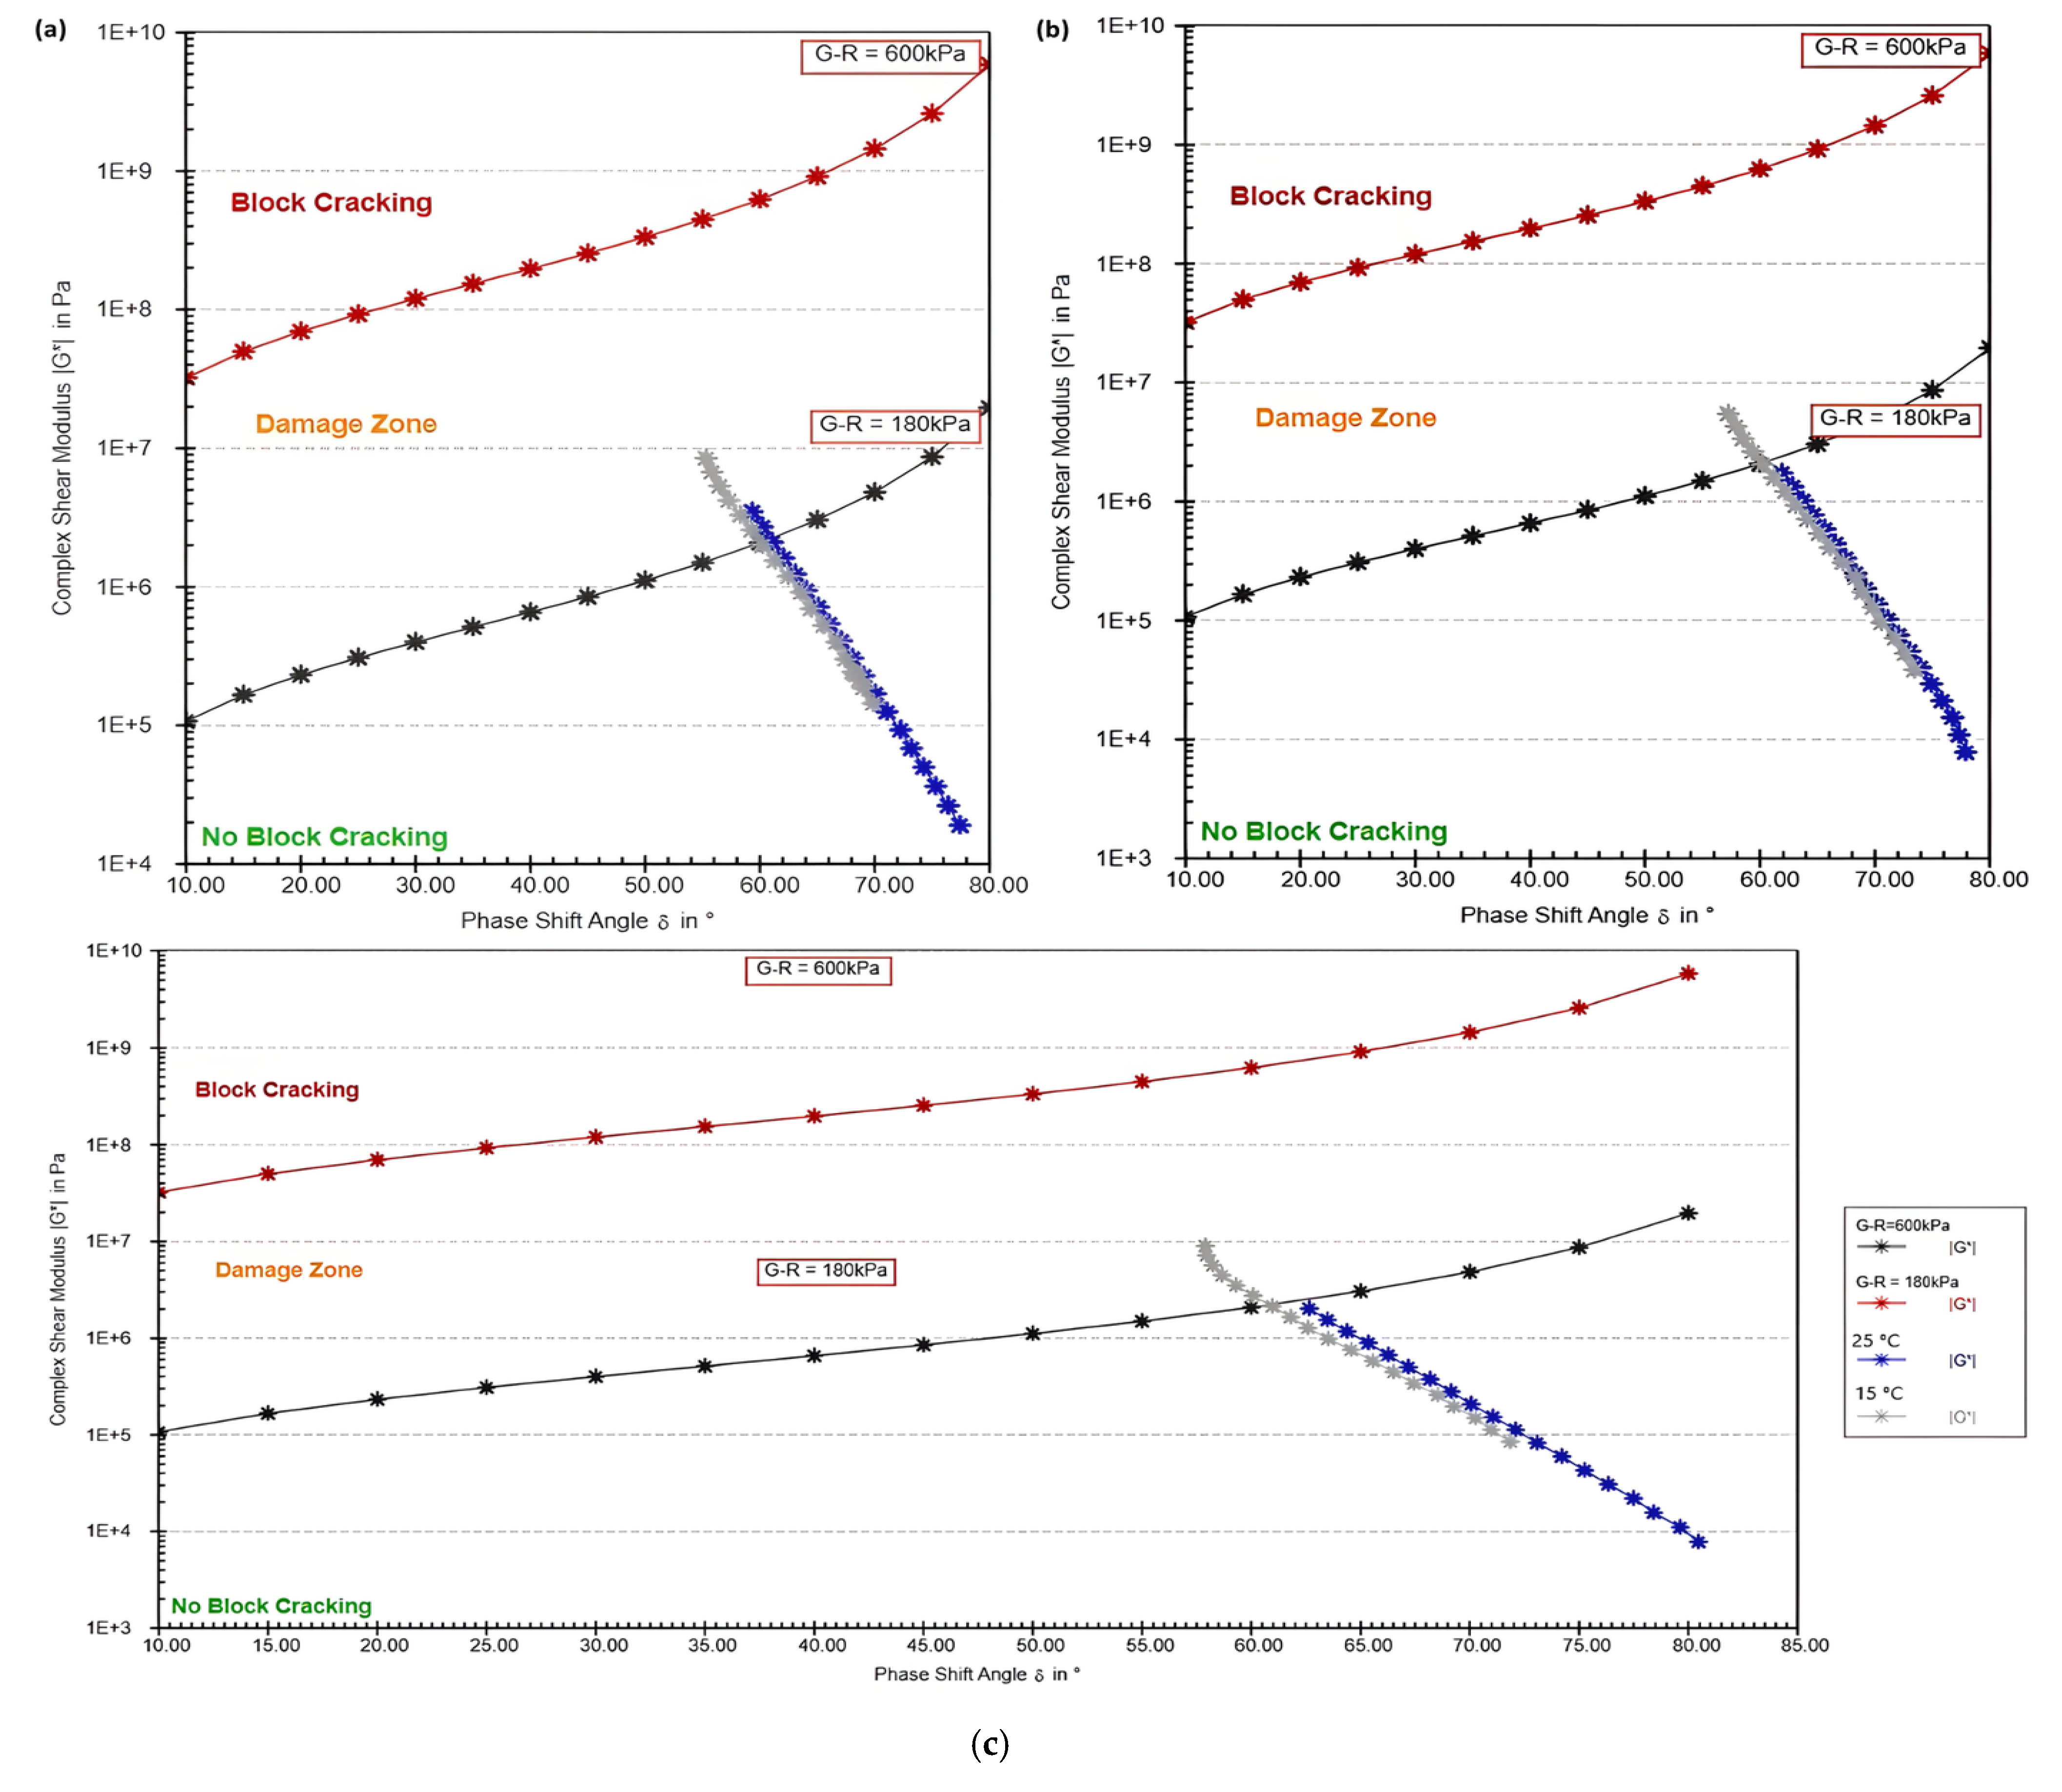
In the WCO 3% sample (Figure 4a), the bitumen shows significant susceptibility to block cracking, especially at lower temperatures (15 °C) and higher stress levels (G–R = 600 kPa). The plot shifts toward the block cracking region as the stress increases, indicating that the bitumen becomes stiffer and more prone to cracking. At higher temperatures (25 °C), the material remains largely within the no block cracking region, though under high stress, it starts moving toward the damage zone. This behavior suggests that while WCO 3% improves flexibility somewhat, the bitumen remains vulnerable to block cracking under extreme conditions, particularly at low temperatures and high stress.
In the WCO 4% sample (Figure 4b), the performance improves slightly compared to WCO 3%. At 15 °C, the bitumen still shows some stiffness, but it stays closer to the no block cracking region than WCO 3%. The increased concentration of WCO allows for better flexibility, as indicated by the higher phase shift angle (δ), but under high stress (G–R = 600 kPa), the material still begins to approach the block cracking region. At 25 °C, the bitumen exhibits better flexibility, remaining in the no block cracking region for a longer range, even under high stress. This indicates that WCO 4% offers a balance between flexibility and stiffness, making it more suitable for varying temperature conditions than WCO 3%.
The WCO 5% sample (Figure 4c) demonstrates the best performance among the three concentrations. At 15 °C, the bitumen remains more flexible, as indicated by the higher phase shift angle, and avoids the block cracking region even under high stress. The plot stays closer to the no block cracking region compared to the other samples, showing that the higher concentration of WCO helps maintain elasticity at lower temperatures. At 25 °C, WCO 5% performs exceptionally well, remaining in the no block cracking region across the entire range of stress and temperature. The bitumen’s increased flexibility with 5% WCO reduces the risk of entering the damage zone, making it the most resilient sample in terms of handling both temperature extremes and stress conditions.
In summary, the progression from WCO 3% to WCO 5% illustrates a clear improvement in the bitumen’s ability to resist block cracking. WCO 3% shows limited flexibility, especially at lower temperatures, and becomes prone to block cracking under high stress. WCO 4% offers better performance, providing a balance between stiffness and flexibility, but it still shows some vulnerability to cracking under extreme stress. WCO 5% delivers the best performance, with the bitumen maintaining flexibility and avoiding block cracking across both temperature settings and stress levels. This indicates that increasing the concentration of WCO enhances the bitumen’s ability to deform without cracking, especially in high-stress or low-temperature environments, making WCO 5% the most effective concentration for improving bitumen performance
To conclude, unmodified bitumen displays significant stiffness and a high propensity for block cracking, especially at lower temperatures and under elevated stress. Among the modified bitumen samples, SBS-modified bitumen, particularly with 5% SBS, proves to be the most effective in enhancing flexibility and reducing the risk of block cracking across various temperature and stress conditions. WCO-modified bitumen increases flexibility, especially at higher concentrations (5%), though it still shows some susceptibility to cracking under extreme stress at low temperatures. Animal bone ash-modified bitumen increases stiffness, which is beneficial at higher temperatures, but makes the material more prone to cracking in colder environments. All in all, 5% SBS-modified bitumen offers the best balance of flexibility and crack resistance, making it the most favorable modification among the tested options.

4.2. Storage and Loss Modulus Results

The results for storage modulus (G′) and loss modulus (G″) at two different temperatures, 15 °C and 25 °C, reveal significant temperature-dependent behavior in both modified and unmodified bitumen samples as shown in Table 3, Table 4, Table 5 and Table 6. As expected, the moduli are generally higher at 15 °C than at 25 °C, indicating that bitumen is stiffer and more elastic at lower temperatures. This is a typical response since, at lower temperatures, bitumen becomes more resistant to deformation, behaving more like a solid (elastic), while at higher temperatures, it becomes more viscous and pliable.
For unmodified bitumen, both G′ and G″ show a larger decline at 25 °C compared to 15 °C. The reduced stiffness at higher temperatures can result in poorer performance in hot climates, where bitumen tends to soften and lose its ability to resist deformation. However, the modified bitumen samples exhibit improved resilience at both temperatures, especially in terms of retaining higher G′ values.
SBS-modified bitumen demonstrates significant enhancement in storage modulus at both 15 °C and 25 °C. While the elastic response (G′) and viscous response (G″) decrease as the temperature increases, the reduction is less severe compared to unmodified bitumen. The 5% SBS-modified bitumen, in particular, retains a much higher G′ at 25 °C than unmodified bitumen, indicating that SBS modification significantly enhances bitumen’s ability to retain stiffness and elasticity even at elevated temperatures. This is beneficial for high-temperature performance, as roads constructed with SBS-modified bitumen would be less prone to rutting or deformation under traffic loading.
Similarly, the bitumen samples modified with animal bone ash also show improved stiffness and elasticity at both temperatures. At 15 °C, the G′ values for animal bone ash-modified bitumen are significantly higher than those of unmodified bitumen, with the 6% animal bone ash sample exhibiting the greatest improvement. However, the drop in G′ when the temperature increases to 25 °C is more noticeable in animal bone ash-modified bitumen compared to SBS-modified bitumen. This suggests that while animal bone ashes enhance the elastic behavior of bitumen, their effectiveness diminishes more rapidly at higher temperatures compared to SBS. Moreover, although the increased stiffness provided by AB improves deformation resistance, it can also reduce the binder’s ability to relax thermal stresses, particularly at lower temperatures. This limited relaxation capacity may lead to stress accumulation and an increased risk of thermal or fatigue cracking. Therefore, while 6% AB yields the highest stiffness, it may also introduce brittleness under cold conditions, highlighting the importance of optimizing the dosage to balance stiffness gains with flexibility and crack resistance.
Bitumen modified with waste cooking oil shows the least improvement in G′ and G″ at both temperatures. The addition of waste cooking oil seems to act more as a softening agent, which leads to better flexibility at lower temperatures (15 °C) but results in a more significant reduction in modulus at 25 °C. At 25 °C, waste cooking oil-modified bitumen demonstrates a more pronounced viscous behavior (higher G″) compared to its elastic response (G′), indicating that the bitumen may become softer and more susceptible to deformation at higher temperatures, which may limit its applicability in hot climates.
Overall, the additives improve both the elastic and viscous responses of bitumen, with SBS having the most significant stiffening effect, followed by animal bone ashes and waste cooking oil. This modification enhances the bitumen’s ability to resist deformation under loading, particularly at higher frequencies, which are relevant in traffic conditions with higher speeds.

4.3. Complex Viscosity and Loss Factor (Tan δ) Results

The results from the frequency sweep tests evaluating complex viscosity (η*) and the loss factor (tan δ) at two temperatures, 15 °C and 25 °C, provide valuable insight into the viscoelastic behavior of both unmodified and modified bitumen samples (Table 7, Table 8, Table 9 and Table 10). Across all samples, as the angular frequency increases, the complex viscosity (η*) decreases, which is a typical rheological behavior indicating the shear-thinning nature of bitumen. This decrease in viscosity with frequency signifies that the materials exhibit more fluid-like behavior at higher frequencies, which could translate to better deformation resistance under traffic loading. However, the rate of this decreases and the absolute values of η* vary considerably between the modified and unmodified samples, influenced by the nature and percentage of additives.
Table 7 and Table 8 illustrate the relationship between complex viscosity (η*) and angular frequency for unmodified bitumen at two different temperatures: 15 °C and 25 °C. At both temperatures, the complex viscosity decreases as the angular frequency increases, showing the typical shear-thinning behavior of bitumen. This means that at higher frequencies, the bitumen becomes less viscous and more prone to flow, which is expected under dynamic loading conditions. At 15 °C, the complex viscosity is higher than at 25 °C, indicating that the bitumen is more resistant to deformation and behaves more like a solid at lower temperatures, making it more prone to cracking. At 25 °C, the bitumen has a lower complex viscosity, reflecting that it is more fluid-like and can flow more easily, which reduces its susceptibility to block cracking.
The loss factor (tan δ), which represents the ratio of the loss modulus (G″) to the storage modulus (G′), provides insight into the balance between viscous and elastic behavior. A higher tan δ value indicates more viscous behavior, while a lower value suggests more elastic (solid-like) behavior. At 15 °C (Table 9), the tan δ values are lower across the frequency range, suggesting that the bitumen behaves more elastically and has higher stiffness at this temperature. In contrast, at 25 °C (Table 10), the tan δ values are higher, indicating that the bitumen exhibits more viscous behavior and increased flexibility, which helps prevent cracking.
For the 4% SBS-modified samples (Table 7, Table 8, Table 9 and Table 10), the complex viscosity decreases as the angular frequency increases, demonstrating shear-thinning behavior typical for viscoelastic materials. At 15 °C, the viscosity is higher than at 25 °C, showing that the material is more resistant to flow and stiffer at lower temperatures. The loss factor (tan δ) is lower at 15 °C, indicating that the material behaves more elastically and has less energy dissipation compared to its behavior at 25 °C, where it exhibits more viscous (fluid-like) properties.
In the 5% SBS-modified samples (Table 7, Table 8, Table 9 and Table 10), a similar trend is observed, with the complex viscosity decreasing as the angular frequency increases. However, the 5% SBS sample exhibits slightly lower viscosity values compared to the 4% SBS sample, particularly at 25 °C, suggesting that the higher SBS content enhances the material’s flexibility, reducing stiffness. The loss factor (tan δ) in the 5% SBS sample is also lower at 15 °C, indicating a more elastic response, while at 25 °C, the tan δ values are higher, reflecting increased energy dissipation and more viscous behavior, similar to the 4% sample but with improved flexibility.
Overall, the 5% SBS-modified bitumen shows better performance in terms of flexibility and viscosity reduction compared to the 4% SBS-modified bitumen, particularly at higher temperatures. The higher SBS content enhances the bitumen’s ability to resist deformation at low temperatures while maintaining flexibility at higher temperatures, improving its resistance to block cracking.
In the 5% animal bone ash-modified sample (Table 7, Table 8, Table 9 and Table 10), the trends are similar but with slightly higher viscosity values compared to the 4% sample. This indicates increased stiffness as the concentration of animal bone ash rises, particularly at 15 °C, where the bitumen becomes more resistant to deformation, suggesting a greater tendency to crack under stress. The tan δ values also reflect this, with lower values at 15 °C, showing that the material behaves more elastically, and higher values at 25 °C, where it behaves more viscously.
For the 6% animal bone ash-modified sample (Table 7, Table 8, Table 9 and Table 10), the complex viscosity values are the highest among the three concentrations, particularly at 15 °C, which indicates the stiffest behavior and the greatest resistance to flow. This increased stiffness makes the bitumen more prone to cracking, especially in colder conditions. The loss factor (tan δ) remains lower at 15 °C, indicating a more solid-like response, while at 25 °C, the bitumen exhibits slightly higher tan δ values, reflecting more viscous behavior and better flow characteristics at higher temperatures.
In summary, increasing the concentration of animal bone ash in the bitumen leads to higher viscosity and greater stiffness, particularly at lower temperatures (15 °C), which can increase the risk of cracking under stress. At higher temperatures (25 °C), the bitumen becomes more flexible and fluid-like, though the overall stiffness increases as the concentration of animal bone ash rises. The 4% animal bone ash offers a balance between stiffness and flexibility, while 6% animal bone ash shows the greatest increase in stiffness and susceptibility to cracking under cold conditions.
In the 3% WCO-modified sample (Table 7, Table 8, Table 9 and Table 10), the complex viscosity decreases with increasing angular frequency, demonstrating the shear-thinning behavior characteristic of bitumen. At 15 °C, the viscosity is higher than at 25 °C, indicating that the bitumen is stiffer and more resistant to deformation at lower temperatures. The loss factor (tan δ) is lower at 15 °C, reflecting more elastic (solid-like) behavior, while at 25 °C, tan δ values are higher, indicating more viscous behavior and better flexibility.
For the 4% WCO-modified sample (Table 7, Table 8, Table 9 and Table 10), the trends are similar, but the complex viscosity is slightly lower compared to the 3% WCO sample, especially at 25 °C. This indicates improved flexibility with the increase in WCO concentration. The tan δ values remain consistent, with the bitumen showing more viscous behavior at 25 °C and more elastic behavior at 15 °C. This suggests that increasing WCO concentration allows the bitumen to maintain a more flexible, fluid-like behavior at higher temperatures while maintaining sufficient stiffness at lower temperatures.
The 5% WCO-modified sample (Table 7, Table 8, Table 9 and Table 10) shows the lowest complex viscosity among the three samples, particularly at 25 °C, indicating that this concentration provides the highest level of flexibility. The tan δ values reflect more viscous behavior at 25 °C, indicating improved flow characteristics, and more elastic behavior at 15 °C. The 5% WCO concentration helps the bitumen retain flexibility at higher temperatures, reducing the risk of block cracking, while still offering sufficient stiffness at lower temperatures.
In conclusion, as the concentration of WCO increases from 3% to 5%, the bitumen becomes more flexible and less prone to cracking at higher temperatures. The 5% WCO sample offers the best overall balance between flexibility and stiffness, showing the lowest complex viscosity and more viscous behavior at 25 °C, while maintaining adequate elastic behavior at 15 °C. This makes 5% WCO the most effective concentration for enhancing the bitumen’s performance across a range of temperatures and stress conditions.
In summary, the 5% SBS-modified bitumen delivered the best overall performance, offering excellent flexibility and resistance to block cracking across various temperatures and stress conditions. The 5% WCO-modified bitumen also showed improved flexibility, particularly at higher temperatures, but was more prone to cracking under stress compared to SBS. Animal bone ash-modified bitumen, while improving stiffness, increased the risk of cracking at lower temperatures. Overall, 5% SBS proved to be the most effective modifier for enhancing bitumen performance

4.4. Linear Amplitude Sweep Results

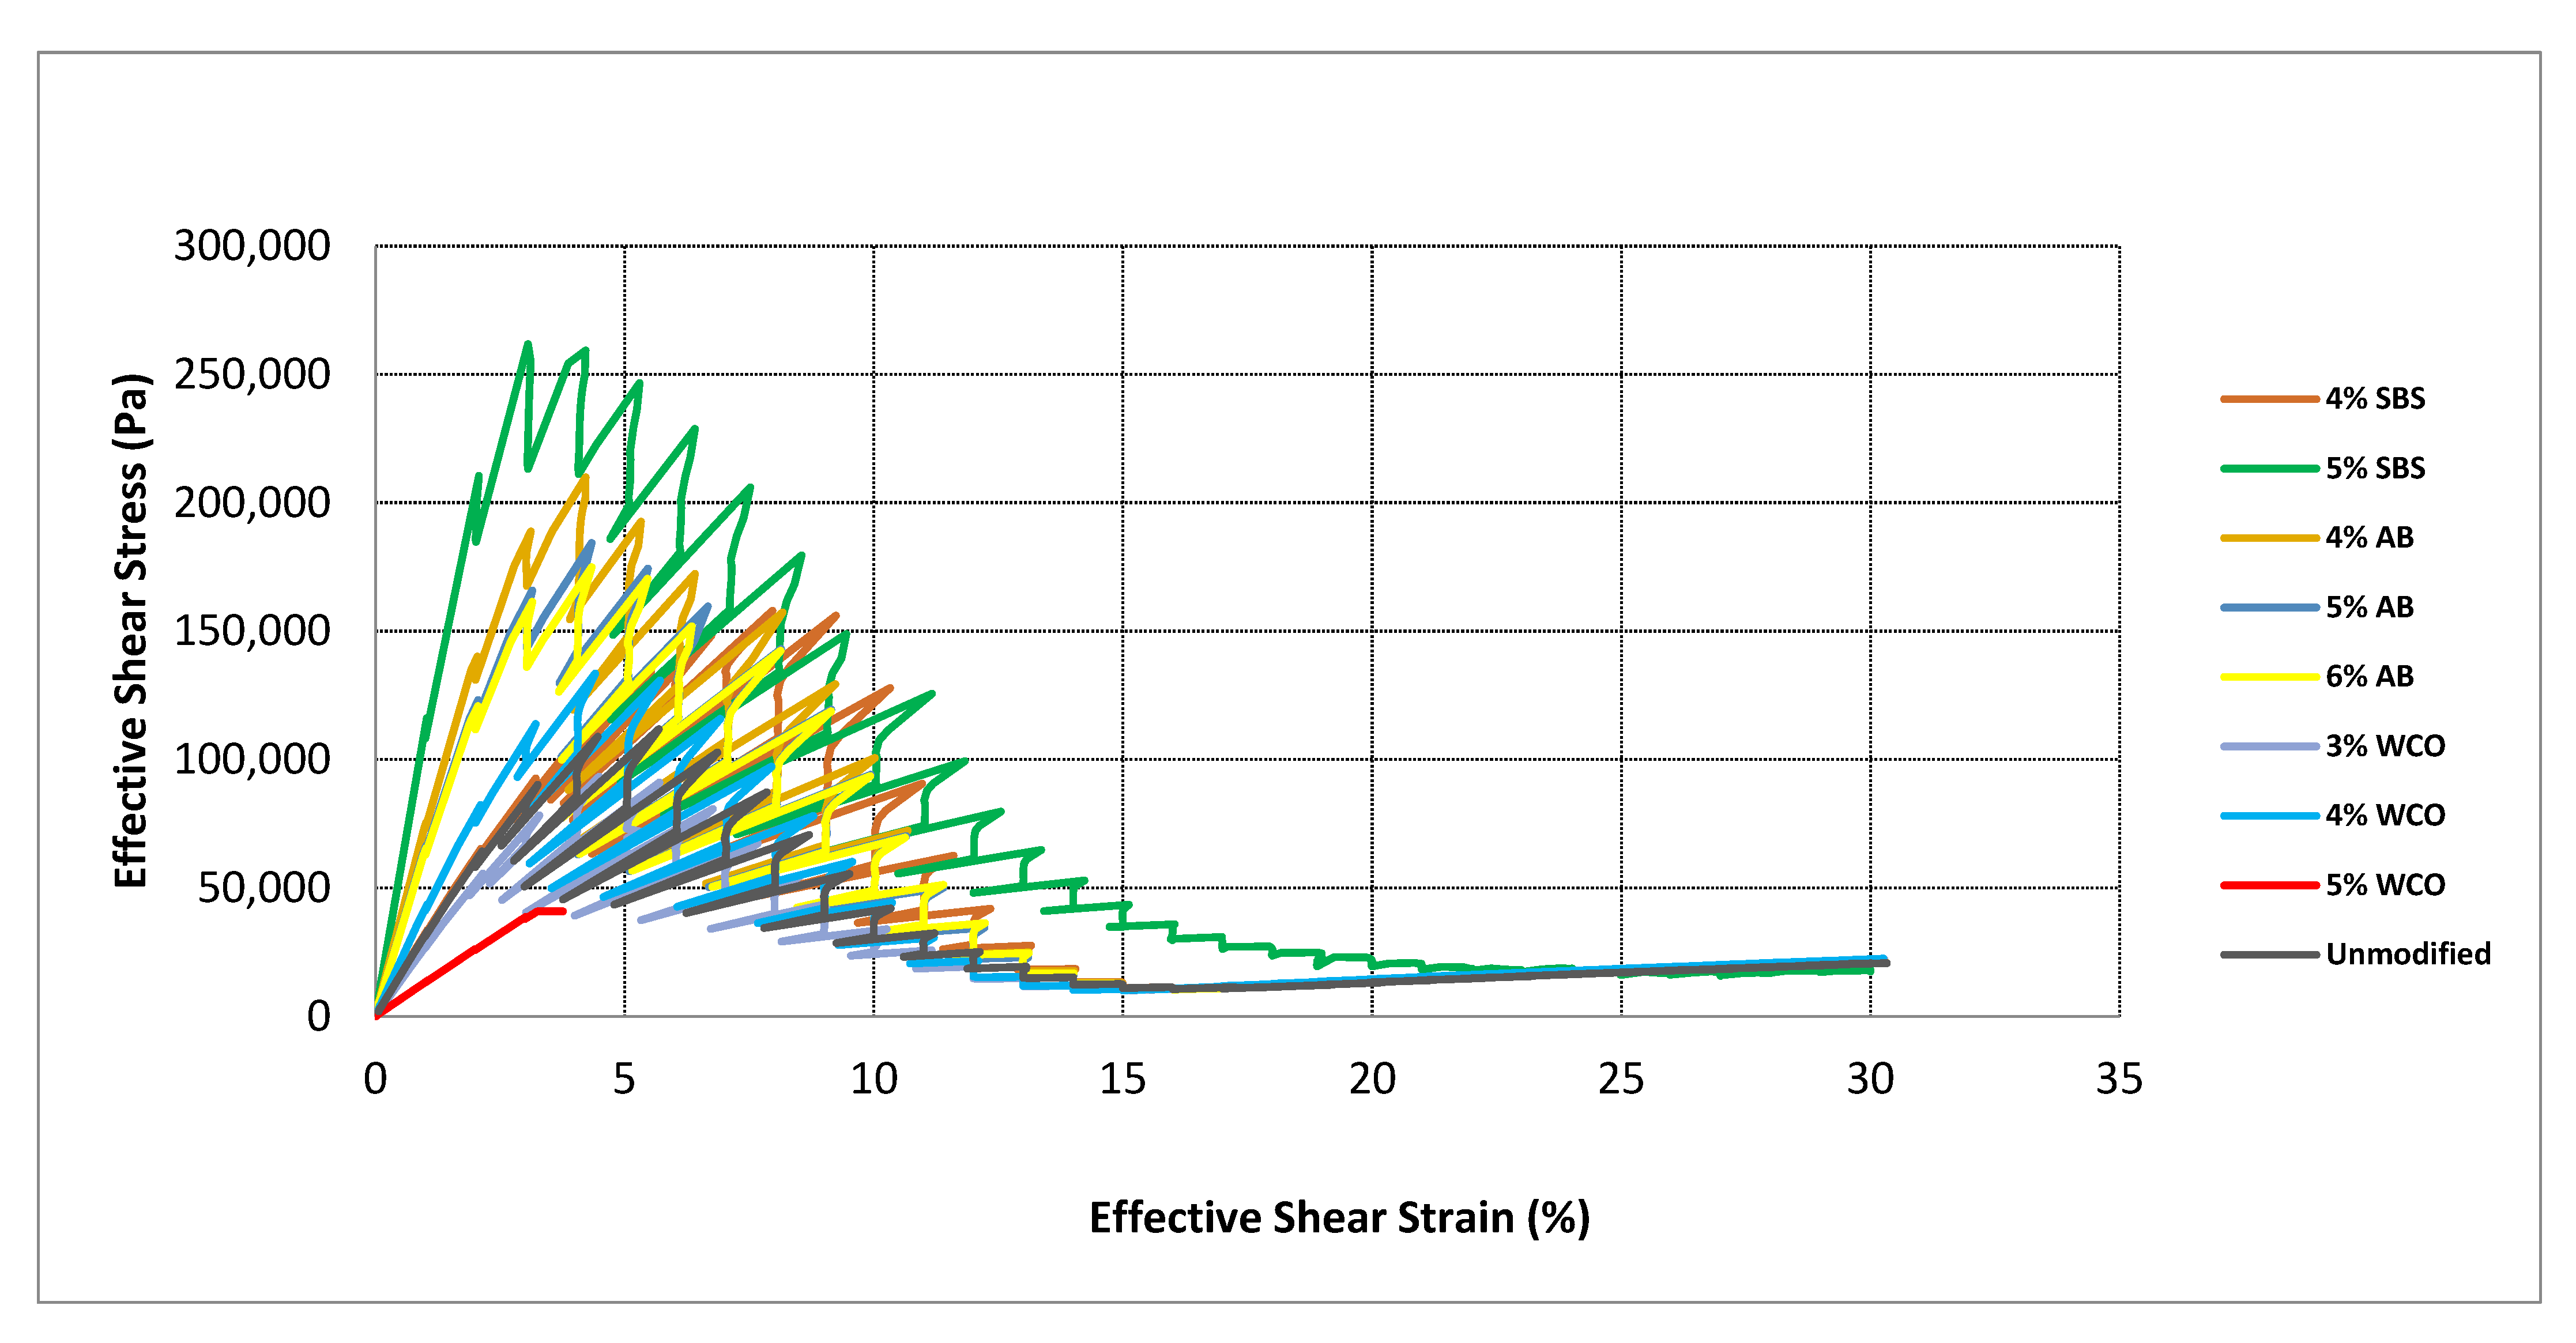
Figure 5 shows the amplitude sweep results, illustrating the relationship between effective shear stress and effective shear strain for various bitumen samples modified with different additives. The unmodified bitumen demonstrates the lowest shear stress levels across the strain range, indicating limited resistance to shear deformation. This lower resistance implies a greater susceptibility to deformation under repeated loading, which could result in premature fatigue and rutting in pavement applications. The results presented in this figure represent the average values for each type of modified binder, as determined from replicate tests.
Samples modified with styrene–butadiene–styrene (SBS) at concentrations of 4% and 5% show significantly enhanced performance, particularly the 5% SBS sample, which exhibits the highest effective shear stress values among all samples. The enhanced shear resistance offered by SBS highlights its ability to improve the stiffness and elasticity of bitumen, making it particularly suitable for high-stress traffic conditions and environments requiring durable and deformation-resistant pavements.
Animal bone ash (AB)-modified bitumen samples at 4%, 5%, and 6% concentrations display progressively higher effective shear stresses, with the 6% AB sample achieving the greatest enhancement. This trend confirms that increasing AB content substantially improves stiffness and resistance to deformation, enabling better performance under cyclic loading and reducing the risk of pavement cracking and fatigue.
The waste cooking oil (WCO)-modified samples demonstrate moderate increases in effective shear stress compared to unmodified bitumen. Although WCO modifications do enhance performance, their improvements are less pronounced compared to SBS and AB modifications. Notably, the 5% WCO sample exhibits an early plateau in effective shear stress and fails to outperform the 3% and 4% WCO samples. This behavior suggests that higher WCO content may introduce instability or reduce stiffness beyond an optimal concentration. Therefore, 3% and 4% WCO concentrations appear more effective in delivering balanced improvements in flexibility and moderate stiffness, making them more suitable for applications with lower traffic loads and where enhanced workability is desired.
In summary, the amplitude sweep results in Figure 5 clearly indicate that SBS and AB modifications significantly enhance bitumen stiffness and shear resistance, making them highly suitable for demanding pavement conditions. SBS, especially at 5%, delivers the highest overall performance. Animal bone ash modification also shows considerable stiffness improvement, particularly at higher concentrations. WCO provides moderate performance improvements at lower concentrations, balancing flexibility and stiffness effectively, but higher WCO content such as 5% may not yield reliable or optimal performance.

4.5. Step Load Mode

Figure 6 presents the step load mode results, offering valuable insights into the deformation resistance and overall performance of unmodified and modified bitumen samples under sustained loading conditions. The unmodified sample exhibits a sharp increase in shear strain over time, highlighting its vulnerability to deformation when subjected to constant stress. This behavior indicates that the base bitumen lacks sufficient elasticity to recover from or withstand continuous loading, making it more prone to permanent deformation in high-load or high-traffic environments where stress is sustained.
In contrast, bitumen samples modified with styrene–butadiene–styrene (SBS) at 4% and 5% concentrations demonstrate a marked reduction in the rate of shear strain increase over time. The 5% SBS sample shows the greatest deformation resistance among the SBS group. This suggests that SBS effectively enhances the elastic properties of bitumen, enabling it to withstand prolonged loading without significant deformation. This improvement likely stems from the ability of SBS to form a more stable polymer network within the bitumen matrix, reinforcing its resistance to shear forces. Consequently, SBS-modified bitumen is especially suited for applications demanding high durability and resilience under sustained loads, as it maintains structural integrity more effectively.
Bitumen samples modified with animal bone ashes (AB) at 4%, 5%, and 6% concentrations also exhibit a slower increase in shear strain over time. The 6% AB sample shows the highest resistance to deformation within the AB group. This indicates that higher AB concentrations contribute to greater structural stability, likely by reinforcing the bitumen matrix and enhancing elasticity. This improvement in performance makes AB-modified bitumen well-suited for applications where materials encounter repetitive or sustained loads, as it resists permanent deformation more effectively than the unmodified sample.
Waste cooking oil (WCO)-modified samples at 3%, 4%, and 5% concentrations demonstrate moderate improvements in shear strain resistance compared to the unmodified bitumen. However, these enhancements are less pronounced than those observed with SBS and AB modifications. The best performance among WCO samples occurs at the 5% concentration, though it still falls short of the resistance achieved by SBS and AB. This is likely due to WCO’s influence on flexibility rather than rigidity, which introduces a level of elasticity without substantially reinforcing the bitumen structure. Therefore, WCO-modified bitumen may be more appropriate for applications requiring moderate flexibility instead of maximum stiffness, as it allows some deformation without offering the robustness provided by SBS and AB.
In conclusion, the step load mode results in Figure 6 demonstrate that SBS and AB modifications significantly improve deformation resistance under sustained loading, with optimal performance observed in the 5% SBS and 6% AB samples. These additives enhance bitumen’s elasticity and structural integrity, likely due to stable network formations that resist shear forces. By contrast, WCO modifications offer moderate flexibility but do not match the stiffness and deformation resistance achieved with SBS and AB. These findings suggest that SBS and AB are optimal for applications that require high resilience under constant loading, while WCO is a viable option where moderate flexibility without extensive rigidity is beneficial.

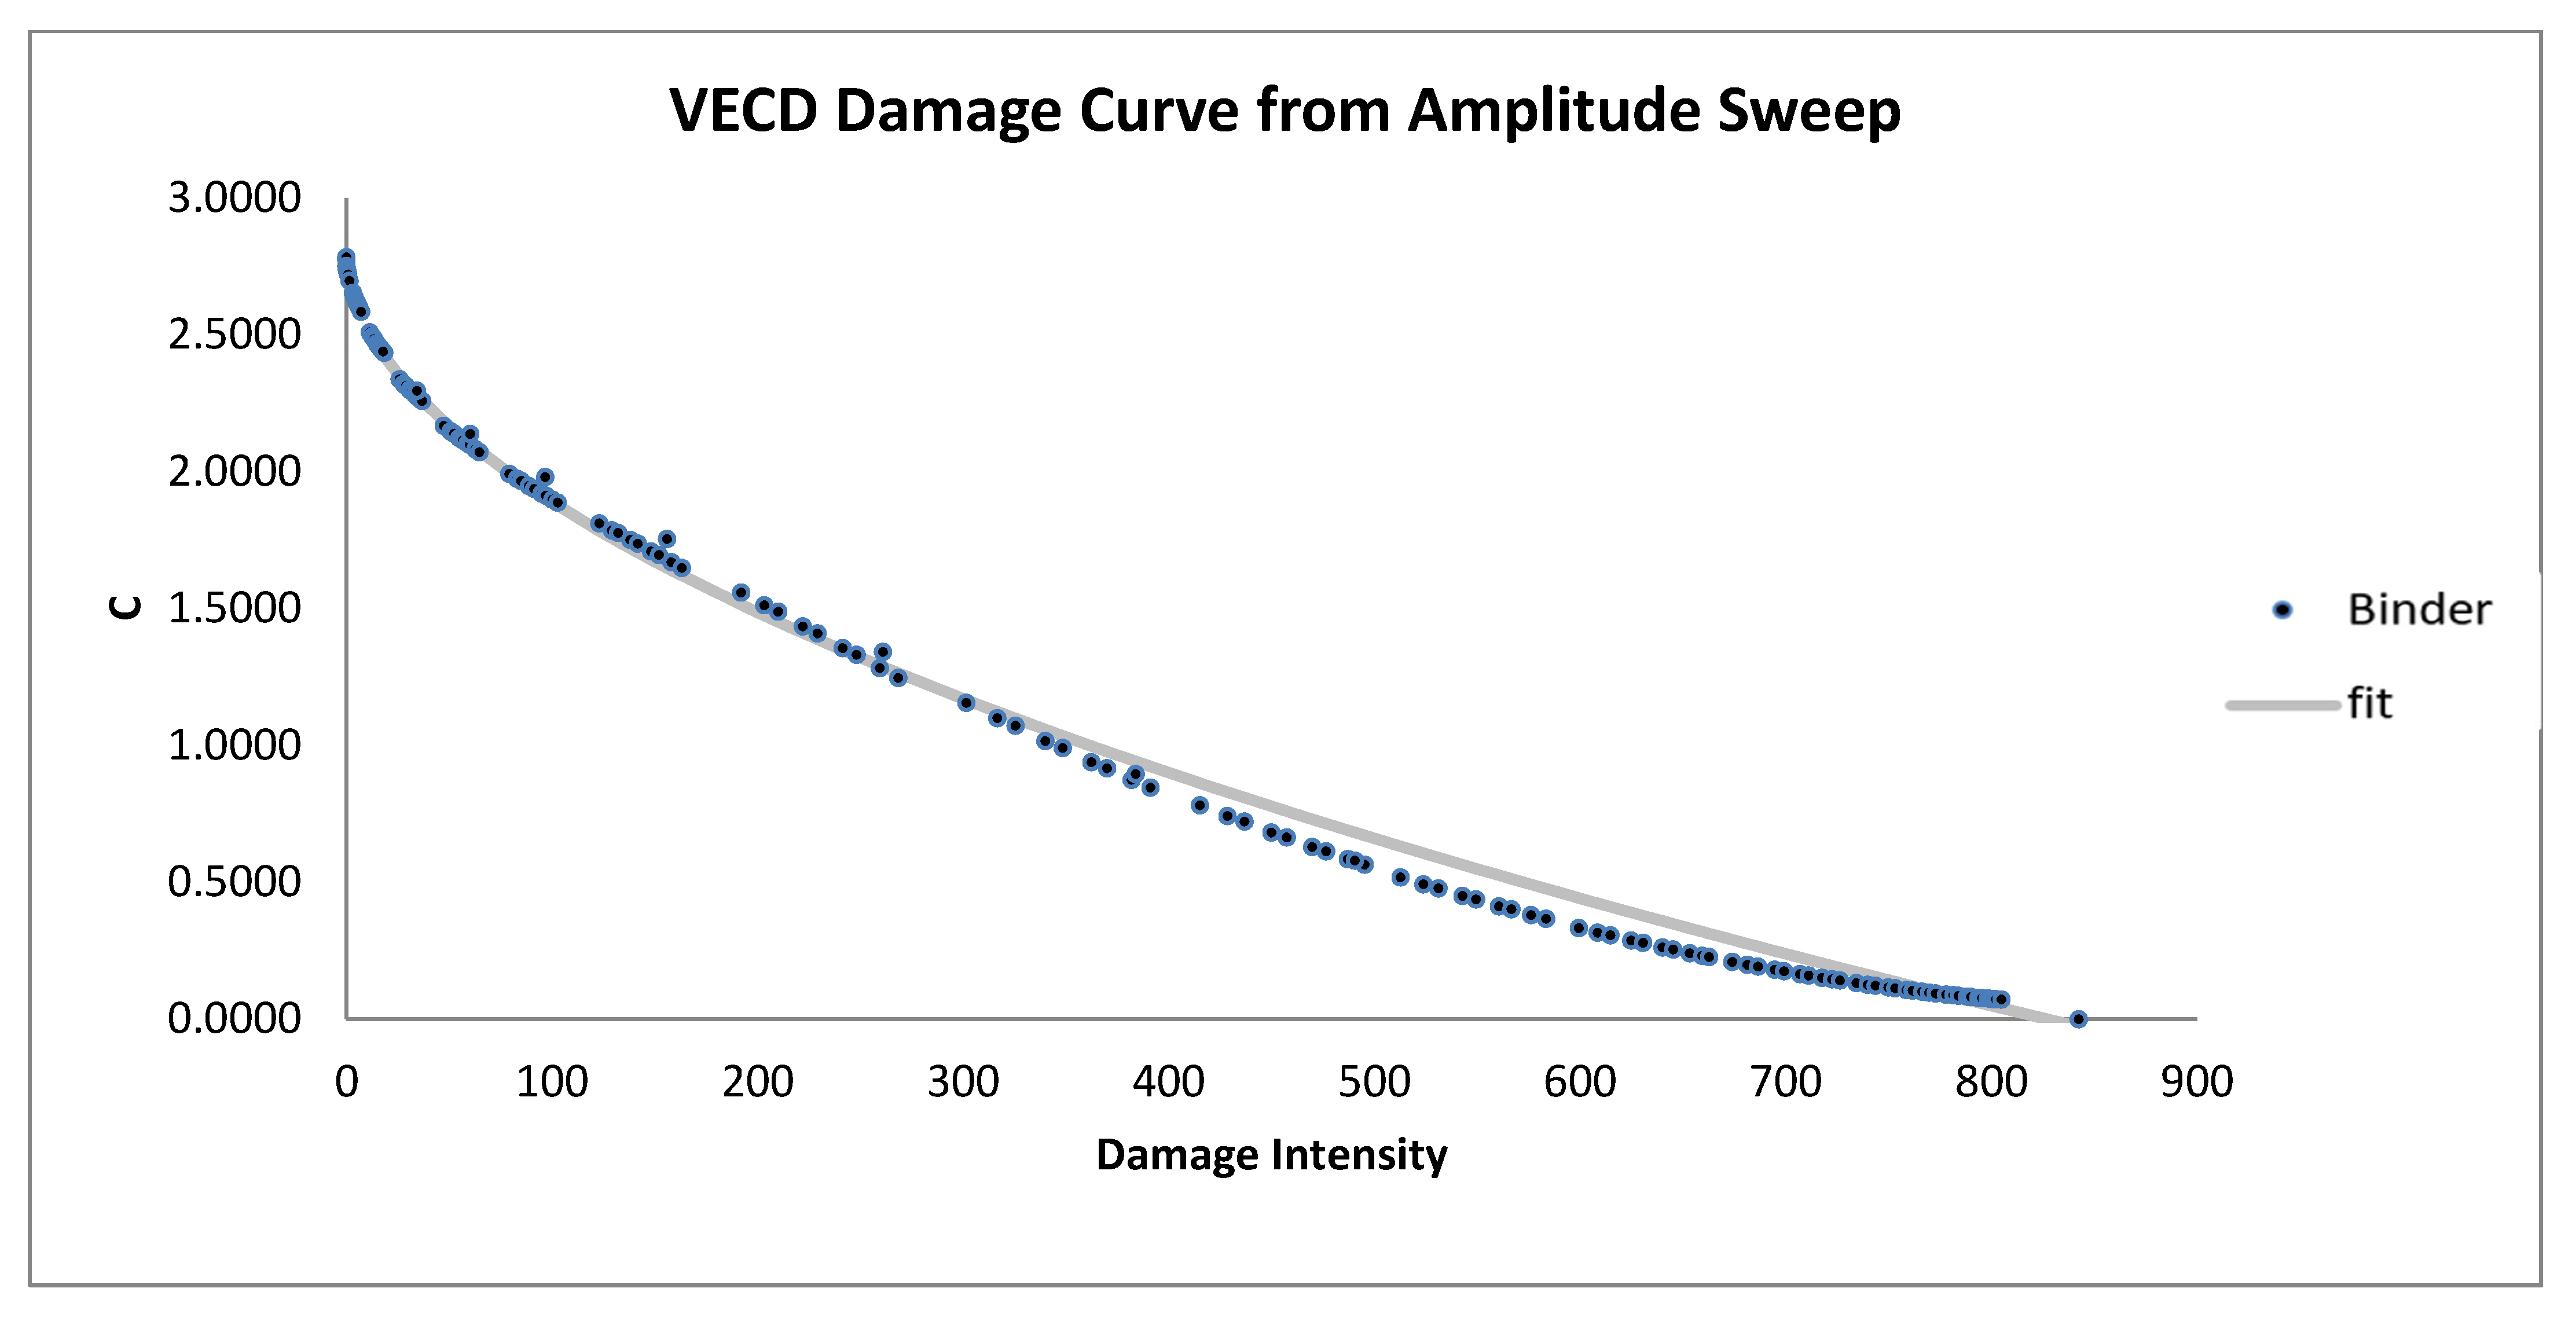
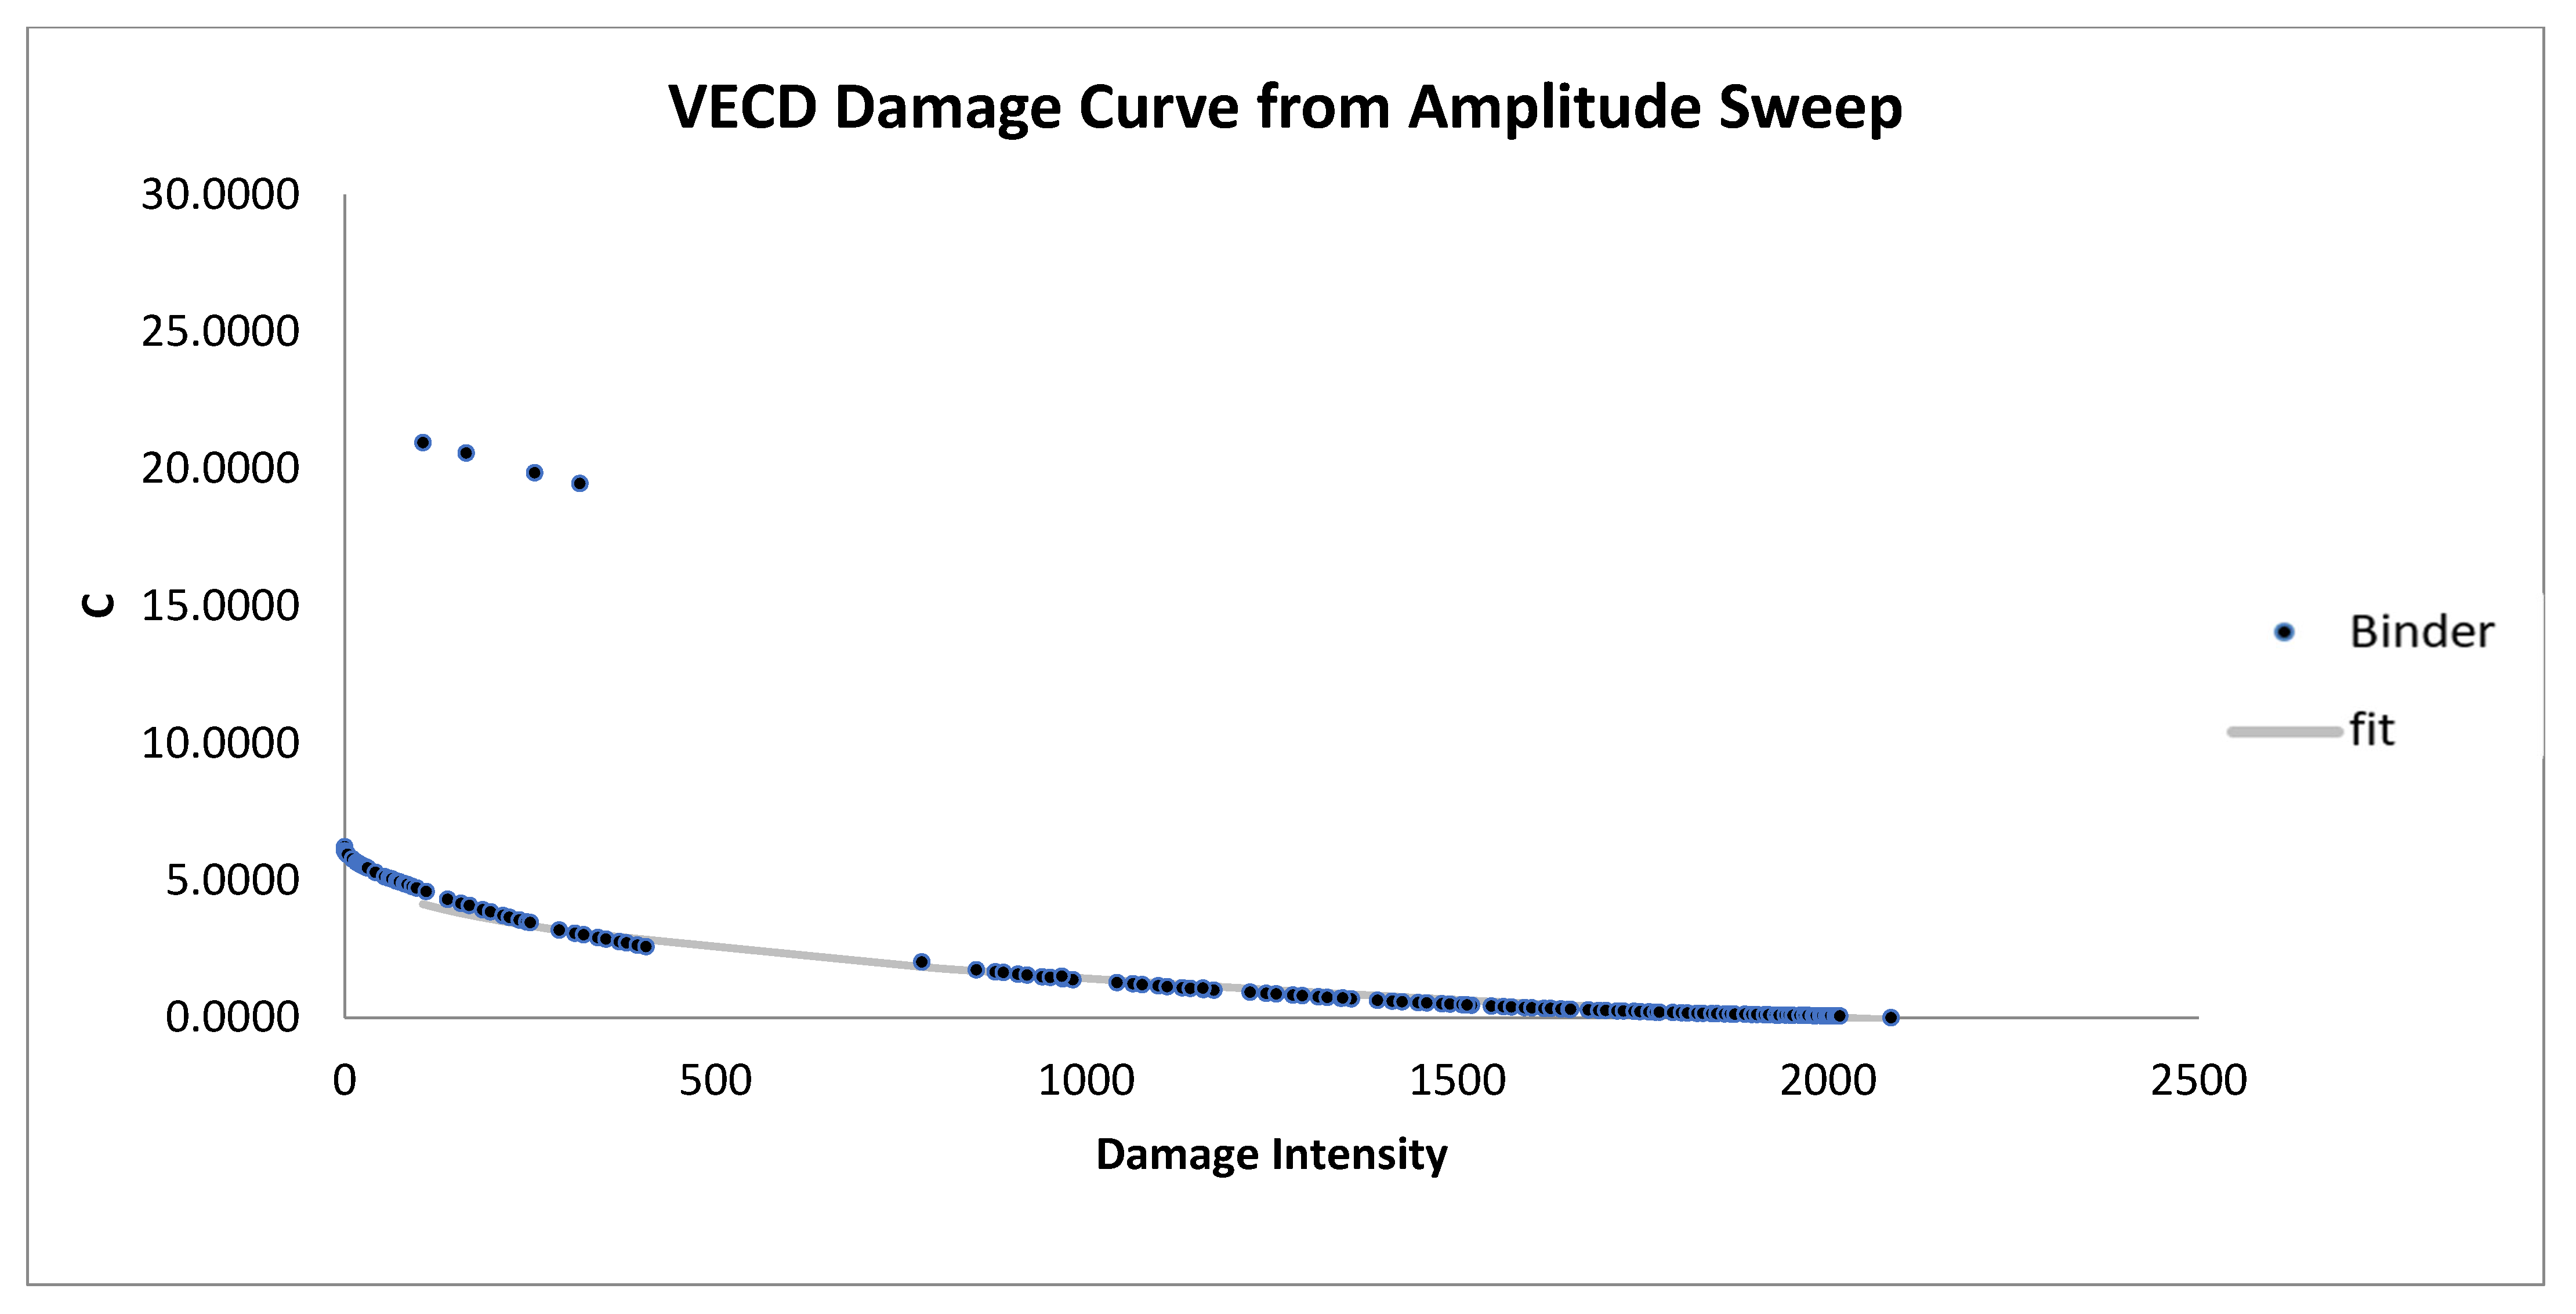
4.6. VECD Damage Curve Results

Figure 7, Figure 8, Figure 9, Figure 10, Figure 11, Figure 12, Figure 13, Figure 14 and 
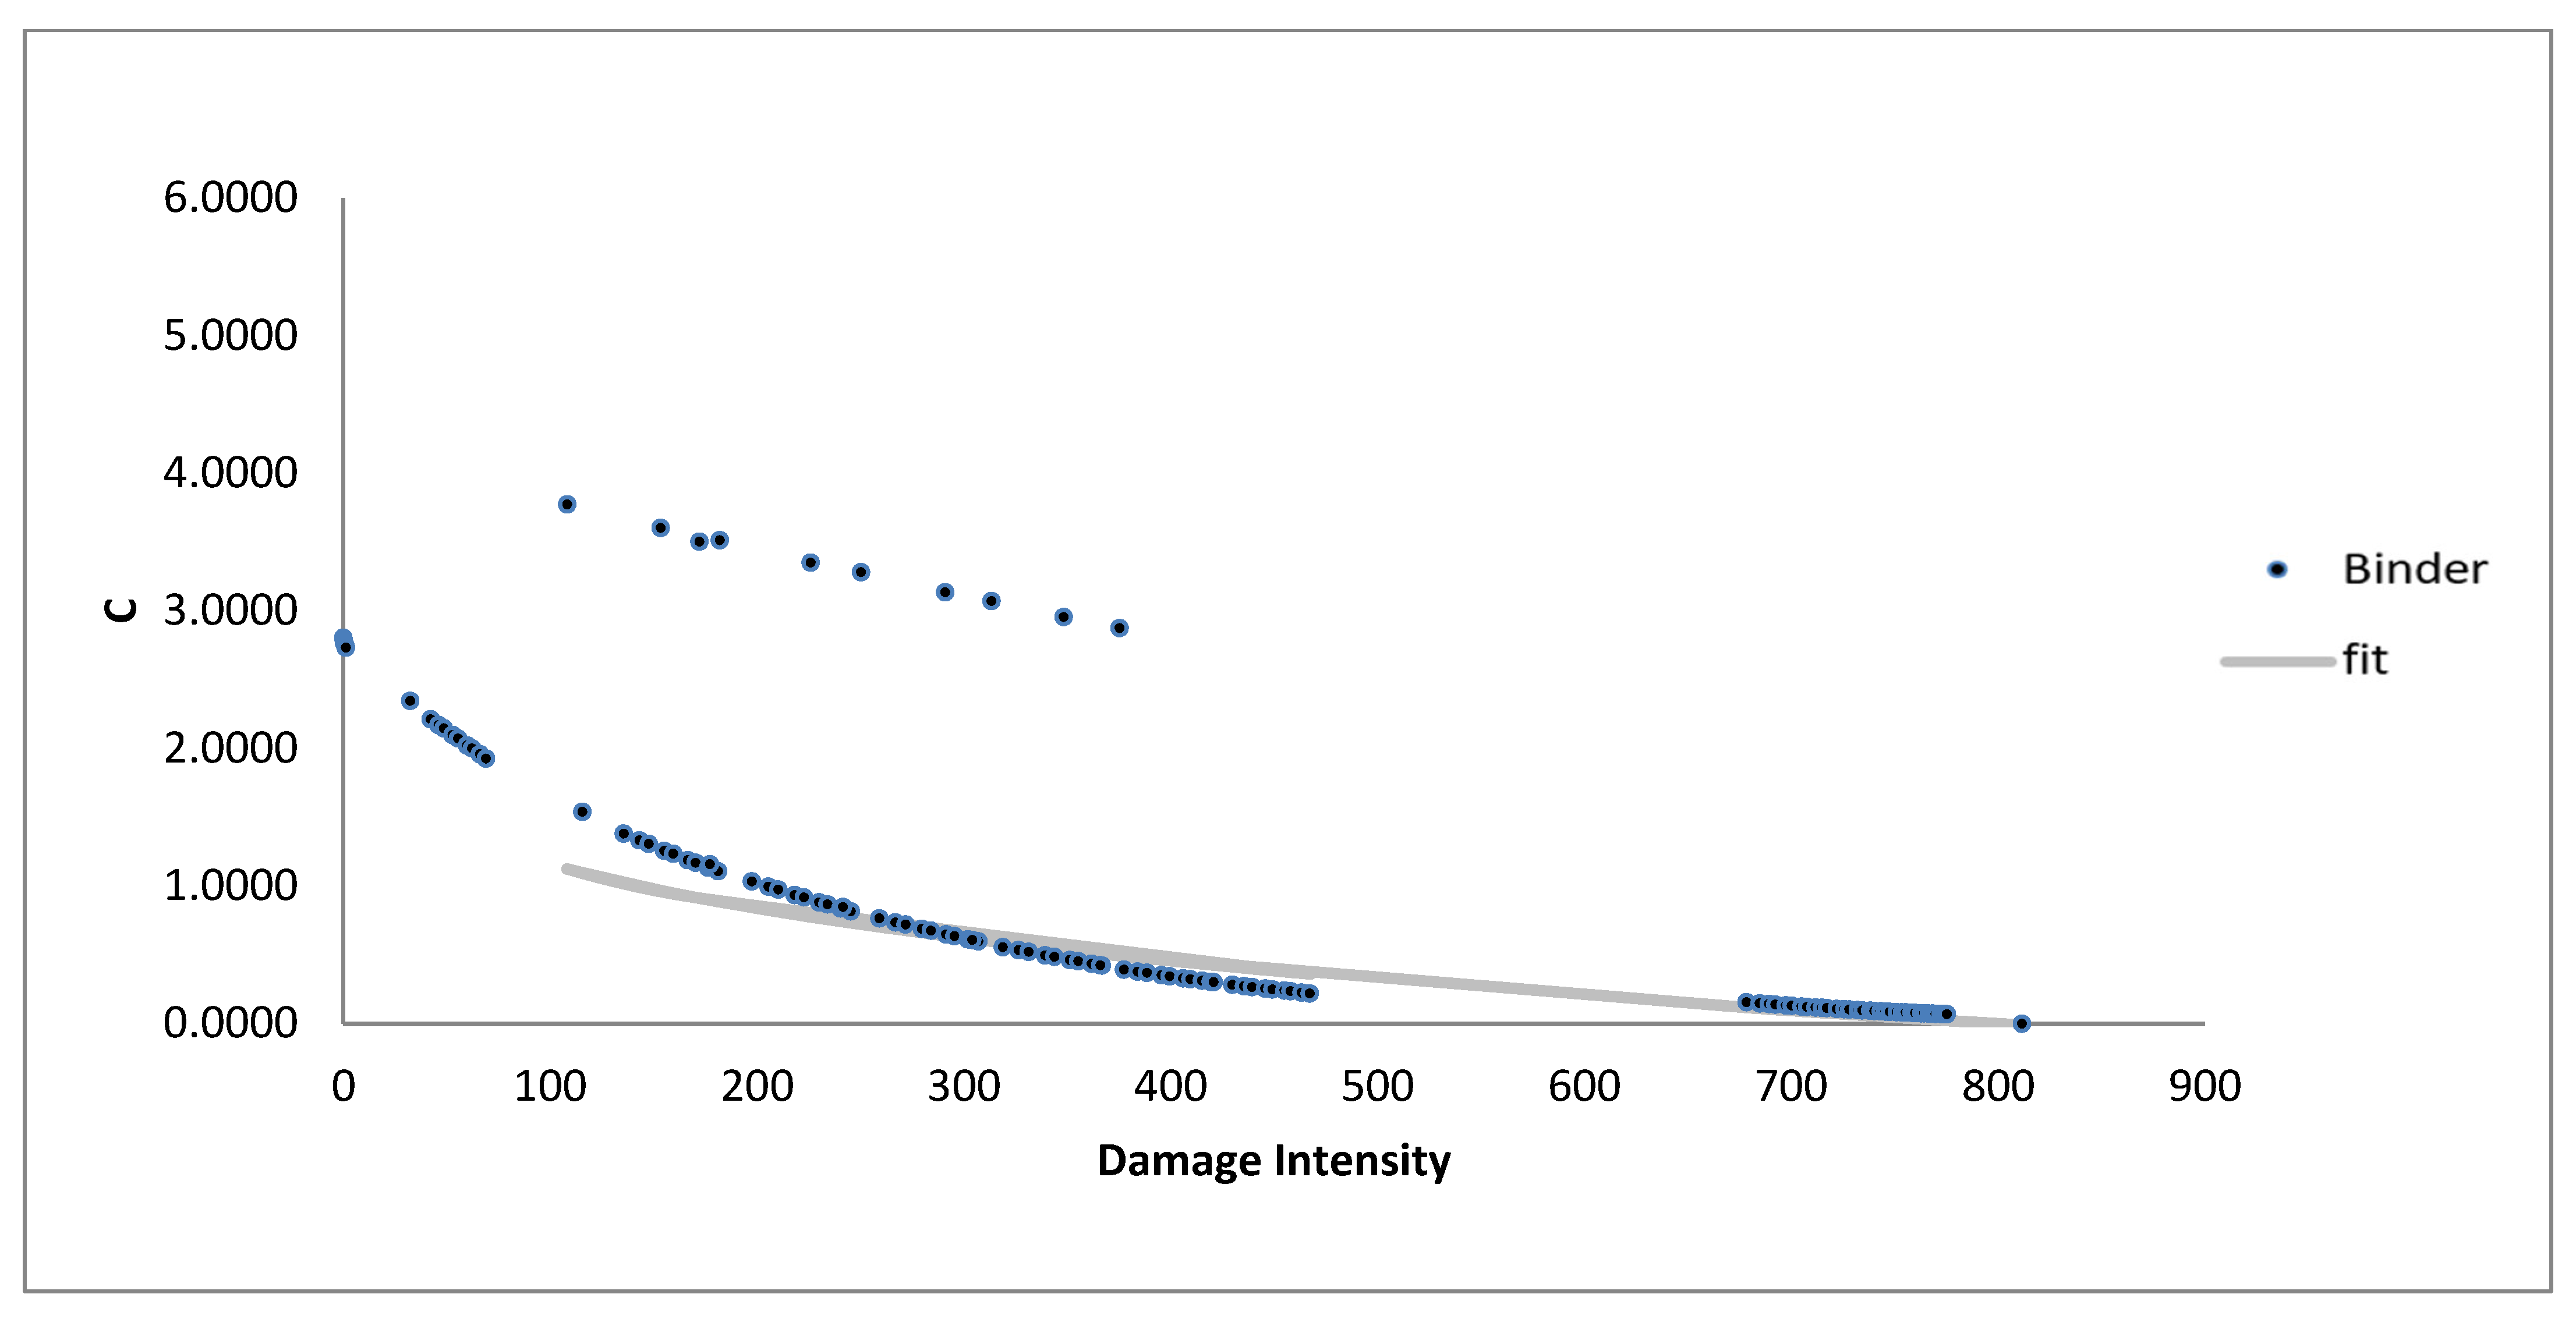
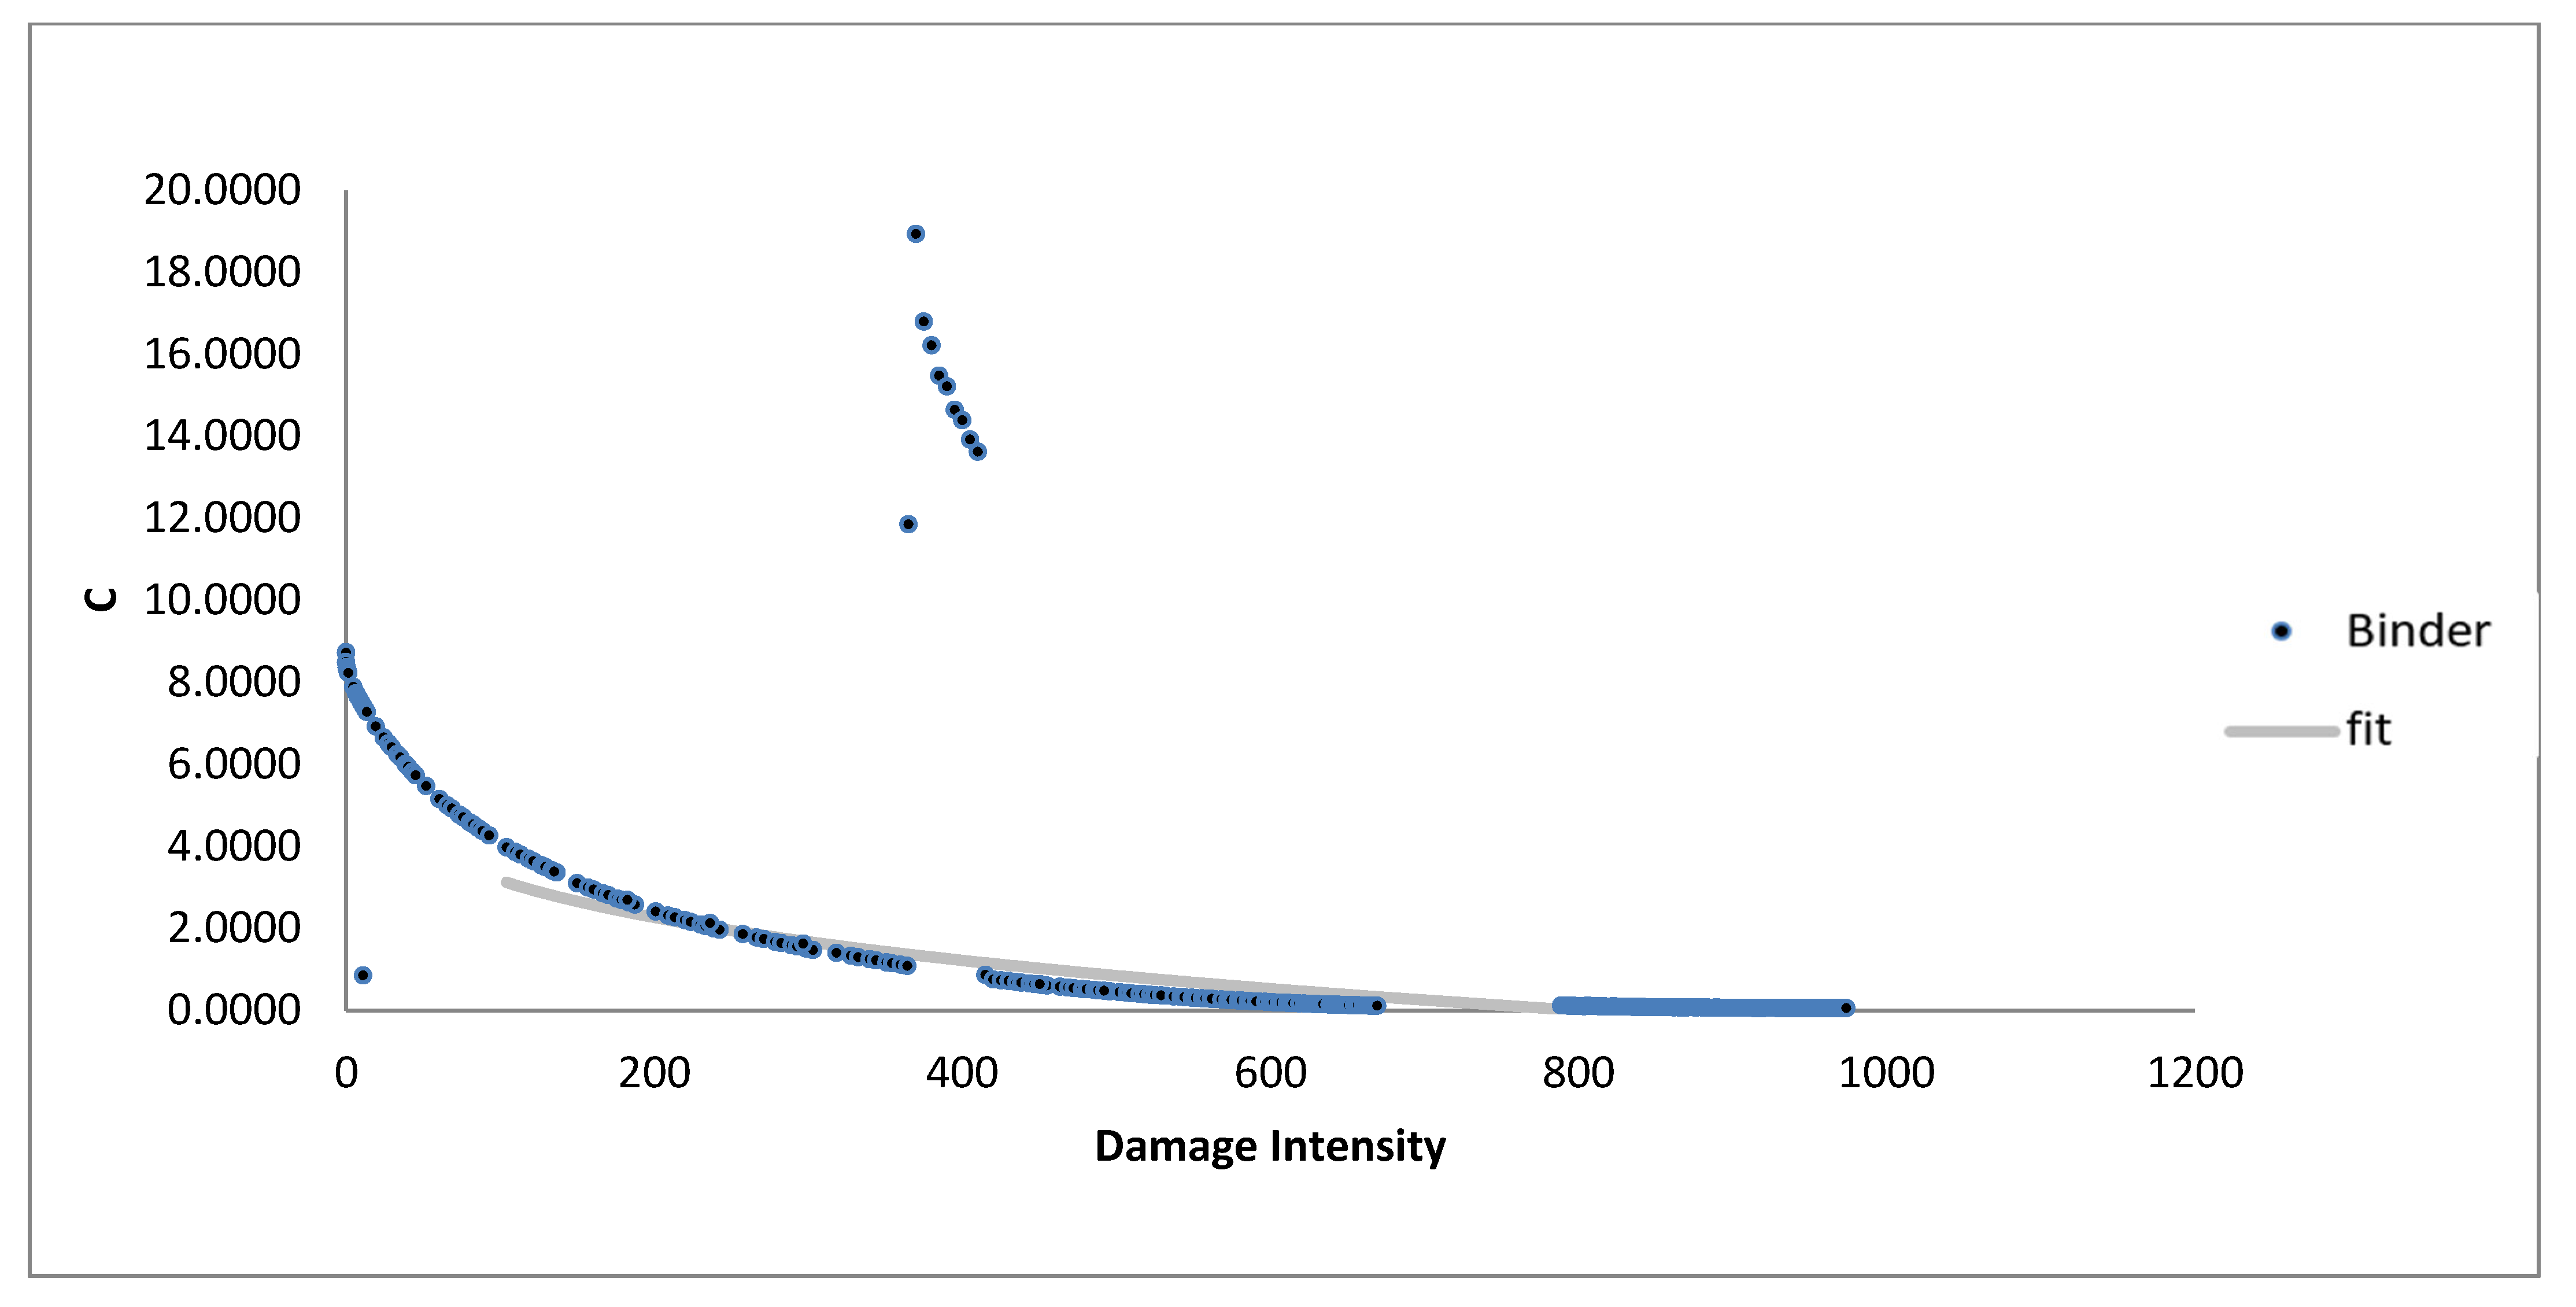
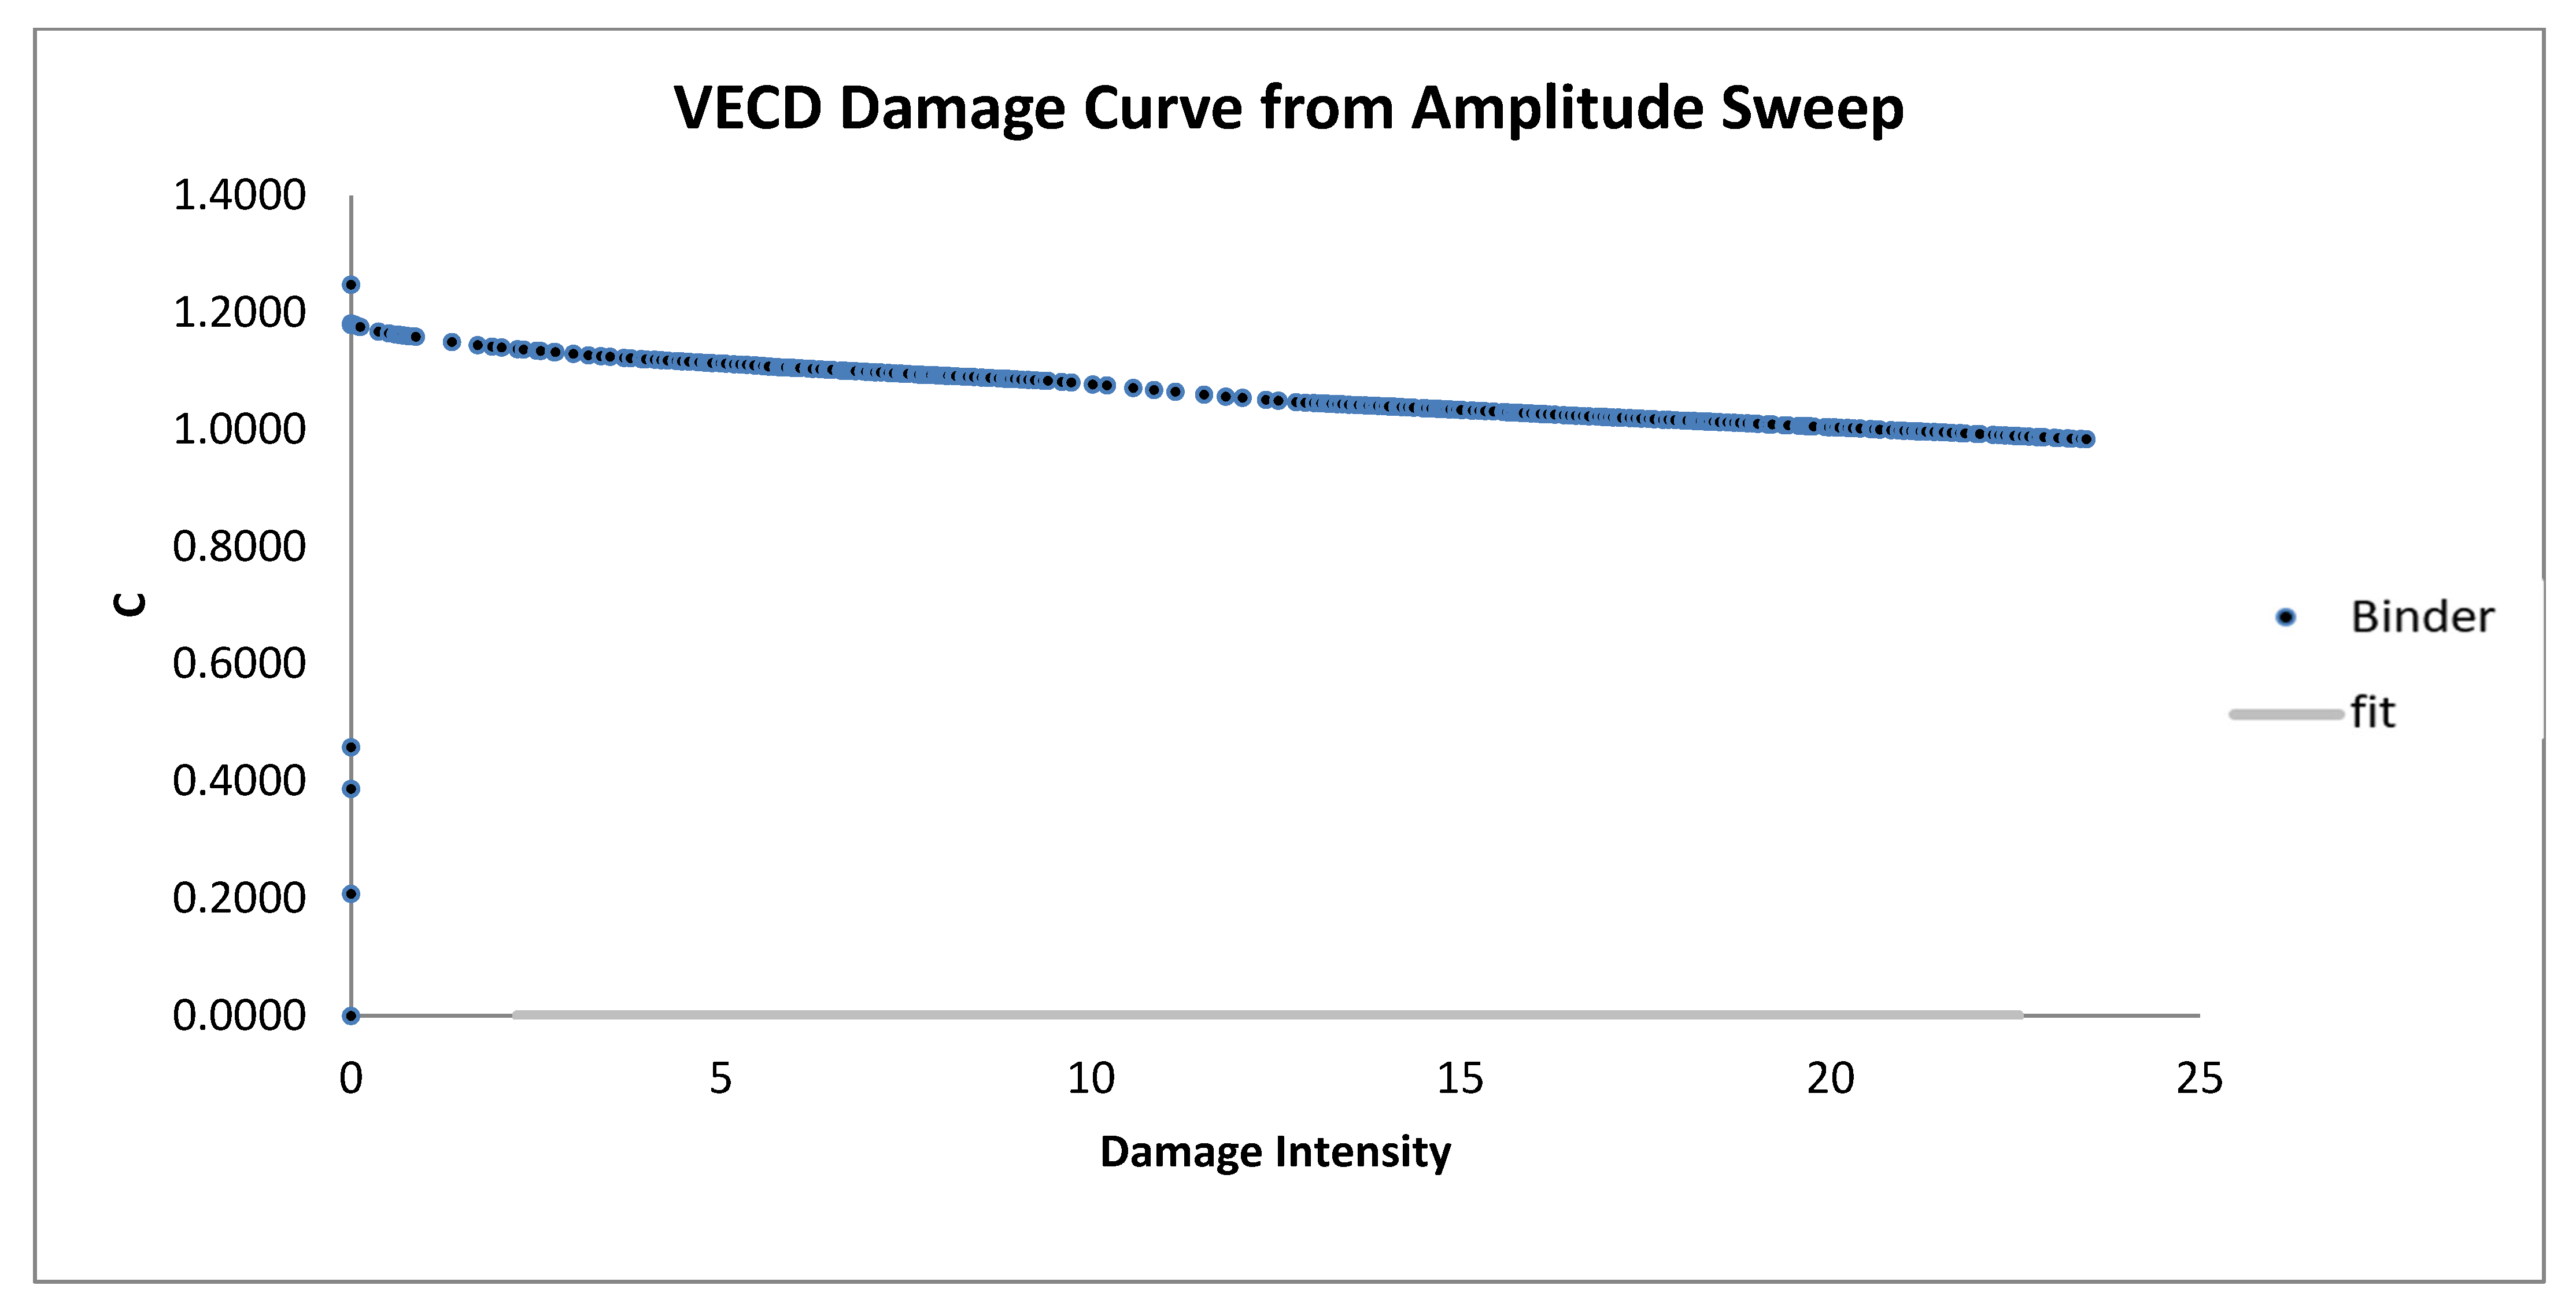
Figure 15 present the VECD damage curves derived from the amplitude sweep tests, illustrating the fatigue behavior of various unmodified and modified bitumen samples. In these graphs, the x-axis represents the damage intensity (dimensionless), which quantifies the accumulated damage in the binder under cyclic loading. The y-axis shows the pseudo-stiffness parameter (C), also dimensionless, reflecting the degradation in material stiffness over the course of loading. These axis definitions have been added to clarify the interpretation of the fatigue performance results presented. The observed trends demonstrate how different modifiers influence the rate of stiffness reduction and the material’s resistance to damage progression. In Figure 7, the unmodified bitumen sample exhibits a relatively steep damage curve, indicating a rapid damage progression with applied strain. This steep increase suggests a limited capacity for resisting cumulative damage, making the unmodified bitumen more susceptible to cracking and structural breakdown under repeated loading. Without additives, the base bitumen lacks mechanisms for dissipating stress effectively, leading to faster accumulation of micro-damage, which would reduce its longevity in high-demand applications.
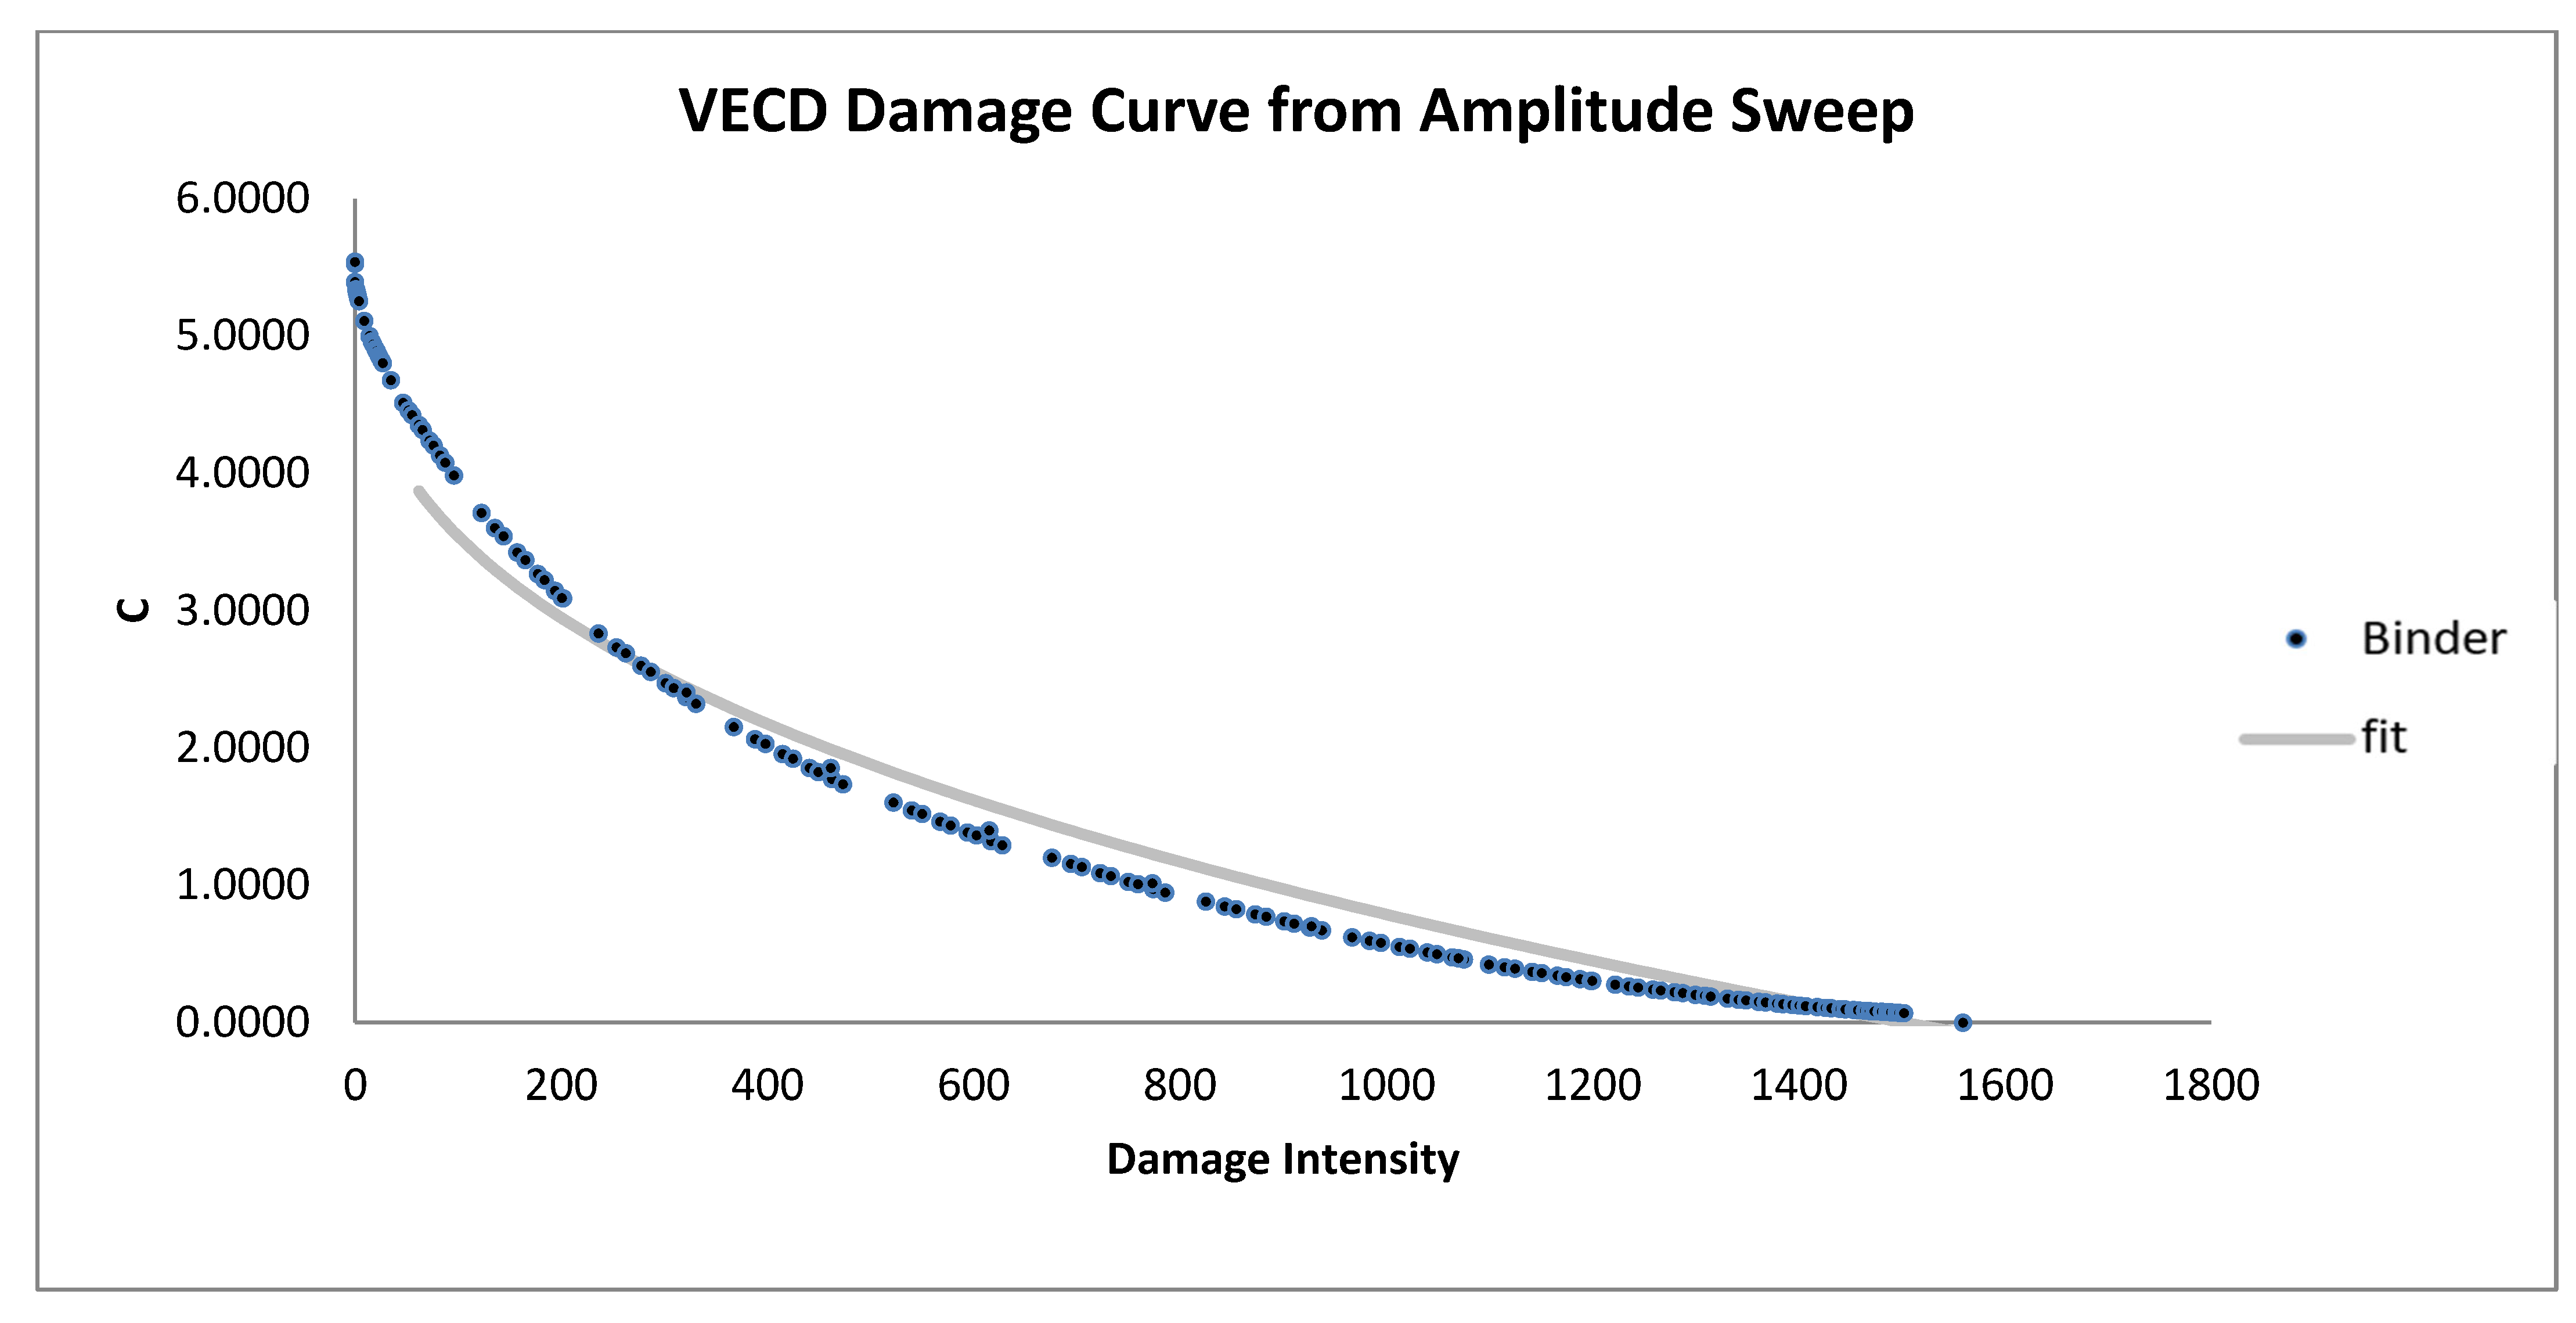
Figure 8 and Figure 9 illustrate the performance of bitumen samples modified with 4% and 5% styrene–butadiene–styrene (SBS), showing noticeably less steep damage curves. Notably, the 5% SBS sample in Figure 9 demonstrates a gradual slope, indicating slower damage accumulation than the unmodified sample. This improved resistance to cumulative damage is likely due to SBS’s ability to form a resilient polymer network within the bitumen, enhancing its capacity to absorb and dissipate strain energy effectively. The polymeric structure of SBS contributes both elasticity and toughness, making it suitable for applications where durability under repetitive loading is critical. Consequently, SBS-modified samples resist micro-damage formation more effectively, extending the material’s lifespan in high-stress environments.
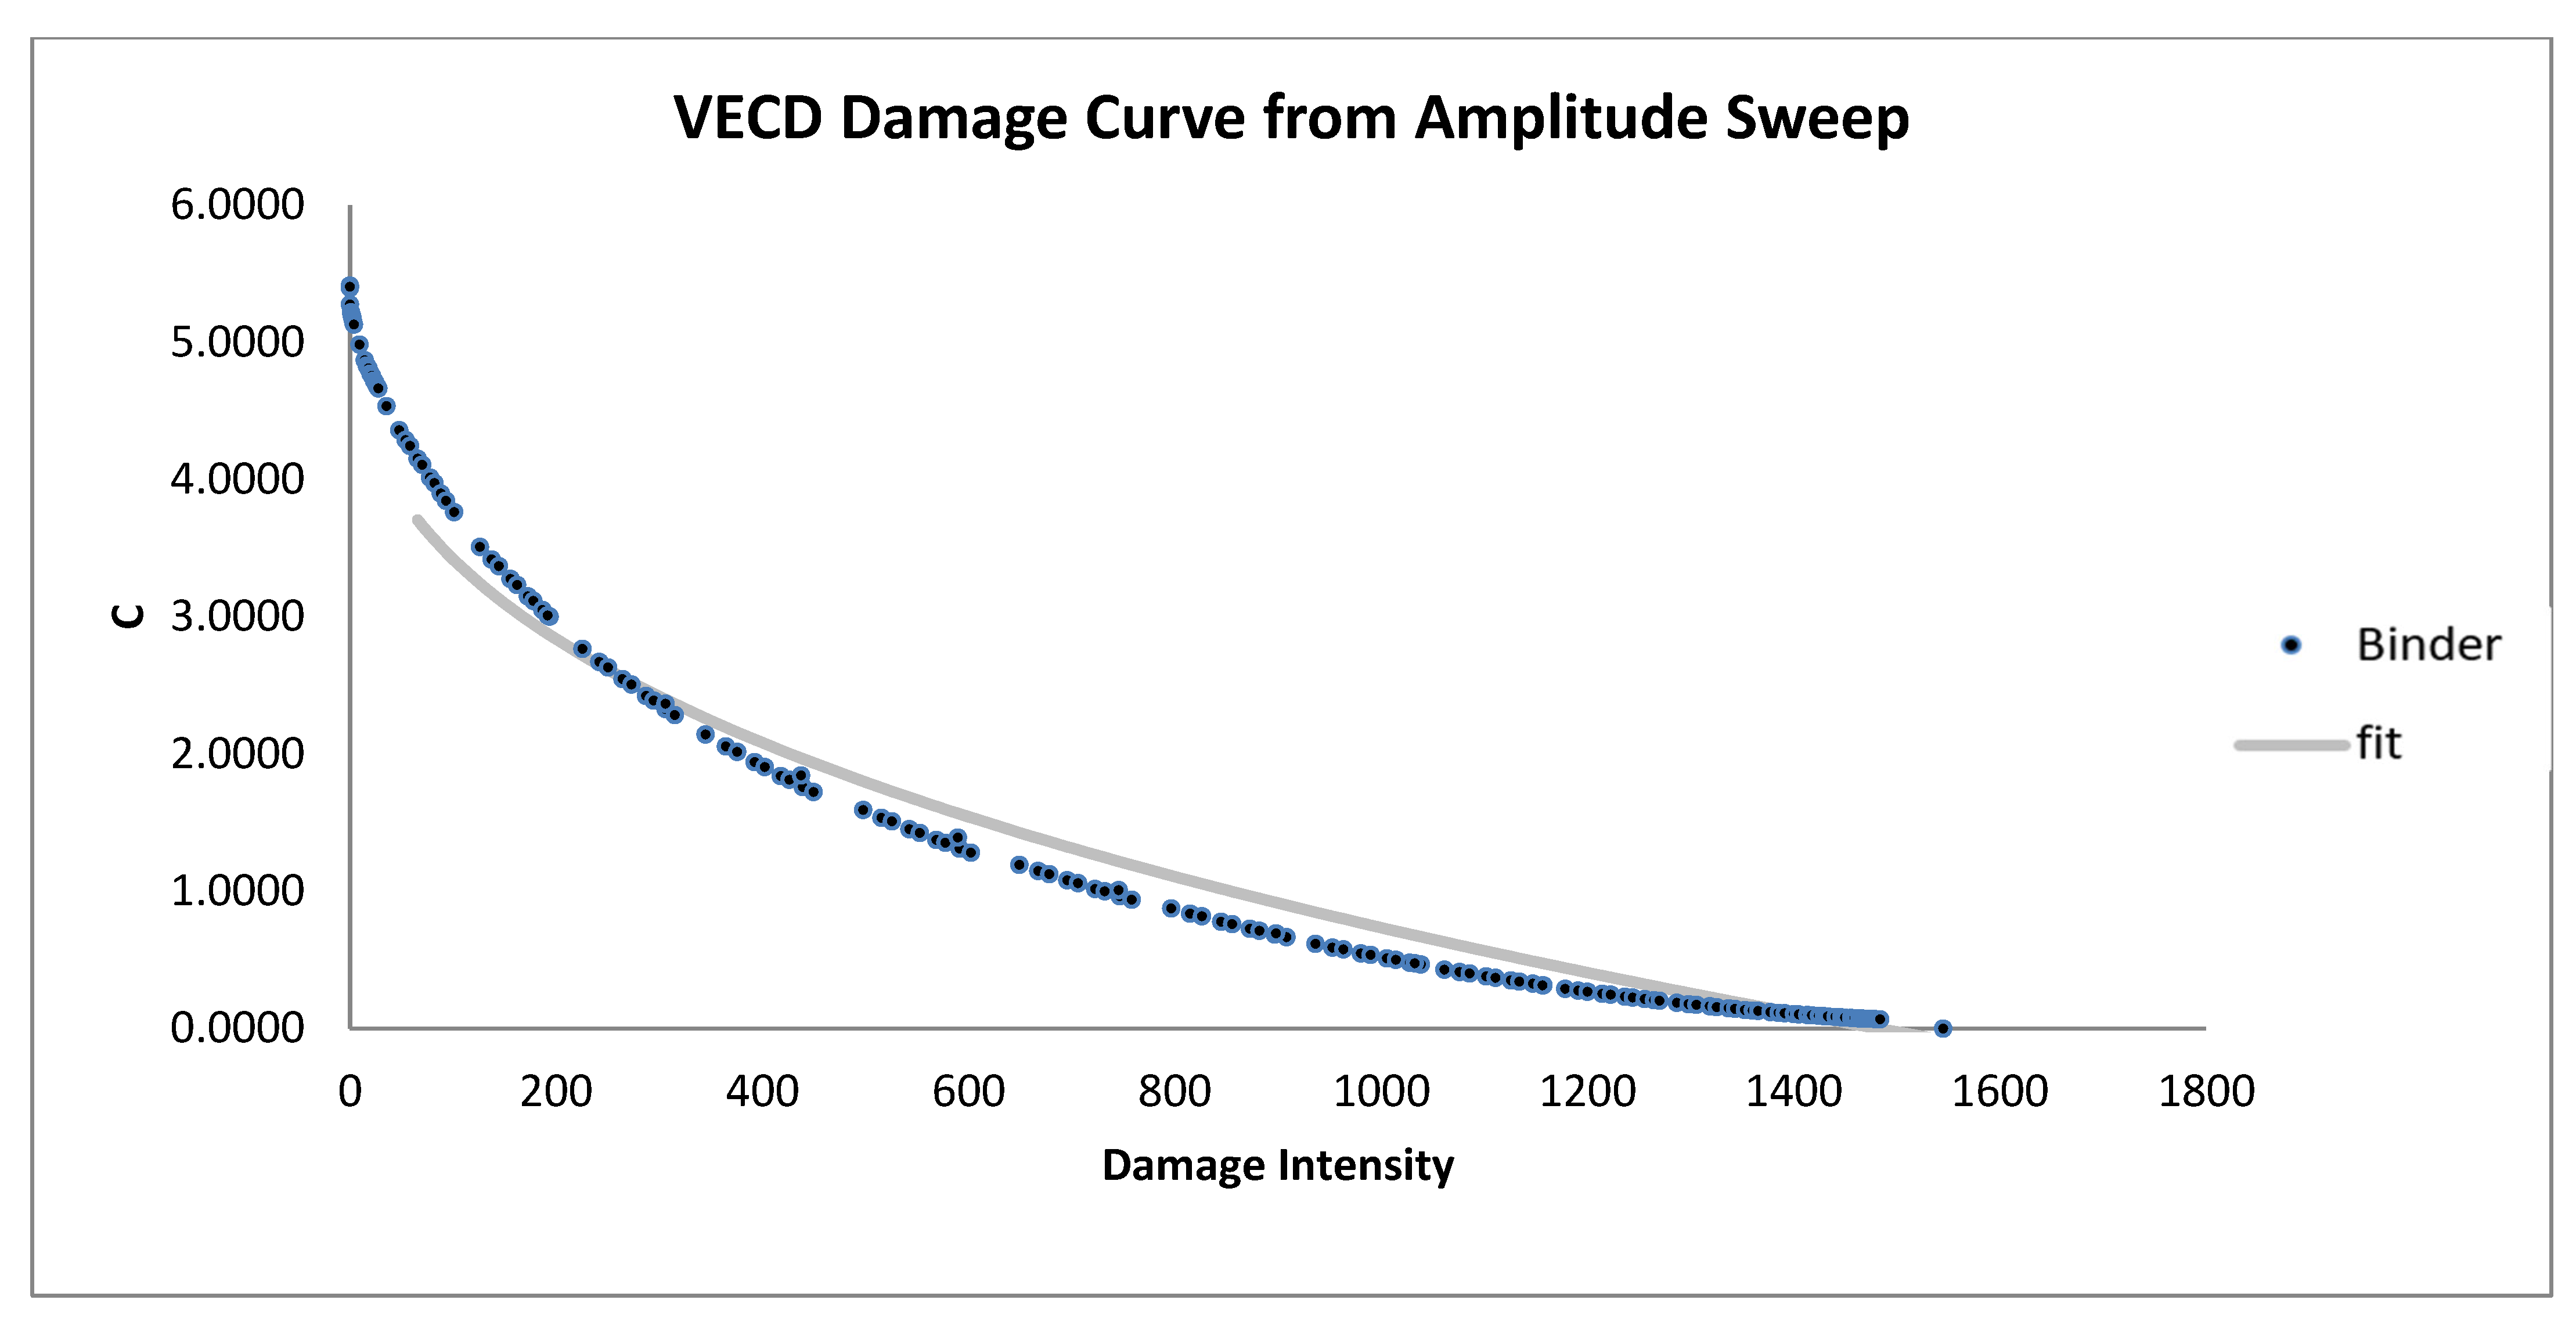
In Figure 10, Figure 11 and Figure 12, the damage curves for bitumen modified with animal bone ashes (AB) also reveal a reduction in slope compared to the unmodified bitumen, with the 6% AB-modified sample (Figure 12) exhibiting the most gradual slope. This indicates that higher AB concentrations significantly enhance resistance to cumulative damage. AB’s reinforcement effect likely stems from its ability to increase the elastic properties of bitumen, enabling more effective recovery from each load cycle. This elasticity allows AB-modified bitumen to withstand better the stresses associated with repeated loading, thus slowing the deterioration process. These results suggest that AB-modified bitumen offers substantial durability improvements, making it especially beneficial for applications that demand sustained structural integrity under continuous loading.
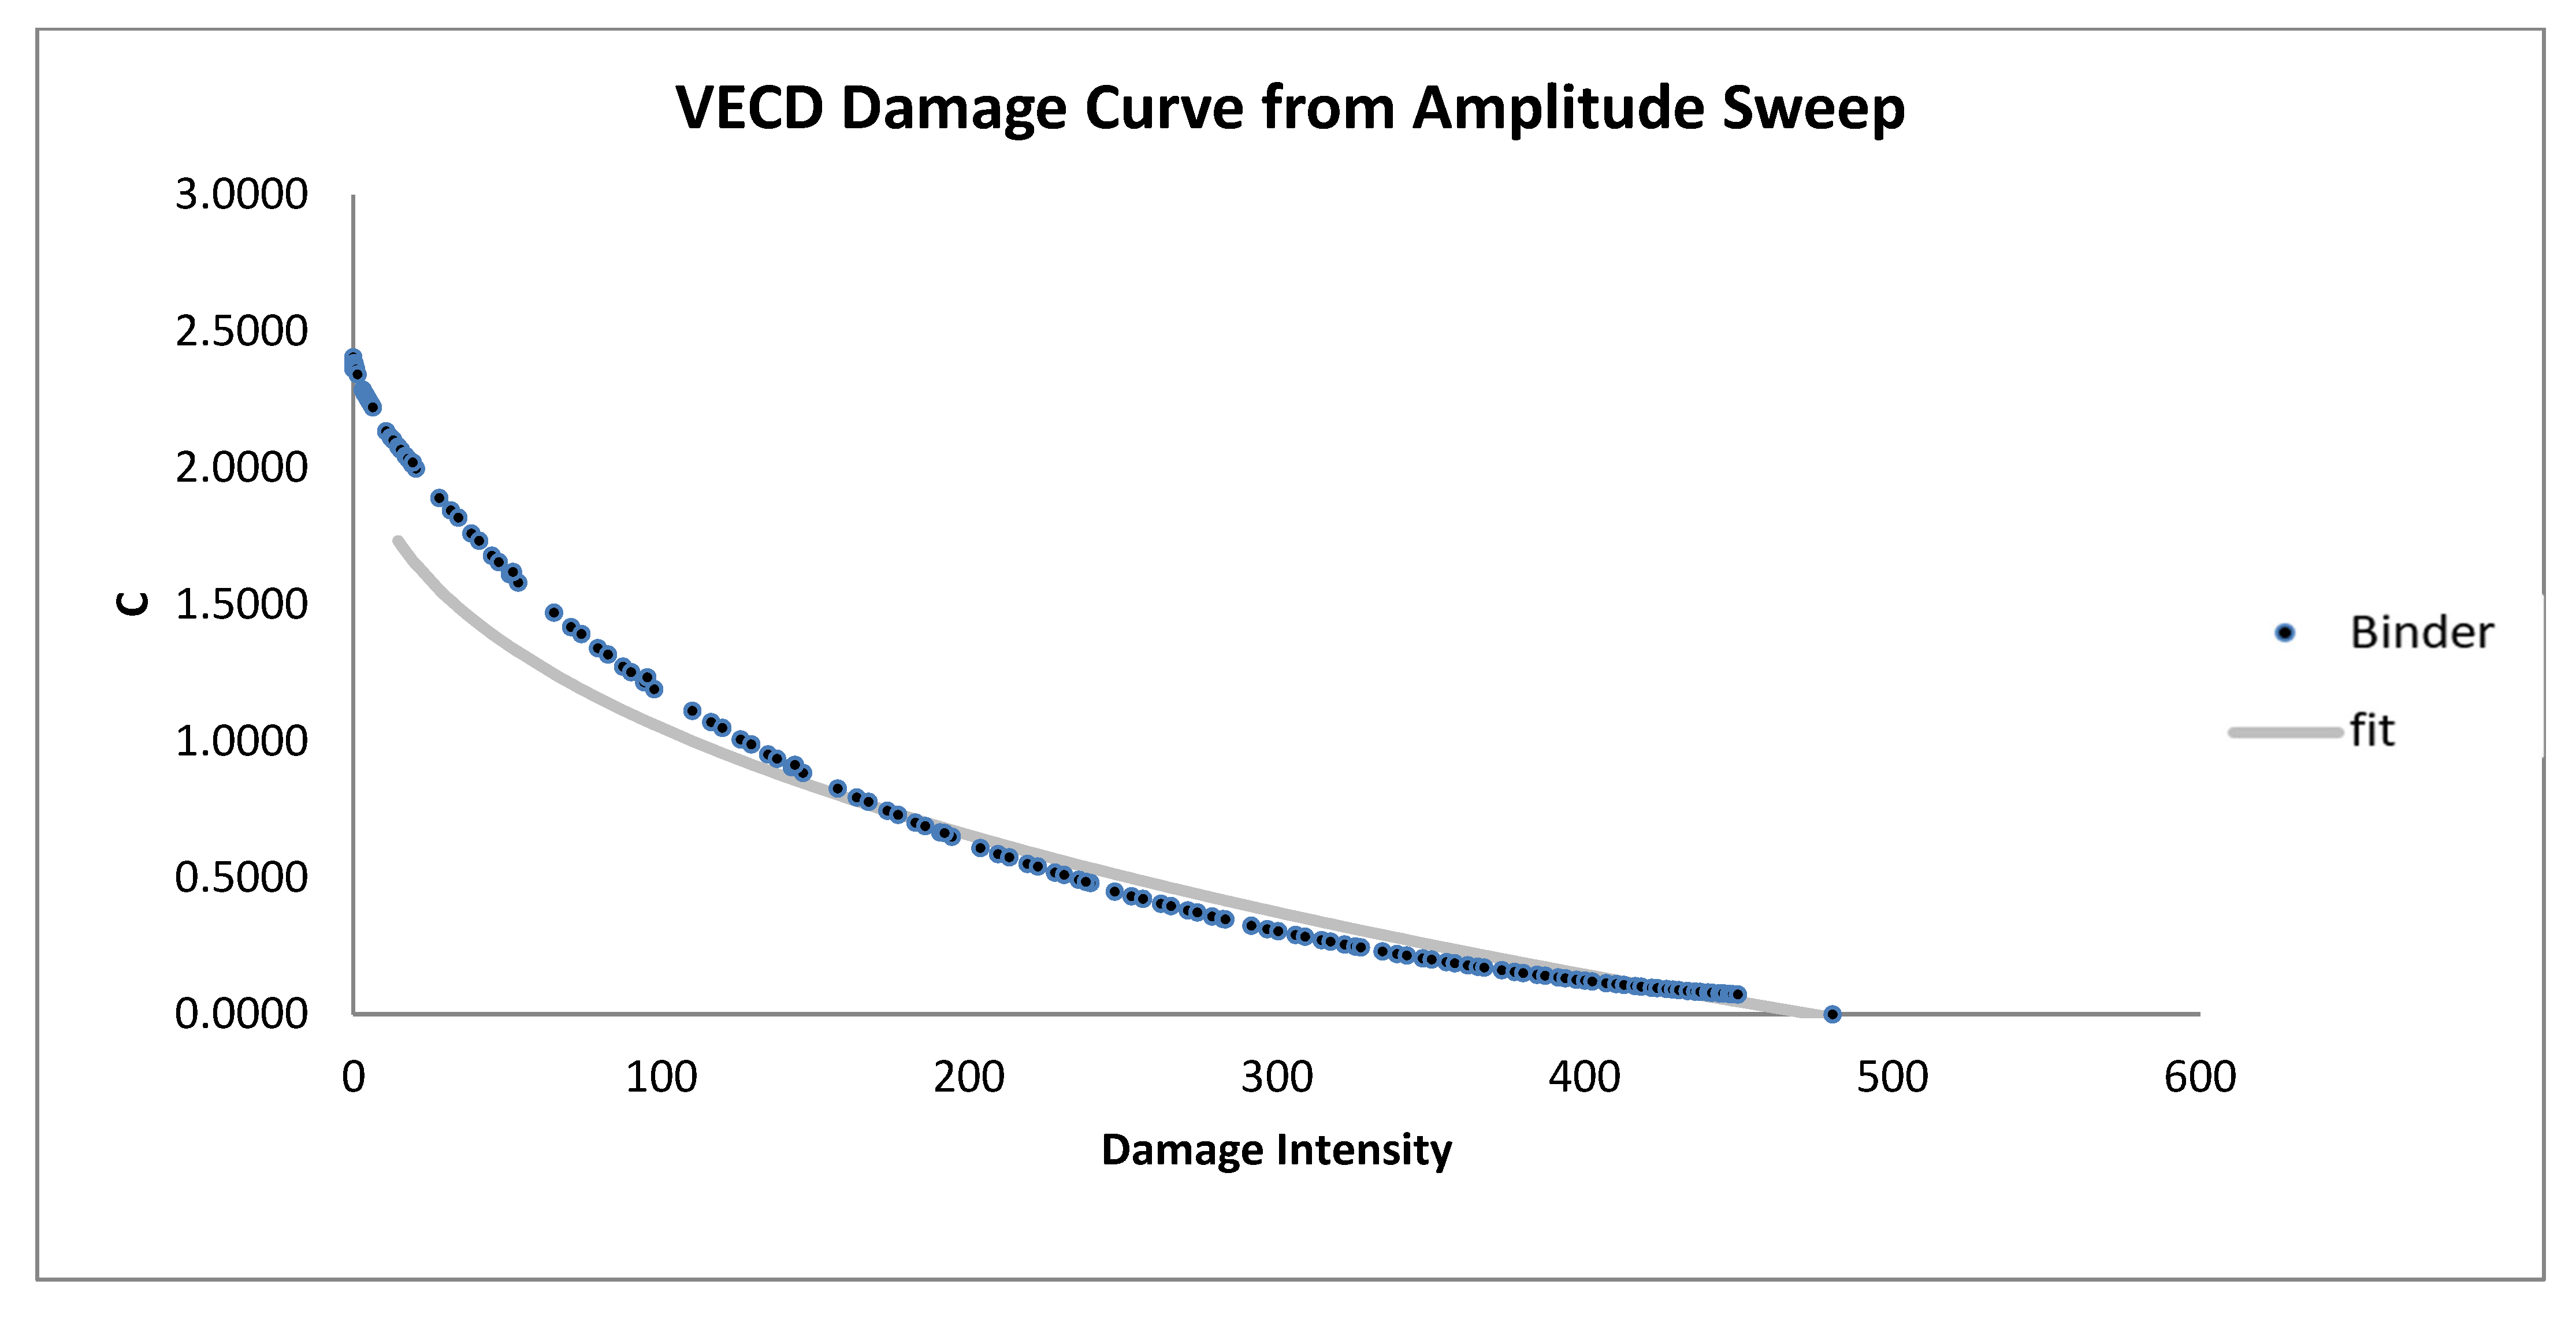
Figure 13, Figure 14 and Figure 15 display the VECD damage curves for bitumen samples modified with waste cooking oil (WCO) at 3%, 4%, and 5% concentrations. Although WCO modifications show some improvement in damage resistance compared to the unmodified sample, their curves are steeper than those of SBS- and AB-modified samples. Among the WCO-modified samples, the 4% WCO sample (Figure 14) exhibits the best performance, demonstrating a wider range of damage intensity and more gradual reduction in modulus. In contrast, the 5% WCO sample (Figure 15) shows a limited damage range and irregular behavior, suggesting poorer fatigue resistance and possible instability at higher concentrations. This may be due to WCO’s role in enhancing flexibility rather than rigidity, allowing for energy dissipation without effectively reinforcing the bitumen against micro-damage. Thus, WCO-modified bitumen may be more suitable for applications requiring moderate durability and flexibility rather than extreme resistance to repetitive stress.
In summary, the VECD damage curve analysis from Figure 7, Figure 8, Figure 9, Figure 10, Figure 11, Figure 12, Figure 13, Figure 14 and Figure 15 suggests that SBS and AB are the most effective additives for enhancing bitumen’s resistance to cumulative damage. SBS at a 5% concentration (Figure 9) and AB at 6% (Figure 12) exhibit the most gradual damage curves, reflecting superior performance in resisting micro-damage. This increased resistance is advantageous for high-stress applications, such as pavements in heavily trafficked areas, as it extends the operational life of the material. While WCO modifications provide flexibility and moderate durability benefits, their effectiveness in resisting cumulative damage is limited compared to SBS and AB. Among WCO-modified samples, the 4% WCO sample (Figure 14) demonstrates the best performance, with a broader damage intensity range and smoother curve. In contrast, the 5% WCO sample (Figure 15) shows less favorable behavior, with a shorter damage range and irregular pattern, indicating potential instability. This makes WCO a suitable choice where flexibility is prioritized over extreme durability.

4.7. Energy Considerations for Industrial Application

Incorporating waste-based additives such as bone ash (AB) and waste cooking oil (WCO) into asphalt binders offers environmental advantages, but also introduces specific energy demands that must be considered to assess overall sustainability, especially under industrial-scale conditions.

4.7.1. Energy Demand for Bone Ash Calcination

In this study, bone ash was produced by firing sun-dried animal bones at 800 °C for 90 min. While laboratory furnaces were used in this case, transferring this process to industrial production involves significant energy input. Although exact consumption data for bone calcination is not available in the literature, firing at 800 °C for 90 min typically requires prolonged operation of gas- or electric-powered kilns. Therefore, this step should be considered a major contributor to the embodied energy of the AB-modified binders. Further research is necessary to quantify this stage through industrial measurements or life cycle assessment (LCA).

4.7.2. Energy Demand for WCO Mixing and Binder Preparation

The WCO and AB were blended into the bitumen at 160 °C using high-speed mixing. According to Almusawi et al. [44], maintaining this temperature in a batch-type asphalt plant consumes an average of 3.24 kWh/ton of electricity. Additionally, Androjić and Alduk [45] proposed a temperature-based model for natural gas consumption in asphalt plants (Equation (3)):
N G   ( m 3 / t o n ) = 0.0935     T m i x 7.663
Using this model, mixing at 160 °C results in 14.3 m3/ton of natural gas consumption. Assuming a conversion factor of 9.5 kWh per m3 of natural gas, the total thermal energy input amounts to 135.85 kWh/ton. Combined with electrical demand, the total energy required for mixing reaches approximately 139 kWh/ton.

4.7.3. Implications for Sustainability

While bone ash improves stiffness and durability, its calcination requires additional energy input that could offset its environmental gains unless sourced from renewable energy or recovered heat. In contrast, WCO can facilitate lower viscosity and may support temperature reductions in future applications. As Almusawi et al. (2022) [44] demonstrated, reducing the production temperature from 180 °C to 120 °C leads to 35% lower electricity consumption and significantly reduced fuel usage and emissions. Thus, WCO-based mixtures offer a promising pathway for more energy-efficient production, partially compensating for the higher energy demand of AB processing.

5. Conclusions

In this research, the effect of three different additives—styrene–butadiene–styrene (SBS), animal bone ash (AB), and waste cooking oil (WCO)—on the rheological and fatigue properties of bitumen at different loading and temperatures was measured methodically. The use of frequency sweep, amplitude sweep, LAS, and VECD analyses enabled a holistic view of how each modifier impacts the binder’s elasticity, stiffness, and performance durability.
The findings establish that SBS is the best additive, especially at 5%. It had the best elasticity, resistance to deformation, and fatigue life under all the test conditions. SBS-modified binders had consistent rheological properties and maintained pseudo-stiffness levels during fatigue testing, showing optimal long-term performance for severe conditions like hot temperature and heavy-traffic pavement applications.
The 6% animal bone ash substantially enhanced the stiffness and structural integrity of the binder, but with an intense stiffening action that diminished relaxation tendency and enhanced the risk of thermal or cycle load-induced cracking, particularly at low temperatures. These results indicate that optimizing AB dosage must balance strength and flexibility.
Waste cooking oil had the maximum softening effect, enhancing binder flexibility and lowering stiffness at low temperatures. Of the WCO-modified samples, 4% had the most balanced performance. Although it did not outperform SBS or AB for fatigue resistance or high-temperature properties, its environmental benefits and capacity to improve workability qualify it for low to moderate traffic applications where flexibility is of higher concern than structural rigidity.
Overall, SBS is the most suitable additive for improving the performance of applications, AB is only helpful for structural strength but needs control of dosage, and WCO assists with sustainable pavement design with added flexibility and efficiency of mixing. These results prove that specific additive choices may be applied to designing bituminous binders for various climate and traffic conditions.
Recommendations:
  • SBS (5%) should be prioritized for pavements exposed to heavy traffic and dynamic loading.
  • AB (4–5%) can be considered in moderate to warm climates where stiffness is needed but thermal cracking risk is manageable.
  • WCO (4%) serves as a viable eco-friendly alternative for low-load applications requiring flexibility, particularly in temperate regions.
Future work should explore the potential synergistic effects of combining these additives, as well as their long-term aging performance and environmental lifecycle impacts. This would further support the development of durable, cost-effective, and environmentally responsible pavement solutions.

Author Contributions

Conceptualization, A.A.; Methodology, A.A. and S.T.N.N.; Software, A.A.; Validation, A.A.; Formal analysis, A.A. and S.T.N.N.; Investigation, A.A. and S.T.N.N.; Resources, A.A. and S.T.N.N.; Data curation, S.T.N.N.; Writing—original draft, A.A. and S.T.N.N.; Writing—review & editing, A.A.; Visualization, S.T.N.N.; Supervision, A.A. All authors have read and agreed to the published version of the manuscript.

Funding

This research received no external funding.

Institutional Review Board Statement

Not applicable.

Informed Consent Statement

Not applicable.

Data Availability Statement

The data presented in this study are available in article.

Conflicts of Interest

The authors declare no conflict of interest.

References

  1. Almusawi, A.; Sengoz, B.; Topal, A. Evaluation of mechanical properties of different asphalt concrete types in relation with mixing and compaction temperatures. Constr. Build. Mater. 2021, 268, 121140. [Google Scholar] [CrossRef]
  2. Oner, J. Evaluation of mechanical properties for stone mastic asphalt containing textile waste. Matéria 2023, 28, e20230092. [Google Scholar] [CrossRef]
  3. Porto, M.; Caputo, P.; Loise, V.; Eskandarsefat, S.; Teltayev, B.; Oliviero Rossi, C. Bitumen and bitumen modification: A review on latest advances. Appl. Sci. 2019, 9, 742. [Google Scholar] [CrossRef]
  4. Kök, B.V.; İrhan, B.; Yılmaz, M.; Yalçın, E. Research on the rheological properties of bitumen modified with waste photopolymer. Constr. Build. Mater. 2022, 346, 128446. [Google Scholar] [CrossRef]
  5. Akbulut, H.; Gürer, C. Investigation of the performance of silicone rubber modified bitumen. Silicon 2022, 14, 9721–9731. [Google Scholar] [CrossRef]
  6. Azahar, W.N.A.W.; Kasim, N.; Ismail, N.N.; Jaya, R.P.; Hainin, M.R.; Masri, K.A.; Al-Saffar, Z.H. Behaviour of hot mix asphalt incorporating untreated and treated waste cooking oil. Int. J. Pavement Res. Technol. 2022, 15, 577–588. [Google Scholar] [CrossRef]
  7. Özel, F.; Deniz, M.T.; Yüce, M.İ. Evaluation of olive pomace and SBS modified bitumen to the performance characteristics. Case Stud. Constr. Mater. 2023, 19, e02432. [Google Scholar] [CrossRef]
  8. Yalcin, E.; Ince, R.; Yilmaz, M. Exploring activated carbon as an alternative to SBS in asphalt mixtures: Performance and fatigue analysis. Alex. Eng. J. 2025, 121, 283–294. [Google Scholar] [CrossRef]
  9. Ma, Y.; Wang, S.; Zhou, H.; Hu, W.; Polaczyk, P.; Huang, B. Potential alternative to styrene–butadiene–styrene for asphalt modification using recycled rubber–plastic blends. J. Mater. Civ. Eng. 2021, 33, 04021341. [Google Scholar] [CrossRef]
  10. Azahar, W.N.A.W.; Jaya, R.P.; Hainin, M.R.; Bujang, M.; Ngadi, N. Chemical modification of waste cooking oil to improve the physical and rheological properties of asphalt binder. Constr. Build. Mater. 2016, 126, 218–226. [Google Scholar] [CrossRef]
  11. Wang, C.; Xue, L.; Xie, W.; You, Z.; Yang, X. Laboratory investigation on chemical and rheological properties of bio-asphalt binders incorporating waste cooking oil. Constr. Build. Mater. 2018, 167, 348–358. [Google Scholar] [CrossRef]
  12. Zhang, D.; Chen, M.; Wu, S.; Liu, J.; Amirkhanian, S. Analysis of the relationships between waste cooking oil qualities and rejuvenated asphalt properties. Materials 2017, 10, 508. [Google Scholar] [CrossRef]
  13. Yuechao, Z.; Meizhu, C.; Shaopeng, W.; Qi, J. Rheological properties and microscopic characteristics of rejuvenated asphalt using different components from waste cooking oil. J. Clean. Prod. 2022, 370, 133556. [Google Scholar] [CrossRef]
  14. Zhao, M.; Dong, R. Reaction mechanism and rheological properties of waste cooking oil pre-desulfurized crumb tire rubber/SBS composite modified asphalt. Constr. Build. Mater. 2021, 274, 122083. [Google Scholar] [CrossRef]
  15. Ma, J.; Sun, G.; Sun, D.; Zhang, Y.; Falchetto, A.C.; Lu, T.; Yuan, Y. Rubber asphalt modified with waste cooking oil residue: Optimized preparation, rheological property, storage stability and aging characteristic. Constr. Build. Mater. 2020, 258, 120372. [Google Scholar] [CrossRef]
  16. Liu, Z.; Li, S.; Wang, Y. Characteristics of asphalt modified by waste engine oil/polyphosphoric acid: Conventional, high-temperature rheological, and mechanism properties. J. Clean. Prod. 2022, 330, 129844. [Google Scholar] [CrossRef]
  17. Kadhim, Y.N.; Hussain, W.A.M.; Abdulrasool, A.T. The effect of animal bone ash on the mechanical properties of asphalt concrete. Civ. Eng. J. 2021, 7, 1741–1752. [Google Scholar] [CrossRef]
  18. Garedew, G. Cement and animal bone powder on rheological characteristics of bitumen. Mag. Civ. Eng. 2021, 3, 10304. [Google Scholar]
  19. Öntaş, B.; Öner, J. The Effects of Animal Bone Ash on Asphalt Pavement Mixtures. Int. J. Eng. Appl. Sci. 2024, 16, 76–93. [Google Scholar] [CrossRef]
  20. Zhou, F.; Mogawer, W.; Li, H.; Andriescu, A.; Copeland, A. Evaluation of fatigue tests for characterizing asphalt binders. J. Mater. Civ. Eng. 2013, 25, 610–617. [Google Scholar] [CrossRef]
  21. Çavdar, E.; Kumandaş, A.; Şahan, N.; Kabadayı, E.; Oruç, Ş. Investigation of Rheological and Physical Properties of SBS and WCO Composite Modified Bitumen. Turk. J. Civ. Eng. 2024, 35, 1–18. [Google Scholar] [CrossRef]
  22. Münkel Jiménez, M.; Baldi, A.; Aguiar Moya, J.P.; Villegas Villegas, E.; Hernández Montero, N. Effect of polymers and waste cooking oil on asphalt performance range. Infraestruct. Vial 2021, 23, 71–81. [Google Scholar] [CrossRef]
  23. Zhang, Y.; Zhou, C.; Zou, P.; Hu, M.; Cao, P. A novel WCO-MDI reactive rejuvenation method for aged SBS modified asphalt toward sustainable asphalt pavements. J. Clean. Prod. 2024, 434, 140199. [Google Scholar] [CrossRef]
  24. Yu, H.; Ge, J.; Qian, G.; Zhang, C.; Dai, W.; Li, P. Evaluation on the rejuvenation and diffusion characteristics of waste cooking oil on aged SBS asphalt based on molecular dynamics method. J. Clean. Prod. 2023, 406, 136998. [Google Scholar] [CrossRef]
  25. Rizvi, H.R.; Khattak, M.J.; Gallo, A.A. Rheological and mechanistic characteristics of Bone Glue modified asphalt binders. Constr. Build. Mater. 2015, 88, 64–73. [Google Scholar] [CrossRef]
  26. ASTM D5-06; Standard Test Method for Penetration of Bituminous Materials. ASTM International: West Conshohocken, PA, USA, 2006.
  27. ASTM D113-17; Standard Test Method for Ductility of Asphalt Materials. ASTM International: West Conshohocken, PA, USA, 2017.
  28. ASTM D36-06; Standard Test Method for Softening Point of Bitumen (Ring-and-Ball Apparatus). ASTM International: West Conshohocken, PA, USA, 2006.
  29. ASTM D92-24; Standard Test Method for Flash and Fire Points by Cleveland Open Cup Tester. ASTM International: West Conshohocken, PA, USA, 2024.
  30. ASTM D70-18a; Standard Test Method for Density of Semi-Solid Asphalt Binder (Pycnometer Method). ASTM International: West Conshohocken, PA, USA, 2018.
  31. ASTM D4402-06; Standard Test Method for Viscosity Determination of Asphalt at Elevated Temperatures Using a Rotational Viscometer. ASTM International: West Conshohocken, PA, USA, 2006.
  32. Sengoz, B.; Isikyakar, G. Analysis of styrene-butadiene-styrene polymer modified bitumen using fluorescent microscopy and conventional test methods. J. Hazard. Mater. 2008, 150, 424–432. [Google Scholar] [CrossRef]
  33. ASTM D3677 − 10; Standard Test Methods for Rubber—Identification by Infrared Spectrophotometry. ASTM International: West Conshohocken, PA, USA, 2015.
  34. ASTM D4176 − 22; Standard Test Method for Free Water and Particulate Contamination in Distillate Fuels (Visual Inspection Procedures). ASTM International: West Conshohocken, PA, USA, 2022.
  35. ASTM D5775-95(2019); Standard Test Method for Rubber—Determination of Bound Styrene in Styrene Butadiene Rubber by Refractive Index. ASTM International: West Conshohocken, PA, USA, 2019.
  36. ASTM D792-20; Standard Test Methods for Density and Specific Gravity (Relative Density) of Plastics by Displacement. ASTM International: West Conshohocken, PA, USA, 2020.
  37. ASTM D5668-21; Standard Test Methods for Rubber From Synthetic Sources—Volatile Matter. ASTM International: West Conshohocken, PA, USA, 2021.
  38. ASTM D5667-21; Standard Test Method for Rubber From Synthetic Sources—Total and Water Soluble Ash. ASTM International: West Conshohocken, PA, USA, 2021.
  39. ASTM D5296-19; Standard Test Method for Molecular Weight Averages and Molecular Weight Distribution of Polystyrene by High Performance Size-Exclusion Chromatography. ASTM International: West Conshohocken, PA, USA, 2019.
  40. Adanikin, A.; Funsho, F.; Adewale, O. Volumetric properties of cow bone ash (CBA) filler-based asphaltic concrete using aggregates from different sources. J. Appl. Res. Ind. Eng. 2020, 7, 13–24. [Google Scholar]
  41. Martin, A.E.; Kaseer, F.; Arámbula-Mercado, E.; Bajaj, A.; Cucalon, L.G.; Yin, F.; Chowdhury, A.; Epps, J.; Glover, C.; Hajj, E.Y.; et al. Evaluating the Effects of Recycling Agents on Asphalt Mixtures with High Ras and Rap Binder Ratios; NCHRP Report 927; Transportation Research Board: Washington, DC, USA, 2020. [Google Scholar]
  42. ASTM D7175-23; Standard Test Method for Determining the Rheological Properties of Asphalt Binder Using a Dynamic Shear Rheometer. ASTM International: West Conshohocken, PA, USA, 2023.
  43. AASHTO T 391-20; Standard Method of Test for Estimating Fatigue Resistance of Asphalt Binders Using the Linear Amplitude Sweep. AASHTO: Washington, DC, USA, 2020.
  44. Almusawi, A.; Sengoz, B.; Kaya Ozdemir, D.; Topal, A. Economic and environmental impacts of utilizing lower production temperatures for different bitumen samples in a batch plant. Case Stud. Constr. Mater. 2022, 16, e00987. [Google Scholar] [CrossRef]
  45. Androjić, I.; Dolaček Alduk, Z. Analysis of energy consumption in the production of hot mix asphalt (batch mix plant). Can. J. Civ. Eng. 2016, 43, 1044–1051. [Google Scholar] [CrossRef]
Figure 1. G–R index unmodified bitumen.
Applsci 15 05552 g001
Figure 2. G–R index SBS modified samples (a) 4% SBS, (b) 5% SBS.
Applsci 15 05552 g002
Figure 3. G–R index animal bone ash modified samples (a) 4%, (b) 5%, (c) 6%.
Applsci 15 05552 g003aApplsci 15 05552 g003b
Figure 4. G–R index WCO modified samples (a) WCO 3%, (b) WCO 4%, (c) WCO 5%.
Applsci 15 05552 g004
Figure 5. Amplitude sweep results.
Applsci 15 05552 g005
Figure 6. Step load mode results.
Applsci 15 05552 g006
Figure 7. VECD damage curve from amplitude sweep for unmodified samples.
Applsci 15 05552 g007
Figure 8. VECD damage curve from amplitude sweep for modified samples (4% SBS).
Applsci 15 05552 g008
Figure 9. VECD damage curve from amplitude sweep for modified samples (5% SBS).
Applsci 15 05552 g009
Figure 10. VECD damage curve from amplitude sweep for modified samples (4% AB).
Applsci 15 05552 g010
Figure 11. VECD damage curve from amplitude sweep for modified samples (5% AB).
Applsci 15 05552 g011
Figure 12. VECD damage curve from amplitude sweep for modified samples (6% AB).
Applsci 15 05552 g012
Figure 13. VECD damage curve from amplitude sweep for modified samples (3% WCO).
Applsci 15 05552 g013
Figure 14. VECD damage curve from amplitude sweep for modified samples (4% WCO).
Applsci 15 05552 g014
Figure 15. VECD damage curve from amplitude sweep for modified samples (5% WCO).
Applsci 15 05552 g015
Table 1. Physical properties of neat bitumen.
SpecificationUnitTypical ValueTest Method
Penetration0.1 mm49ASTM D5 (Grade: 40–50) [26]
Ductilitycm>150(ASTM D 113) [27]
Softening Point, °C°C50ASTM D36 [28]
Flash Point, °C°C245(ASTM D 92) (min. 232 °C) [29]
Densityg/cm31.02ASTM D70 [30]
Rotational viscosity Pa·s0.488ASTM D4402 [31]
Thin Film Oven Test
Retained penetration%80(ASTM D 5) (min. ≥55%)
Penetration Index (PI)-−1.25-
Table 2. SBS NovaPrene P technical specifications.
SpecificationUnitTypical ValueTest Method
Molecular Structure-SB copolymerASTM D3677/NMR (internal) [33]
Physical appearance-Fine PowderASTM D4176 (Visual) [34]
Styrene content%28ASTM D5775 (FTIR) [35]
Butadiene content%72ASTM D5775 (FTIR) [35]
Densityg/cm30.94ASTM D 792 [36]
Volatile substance (at 25 °C)%0.21ASTM D 5668 [37]
Ash content%5.0ASTM D 5667 [38]
Molecular weightDalton × 1000250–400ASTM D 5296 [39]
Table 3. Storage modulus [kPa] at 15 °C.
Bitumen TypeUnmodified4% SBS5% SBS4% AB5% AB6% AB3% WCO4% WCO5% WCO
Angular Frequency [rad/s]Storage Modulus G′ [Pa]
1005.71 × 1038.76 × 1039.89 × 1036.15 × 1039.71 × 1034.82 × 1034.82 × 1032.96 × 1034.78 × 103
68.15.17 × 1038.18 × 1038.16 × 1035.50 × 1037.93 × 1033.79 × 1033.79 × 1032.29 × 1033.80 × 103
46.44.72 × 1037.84 × 1036.66 × 1035.01 × 1036.38 × 1032.95 × 1032.95 × 1031.77 × 1032.98 × 103
31.64.32 × 1038.91 × 1035.36 × 1034.54 × 1035.10 × 1032.28 × 1032.28 × 1031.35 × 1032.23 × 103
21.53.92 × 1037.50 × 1034.30 × 1033.90 × 1034.06 × 1031.73 × 1031.73 × 1031.02 × 1031.79 × 103
14.73.55 × 1036.26 × 1033.43 × 1033.13 × 1033.18 × 1031.31 × 1031.31 × 1037.62 × 1051.37 × 103
103.18 × 1035.24 × 1032.70 × 1032.45 × 1032.48 × 1039.93 × 1059.93 × 1055.68 × 1051.03 × 103
6.812.84 × 1034.40 × 1032.13 × 1031.90 × 1031.91 × 1037.41 × 1027.42 × 1024.42 × 1027.01 × 102
4.642.48 × 1033.55 × 1031.69 × 1031.45 × 1031.47 × 1035.51 × 1025.51 × 1023.10 × 1025.86 × 102
3.162.16 × 1032.86 × 1031.29 × 1031.11 × 1031.12 × 1034.06 × 1024.06 × 1022.27 × 1024.38 × 102
2.151.85 × 1032.30 × 1039.89 × 1028.49 × 1028.54 × 1023.00 × 1023.00 × 1021.66 × 1023.25 × 102
1.471.52 × 1031.86 × 1037.86 × 1026.33 × 1026.42 × 1022.18 × 1022.18 × 1021.19 × 1022.40 × 102
11.19 × 1031.50 × 1036.24 × 1024.73 × 1024.83 × 1021.58 × 1021.58 × 1028.52 × 1041.77 × 102
0.6819.13 × 1021.20 × 1034.96 × 1023.50 × 1023.60 × 1021.15 × 1021.15 × 1026.24 × 1041.30 × 102
0.4646.87 × 1029.86 × 1023.94 × 1022.60 × 1022.68 × 1029.07 × 1049.07 × 1044.46 × 1049.44 × 104
0.3165.24 × 1028.01 × 1023.13 × 1021.89 × 1021.95 × 1027.72 × 1047.72 × 1043.19 × 1046.95 × 104
0.2153.90 × 1026.45 × 1022.49 × 1021.39 × 1021.43 × 1028.67 × 1048.67 × 1042.23 × 1045.04 × 104
0.1472.90 × 1025.16 × 1021.98 × 1021.01 × 102 6.96 × 1046.69 × 1041.58 × 1043.69 × 104
0.12.14 × 1023.98 × 1021.57 × 1027.30 × 104 4.97 × 1044.97 × 1041.10 × 1042.65 × 104
Table 4. Storage modulus [kPa] at 25 °C.
Bitumen TypeUnmodified4% SBS5% SBS4% AB5% AB6% AB3% WCO4% WCO5% WCO
Angular Frequency [rad/s]Storage Modulus G′ [Pa]
1003.13 × 1033.80 × 1033.31 × 1032.66 × 1032.80 × 1031.78 × 1031.78 × 1038.19 × 1029.28 × 102
68.12.64 × 1033.36 × 1032.62 × 1032.15 × 1032.18 × 1031.35 × 1031.35 × 1036.10 × 1026.89 × 102
46.42.21 × 1033.04 × 1032.05 × 1031.71 × 1031.68 × 1031.01 × 1031.01 × 1034.50 × 1025.08 × 102
31.61.82 × 1033.02 × 1031.60 × 1031.33 × 1031.28 × 1037.56 × 1027.56 × 1023.33 × 1023.71 × 102
21.51.48 × 1032.37 × 1031.24 × 1031.01 × 1039.75 × 1025.60 × 1025.60 × 1022.44 × 1022.70 × 102
14.71.18 × 1031.85 × 1039.54 × 1027.60 × 1027.36 × 1024.13 × 1024.13 × 1021.77 × 1021.95 × 102
109.17 × 1021.43 × 1037.30 × 1025.67 × 1025.52 × 1023.01 × 1023.01 × 1021.28 × 1021.39 × 102
6.816.93 × 1021.09 × 1035.54 × 1024.22 × 1024.11 × 1022.20 × 1022.20 × 1029.24 × 1019.94 × 101
4.645.15 × 1028.34 × 1024.18 × 1023.11 × 1023.04 × 1021.59 × 1021.59 × 1026.61 × 1017.06 × 101
3.163.81 × 1026.33 × 1023.14 × 1022.28 × 1022.23 × 1021.14 × 1021.14 × 1024.69 × 1014.98 × 101
2.152.77 × 1024.77 × 1022.34 × 1021.67 × 1021.64 × 1028.16 × 1018.16 × 1013.31 × 1013.47 × 101
1.472.03 × 1023.57 × 1021.75 × 1021.21 × 1021.19 × 1025.78 × 1015.78 × 1012.33 × 1012.40 × 101
11.46 × 1022.67 × 1021.29 × 1028.66 × 1018.63 × 1014.07 × 1014.07 × 1011.62 × 1011.63 × 101
0.6811.05 × 1021.97 × 1029.57 × 1016.24 × 1016.18 × 1012.82 × 1012.83 × 1011.12 × 1011.09 × 101
0.4647.48 × 1011.46 × 1027.01 × 1014.46 × 1014.41 × 1011.97 × 1011.97 × 1017.65 × 1037.29 × 103
0.3165.23 × 1011.07 × 1025.16 × 1013.11 × 1013.11 × 1011.35 × 1011.35 × 1015.01 × 1034.77 × 103
0.2153.68 × 1017.80 × 1013.78 × 1012.16 × 1012.18 × 1019.20 × 1039.20 × 1033.52 × 1033.15 × 103
0.1472.57 × 1015.67 × 1012.74 × 1011.50 × 1011.50 × 1016.18 × 1036.20 × 1032.40 × 1031.99 × 103
0.11.77 × 1014.11 × 1012.00 × 1011.03 × 101 4.15 × 1034.15 × 1031.64 × 1031.30 × 103
Table 5. Loss modulus [kPa] at 15 °C.
Bitumen TypeUnmodified4% SBS5% SBS4% AB5% AB6% AB3% WCO4% WCO5% WCO
Angular Frequency [rad/s]Loss Modulus G″ [Pa]
1009.12 × 1031.31 × 1071.20 × 1078.51 × 1031.32 × 1076.97 × 1036.97 × 1034.60 × 1037.61 × 103
68.17.93 × 1031.18 × 1079.74 × 1037.54 × 1031.06 × 1075.58 × 1035.58 × 1033.64 × 1036.07 × 103
46.46.90 × 1031.08 × 1077.95 × 1036.64 × 1038.53 × 1034.45 × 1034.46 × 1032.84 × 1034.81 × 103
31.66.05 × 1031.10 × 1076.47 × 1035.88 × 1036.88 × 1033.54 × 1033.54 × 1032.27 × 1033.82 × 103
21.55.33 × 1039.34 × 1035.27 × 1035.13 × 1035.53 × 1032.80 × 1032.80 × 1031.78 × 1033.02 × 103
14.74.72 × 1037.82 × 1034.29 × 1034.25 × 1034.44 × 1032.21 × 1032.22 × 1031.38 × 1032.38 × 103
104.17 × 1036.58 × 1033.49 × 1033.44 × 1033.55 × 1031.74 × 1031.74 × 1031.08 × 1031.86 × 103
6.813.71 × 1035.59 × 1032.82 × 1032.75 × 1032.84 × 1031.36 × 1031.35 × 1038.36 × 1021.45 × 103
4.643.33 × 1034.61 × 1032.29 × 1032.23 × 1032.25 × 1031.06 × 1031.05 × 1036.40 × 1021.13 × 103
3.162.96 × 1033.78 × 1031.81 × 1031.75 × 1031.79 × 1038.19 × 1028.19 × 1024.91 × 1028.79 × 102
2.152.62 × 1033.13 × 1031.46 × 1031.40 × 1031.41 × 1036.27 × 1026.27 × 1023.75 × 1026.83 × 102
1.472.25 × 1032.61 × 1031.19 × 1031.10 × 1031.11 × 1034.79 × 1024.79 × 1022.84 × 1025.28 × 102
11.87 × 1032.16 × 1039.61 × 1028.58 × 1028.71 × 1023.67 × 1023.67 × 1022.14 × 1024.05 × 102
0.6811.51 × 1031.80 × 1037.79 × 1026.69 × 1026.80 × 1022.78 × 1022.80 × 1021.62 × 1023.14 × 102
0.4641.21 × 1031.51 × 1036.31 × 1025.17 × 1025.23 × 1022.26 × 1022.26 × 1021.21 × 1022.40 × 102
0.3169.49 × 1021.26 × 1035.11 × 1023.99 × 1024.03 × 1022.00 × 1022.00 × 1029.04 × 1011.82 × 102
0.2157.49 × 1021.05 × 1034.14 × 1023.07 × 1023.08 × 1022.18 × 1022.18 × 1026.78 × 1011.40 × 102
0.1475.87 × 1028.57 × 1023.35 × 1022.35 × 102 1.73 × 1021.74 × 1025.02 × 1011.06 × 102
0.14.55 × 1026.91 × 1022.72 × 1021.80 × 102 1.36 × 1021.36 × 1023.70 × 1018.09 × 101
Table 6. Loss modulus [kPa] at 25 °C.
Bitumen TypeUnmodified4% SBS5% SBS4% AB5% AB6% AB3% WCO4% WCO5% WCO
Angular Frequency [rad/s]Loss Modulus G″ [Pa]
1004.83 × 1035.73 × 1034.37 × 1033.84 × 1034.14 × 1033.00 × 1032.99 × 1031.53 × 1031.79 × 103
68.14.04 × 1035.02 × 1033.52 × 1033.17 × 1033.30 × 1032.34 × 1032.35 × 1031.18 × 1031.36 × 103
46.43.36 × 1034.43 × 1032.84 × 1032.61 × 1032.61 × 1031.84 × 1031.84 × 1039.15 × 1021.01 × 103
31.62.80 × 1034.10 × 1032.28 × 1032.11 × 1032.07 × 1031.43 × 1031.42 × 1037.02 × 1028.08 × 102
21.52.33 × 1033.31 × 1031.82 × 1031.67 × 1031.63 × 1031.10 × 1031.10 × 1035.37 × 1026.13 × 102
14.71.92 × 1032.65 × 1031.45 × 1031.31 × 1031.28 × 1038.48 × 1028.48 × 1024.08 × 1024.62 × 102
101.56 × 1032.12 × 1031.15 × 1031.02 × 1039.98 × 1026.49 × 1026.49 × 1023.09 × 1023.49 × 102
6.811.24 × 1031.69 × 1039.07 × 1027.95 × 1027.75 × 1024.95 × 1024.95 × 1022.32 × 1022.61 × 102
4.649.72 × 1021.33 × 1037.10 × 1026.15 × 1025.98 × 1023.75 × 1023.76 × 1021.74 × 1021.95 × 102
3.167.55 × 1021.05 × 1035.56 × 1024.72 × 1024.60 × 1022.84 × 1022.84 × 1021.30 × 1021.45 × 102
2.155.80 × 1028.25 × 1024.31 × 1023.61 × 1023.52 × 1022.13 × 1022.13 × 1029.68 × 1011.07 × 102
1.474.45 × 1026.44 × 1023.34 × 1022.74 × 1022.69 × 1021.59 × 1021.59 × 1027.19 × 1017.89 × 101
13.39 × 1025.01 × 1022.57 × 1022.08 × 1022.04 × 1021.19 × 1021.19 × 1025.31 × 1015.75 × 101
0.6812.56 × 1023.87 × 1021.96 × 1021.57 × 1021.54 × 1028.85 × 1018.85 × 1013.88 × 1014.15 × 101
0.4641.94 × 1022.97 × 1021.50 × 1021.18 × 1021.16 × 1026.54 × 1016.54 × 1012.84 × 1013.00 × 101
0.3161.43 × 1022.28 × 1021.15 × 1028.81 × 1018.66 × 1014.81 × 1014.81 × 1012.06 × 1012.15 × 101
0.2151.07 × 1021.74 × 1028.74 × 1016.58 × 1016.45 × 1013.52 × 1013.52 × 1011.12 × 1011.54 × 101
0.1477.98 × 1011.32 × 1026.61 × 1014.95 × 1014.78 × 1012.56 × 1012.61 × 1011.07 × 1011.09 × 101
0.15.90 × 1011.00 × 1025.05 × 1013.56 × 101 1.86 × 1011.89 × 1017.66 × 1037.72 × 103
Table 7. Complex viscosity [Pa·s] at 15 °C.
Bitumen TypeUnmodified4% SBS5% SBS4% AB5% AB6% AB3% WCO4% WCO5% WCO
Angular Frequency [rad/s]Complex Viscosity [Pa·s]
1001.08 × 1051.58 × 1051.55 × 1051.05 × 1051.64 × 1058.48 × 1048.48 × 1045.47 × 1048.98 × 104
68.11.39 × 1052.10 × 1051.86 × 1051.37 × 1051.95 × 1059.90 × 1049.90 × 1046.32 × 1041.05 × 105
46.41.80 × 1052.88 × 1052.23 × 1051.79 × 1052.29 × 1051.15 × 1051.15 × 1057.28 × 1041.22 × 105
31.62.35 × 1054.49 × 1052.66 × 1052.35 × 1052.71 × 1051.33 × 1051.33 × 1058.35 × 1041.42 × 105
21.53.07 × 1055.56 × 1053.16 × 1052.99 × 1053.18 × 1051.53 × 1051.53 × 1059.51 × 1041.63 × 105
14.74.02 × 1056.82 × 1053.74 × 1053.60 × 1053.72 × 1051.75 × 1051.75 × 1051.08 × 1051.88 × 105
105.25 × 1058.41 × 1054.41 × 1054.23 × 1054.33 × 1052.00 × 1052.00 × 1051.21 × 1052.13 × 105
6.816.85 × 1051.04 × 1065.19 × 1054.91 × 1055.02 × 1052.27 × 1052.27 × 1051.37 × 1052.43 × 105
4.648.94 × 1051.25 × 1066.10 × 1055.73 × 1055.79 × 1052.57 × 1052.57 × 1051.53 × 1052.75 × 105
3.161.16 × 1061.50 × 1067.03 × 1056.57 × 1056.68 × 1052.89 × 1052.89 × 1051.71 × 1053.07 × 105
2.151.49 × 1061.80 × 1068.20 × 1057.59 × 1057.67 × 1053.23 × 1053.23 × 1051.91 × 1053.51 × 105
1.471.85 × 1062.18 × 1069.68 × 1058.64 × 1058.76 × 1053.59 × 1053.59 × 1052.09 × 1053.95 × 105
12.21 × 1062.63 × 1061.14 × 1069.79 × 1059.97 × 1053.99 × 1053.99 × 1052.31 × 1054.45 × 105
0.6812.59 × 1063.18 × 1061.35 × 1061.11 × 1061.13 × 1064.42 × 1054.42 × 1052.55 × 1054.98 × 105
0.4642.99 × 1063.89 × 1061.59 × 1061.25 × 1061.27 × 1065.24 × 1055.24 × 1052.79 × 1055.55 × 105
0.3163.43 × 1064.73 × 1061.88 × 1061.40 × 1061.42 × 1066.78 × 1056.72 × 1053.03 × 1056.21 × 105
0.2153.92 × 1065.72 × 1062.21 × 1061.57 × 1061.58 × 1061.09 × 1061.09 × 1063.31 × 1056.92 × 105
0.1474.46 × 1066.82 × 1062.61 × 1061.74 × 106 1.27 × 1061.27 × 1063.61 × 1057.70 × 105
0.15.03 × 1067.97 × 1063.08 × 1061.94 × 106 1.45 × 1061.45 × 1063.86 × 1058.51 × 105
Table 8. Complex viscosity [Pa·s] at 25 °C.
Bitumen TypeUnmodified4% SBS5% SBS4% AB5% AB6% AB3% WCO4% WCO5% WCO
Angular Frequency [rad/s]Complex Viscosity [Pa·s]
1005.76 × 1046.88 × 1045.48 × 1044.67 × 1045.00 × 1043.49 × 1043.49 × 1041.74 × 1042.02 × 104
68.17.08 × 1048.87 × 1046.44 × 1045.62 × 1045.80 × 1043.98 × 1043.98 × 1041.96 × 1042.26 × 104
46.48.67 × 1041.16 × 1057.55 × 1046.72 × 1046.69 × 1044.52 × 1044.52 × 1042.20 × 1042.53 × 104
31.61.05 × 1051.61 × 1058.80 × 1047.87 × 1047.69 × 1045.10 × 1045.10 × 1042.46 × 1042.81 × 104
21.51.28 × 1051.89 × 1051.02 × 1059.06 × 1048.81 × 1045.74 × 1045.74 × 1042.74 × 1043.11 × 104
14.71.54 × 1052.20 × 1051.18 × 1051.03 × 1051.00 × 1056.42 × 1046.42 × 1043.00 × 1043.42 × 104
101.81 × 1052.56 × 1051.14 × 1051.17 × 1051.14 × 1057.16 × 1047.16 × 1043.34 × 1043.75 × 104
6.812.09 × 1052.95 × 1051.56 × 1051.32 × 1051.29 × 1057.95 × 1047.95 × 1043.67 × 1044.10 × 104
4.642.37 × 1053.39 × 1051.78 × 1051.48 × 1051.45 × 1058.79 × 1048.79 × 1044.01 × 1044.46 × 104
3.162.67 × 1053.88 × 1052.02 × 1051.66 × 1051.62 × 1059.67 × 1049.67 × 1044.37 × 1044.85 × 104
2.152.98 × 1054.42 × 1052.28 × 1051.85 × 1051.80 × 1051.06 × 1051.06 × 1054.75 × 1045.24 × 104
1.473.33 × 1055.02 × 1052.51 × 1052.04 × 1052.00 × 1051.15 × 1051.15 × 1055.15 × 1045.62 × 104
13.69 × 1055.68 × 1052.87 × 1052.25 × 1052.22 × 1051.26 × 1051.26 × 1055.55 × 1045.97 × 104
0.6814.07 × 1056.37 × 1053.21 × 1052.48 × 1052.43 × 1051.36 × 1051.36 × 1055.97 × 1046.29 × 104
0.4644.41 × 1057.14 × 1053.57 × 1052.72 × 1052.66 × 1051.47 × 1051.47 × 1056.33 × 1046.64 × 104
0.3164.82 × 1057.96 × 1053.99 × 1052.95 × 1052.91 × 1051.59 × 1051.58 × 1056.77 × 1046.97 × 104
0.2155.26 × 1058.85 × 1054.42 × 1053.22 × 1053.16 × 1051.69 × 1051.69 × 1057.13 × 1047.29 × 104
0.1475.71 × 1059.80 × 1054.88 × 1053.46 × 1053.41 × 1051.80 × 1051.80 × 1057.46 × 1047.54 × 104
0.16.16 × 1051.08 × 1035.44 × 1053.71 × 105 1.91 × 1051.91 × 1057.83 × 1047.82 × 104
Table 9. Loss factor tan (δ) at 15 °C.
Bitumen TypeUnmodified4% SBS5% SBS4% AB5% AB6% AB3% WCO4% WCO5% WCO
Angular Frequency [rad/s]Loss Factor tan (δ)
1001.60 × 1001.50 × 1001.21 × 1001.38 × 1001.36 × 1001.45 × 1001.45 × 1001.55 × 1001.59 × 100
68.11.53 × 1001.44 × 1001.19 × 1001.37 × 1001.34 × 1001.47 × 1001.47 × 1001.59 × 1001.60 × 100
46.41.46 × 1001.38 × 1001.19 × 1001.32 × 1001.34 × 1001.51 × 1001.51 × 1001.62 × 1001.62 × 100
31.61.40 × 1001.24 × 1001.21 × 1001.30 × 1001.35 × 1001.56 × 1001.56 × 1001.68 × 1001.66 × 100
21.51.36 × 1001.25 × 1001.23 × 1001.31 × 1001.36 × 1001.62 × 1001.62 × 1001.76 × 1001.71 × 100
14.71.33 × 1001.25 × 1001.25 × 1001.36 × 1001.40 × 1001.69 × 1001.68 × 1001.82 × 1001.80 × 100
101.31 × 1001.25 × 1001.29 × 1001.41 × 1001.43 × 1001.75 × 1001.75 × 1001.91 × 1001.80 × 100
6.811.31 × 1001.27 × 1001.32 × 1001.45 × 1001.48 × 1001.83 × 1001.83 × 1001.97 × 1001.85 × 100
4.641.34 × 1001.30 × 1001.39 × 1001.54 × 1001.53 × 1002.00 × 1001.92 × 1002.06 × 1001.91 × 100
3.161.37 × 1001.32 × 1001.41 × 1001.58 × 1001.59 × 1002.08 × 1002.02 × 1002.16 × 1002.01 × 100
2.151.41 × 1001.36 × 1001.48 × 1001.65 × 1001.66 × 1002.11 × 1002.09 × 1002.26 × 1002.10 × 100
1.471.47 × 1001.40 × 1001.54 × 1001.73 × 1001.73 × 1002.16 × 1002.20 × 1002.38 × 1002.20 × 100
11.57 × 1001.44 × 1001.61 × 1001.81 × 1001.80 × 1002.32 × 1002.32 × 1002.52 × 1002.30 × 100
0.6811.65 × 1001.50 × 1001.67 × 1001.91 × 1001.89 × 1002.41 × 1002.41 × 1002.59 × 1002.40 × 100
0.4641.75 × 1001.53 × 1001.80 × 1001.99 × 1001.95 × 1002.49 × 1002.49 × 1002.72 × 1002.51 × 100
0.3161.81 × 1001.58 × 1001.87 × 1002.11 × 1002.06 × 1002.56 × 1002.56 × 1002.83 × 1002.64 × 100
0.2151.92 × 1001.63 × 1001.95 × 1002.20 × 1002.16 × 1002.52 × 1002.52 × 1003.04 × 1002.79 × 100
0.1472.03 × 1001.66 × 1002.07 × 1002.33 × 100 2.61 × 1002.61 × 1003.20 × 1002.90 × 100
0.12.13 × 1001.74 × 100 2.46 × 100 2.73 × 1002.73 × 1003.36 × 1003.05 × 100
Table 10. Loss factor tan (δ) at 25 °C.
Bitumen TypeUnmodified4% SBS5% SBS4% AB5% AB6% AB3% WCO4% WCO5% WCO
Angular Frequency [rad/s]Loss Factor tan (δ)
1001.54 × 1001.51 × 1001.32 × 1001.45 × 1001.47 × 1001.69 × 1001.69 × 1001.87 × 1001.93 × 100
68.11.53 × 1001.49 × 1001.35 × 1001.47 × 1001.51 × 1001.75 × 1001.75 × 1001.95 × 1002.00 × 100
46.41.53 × 1001.46 × 1001.38 × 1001.53 × 1001.56 × 1001.81 × 1001.81 × 1002.03 × 1002.08 × 100
31.61.54 × 1001.36 × 1001.42 × 1001.59 × 1001.61 × 1001.89 × 1001.89 × 1002.11 × 1002.19 × 100
21.51.58 × 1001.40 × 1001.47 × 1001.66 × 1001.67 × 1001.97 × 1001.97 × 1002.21 × 1002.30 × 100
14.71.63 × 1001.44 × 1001.52 × 1001.73 × 1001.74 × 1002.05 × 1002.05 × 1002.41 × 1002.46 × 100
101.70 × 1001.49 × 1001.57 × 1001.80 × 1001.81 × 1002.15 × 1002.15 × 1002.51 × 1002.50 × 100
6.811.79 × 1001.55 × 1001.64 × 1001.88 × 1001.88 × 1002.25 × 1002.25 × 1002.63 × 1002.62 × 100
4.641.89 × 1001.60 × 1001.70 × 1001.98 × 1001.97 × 1002.37 × 1002.37 × 1002.77 × 1002.76 × 100
3.161.98 × 1001.66 × 1001.77 × 1002.07 × 1002.06 × 1002.49 × 1002.49 × 1002.92 × 1002.91 × 100
2.152.10 × 1001.73 × 1001.84 × 1002.17 × 1002.15 × 1002.61 × 1002.61 × 1003.09 × 1003.10 × 100
1.472.20 × 1001.80 × 1001.91 × 1002.27 × 1002.25 × 1002.76 × 1002.76 × 1003.27 × 1003.29 × 100
12.32 × 1001.88 × 1001.90 × 1002.40 × 1002.37 × 1002.92 × 1002.92 × 1003.48 × 1003.53 × 100
0.6812.44 × 1001.97 × 1002.05 × 1002.52 × 1002.49 × 1003.13 × 1003.13 × 1003.71 × 1003.80 × 100
0.4642.59 × 1002.04 × 1002.14 × 1002.65 × 1002.62 × 1003.31 × 1003.31 × 1003.96 × 1004.11 × 100
0.3162.74 × 1002.14 × 1002.23 × 1002.84 × 1002.78 × 1003.55 × 1003.55 × 1004.25 × 1004.51 × 100
0.2152.91 × 1002.23 × 1002.31 × 1003.05 × 1002.97 × 1003.82 × 1003.82 × 1004.45 × 1004.88 × 100
0.1473.10 × 1002.33 × 1002.42 × 1003.23 × 1003.18 × 1004.14 × 1004.14 × 1004.45 × 1005.46 × 100
0.13.33 × 1002.44 × 1002.52 × 1003.47 × 100 4.48 × 1004.48 × 1004.66 × 1005.95 × 100
Disclaimer/Publisher’s Note: The statements, opinions and data contained in all publications are solely those of the individual author(s) and contributor(s) and not of MDPI and/or the editor(s). MDPI and/or the editor(s) disclaim responsibility for any injury to people or property resulting from any ideas, methods, instructions or products referred to in the content.

