
A New Data Processing Approach for the SHPB Test Based on PSO-TWER


Abstract
1. Introduction
2. Related Work
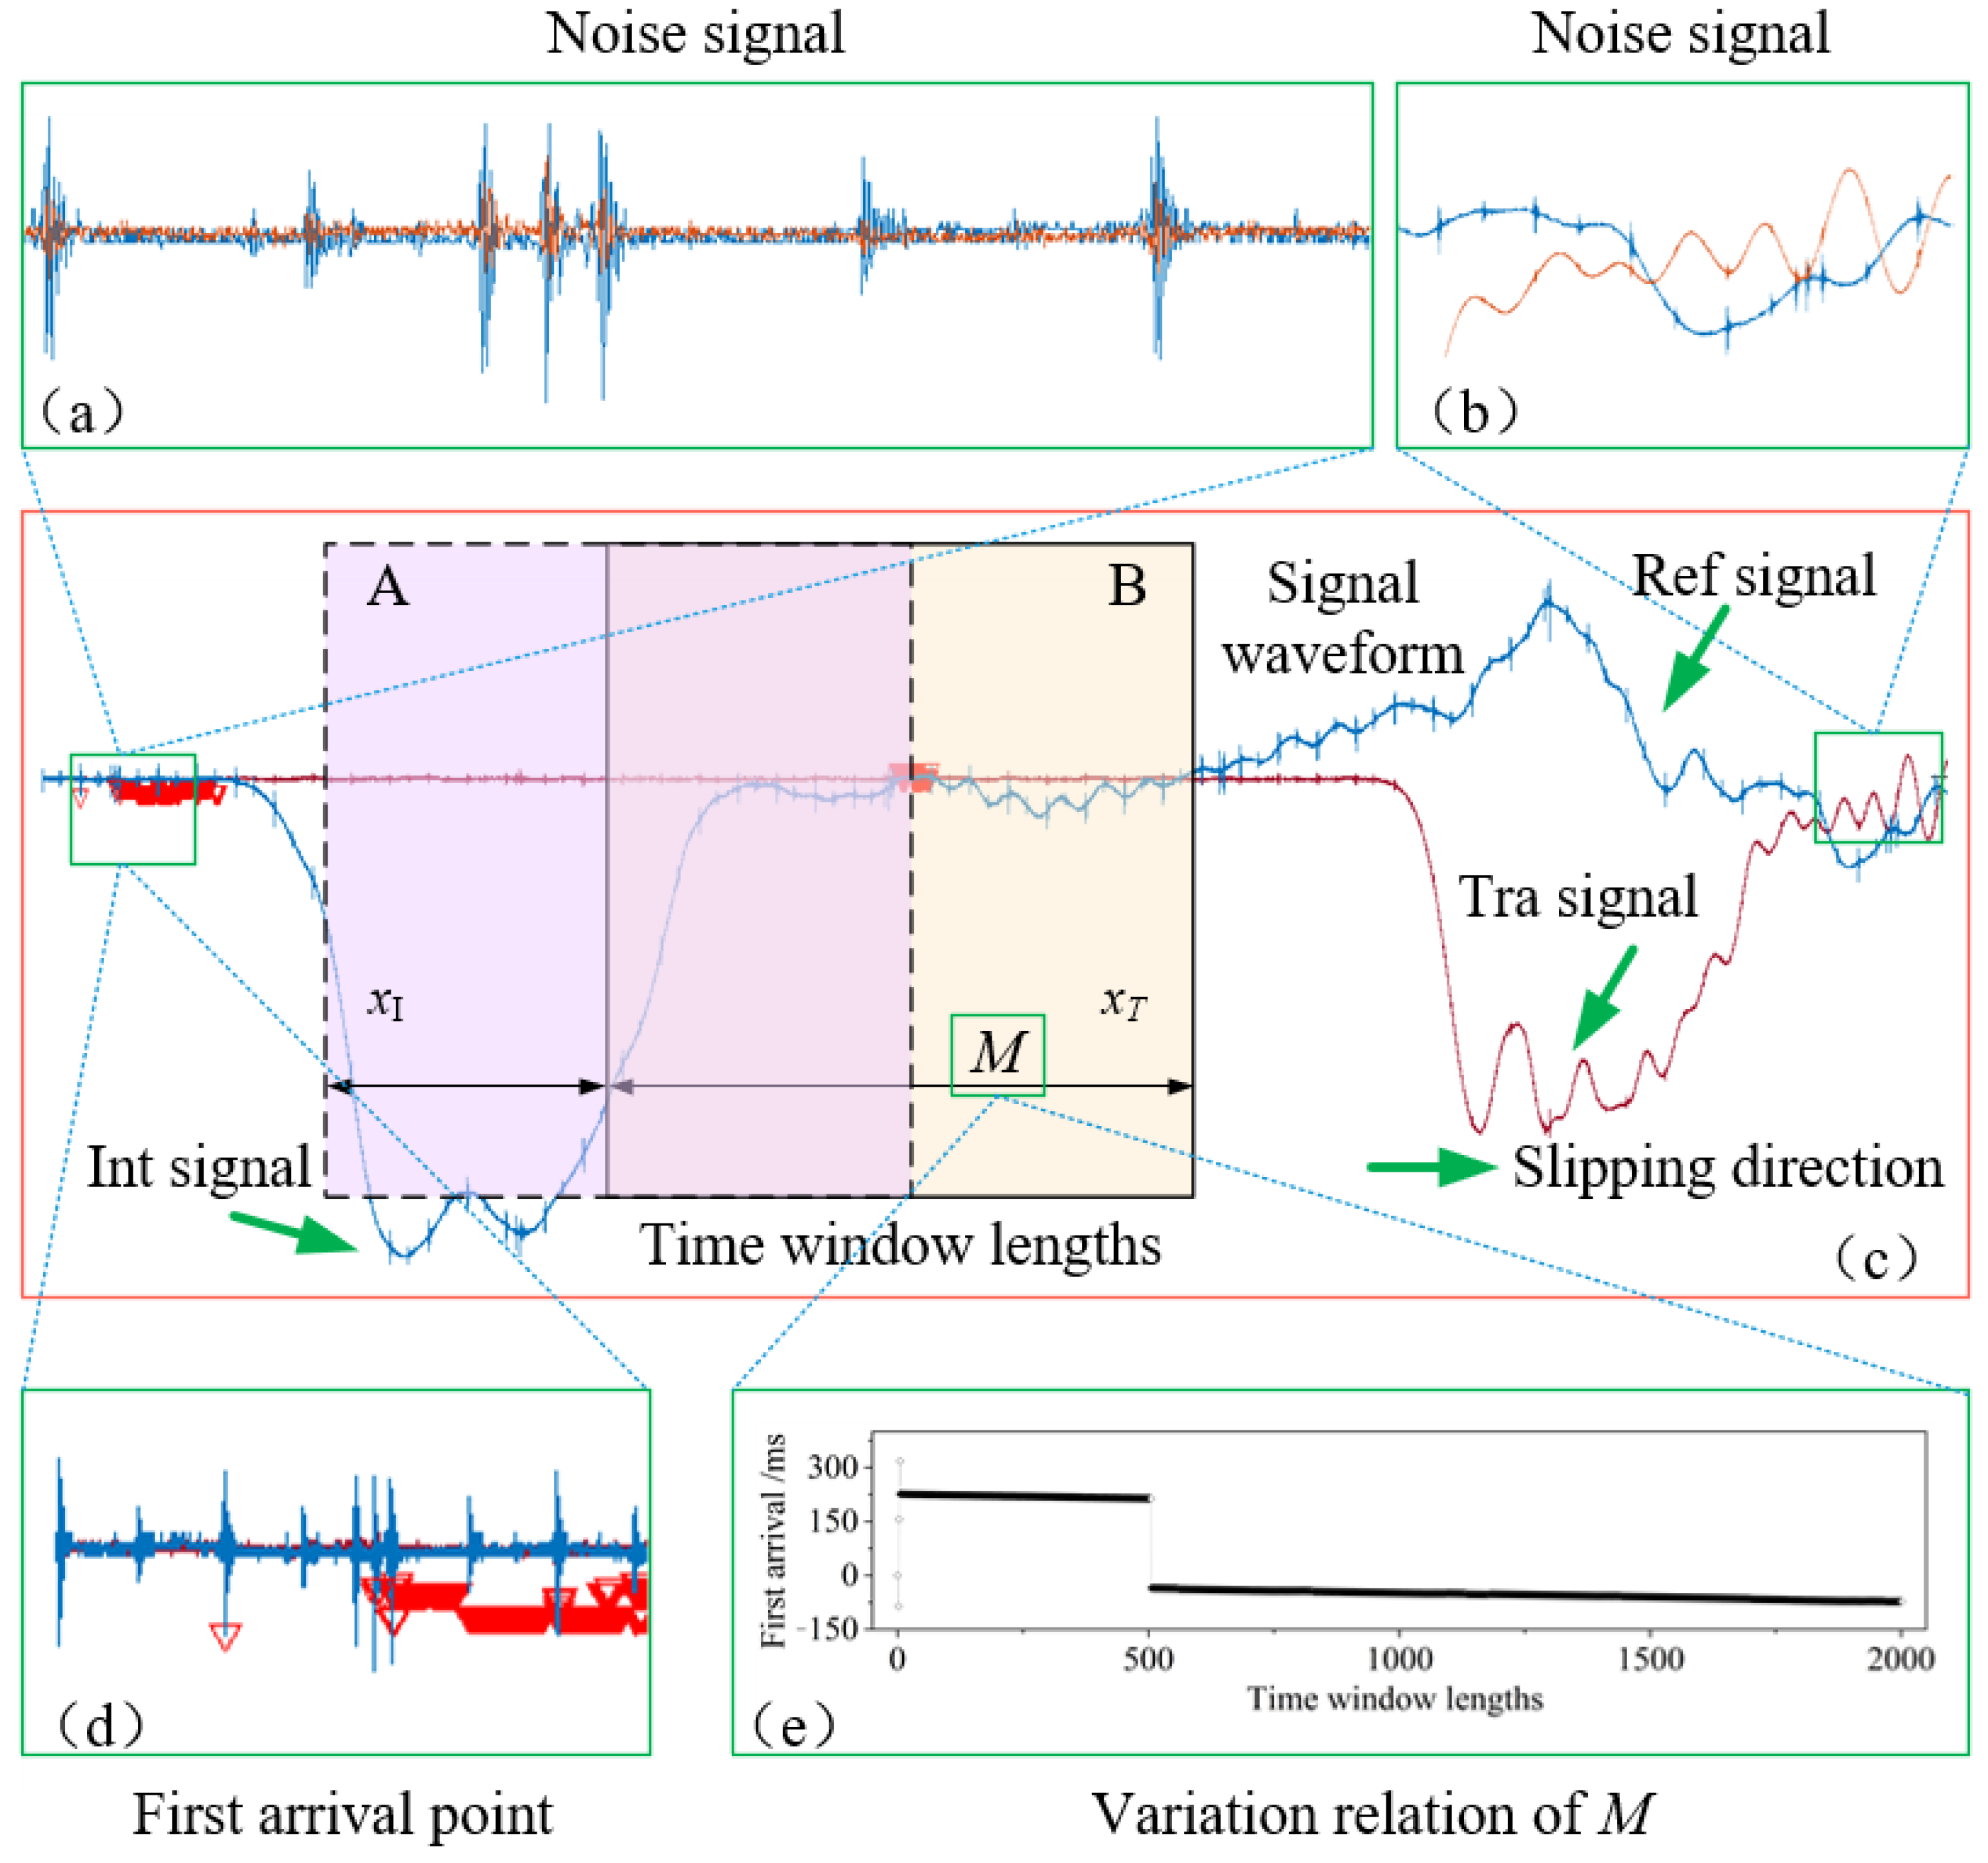
2.1. Time-Window Energy Ratio Method
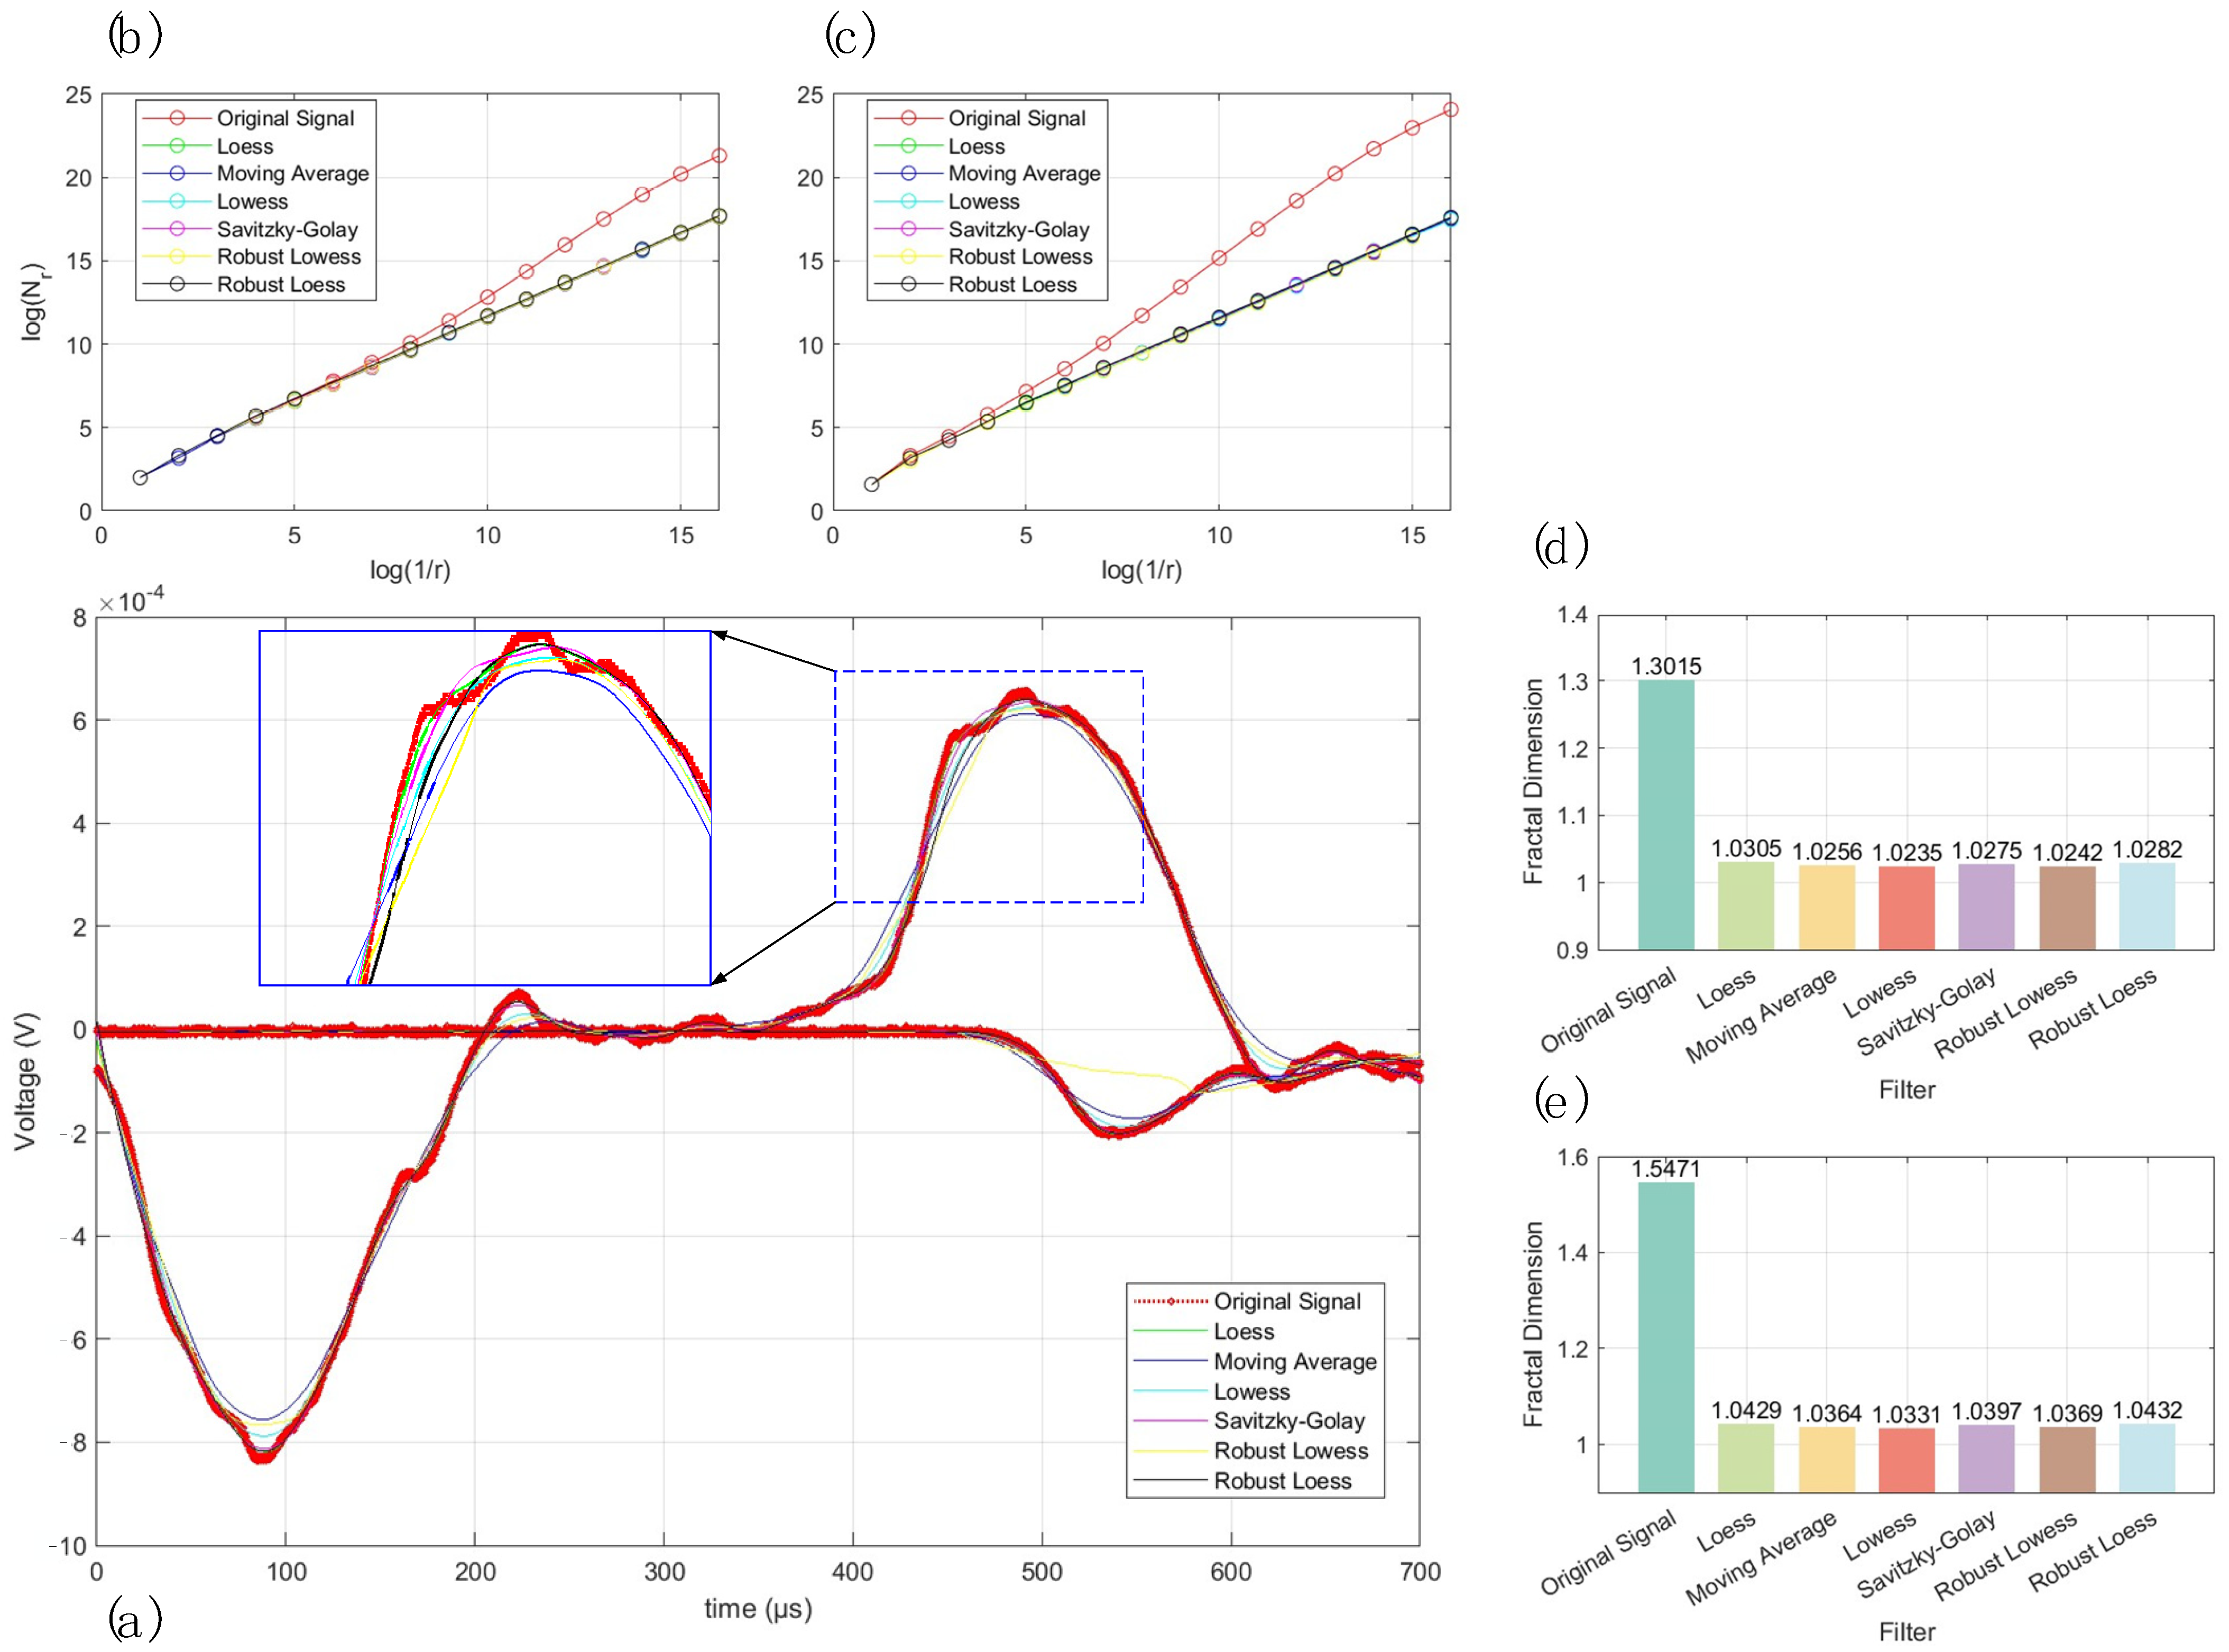
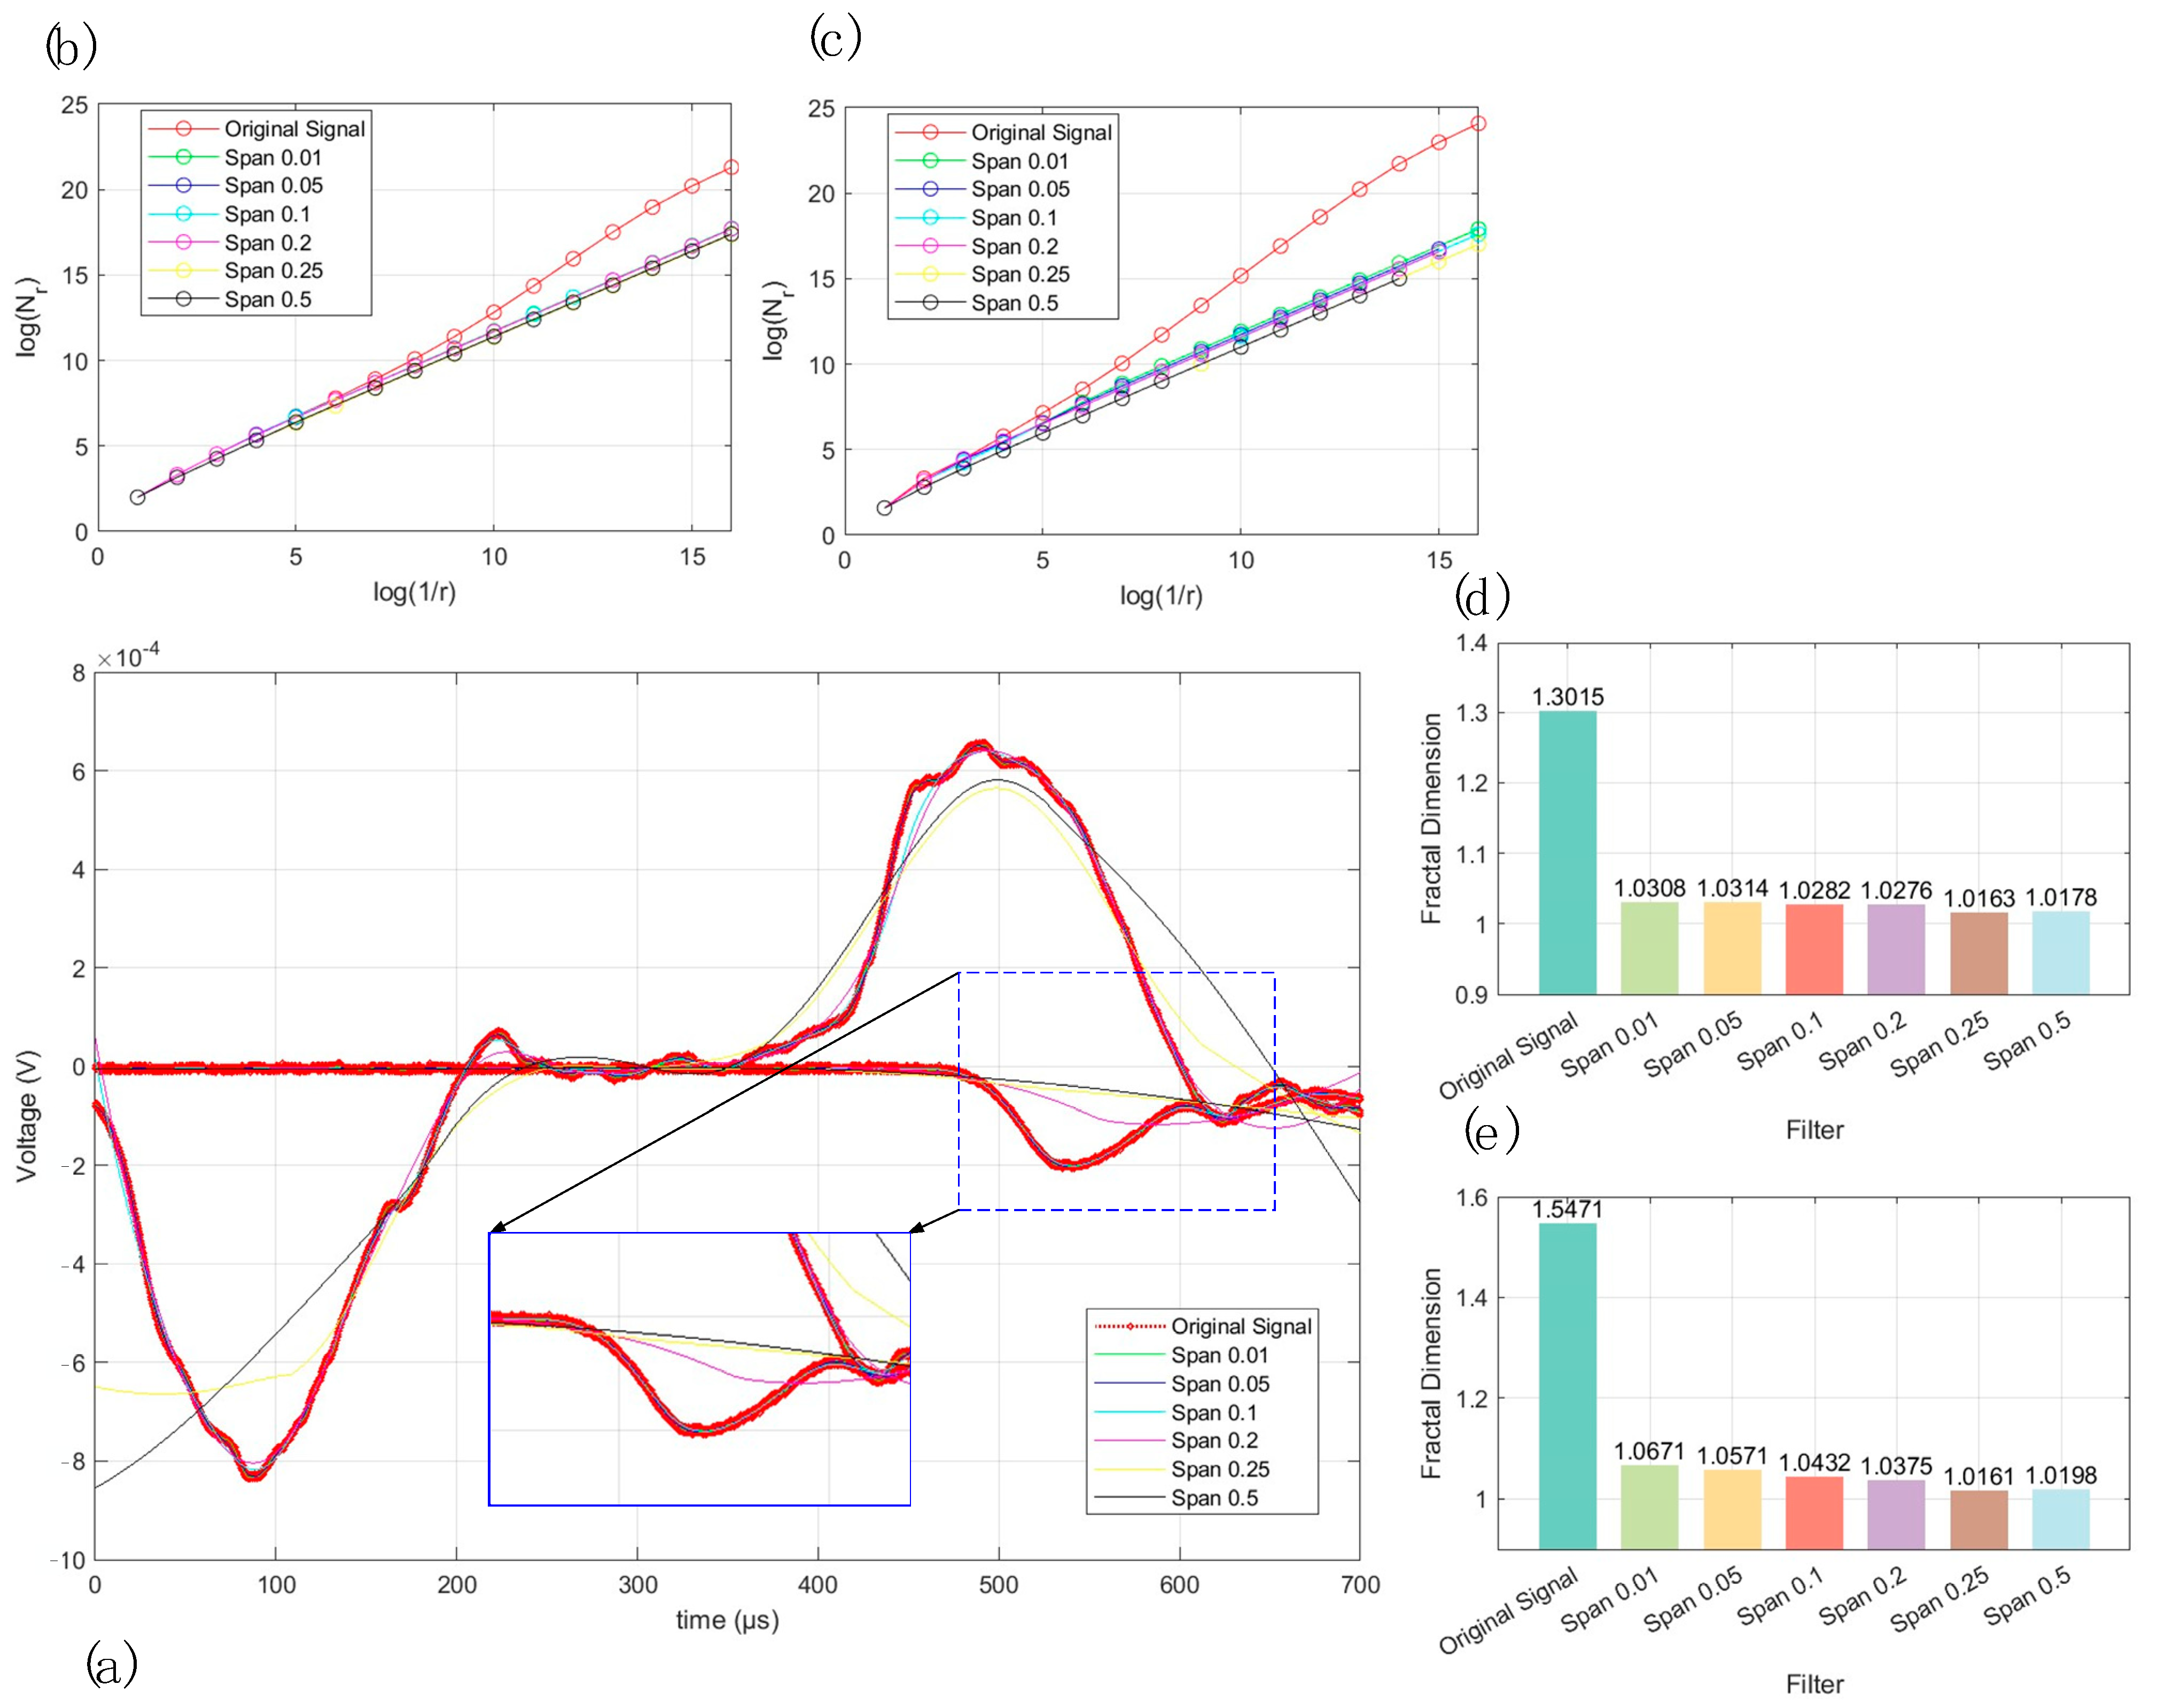
2.2. Denoising of Waveform Signals
2.3. The Stress Equilibrium Factor
2.4. Objective Function
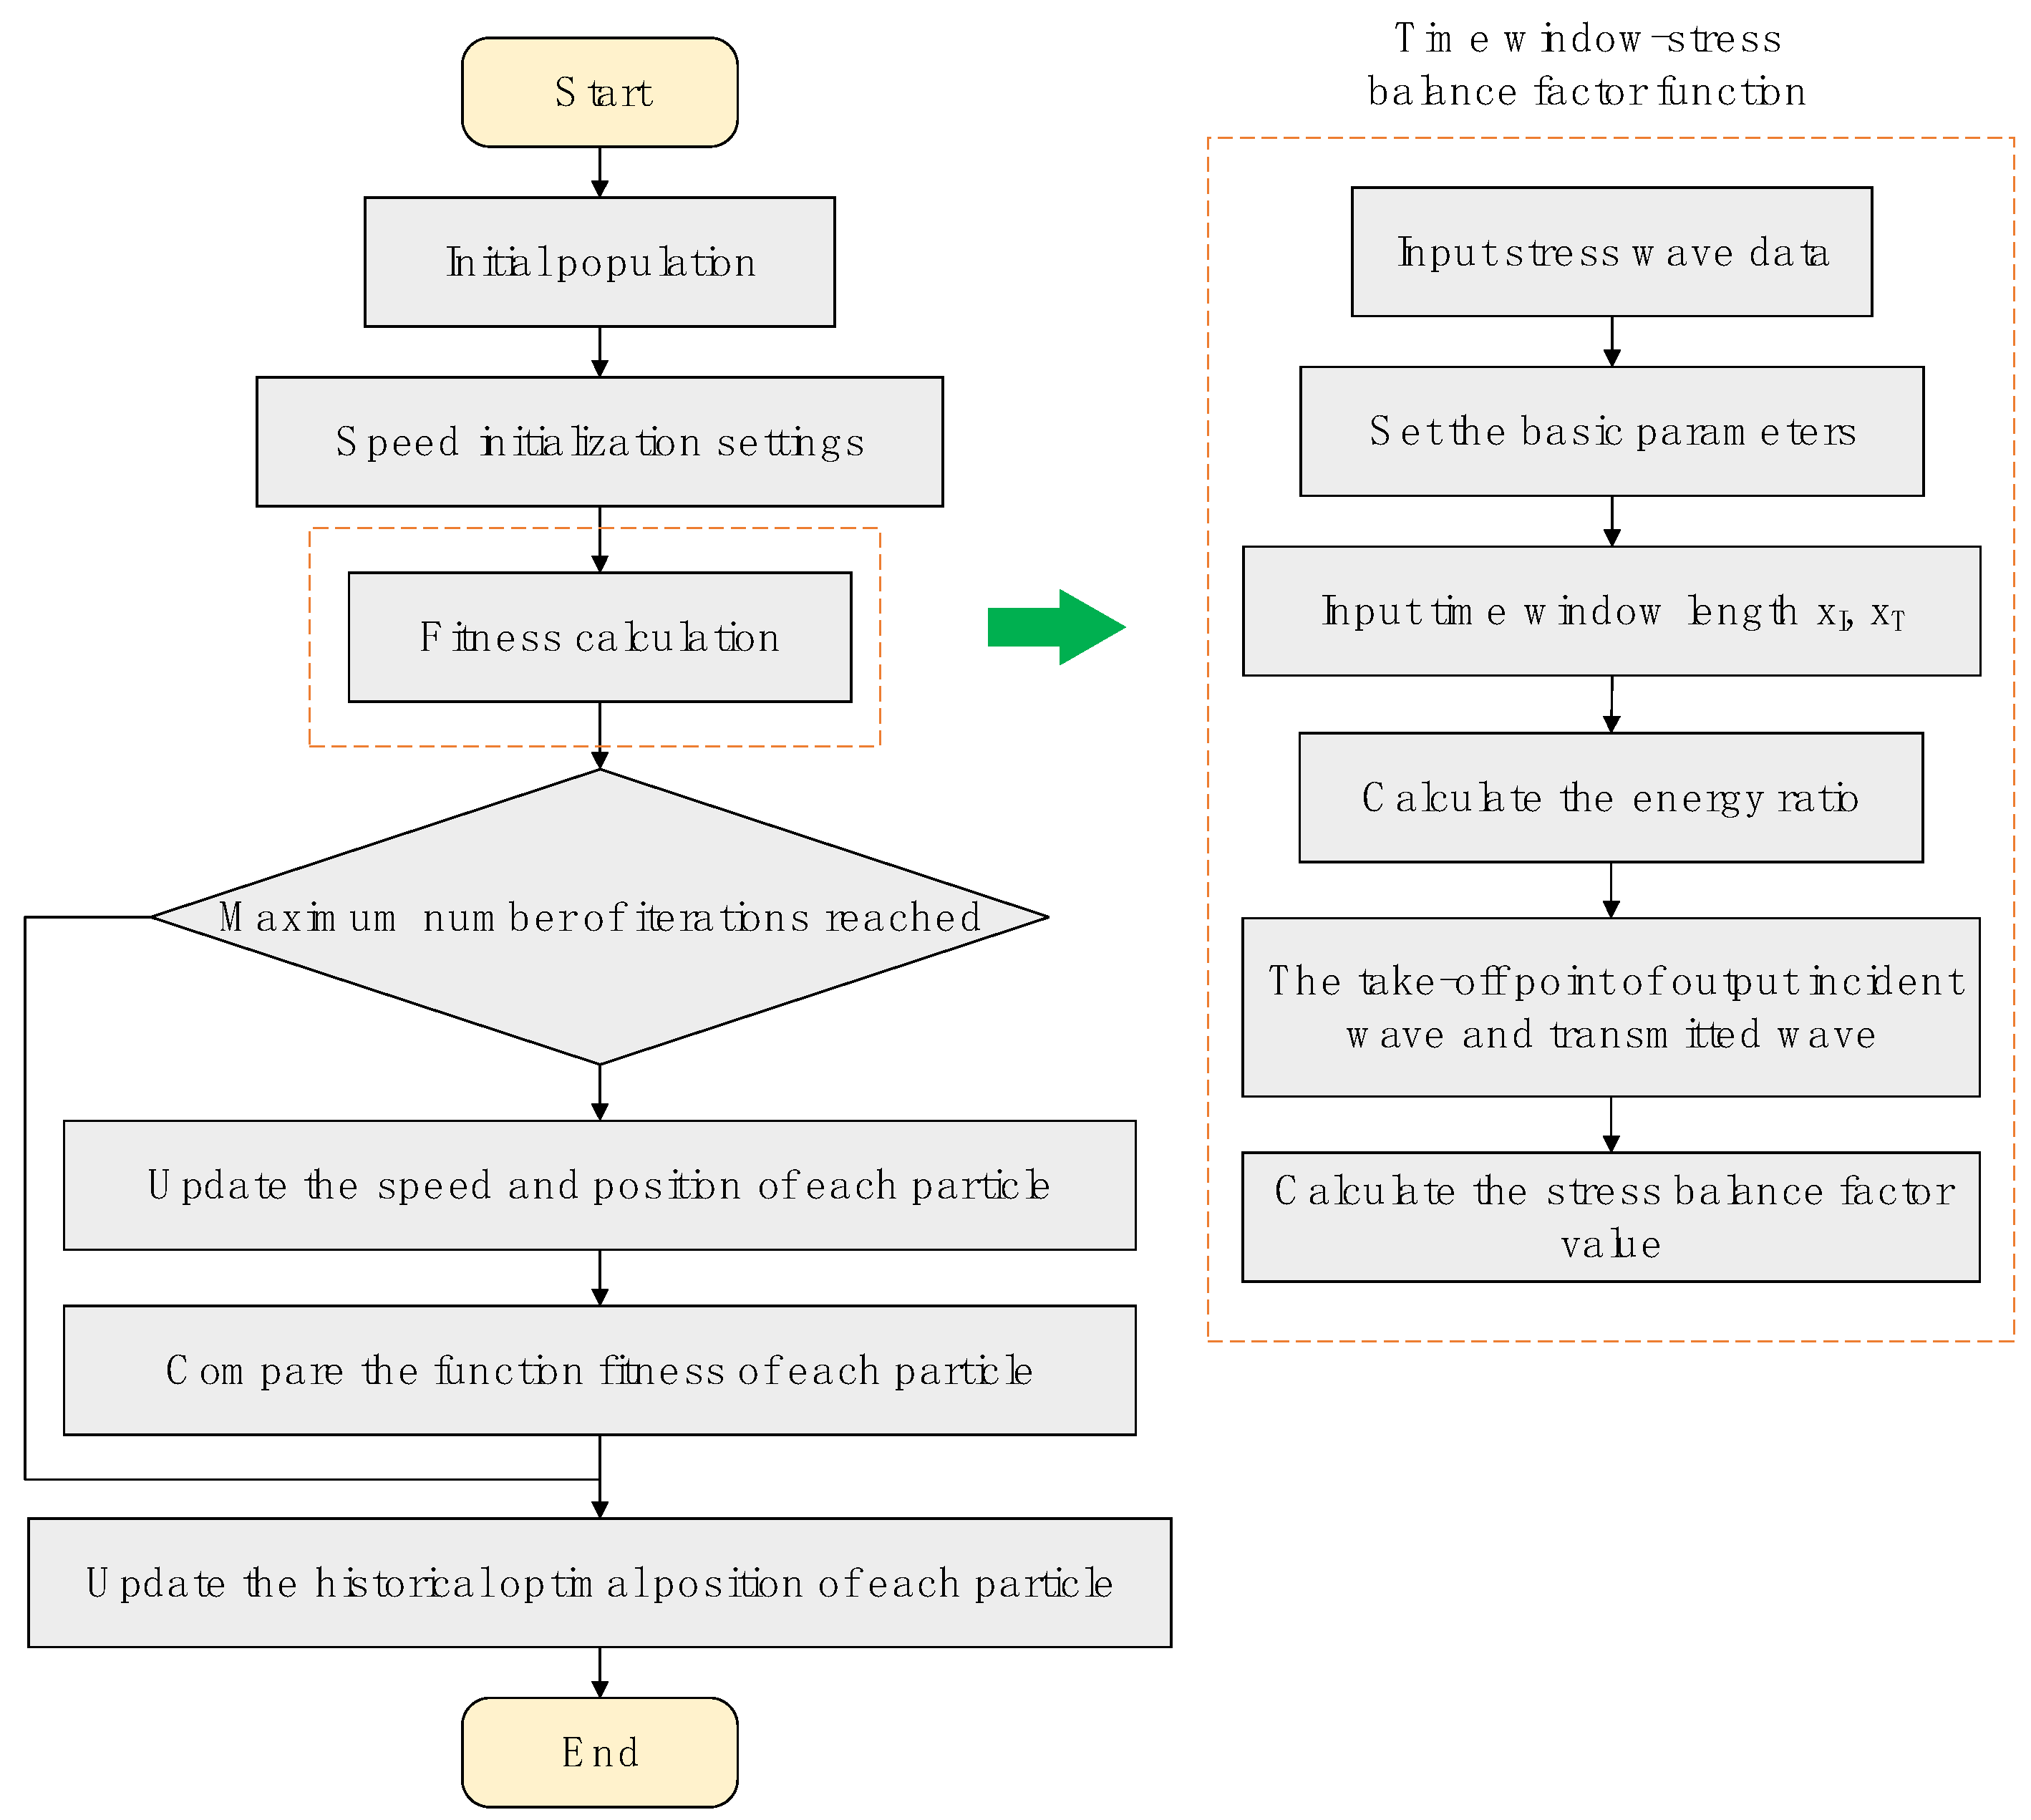
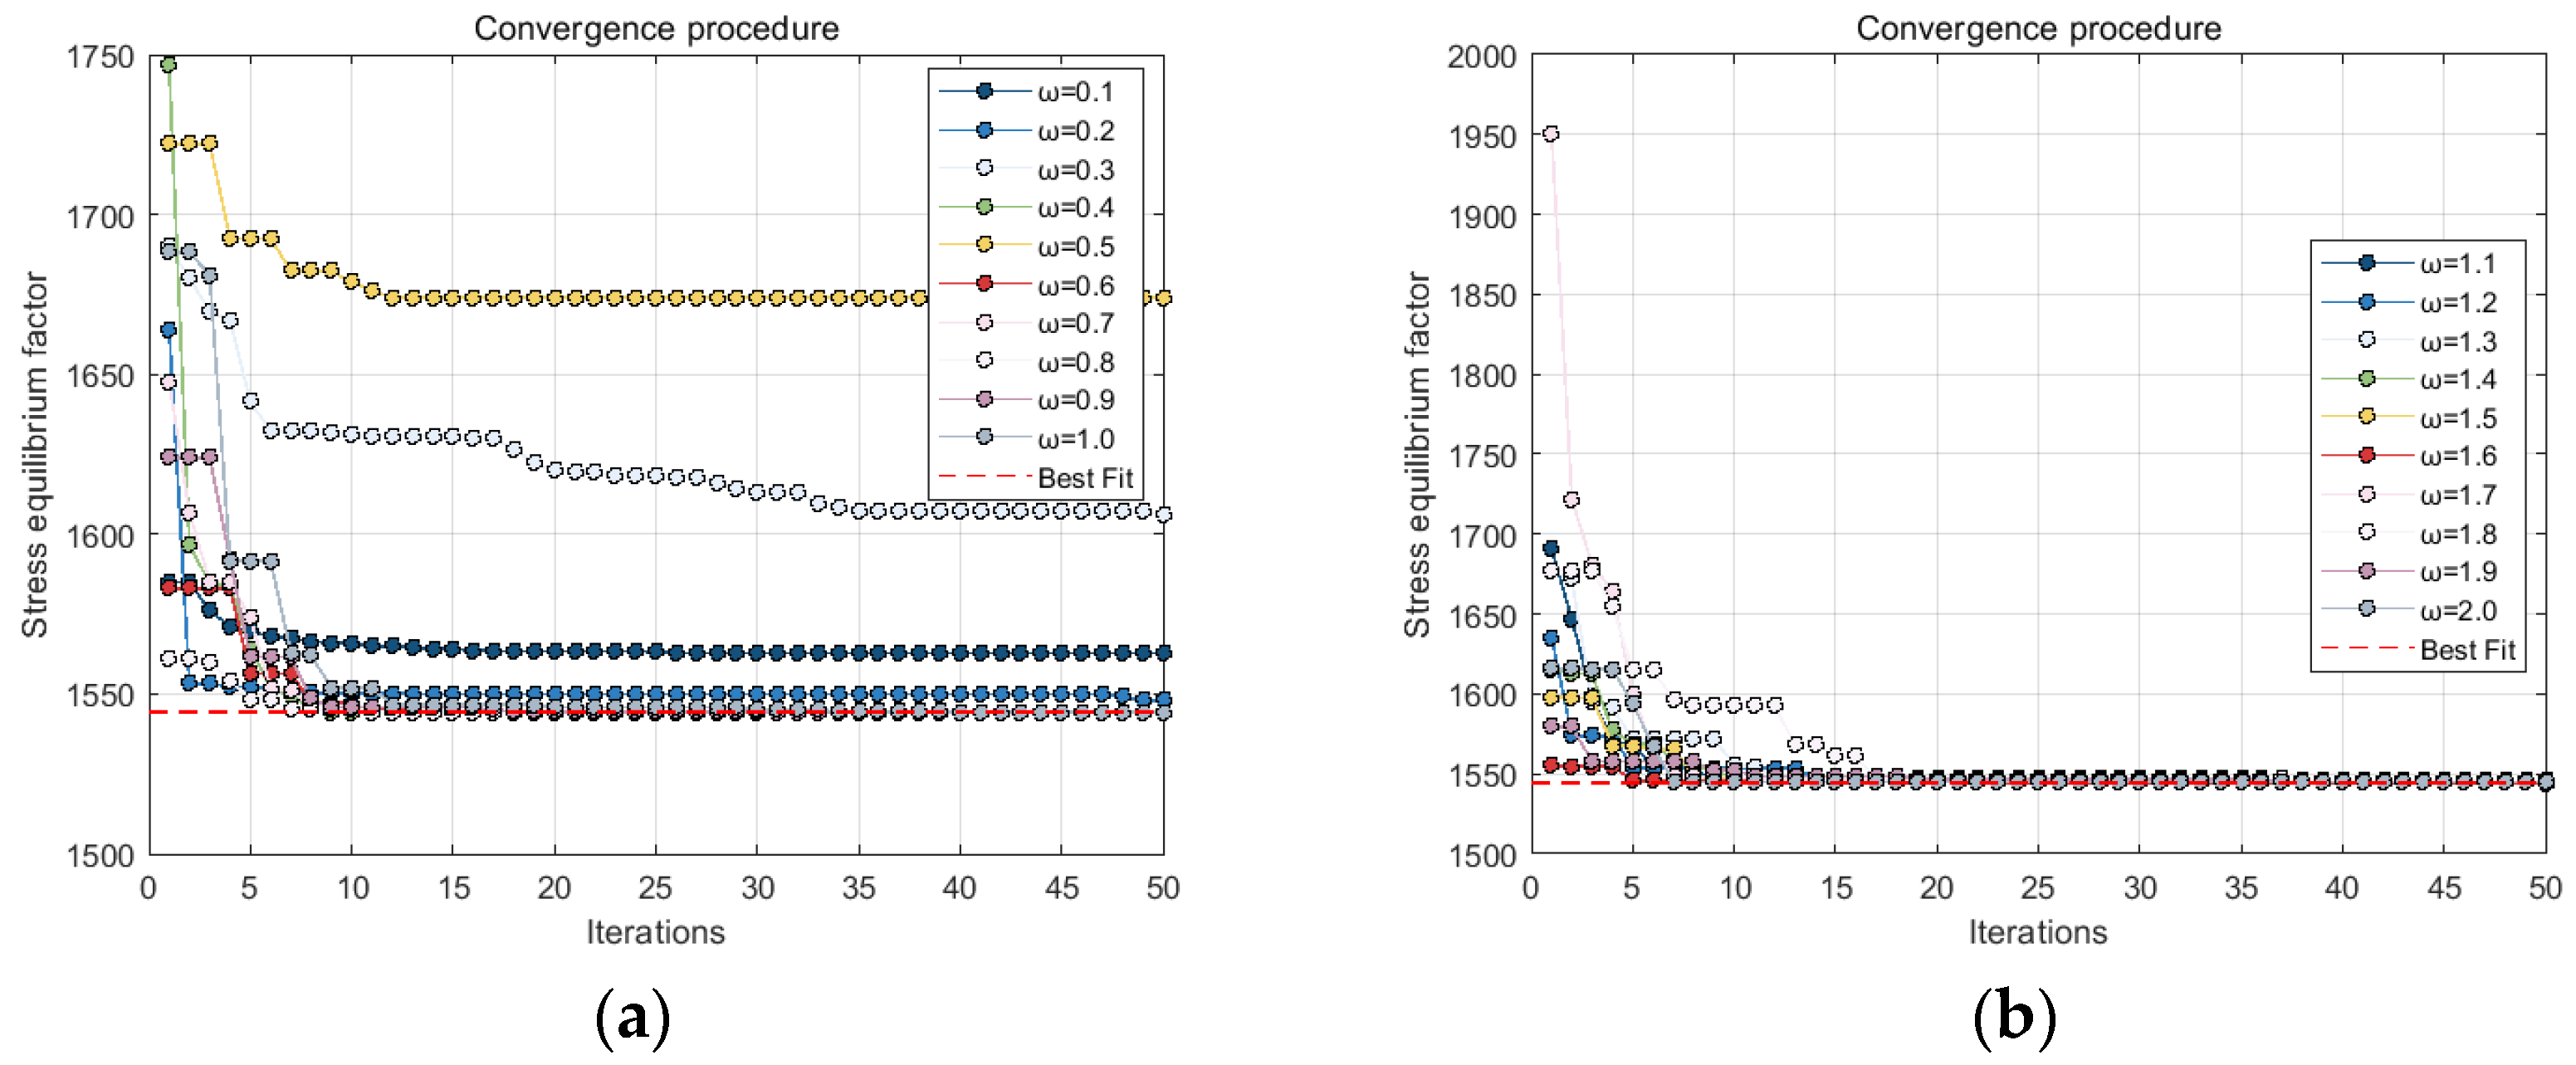
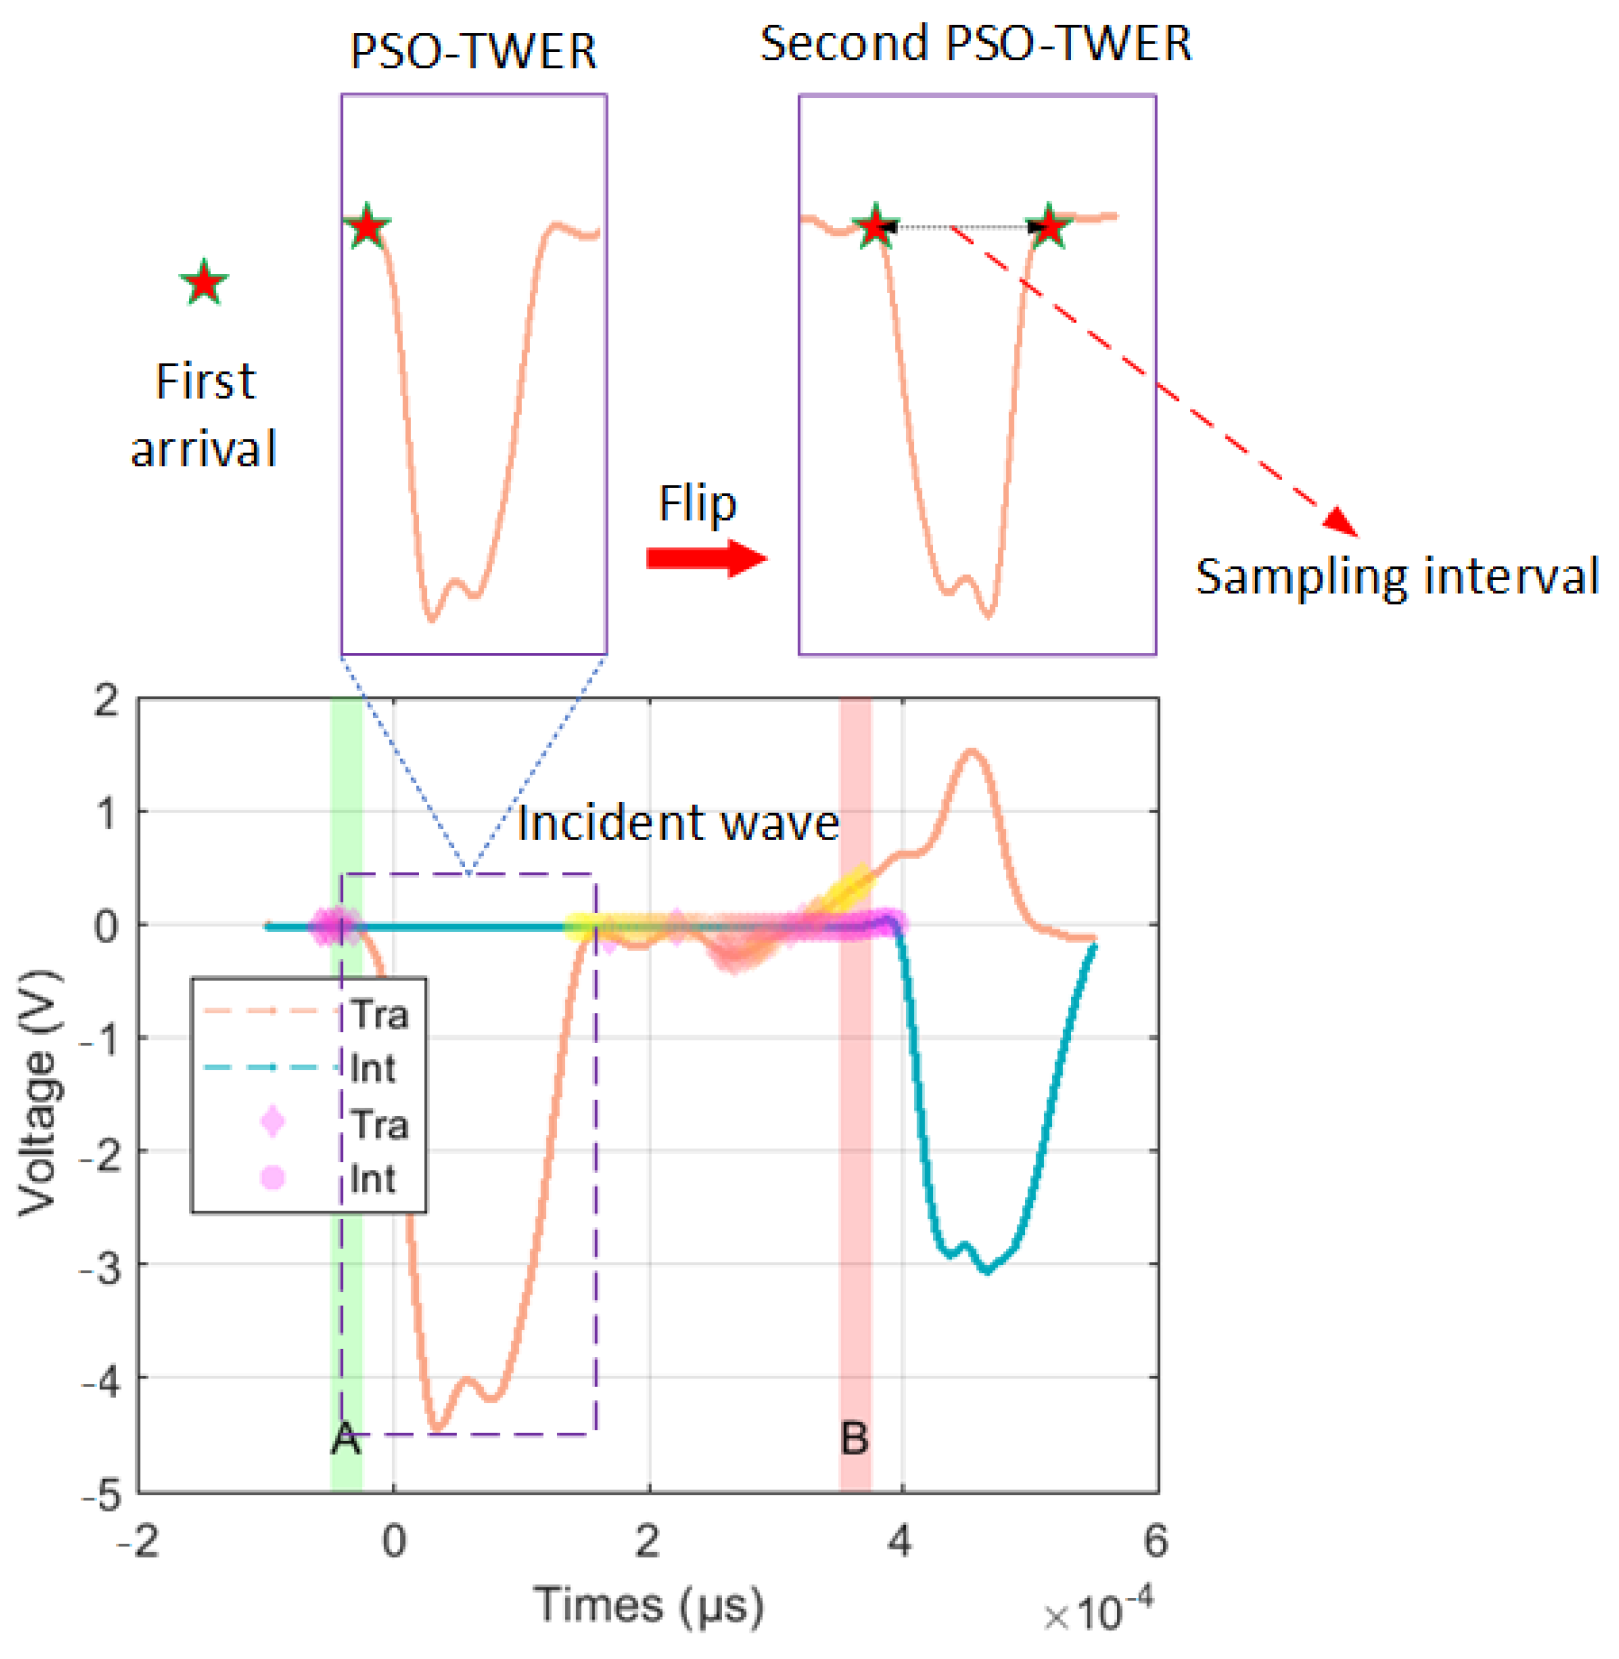
2.5. PSO-TWER Method
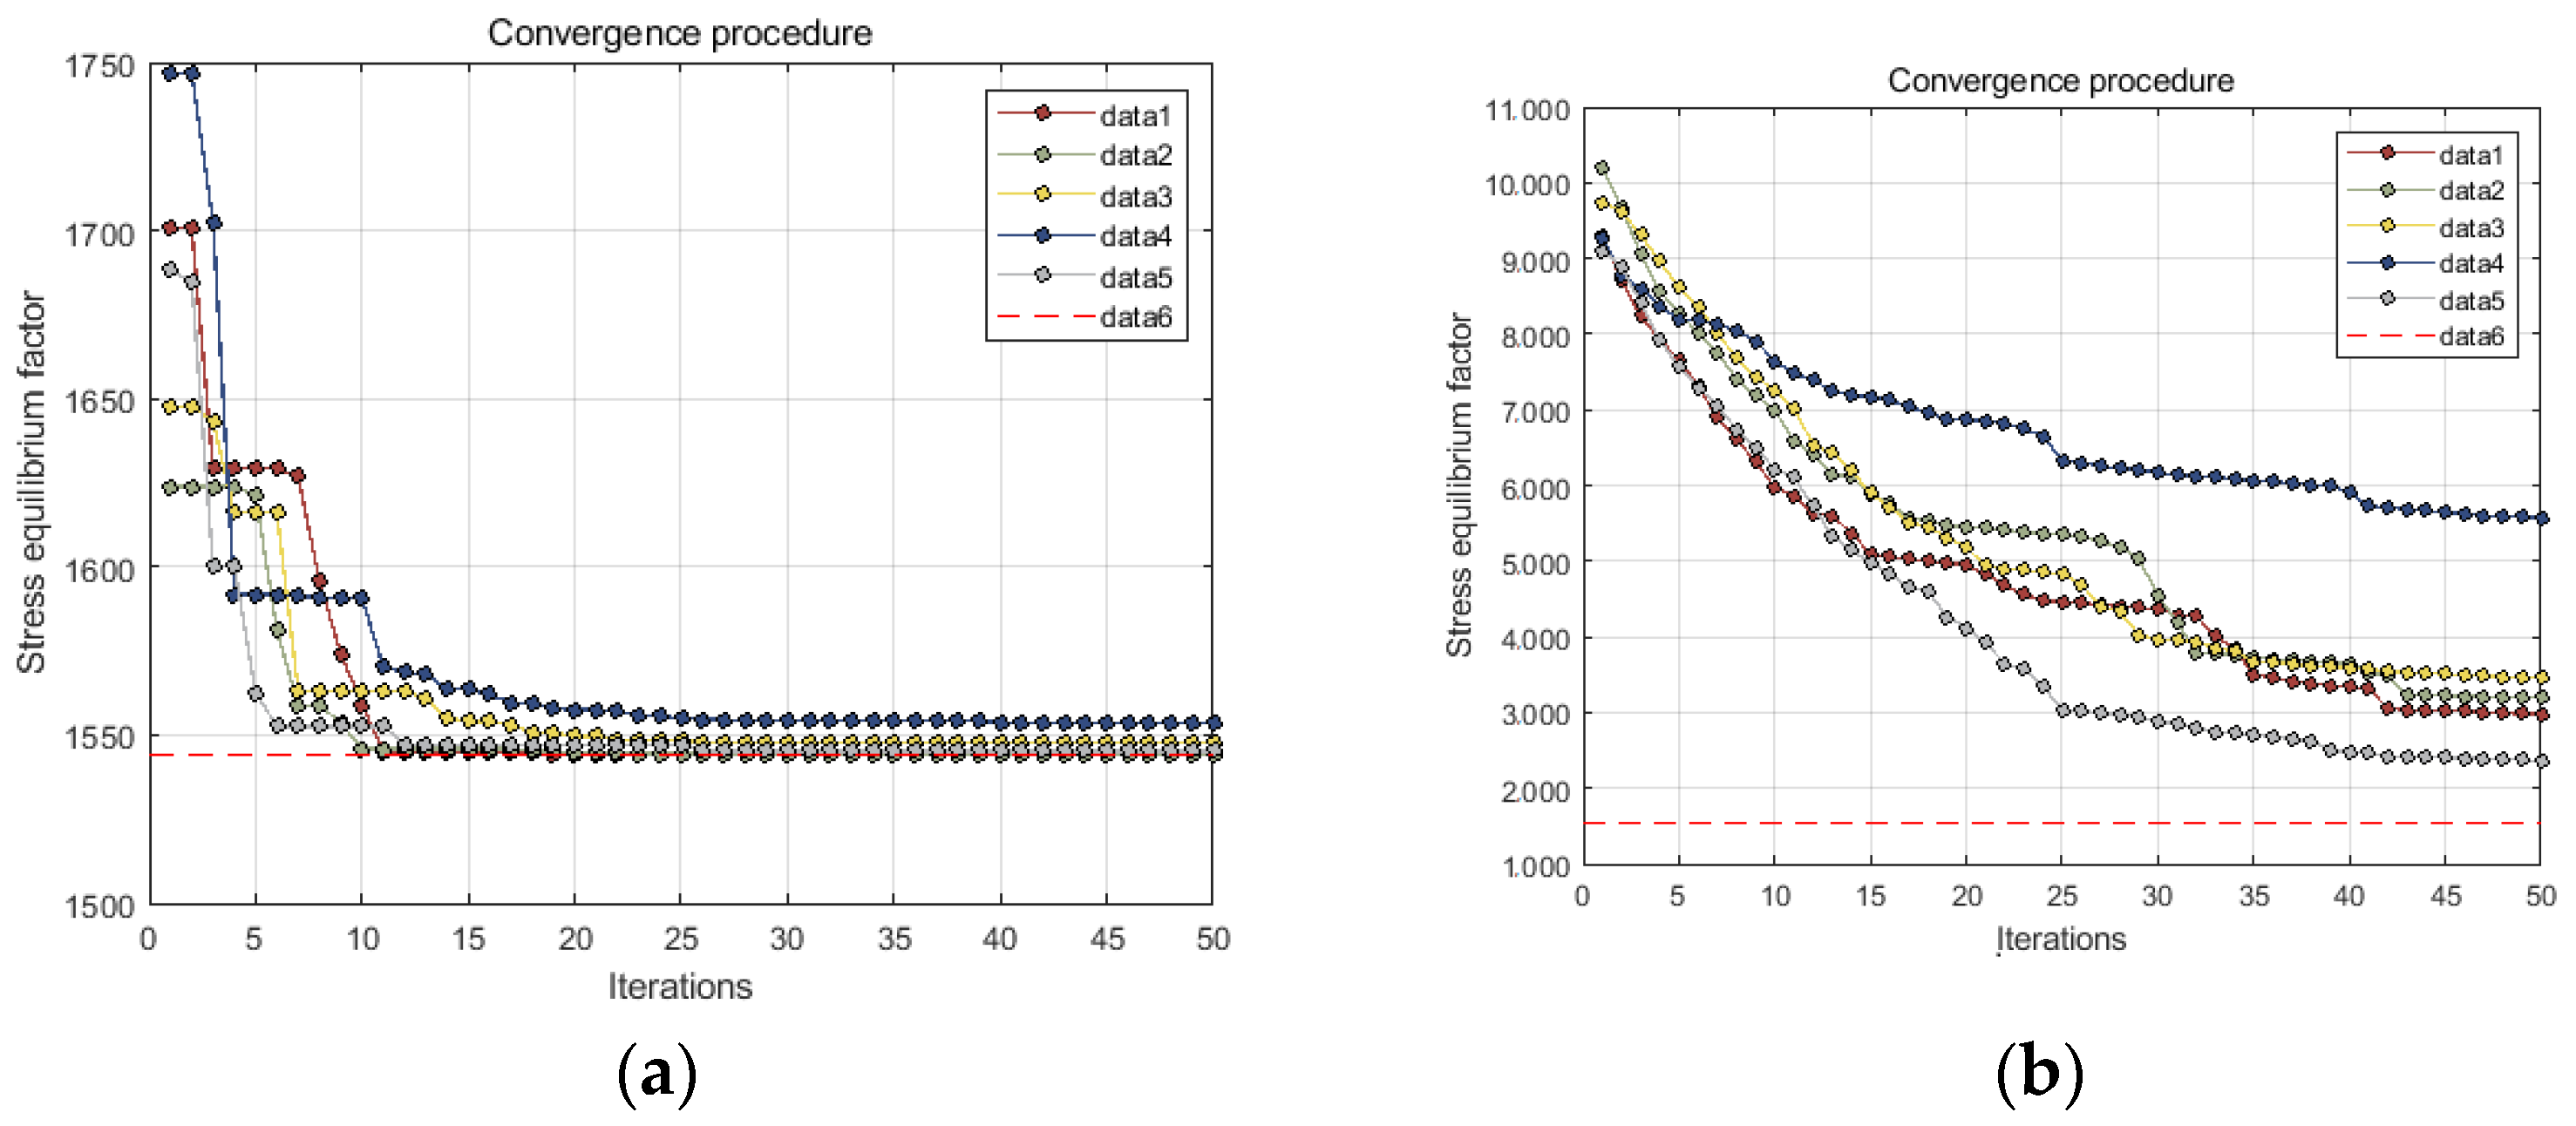
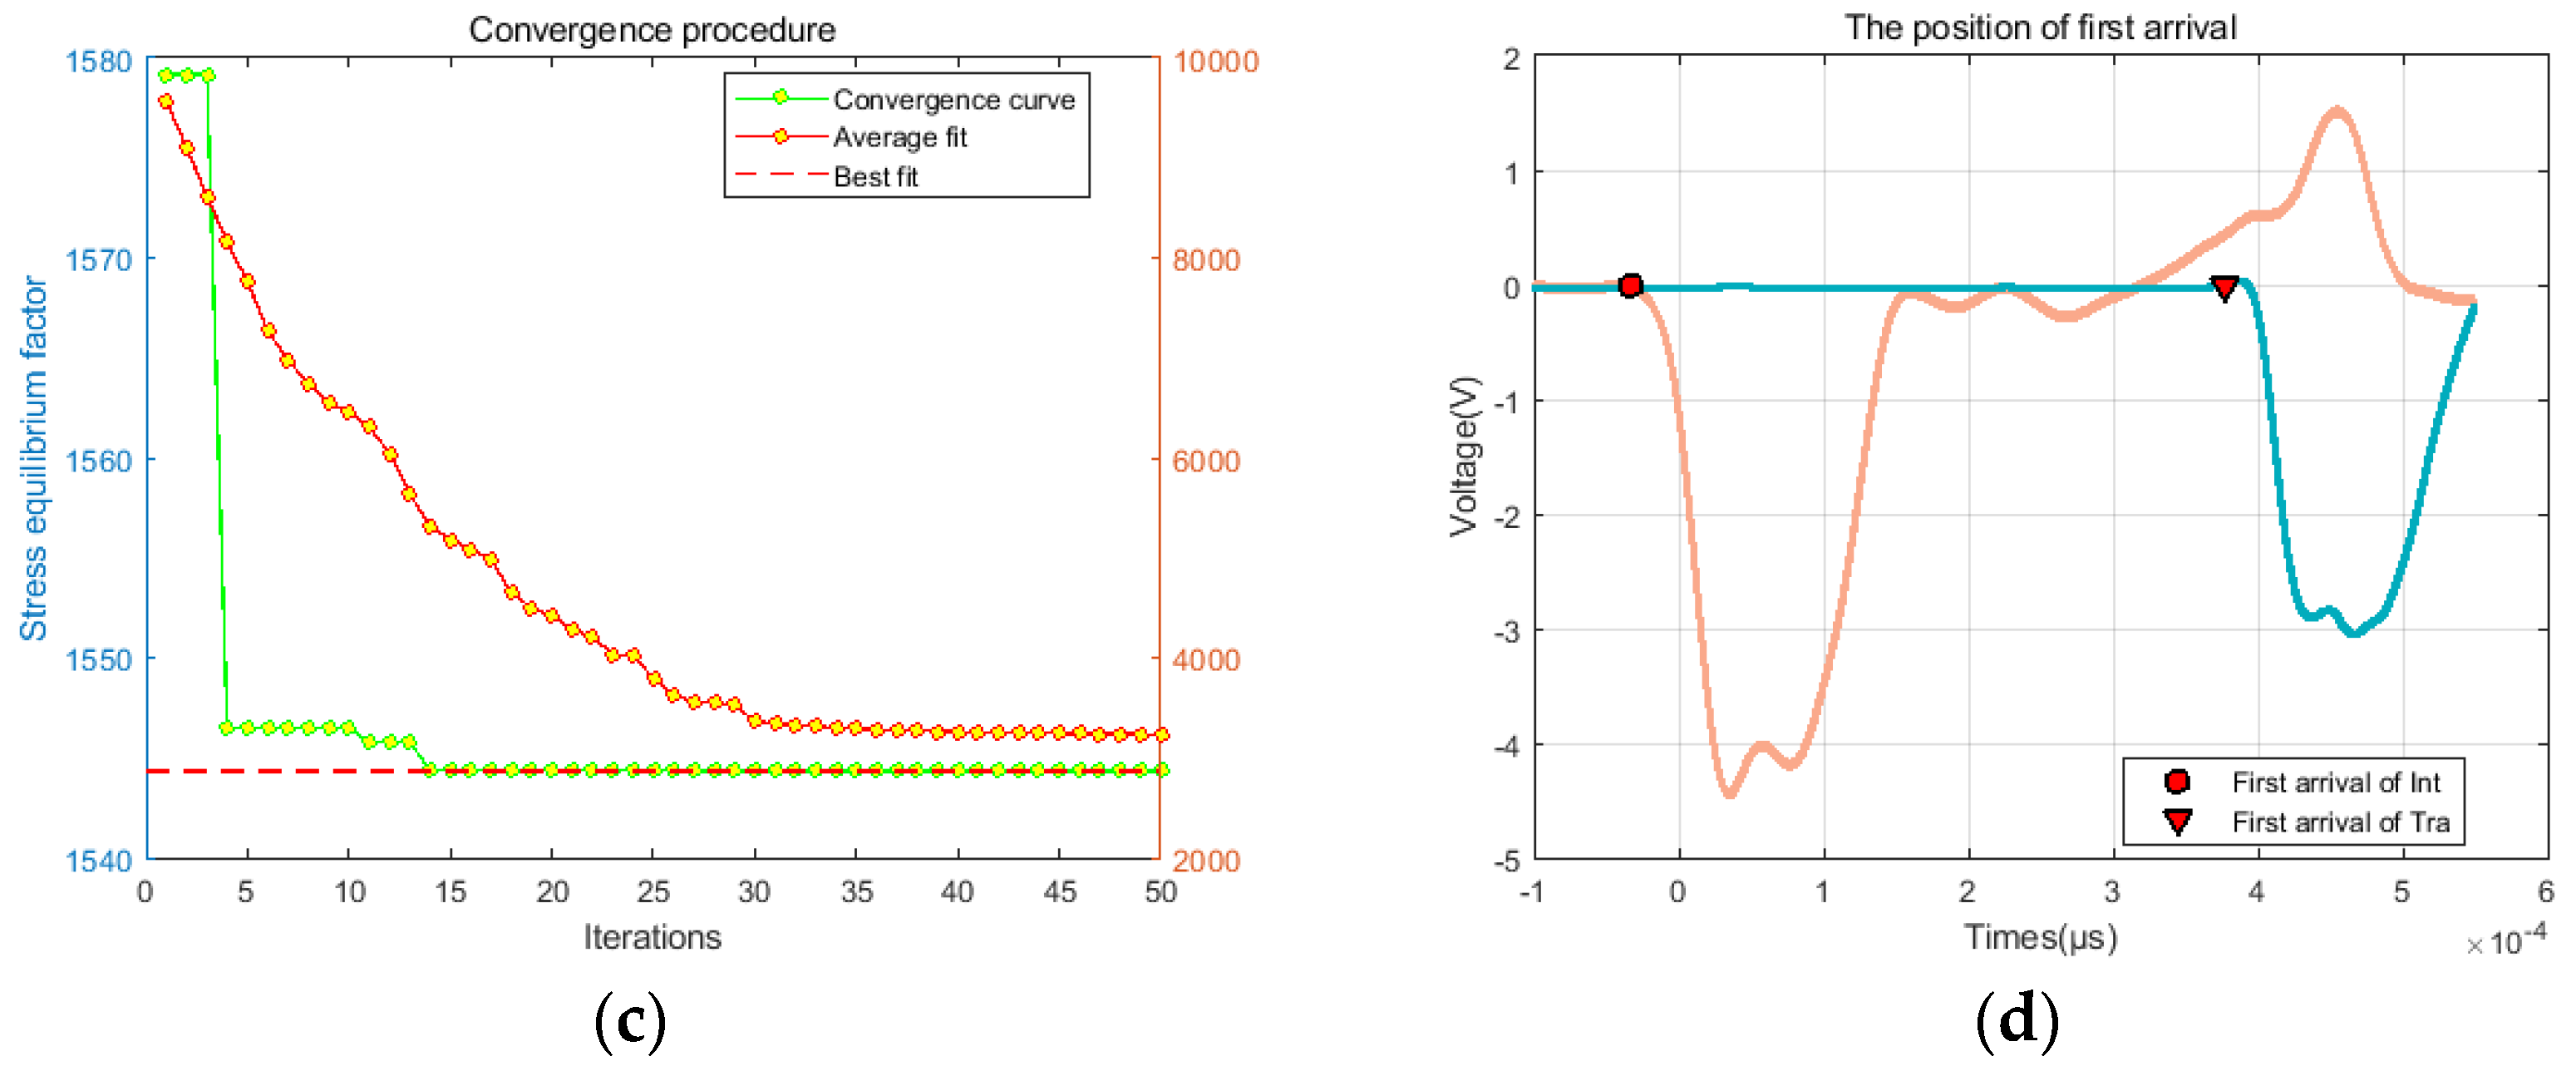
3. Results
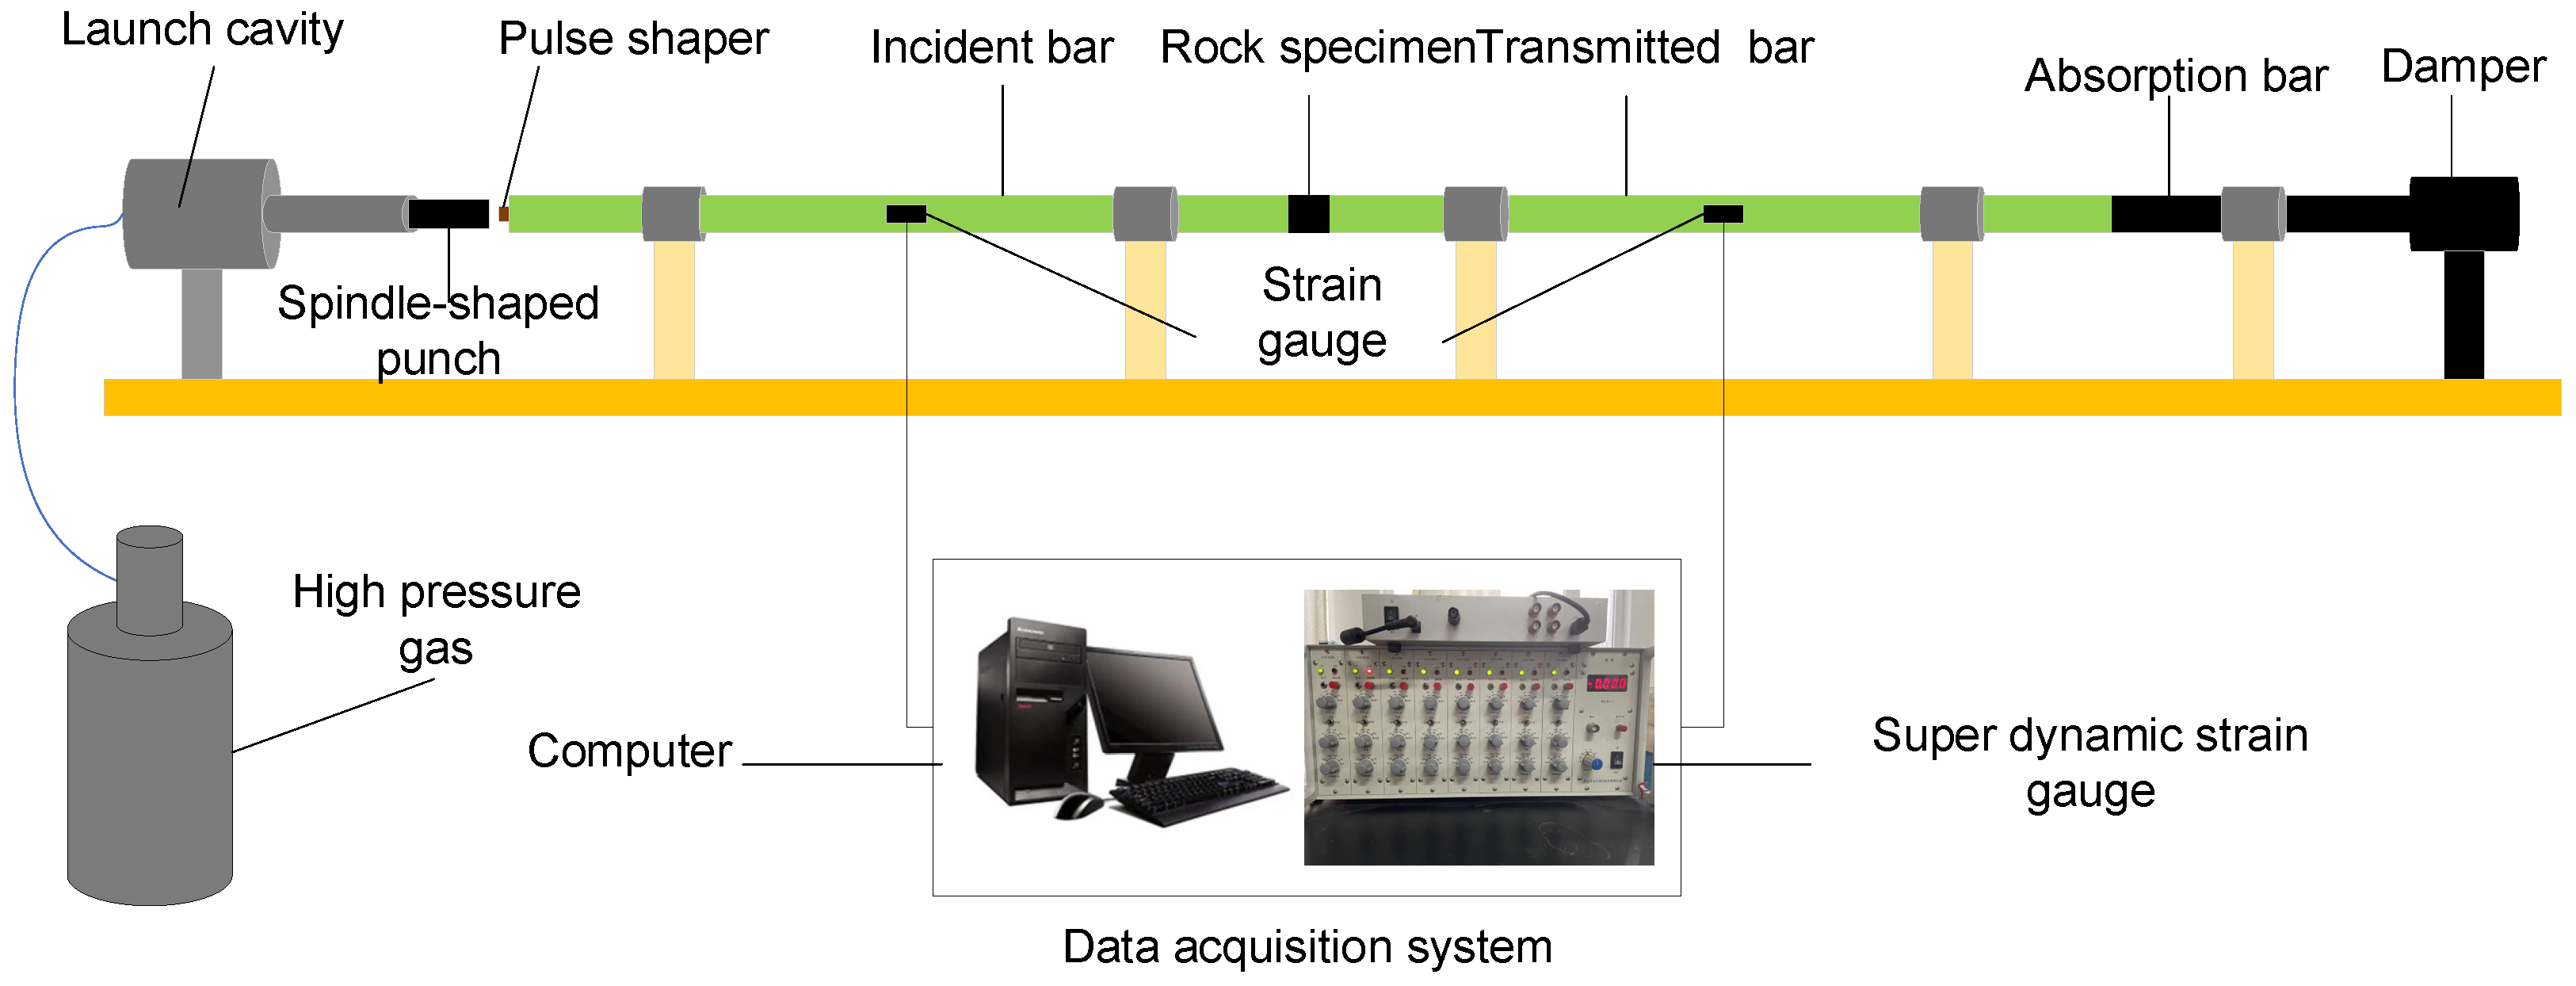
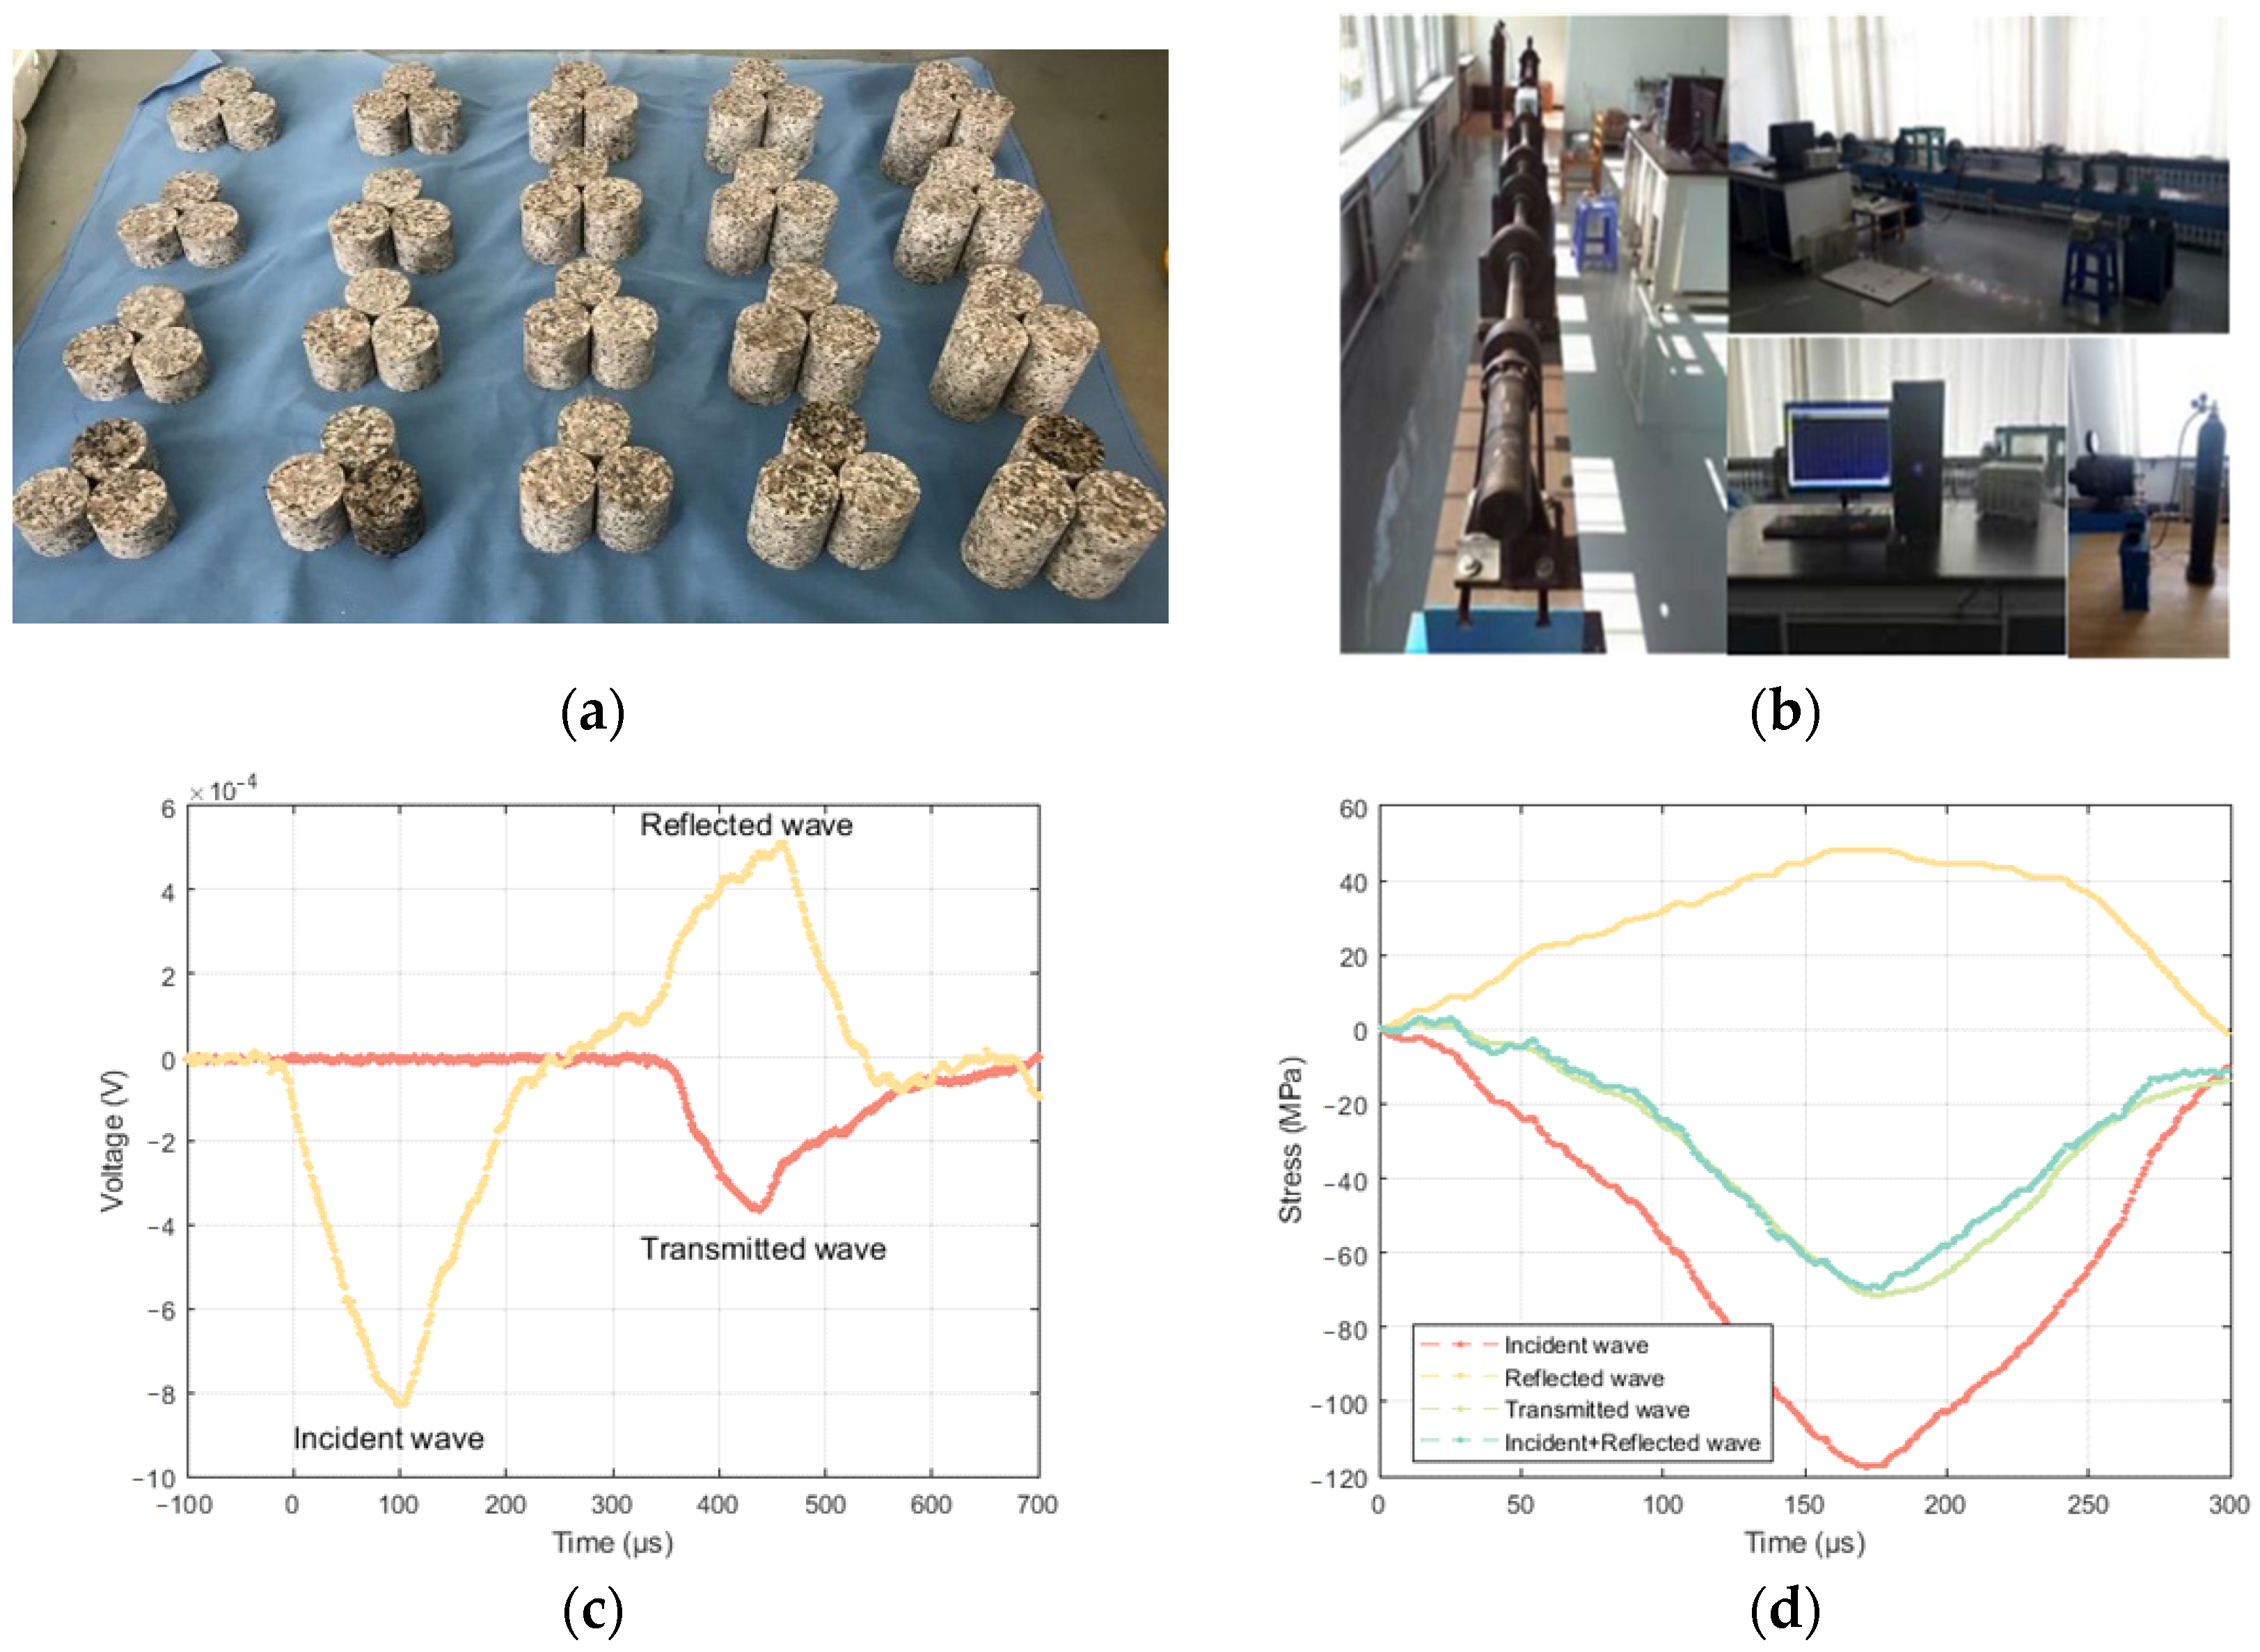
3.1. Test Example Verification Device
3.2. Analysis of Results
4. Hopkinson Stress Balance Effect Index
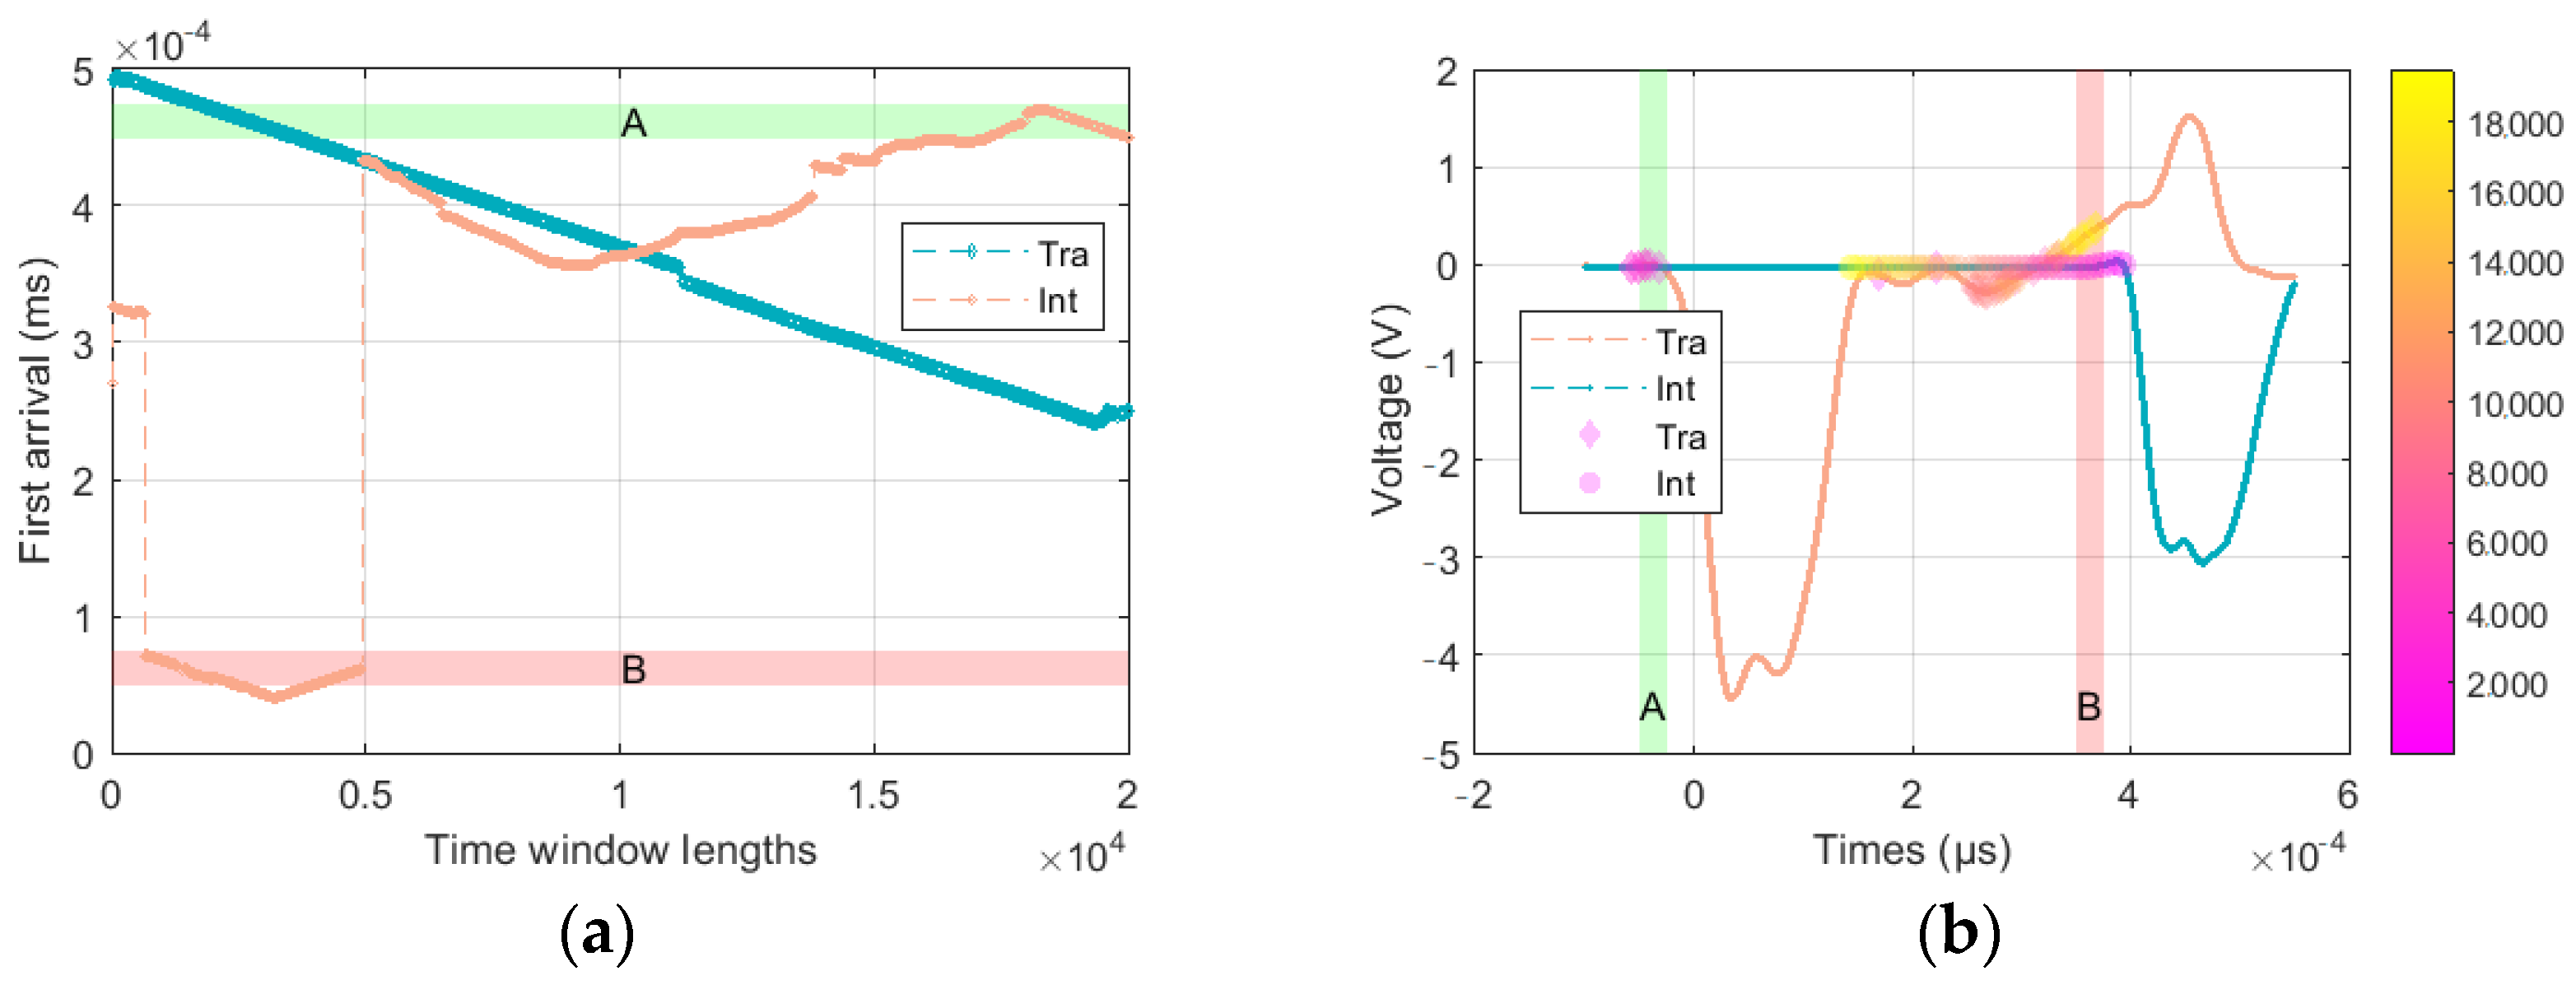
4.1. Correction of the Segment Interval
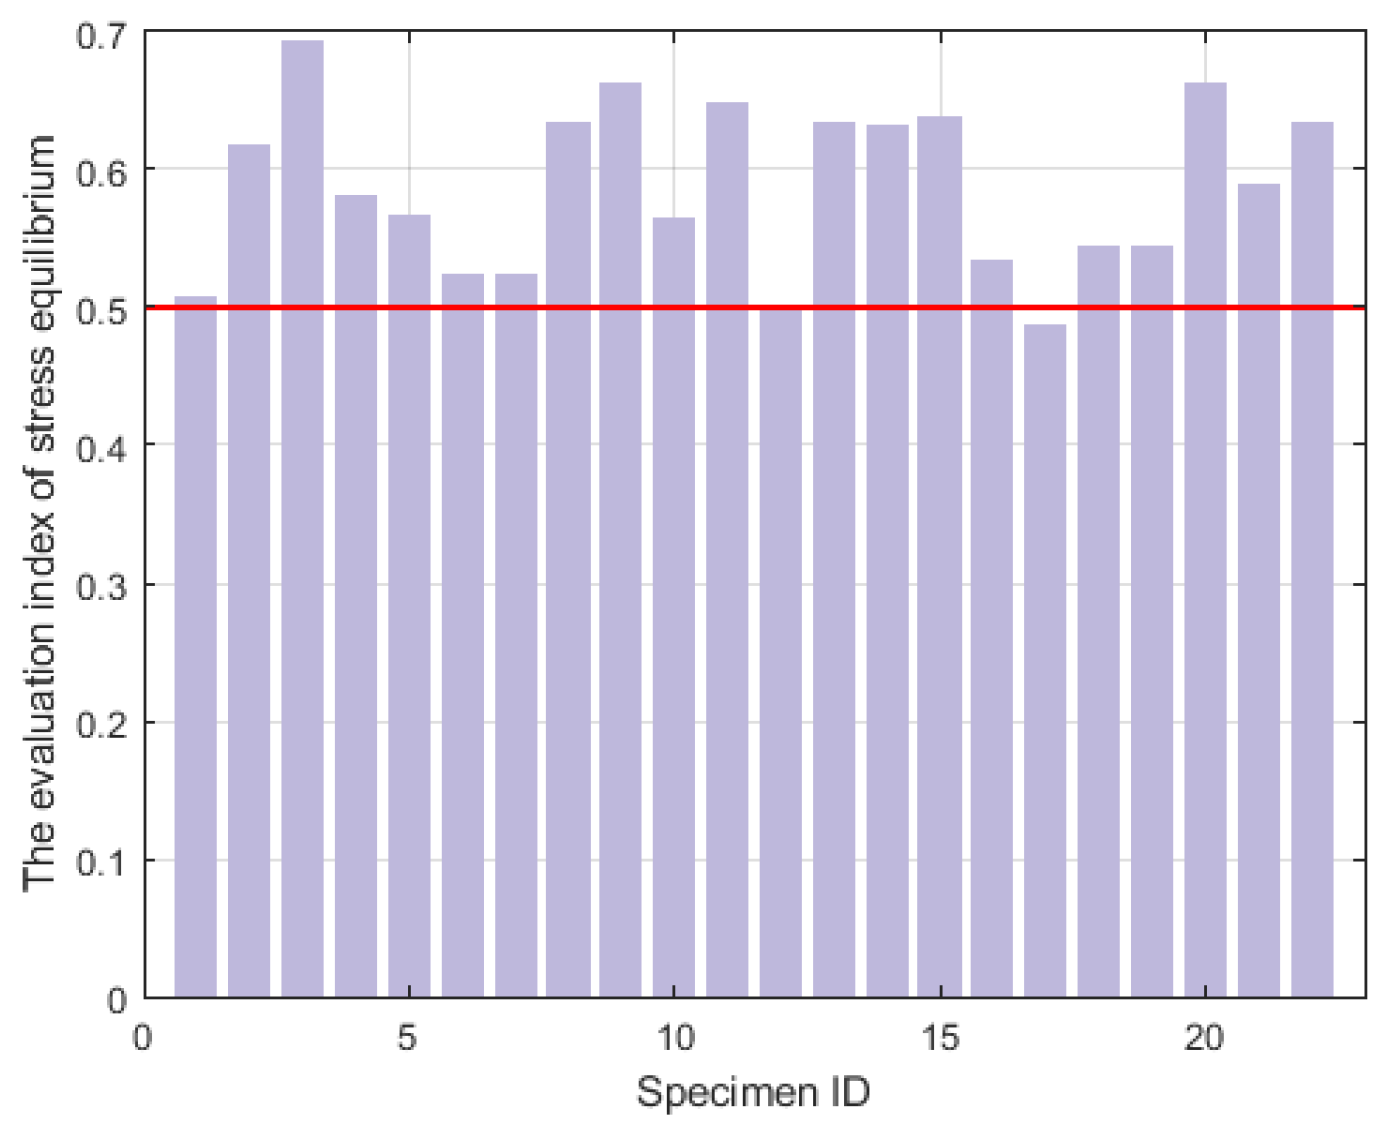
4.2. The Stress Equilibrium Index of SHPB
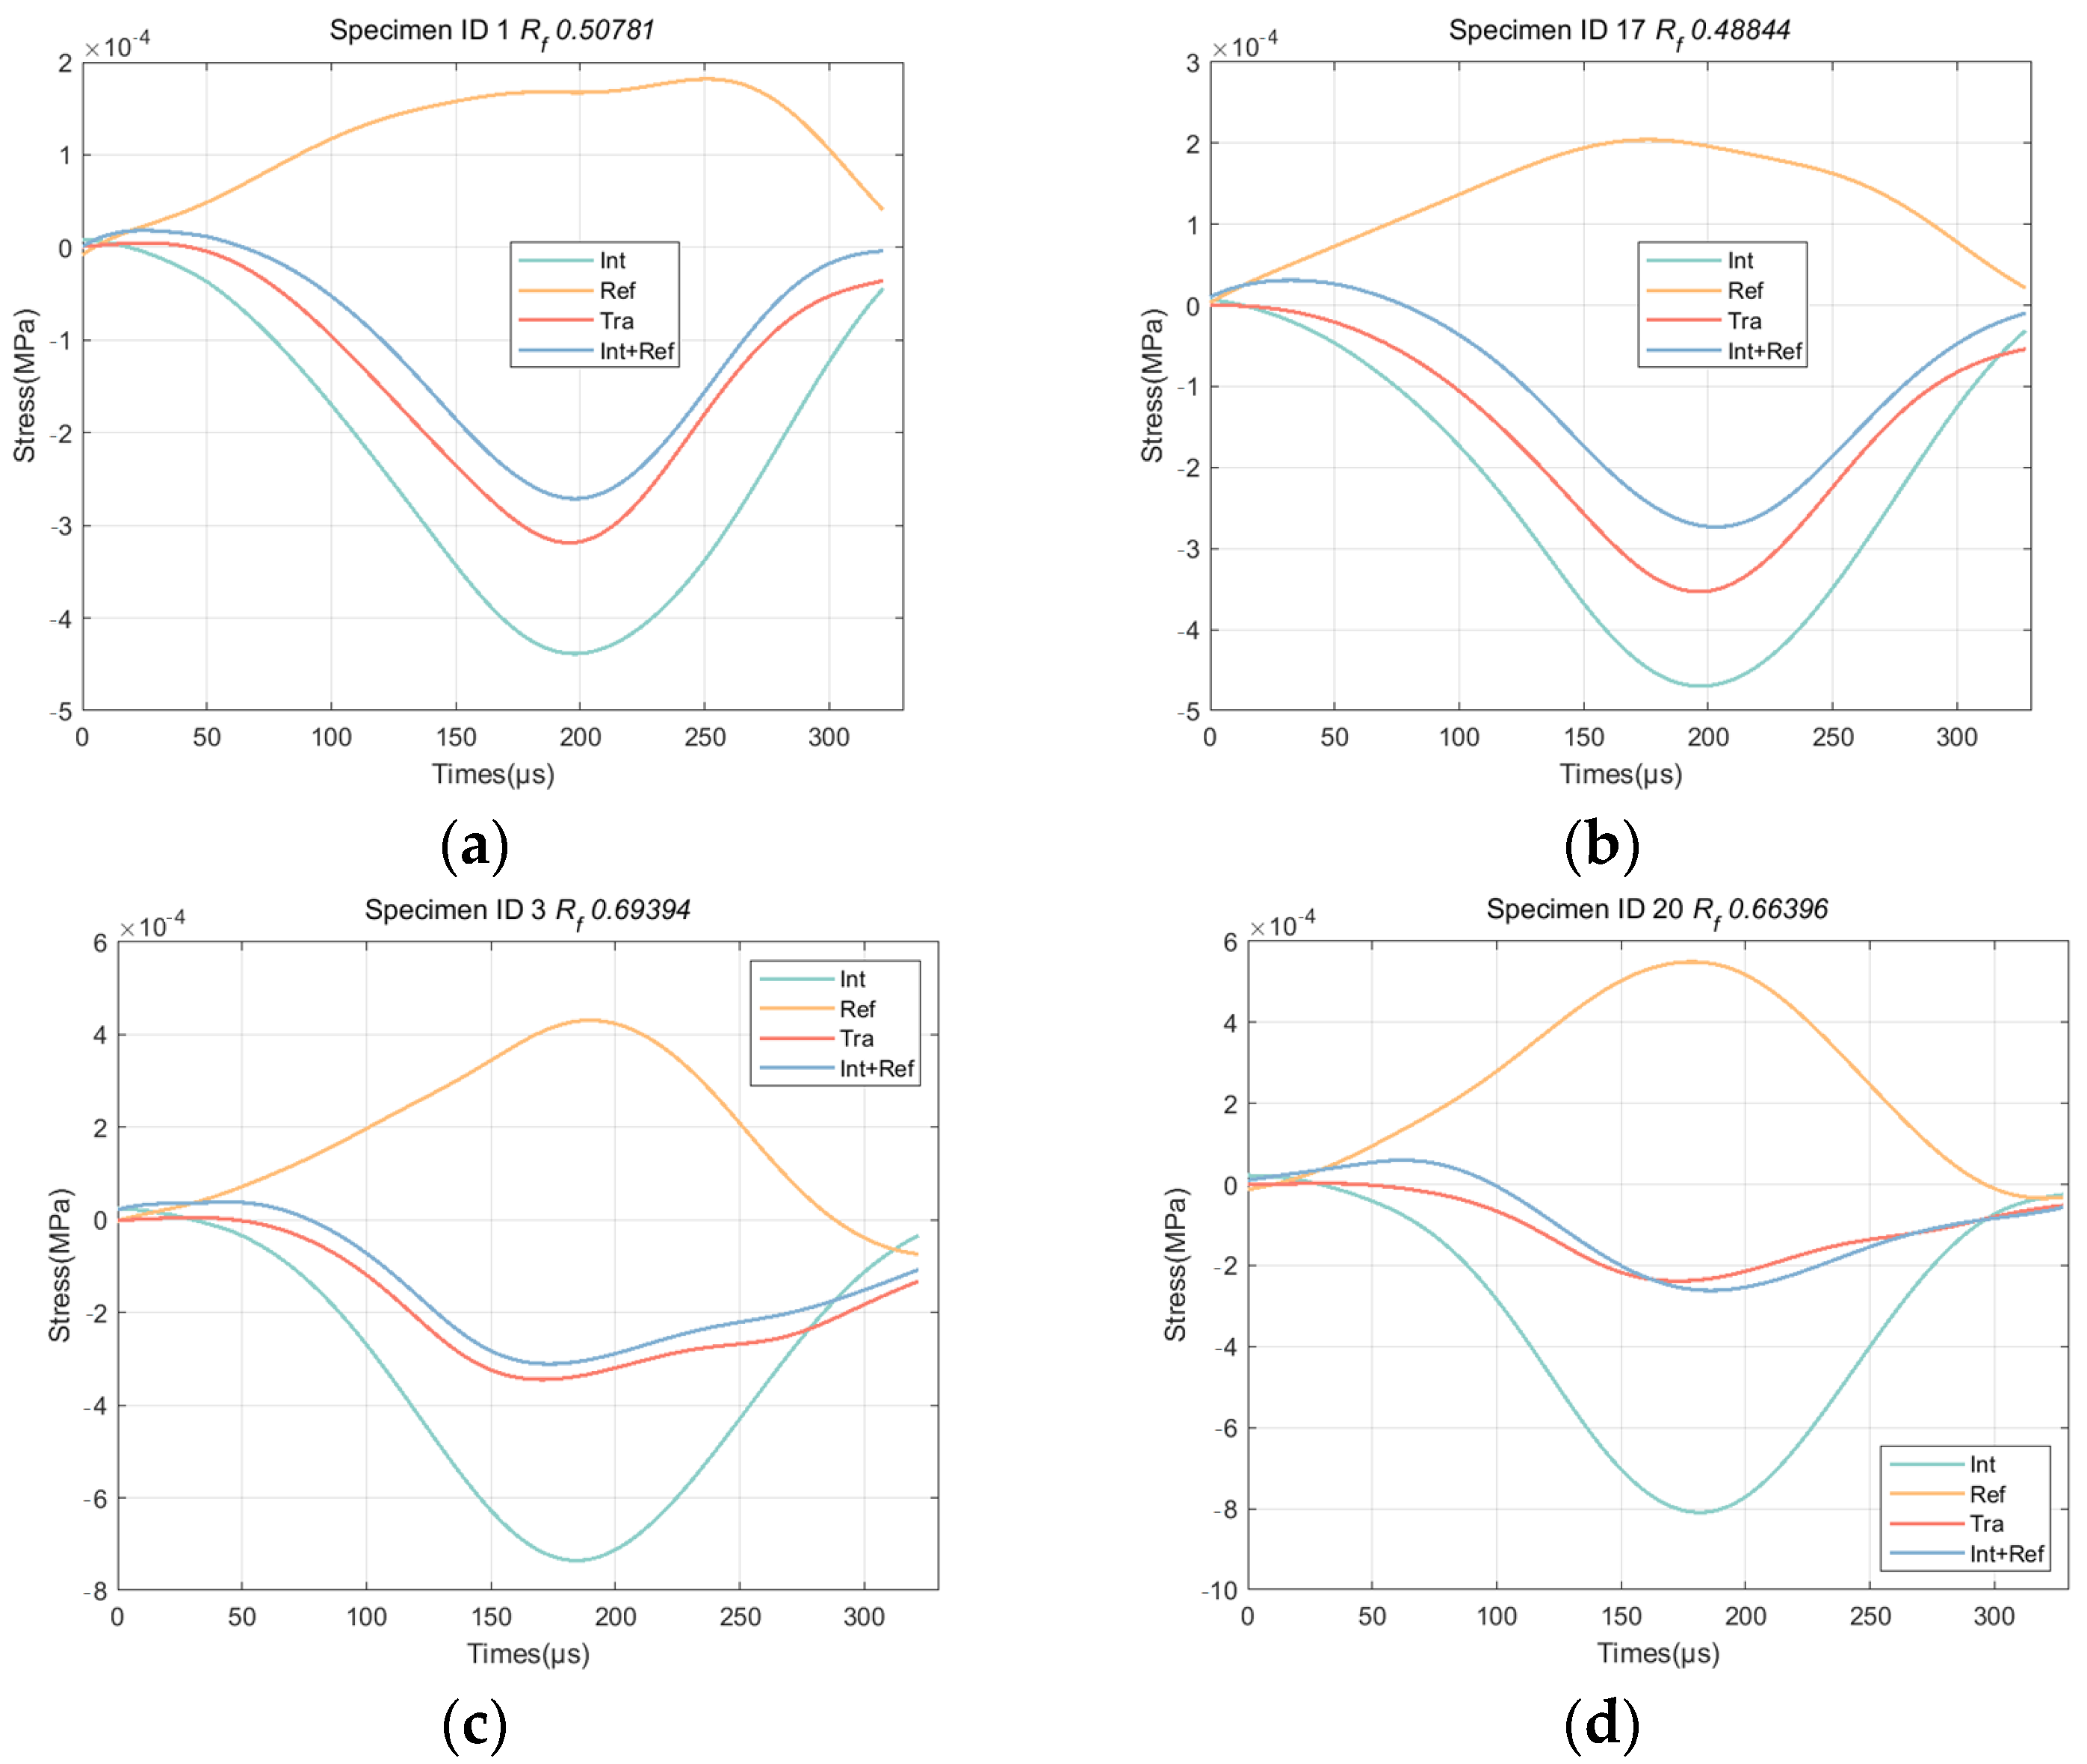
4.3. Applicability Analysis
5. Conclusions and Future Work
Author Contributions
Funding
Institutional Review Board Statement
Informed Consent Statement
Data Availability Statement
Conflicts of Interest
References
- Lopatnikov, S.L.; Gama, B.A.; Krauthouser, K.; Gillespie, G. Applicability of the Classical Analysis of Experiments with Split Hopkins Pressure Bar. Tech. Phys. Lett. 2004, 30, 102–105. [Google Scholar] [CrossRef]
- Song, Q.; Yu, L.; Li, S.; Hanajima, N.; Zhang, X.; Pu, R. Energy Dispatching Based on an Improved PSO-ACO Algorithm. Int. J. Intell. Syst. 2023, 2023, 3160184. [Google Scholar] [CrossRef]
- Lopatnikov, S.L.; Gama, B.A.; Krauthouser, K.; Gillespie, G. Influences of the number of non-consecutive joints on the dynamic mechanical properties and failure characteristics of a rock-like material. Eng. Fail. Anal. 2023, 146, 107101. [Google Scholar]
- Wu, D.; Li, H.; Fukuda, D.; Liu, H. Development of a finite-discrete element method with finite-strain elasto-plasticity and cohesive zone models for simulating the dynamic fracture of rocks. Comput. Geotech. 2023, 156, 105271. [Google Scholar] [CrossRef]
- Sun, X.; Jin, T.; Li, J.; Xie, J.; Li, C.; Li, X. Dynamic characteristics and crack evolution laws of coal and rock under split Hopkinson pressure bar impact loading. Meas. Sci. Technol. 2023, 34, 075601. [Google Scholar] [CrossRef]
- Li, X.B.; Zou, Y.; Zhou, Z.L. Numerical Simulation of the Rock SHPB Test with a Special Shape Striker Based on the Discrete Element Method. Rock Mech. Rock Eng. 2014, 47, 1693–1709. [Google Scholar] [CrossRef]
- Kim, D.; Joo, Y.; Byun, J. First-Break Picking Method Based on the Difference Between Multiwindow Energy Ratios. IEEE Trans. Geosci. Remote Sens. 2023, 61, 1–10. [Google Scholar] [CrossRef]
- Lei, S.; Hao, D.; Cao, S. Study on Uniaxial Compression Deformation and Fracture Development Characteristics of Weak Interlayer Coal–Rock Combination. Fractal Fract. 2023, 7, 731. [Google Scholar] [CrossRef]
- Miao, K.; Tu, S.; Tu, H.; Liu, X.; Li, W.; Zhao, H.; Li, Y. Research on Fractal Evolution Characteristics and Safe Mining Technology of Overburden Fissures under Gully Water Body. Fractal Fract. 2022, 6, 486. [Google Scholar] [CrossRef]
- He, S.H.; Ding, Z.; Hu, H.B.; Gao, M. Effect of grain size on microscopic pore structure and fractal characteristics of carbonate-based sand and silicate-based sand. Fractal Fract. 2021, 5, 152. [Google Scholar] [CrossRef]
- Hong, L. Size Effect on Strength and Energy Dissipation in Fracture of Rock under Impact Loads; Central South University: Changsha, China, 2008. [Google Scholar]
- Xibing, L. Rock Dynamics Fundamentals and applications; Science Press: Beijing, China, 2017. [Google Scholar]
- Rao, R. Rao algorithms: Three metaphor-less simple algorithms for solving optimization problems. Int. J. Ind. Eng. Comput. 2020, 11, 107–130. [Google Scholar] [CrossRef]
- Rao, R.V.; Keesari, H.S. A self-adaptive population Rao algorithm for optimization of selected bio-energy systems. J. Comput. Des. Eng. 2021, 8, 69–96. [Google Scholar] [CrossRef]
- Tharwat, A.; Schenck, W. A conceptual and practical comparison of PSO-style optimization algorithms. Expert Syst. Appl. 2021, 167, 114430. [Google Scholar] [CrossRef]
- Meng, Z.; Zhong, Y.; Mao, G.; Liang, Y. PSO-sono: A novel PSO variant for single-objective numerical optimization. Inf. Sci. 2022, 586, 176–191. [Google Scholar] [CrossRef]
- Nguyen, H.; Moayedi, H.; Foong, L.K.; Al Najjar HA, H.; Jusoh WA, W.; Rashid AS, A.; Jamali, J. Optimizing ANN models with PSO for predicting short building seismic response. Eng. Comput. 2020, 36, 823–837. [Google Scholar] [CrossRef]
- Zhu, Y.; Li, G.; Wang, R.; Tang, S.; Su, H.; Cao, K. Intelligent fault diagnosis of hydraulic piston pump combining improved LeNet-5 and PSO hyperparameter optimization. Appl. Acoust. 2021, 183, 108336. [Google Scholar] [CrossRef]
- Mohamed, E.M.; Hassanm, A.M. Satellite Tracking Control System Using Optimal Variable Coefficients Controllers Based on Evolutionary Optimization Techniques. El-Cezeri 2023, 10, 326–348. [Google Scholar]
- Tang, Q.; Dai, J.; Ying, J.; Wu, G. Multi-UAV trajectory planning based on differential evolution of Levy flights particle swarm optimization. In Proceedings of the International Conference on Cyber Security, Artificial Intelligence, and Digital Economy (CSAIDE 2023), Nanjing, China, 3–5 March 2023; SPIE: Bellingham, WA, USA, 2023. [Google Scholar]
- Shingne, H.; Shriram, R. Heuristic deep learning scheduling in cloud for resource-intensive internet of things systems. Comput. Electr. Eng. 2023, 108, 108652. [Google Scholar] [CrossRef]
- Chang, J.M.; Chao, W.A.; Kuo, Y.T.; Yang, C.M.; Chen, H.; Wang, Y. Field experiments: How well can seismic monitoring assess rock mass falling? Eng. Geol. 2023, 323, 107211. [Google Scholar] [CrossRef]
- Wu, J.; Xie, D.; Yi, S.; Yin, S.; Hu, D.; Li, Y.; Wang, Y. Fractal Study of the Development Law of Mining Cracks. Fractal Fract. 2023, 7, 696. [Google Scholar] [CrossRef]
- Kennedy, J.; Eberhart, R. Particle swarm optimization. In Proceedings of the ICNN’95-International Conference on Neural Networks, Perth, WA, Australia, 27 November–1 December 1995. [Google Scholar]
- Shen, C.; Shi, Y.; Fang, J. Evaluation scheme design of college information construction based on a combined algorithm. PeerJ Comput. Sci. 2023, 9, e1327. [Google Scholar] [CrossRef] [PubMed]
- Sahoo, S.; Dalei, R.K.; Rath, S.K.; Sahu, U.K. Selection of PSO parameters based on Taguchi design-ANOVA-ANN methodology for missile gliding trajectory optimization. Cogn. Robot. 2023, 3, 158–172. [Google Scholar] [CrossRef]
- Zhou, B.; Li, S.; Zi, B.; Chen, B.; Zhu, W. Multi-Objective Optimal Design of a Cable-Driven Parallel Robot Based on an Adaptive Adjustment Inertia Weight Particle Swarm Optimization Algorithm. J. Mech. Des. 2023, 145, 083301. [Google Scholar] [CrossRef]
- Wang, C.; Li, W.; Zhao, K.; Shen, X. Fractional Order Control of Airborne Optoelectronic Platform Based on Improved PSO Algorithm. Electron. Opt. Control 2023, 30, 83–87. [Google Scholar]
- Geng, X.Y.; Li, Y.B.; Sun, Q. A Novel Short-Term Ship Motion Prediction Algorithm Based on EMD and Adaptive PSO-LSTM with the Sliding Window Approach. J. Mar. Sci. Eng. 2023, 11, 466. [Google Scholar] [CrossRef]


| Density (kg/m3) | P-Wave Velocity (m/s) | Elastic Modulus (GPa) |
|---|---|---|
| 2723 | 4888 | 36.68 |
| Iteration | Inertia Weight (ω) | c1 | c2 | First Optimal Fitness |
|---|---|---|---|---|
| 50 | 0.1 | 0.5 | 0.2 | 0 |
| 50 | 0.2 | 0.5 | 0.2 | 0 |
| 50 | 0.3 | 0.5 | 0.2 | 0 |
| 50 | 0.4 | 0.5 | 0.2 | 12 |
| 50 | 0.5 | 0.5 | 0.2 | 0 |
| 50 | 0.6 | 0.5 | 0.2 | 18 |
| 50 | 0.7 | 0.5 | 0.2 | 22 |
| 50 | 0.8 | 0.5 | 0.2 | 27 |
| 50 | 0.9 | 0.5 | 0.2 | 43 |
| 50 | 1 | 0.5 | 0.2 | 44 |
| 50 | 1.1 | 0.5 | 0.2 | 43 |
| 50 | 1.2 | 0.5 | 0.2 | 42 |
| 50 | 1.3 | 0.5 | 0.2 | 0 |
| 50 | 1.4 | 0.5 | 0.2 | 43 |
| 50 | 1.5 | 0.5 | 0.2 | 50 |
| 50 | 1.6 | 0.5 | 0.2 | 44 |
| 50 | 1.7 | 0.5 | 0.2 | 0 |
| 50 | 1.8 | 0.5 | 0.2 | 0 |
| 50 | 1.9 | 0.5 | 0.2 | 0 |
| 50 | 2 | 0.5 | 0.2 | 0 |
| ID | Functions | Ref. | c1 | c2 | |
|---|---|---|---|---|---|
| 1 | is the min inertia weight; is the max inertia weight; is the current fitness value of the particle; and represent the current minimum fitness of all particles and the average fitness value, respectively | [28] | 0.5 | 0.2 | |
| 2 | [2] | 0.5 | 0.2 | ||
| 3 | [2] | 0.5 | 0.2 | ||
| 4 | [29] | 0.5 | 0.2 | ||
| 5 | [29] | 0.5 | 0.2 |
| Specimen ID | Aspect Ratio | Air Pressure (MPa) | Strain Rate (−1) | Stress Equilibrium Index |
|---|---|---|---|---|
| 1 | 0.6 | 0.12 | 37.91 | 0.5078 |
| 2 | 0.6 | 0.15 | 65.13 | 0.6190 |
| 3 | 0.6 | 0.18 | 92.74 | 0.6939 |
| 4 | 0.6 | 0.24 | 145.62 | 0.5821 |
| 5 | 0.8 | 0.13 | 67.50 | 0.5665 |
| 6 | 0.8 | 0.17 | 97.18 | 0.5253 |
| 7 | 0.8 | 0.23 | 97.18 | 0.5253 |
| 8 | 0.8 | 0.24 | 114.26 | 0.6346 |
| 9 | 1 | 0.12 | 33.47 | 0.6627 |
| 10 | 1 | 0.14 | 91.83 | 0.5659 |
| 11 | 1 | 0.18 | 109.50 | 0.6496 |
| 12 | 1 | 0.23 | 106.79 | 0.4972 |
| 13 | 1.2 | 0.12 | 31.38 | 0.6352 |
| 14 | 1.2 | 0.15 | 55.94 | 0.6321 |
| 15 | 1.2 | 0.18 | 107.25 | 0.6390 |
| 16 | 1.2 | 0.24 | 112.48 | 0.5340 |
| 17 | 1.4 | 0.12 | 35.84 | 0.4884 |
| 18 | 1.4 | 0.14 | 40.97 | 0.5447 |
| 19 | 1.4 | 0.15 | 40.88 | 0.5453 |
| 20 | 1.4 | 0.18 | 125.27 | 0.6640 |
| 21 | 1.4 | 0.22 | 101.21 | 0.5896 |
| 22 | 1.4 | 0.24 | 111.13 | 0.6352 |
Disclaimer/Publisher’s Note: The statements, opinions and data contained in all publications are solely those of the individual author(s) and contributor(s) and not of MDPI and/or the editor(s). MDPI and/or the editor(s) disclaim responsibility for any injury to people or property resulting from any ideas, methods, instructions or products referred to in the content. |
© 2024 by the authors. Licensee MDPI, Basel, Switzerland. This article is an open access article distributed under the terms and conditions of the Creative Commons Attribution (CC BY) license (https://creativecommons.org/licenses/by/4.0/).
Share and Cite
Wang, X.; Xu, Z.; Guo, L. A New Data Processing Approach for the SHPB Test Based on PSO-TWER. Appl. Sci. 2024, 14, 3624. https://doi.org/10.3390/app14093624
Wang X, Xu Z, Guo L. A New Data Processing Approach for the SHPB Test Based on PSO-TWER. Applied Sciences. 2024; 14(9):3624. https://doi.org/10.3390/app14093624
Chicago/Turabian StyleWang, Xuesong, Zhenyang Xu, and Lianjun Guo. 2024. "A New Data Processing Approach for the SHPB Test Based on PSO-TWER" Applied Sciences 14, no. 9: 3624. https://doi.org/10.3390/app14093624
APA StyleWang, X., Xu, Z., & Guo, L. (2024). A New Data Processing Approach for the SHPB Test Based on PSO-TWER. Applied Sciences, 14(9), 3624. https://doi.org/10.3390/app14093624