Article

An Instance Segmentation Method for Insulator Defects Based on an Attention Mechanism and Feature Fusion Network

1
Key Laboratory of Modern Power System Simulation and Control & Renewable Energy Technology, Ministry of Education, Northeast Electric Power University, Jilin City 132012, China
2
School of Electrical Engineering, Northeast Electric Power University, Jilin City 132012, China
*
Author to whom correspondence should be addressed.
Appl. Sci. 2024, 14(9), 3623; https://doi.org/10.3390/app14093623
Submission received: 15 March 2024 / Revised: 20 April 2024 / Accepted: 22 April 2024 / Published: 25 April 2024
(This article belongs to the Special Issue Research on Deep Learning in Object Detection)

Abstract

:
Among the existing insulator defect detection methods, the automatic detection of inspection robots based on the instance segmentation algorithm is relatively more efficient, but the problem of the limited accuracy of the segmentation algorithm is still a bottleneck for increasing inspection efficiency. Therefore, we propose a single-stage insulator instance defect segmentation method based on both an attention mechanism and improved feature fusion network. YOLACT is selected as the basic instance segmentation model. Firstly, to improve the segmentation speed, MobileNetV2 embedded with an scSE attention mechanism is introduced as the backbone network. Secondly, a new feature map that combines semantic and positional information is obtained by improving the FPN module and fusing the feature maps of each layer, during which, an attention mechanism is introduced to further improve the quality of the feature map. Thirdly, in view of the problems that affect the insulator segmentation, a Restrained-IoU (RIoU) bounding box loss function which covers the area deviation, center deviation, and shape deviation is designed for object detection. Finally, for the validity evaluation of the proposed method, experiments are performed on the insulator defect data set. It is shown in the results that the improved algorithm achieves a mask accuracy improvement of 5.82% and a detection speed of 37.4 FPS, which better complete the instance segmentation of insulator defect images.

1. Introduction

Due to external erosion and internal overload during long-term operation, various faults will inevitably occur in insulators, and the stability of the power grid will also be affected by insulator defects. Regular inspection of the insulator’s operation in advance allows for the detection of equipment problems to a certain extent, thereby reducing the damage to the power grid caused by the insulators [1]. With traditional manual inspection finding it difficult to meet the increasing efficiency requirements in the power industry, an important trend is using robots for the promotion of power equipment inspection [2]. The replacement of manual inspection by automatic inspection is advantageous in reducing labor consumption, increasing the efficiency of inspection, and ensuring the stable operation of the power grid. The instance segmentation algorithm is one of the important technologies for inspection robots to obtain power equipment information quickly and accurately. This algorithm divides the image into several regions with unique properties and then extracts the target of interest from these regions. Compared with the bounding box extracted by the object detection algorithm, the instance segmentation algorithm has a more refined performance on the target boundary and removes redundant background information, making the algorithm more conducive to the acquisition of the target instance information. In complex situations such as target overlapping, the instance segmentation algorithm is more accurate in extracting the target information and more suitable for the accurate monitoring of power equipment, and it is an effective technical means for automatic inspection robots to identify and segment power equipment [3]. The targeted improvement, transplantation, and application of the instance segmentation algorithm in the power industry improves the accuracy of automatic inspection and enhances the ability to locate equipment faults in advance.
The instance segmentation algorithm has achieved many satisfactory results in traditional sectors such as transportation, agriculture, and medicine, but there are still many problems in some specific situations, including the occlusion between instances, the difficulty in detecting small instances, and the lack of data samples [4,5,6]. Especially in the case of insulator defect segmentation, there are characteristics such as a small target scale and large number of targets that lead to a low accuracy of those instance segmentation methods when applied to insulator image segmentation, while the speed is also limited by the number of targets [7]. These factors limit the accuracy and speed of instance segmentation algorithms. In order to better segment insulator images, an improved YOLACT algorithm for the detection and segmentation of insulator defects is proposed in this paper. Firstly, we modify the backbone network of MobileNetV2 [8] embedded with an scSE (Concurrent Spatial and Channel Squeeze & Excitation) mechanism [9] to improve the inference speed of the model. Secondly, the ECA-Net (Efficient Channel Attention Network) [10] module is introduced into the FPN module while the feature fusion method is also improved, so as to optimize the feature map. Finally, a bounding box loss function, RIoU Loss, which covers area deviation, center deviation, and shape deviation is designed to better limit the generation of redundant bounding boxes.
A literature review will be conducted in Section 2. In Section 3, the overall structure of the improved YOLACT algorithm and the improvements in each module are introduced. Section 4 follows the experiments carried out in this paper, including the data set, experimental environment, and parameter settings, as well as the analysis of the experimental results. In the Section 5, the research results and the prospects for future research are summarized.

2. Literature Review

Instance segmentation algorithms based on deep learning can generally be divided into two-stage algorithms and single-stage algorithms. Among the existing instance segmentation methods, most high-precision models are constructed based on the idea of two-stage object detection. SDS (Simultaneous Detection and Segmentation) [11] is the earliest instance segmentation algorithm, which simultaneously realizes object detection and semantic segmentation for the first time. Although it shows simplicity in its structure and is not ideal in segmentation results, it remains fundamental for the subsequent two-stage instance segmentation algorithm. Mask R-CNN [12] is one of the most typical two-stage instance segmentation algorithms, which adds a full convolution branch to Faster R-CNN [13] to generate segmentation results and uses a bilinear interpolation method to improve the segmentation accuracy of pixels in the feature region pooling layer in order to better detect small targets. With further research from Kirillov et al., improved algorithms based on Mask R-CNN have been continuously proposed, such as Mask Scoring R-CNN based on optimized mask evaluation criteria [14] and PointRent [15], which takes the image segmentation task as a rendering task. Meanwhile, along with the development of instance segmentation algorithms, the Detectron2 proposed by Facebook AI Research [16] provides a platform for researchers to share and download state-of-the-art algorithms, which could simplify researchers’ work. Most two-stage instance segmentation algorithms are top–down algorithms, following the operation logic of first detection and then segmentation. Correspondingly, there are some bottom–up instance segmentation algorithms that first segment and then cluster. SGN proposed by Liu et al. [17] performs pixel clustering from both horizontal and vertical dimensions to find instance components, and finally synthesizes these components into instance masks. SSAP [18] calculates the probability of two pixels hierarchically belonging to the same instance and proposes a cascading graph-partitioning module to generate instances in a coarse-to-fine order. Although the accuracy of these two-stage algorithms is relatively improved, it is still limited in special tasks, thereby making it difficult for these algorithms to further improve the segmentation speed due to their serial operation logic. Compared with two-stage methods, the single-stage detector YOLACT proposed by Bolya et al. [19] greatly improves the segmentation speed of the model by running object detection and semantic segmentation in parallel. Chen et al. [20,21] further studied the use of anchor-free designs such as center point mechanisms. Compared with the anchor-based instance segmentation algorithm, anchor-free models remove the limitation of anchors with a higher accuracy.
Along with the growing research on instance segmentation algorithms, researchers have also applied the instance segmentation algorithm to the power industry. Wang et al. [22] conducted the detection of insulator status by using Mask R-CNN to detect and segment insulator infrared images with a transfer learning strategy. Han et al. [23] embedded an attention mechanism in the encoding stage of U-Net, improving the accuracy of insulator monitoring. Ma et al. [24] used the foreground segmentation of RGB-T images of power equipment to enhance the mask extraction of regular images, realized automatic mask annotation, and improved the efficiency of data annotation. Li et al. [25] proposed an insulator infrared image segmentation algorithm based on dynamic masks and box annotation, which alleviates the problems of inaccurate positioning, low recognition efficiency, and segmentation difficulties in insulator images against complex backgrounds.
Researchers have also carried out corresponding research on the task of insulator defect detection and segmentation. Wang et al. [26] proposed an insulator defect detection algorithm based on ResNeSt and a multi-scale region proposal network, and used data augmentation to obtain expanded data, achieving a better accuracy performance compared with other detection networks. Qiu et al. [27] established an insulator image data set through GraphCut and Laplace sharpening, while the MobileNet backbone was used to improve the real-time performance of YOLOv4 and a transfer learning strategy was used to better train the model. Antwi-Bekoe et al. [28] proposed and used a triplet attention mechanism (TAM) in a feature extraction network to optimize the attention to target outliers, which improved the detection performance of defective insulators with low extra costs. Xuan et al. [29] proposed a model based on the CenterMask algorithm to realize the intelligent identification of insulator defects, in which an improved VoVNet was adopted as the backbone network and SAG-Mask was added to FCOS to extract the mask image of the insulator, achieving an improved identification efficiency for insulator defects. These methods all have their advantages, but they have not achieved good performances in both speed and accuracy. In order to achieve the fast and accurate instance segmentation of insulator defects, an improved YOLACT algorithm is proposed in this paper, which improves segmentation speed as well as segmentation accuracy.
The main contributions of this paper are as follows:
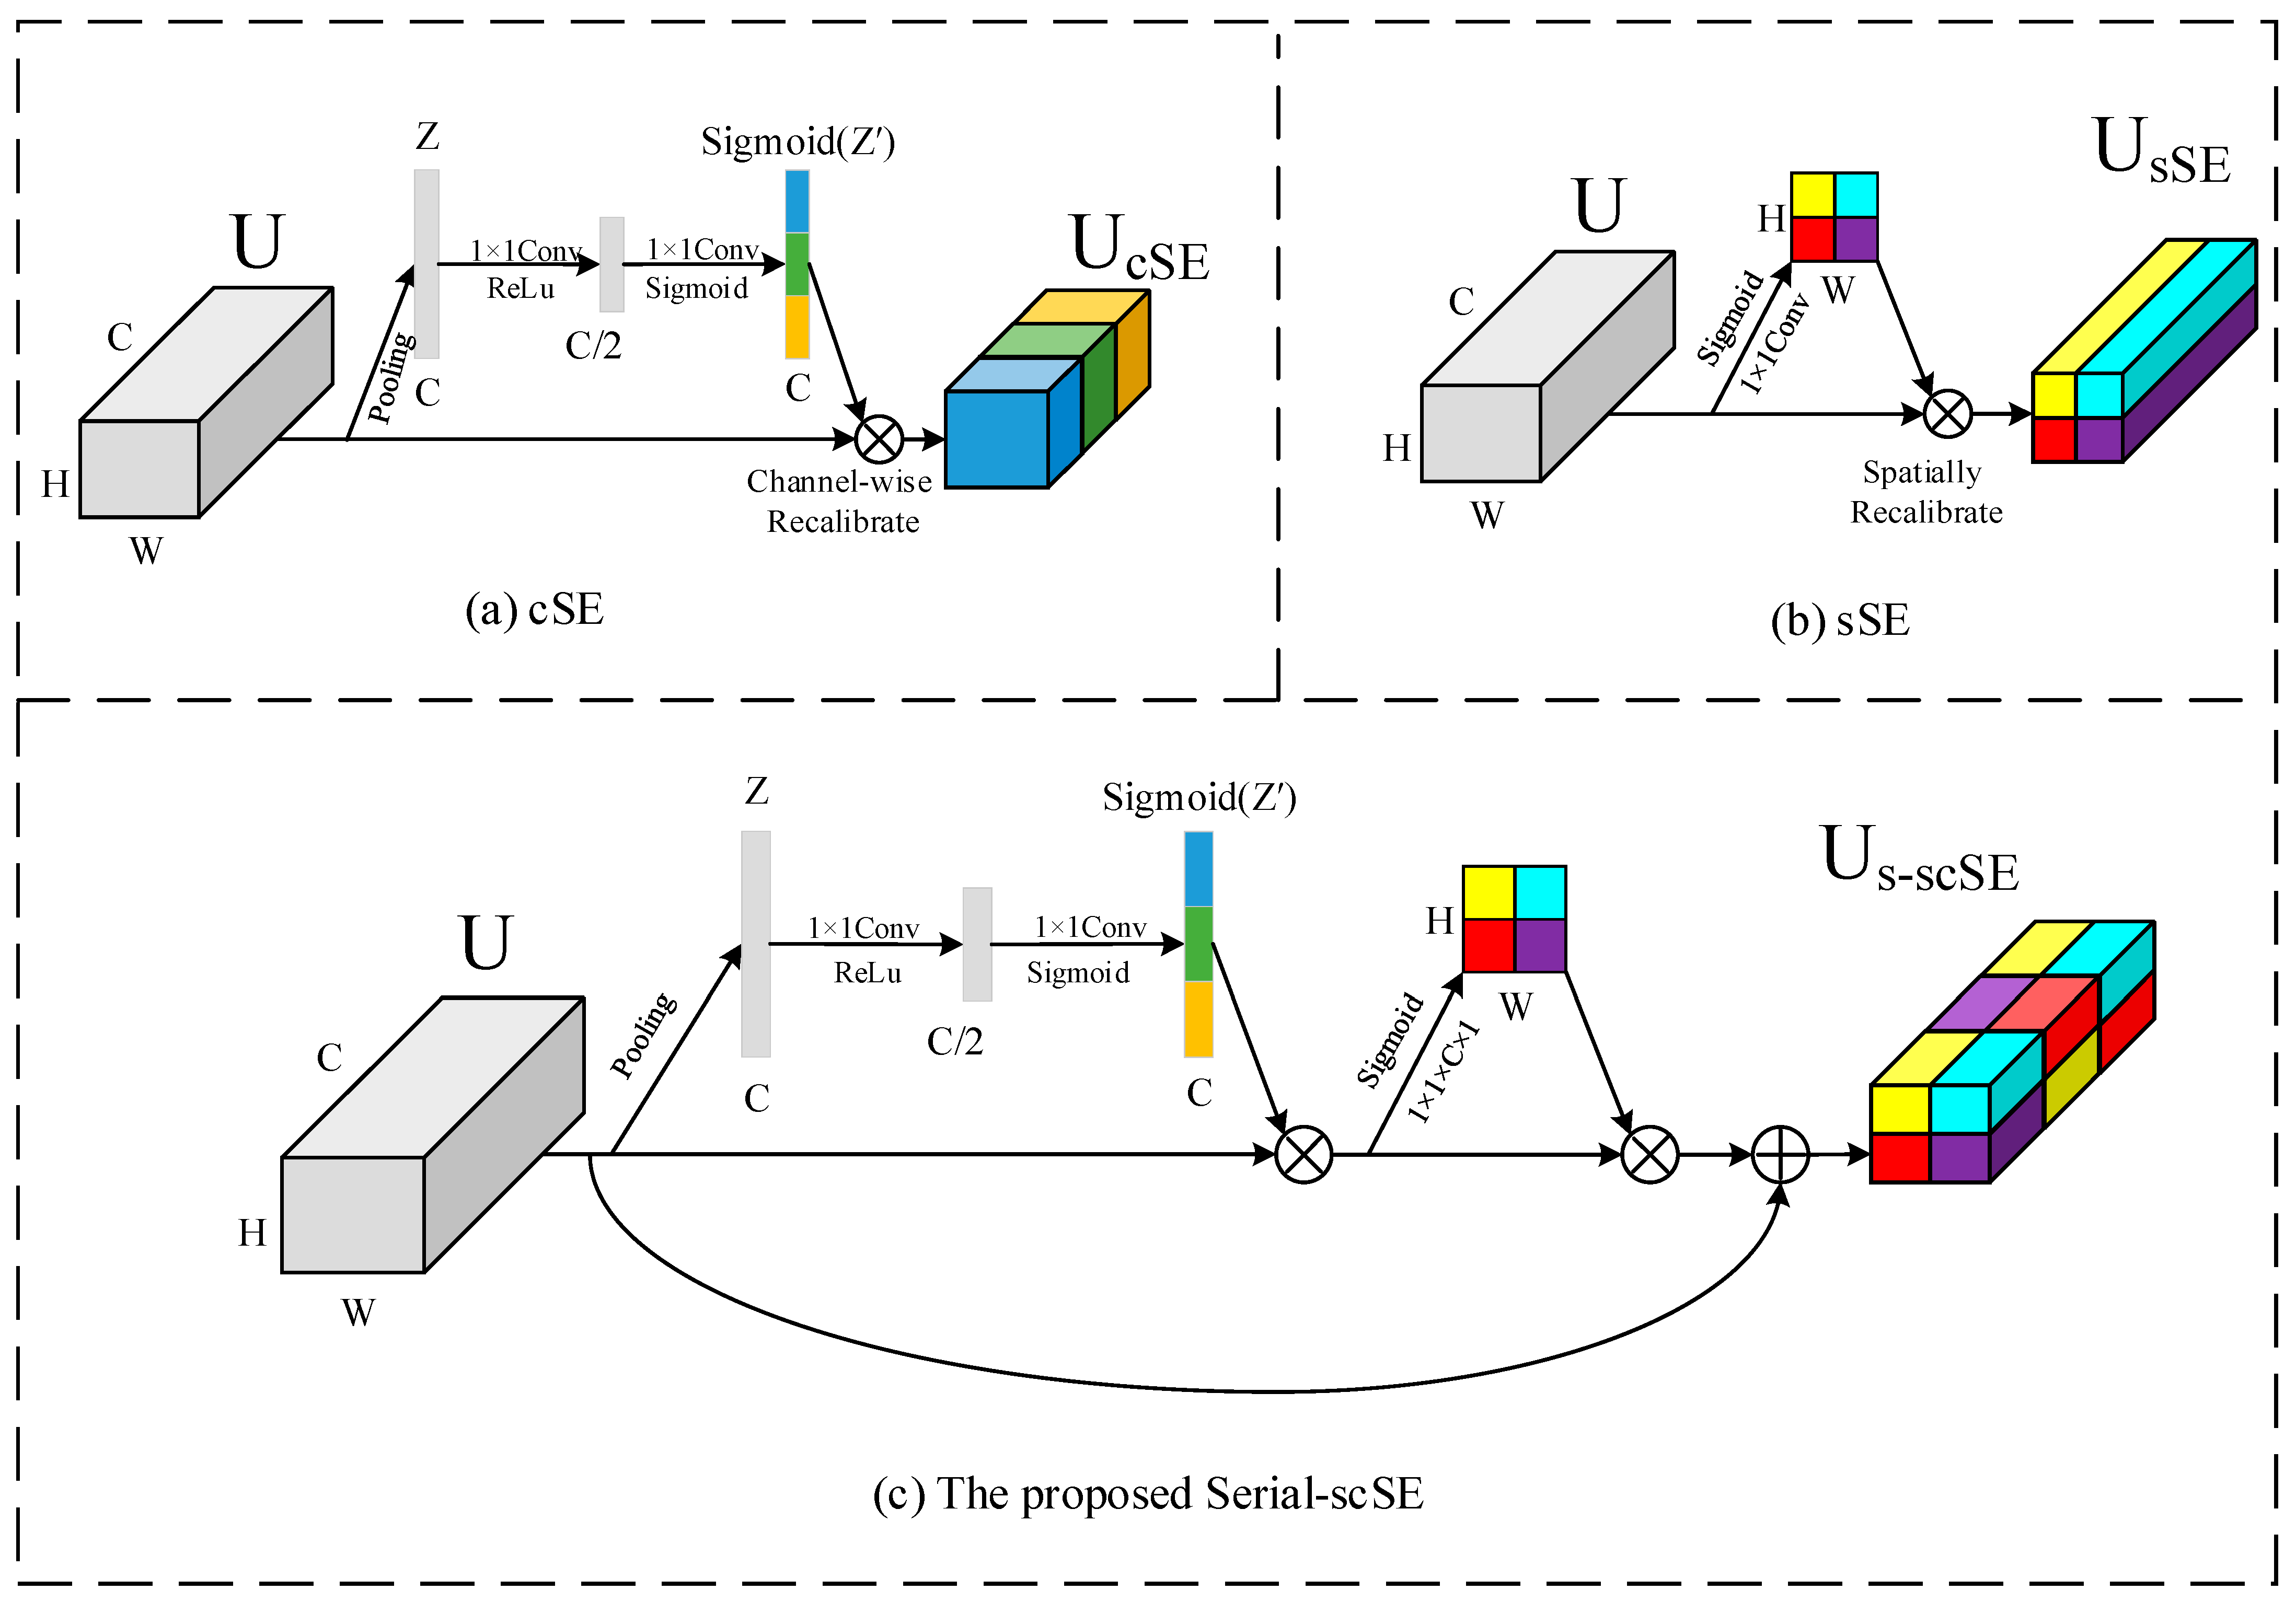
  • The backbone network is modified to MobileNetV2, aiming to greatly reduce the computation of the model. Meanwhile, an improved scSE module with a serial structure and skip connections is proposed and embedded into the MobileNetV2 to enhance the feature extraction.
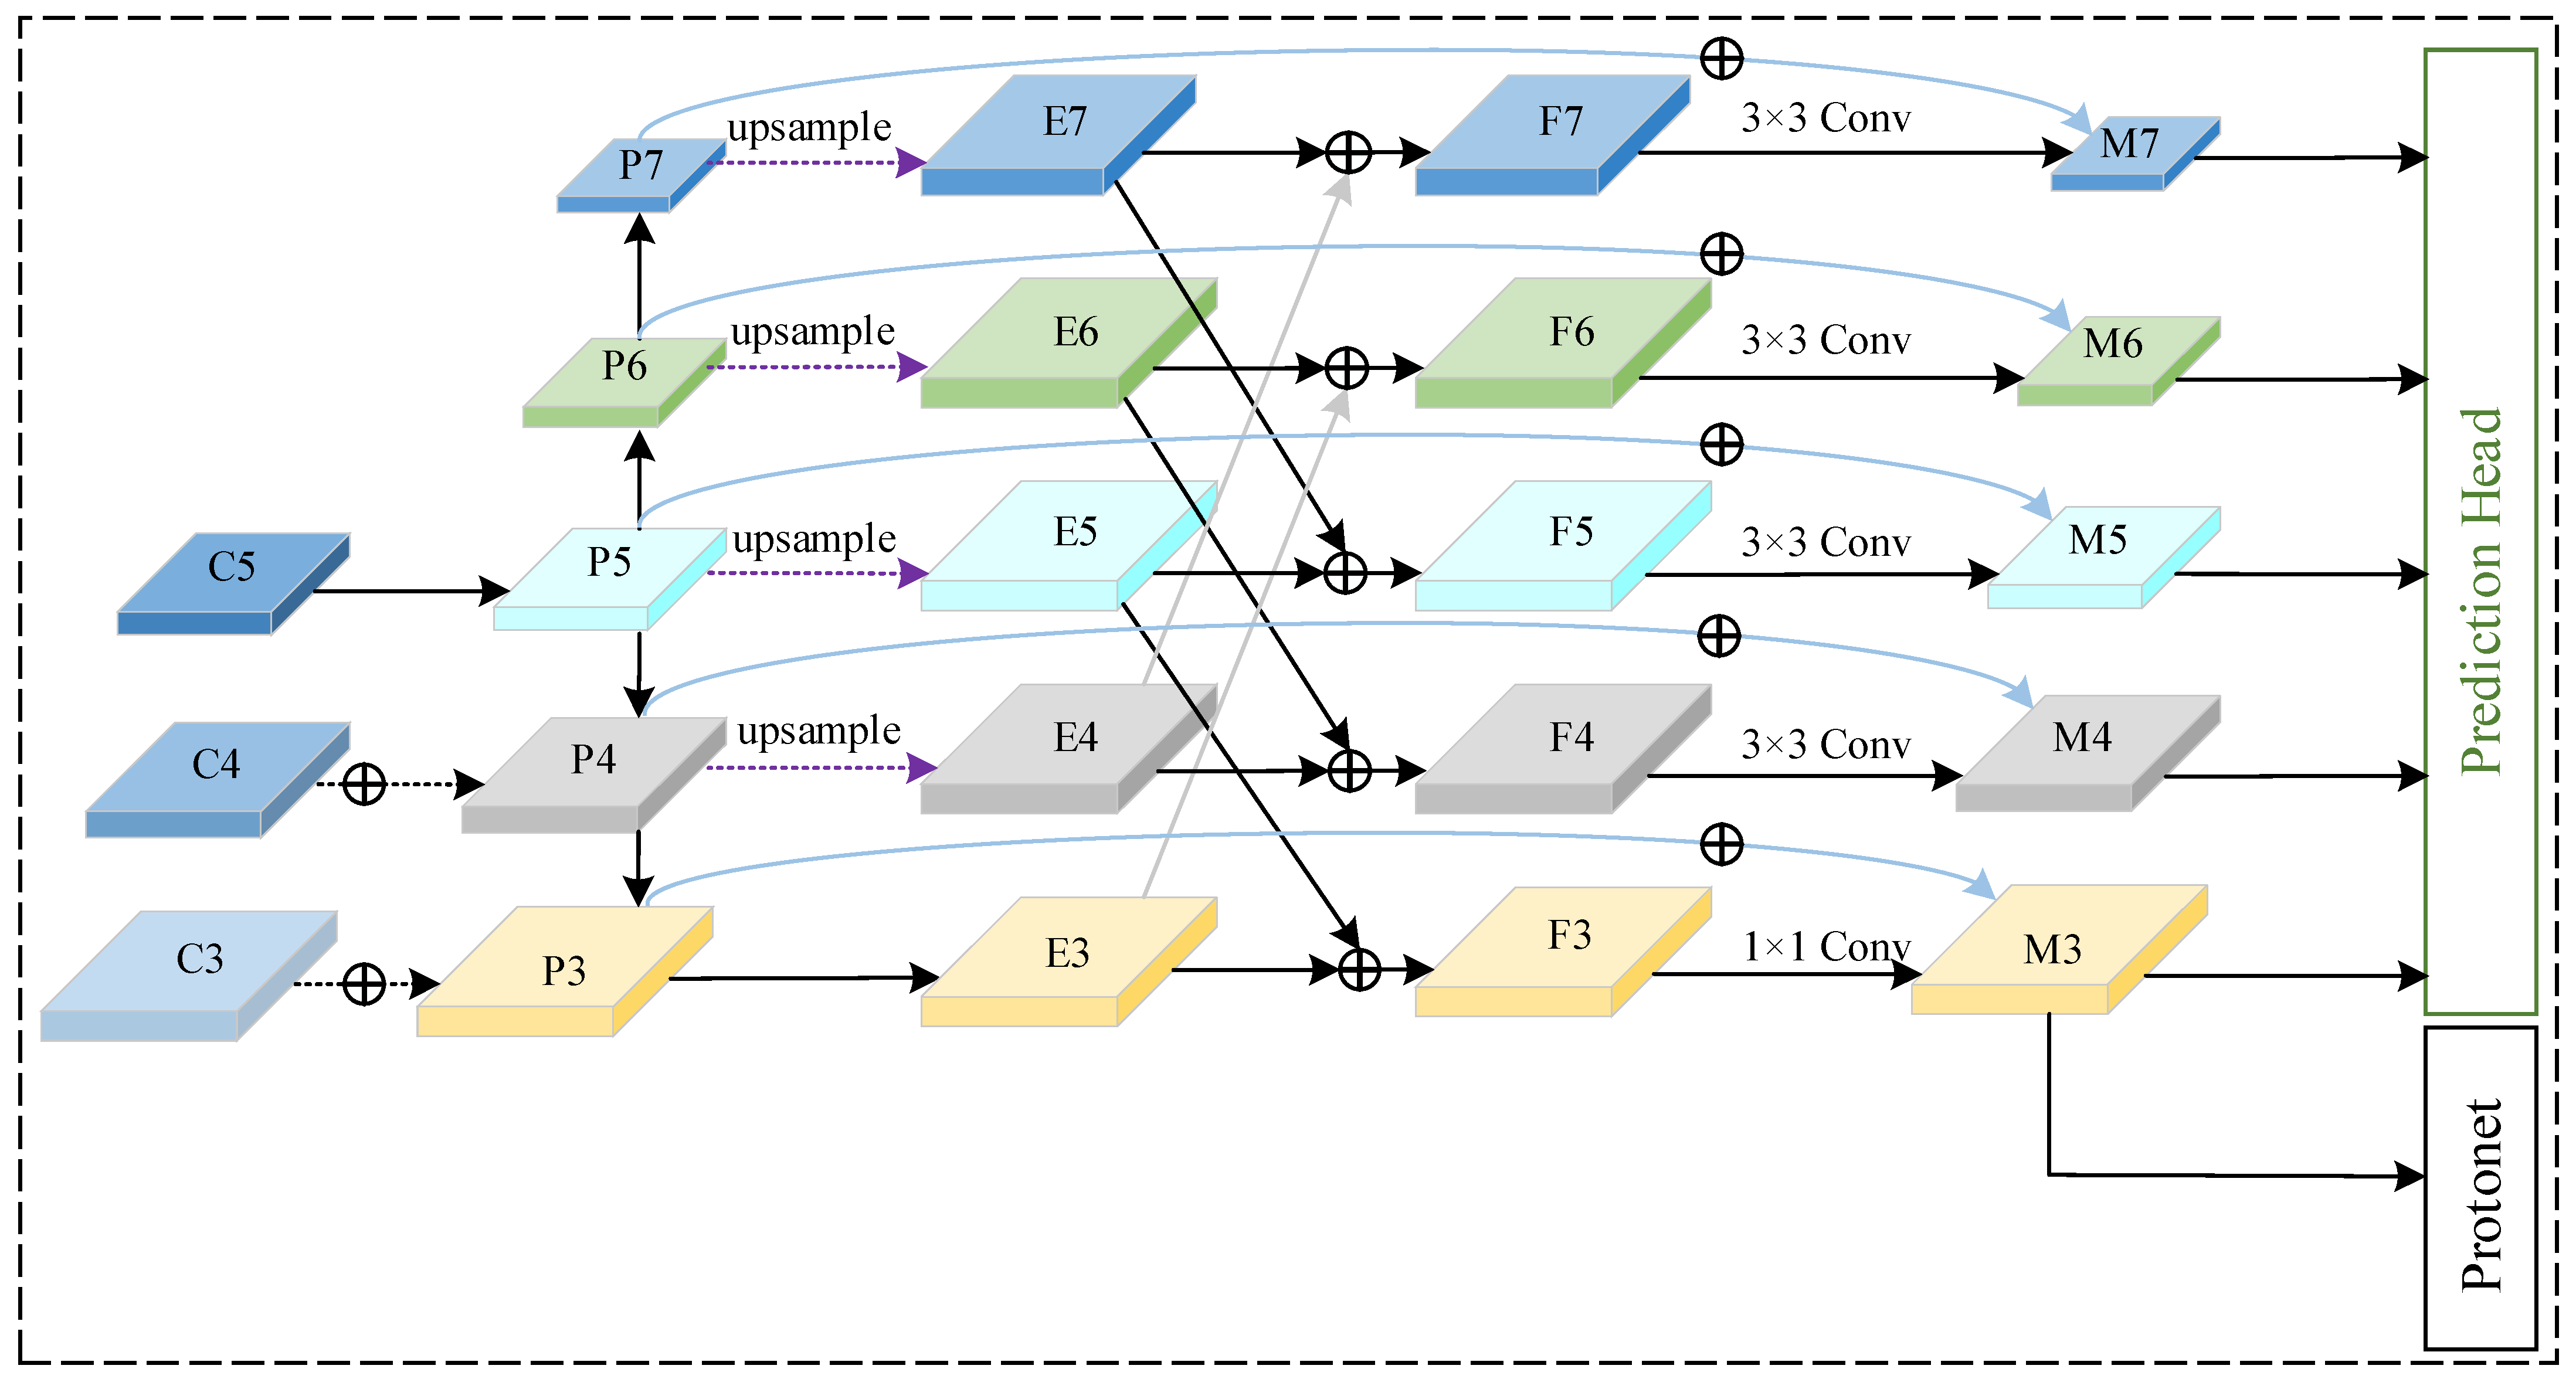
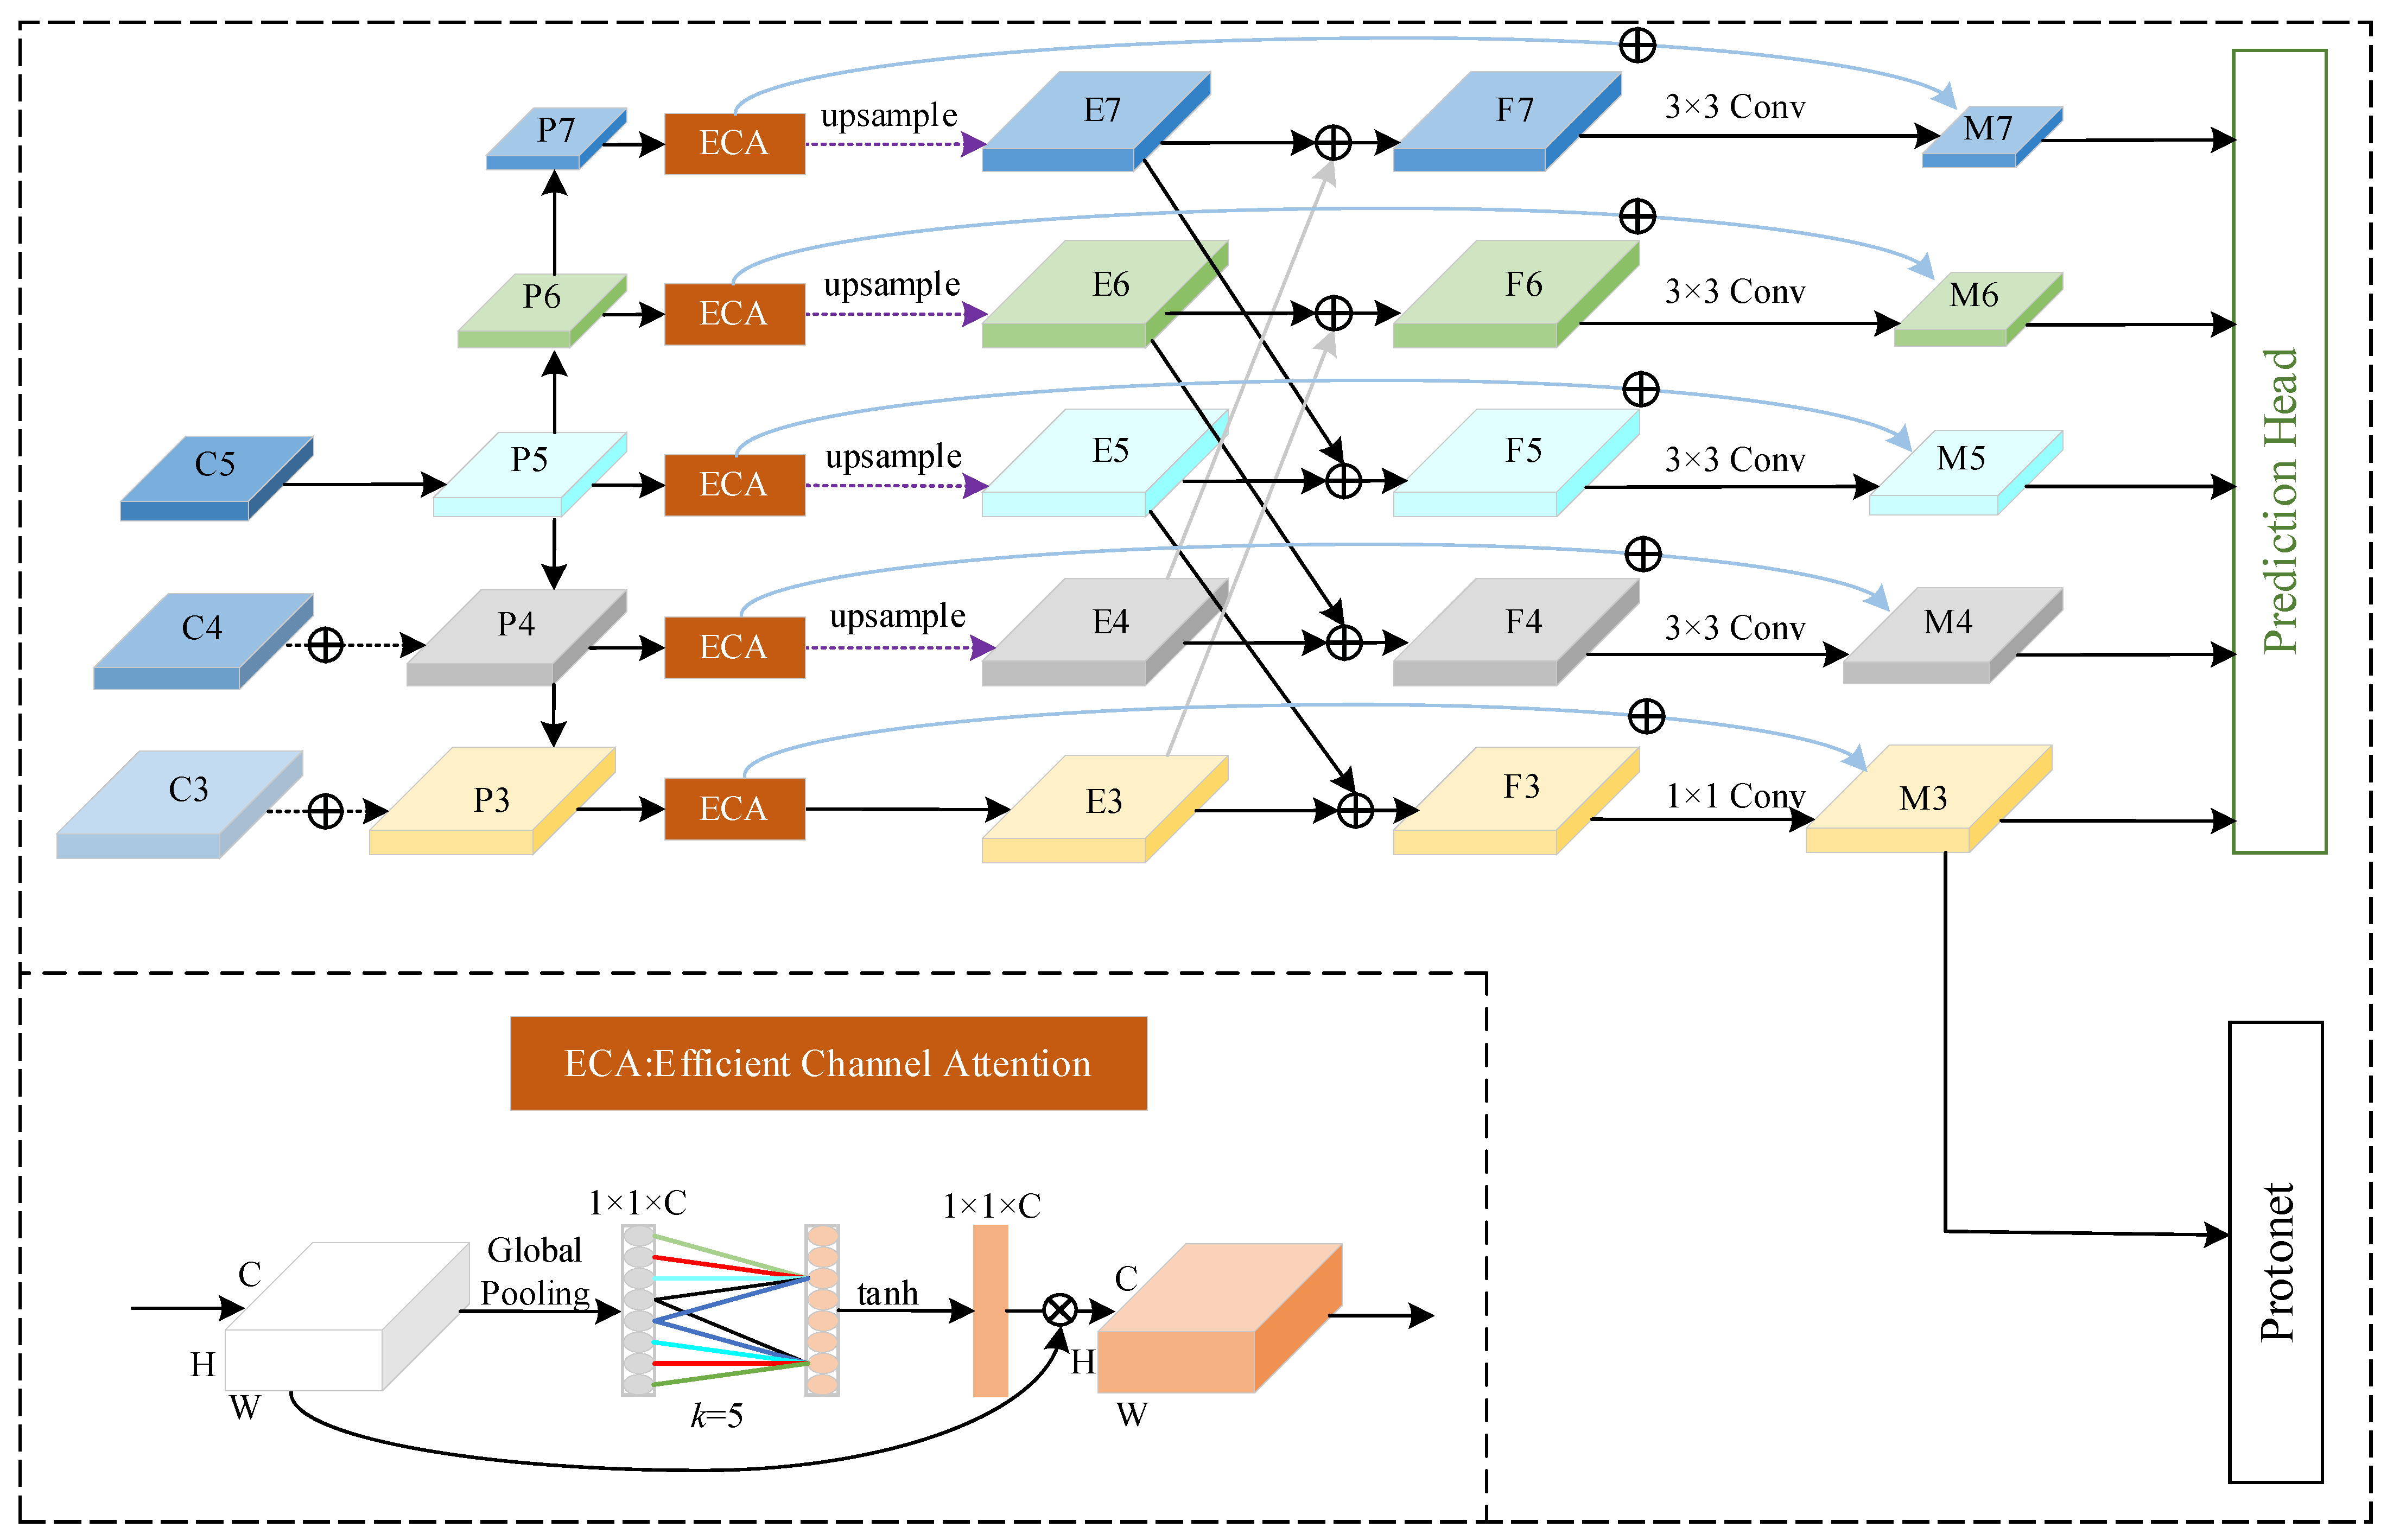
  • A feature fusion structure is proposed in the FPN. We first process P3–P7 with ECA-Net and up-sample the feature maps to the same size. Then, P3 and P4 are added to the top layers, while P5–P7 are added to the bottom layers across double layers. After the feature maps are fused, they are down-sampled to the original size for the next modules in the model.
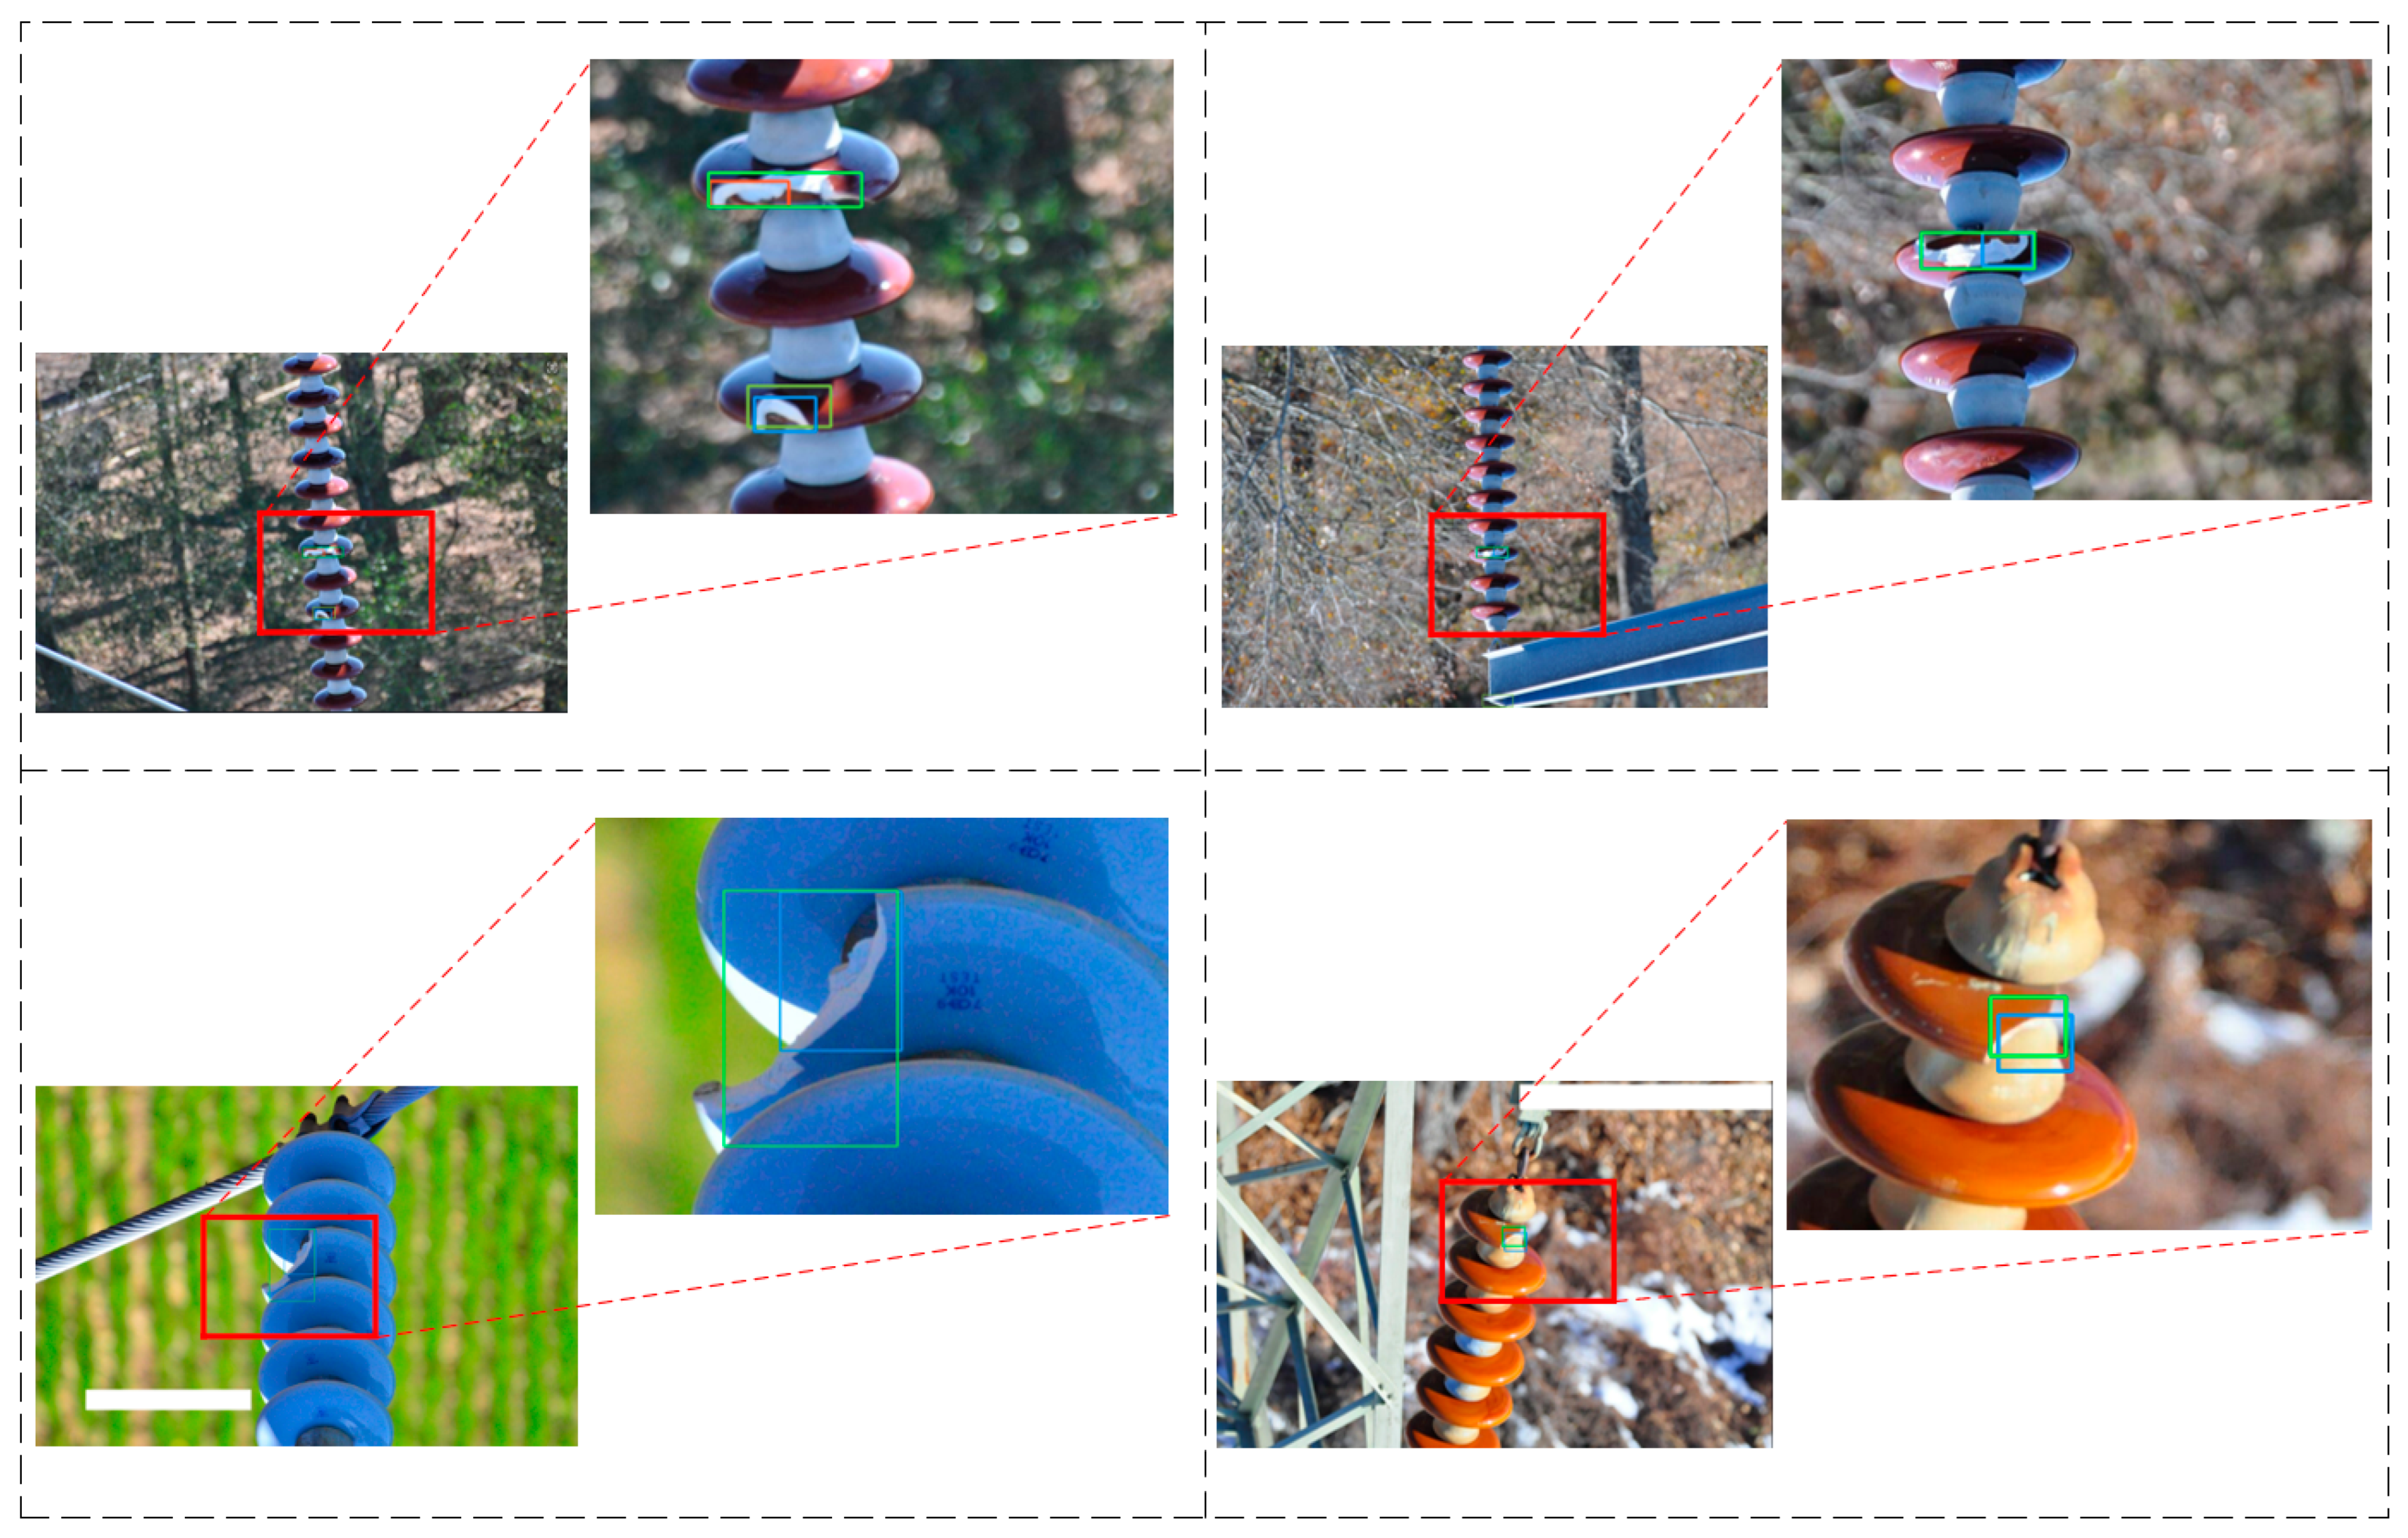
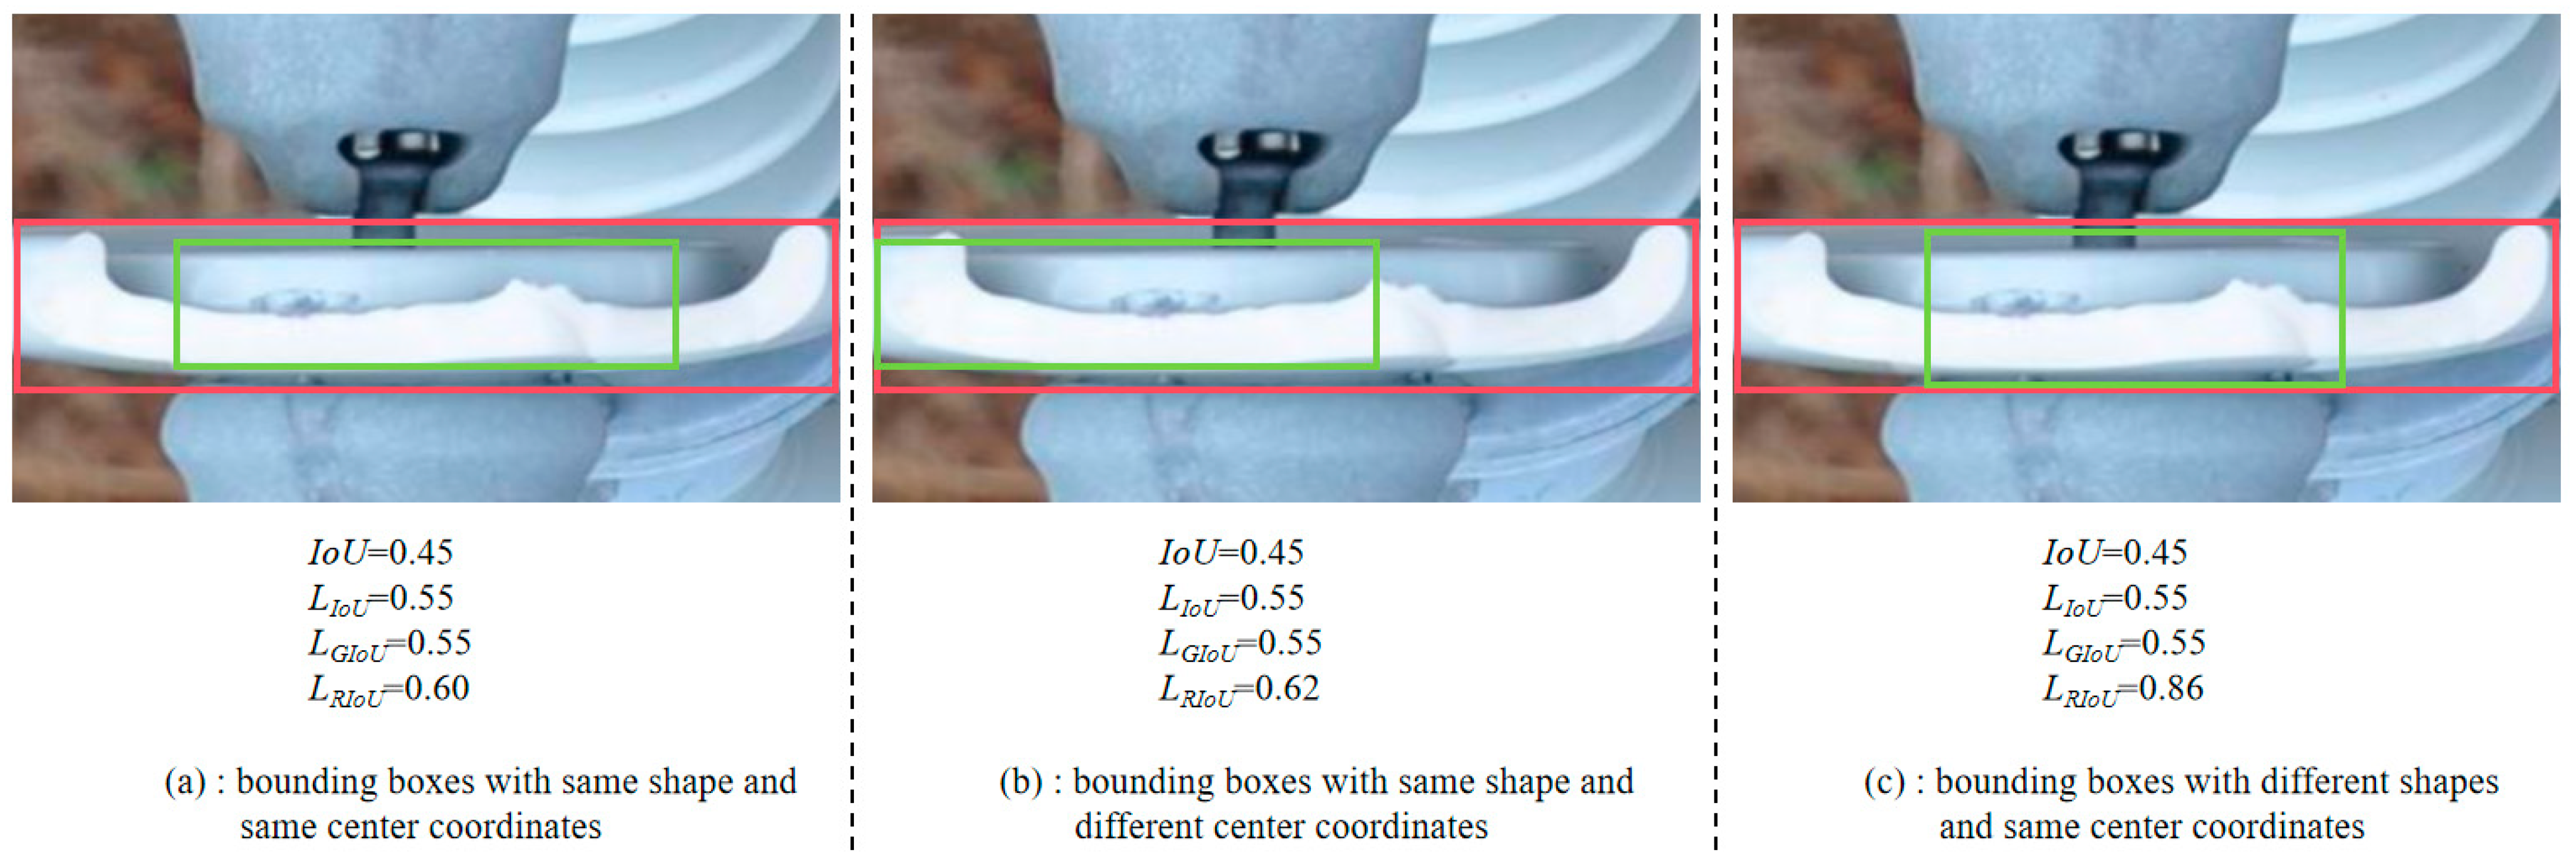
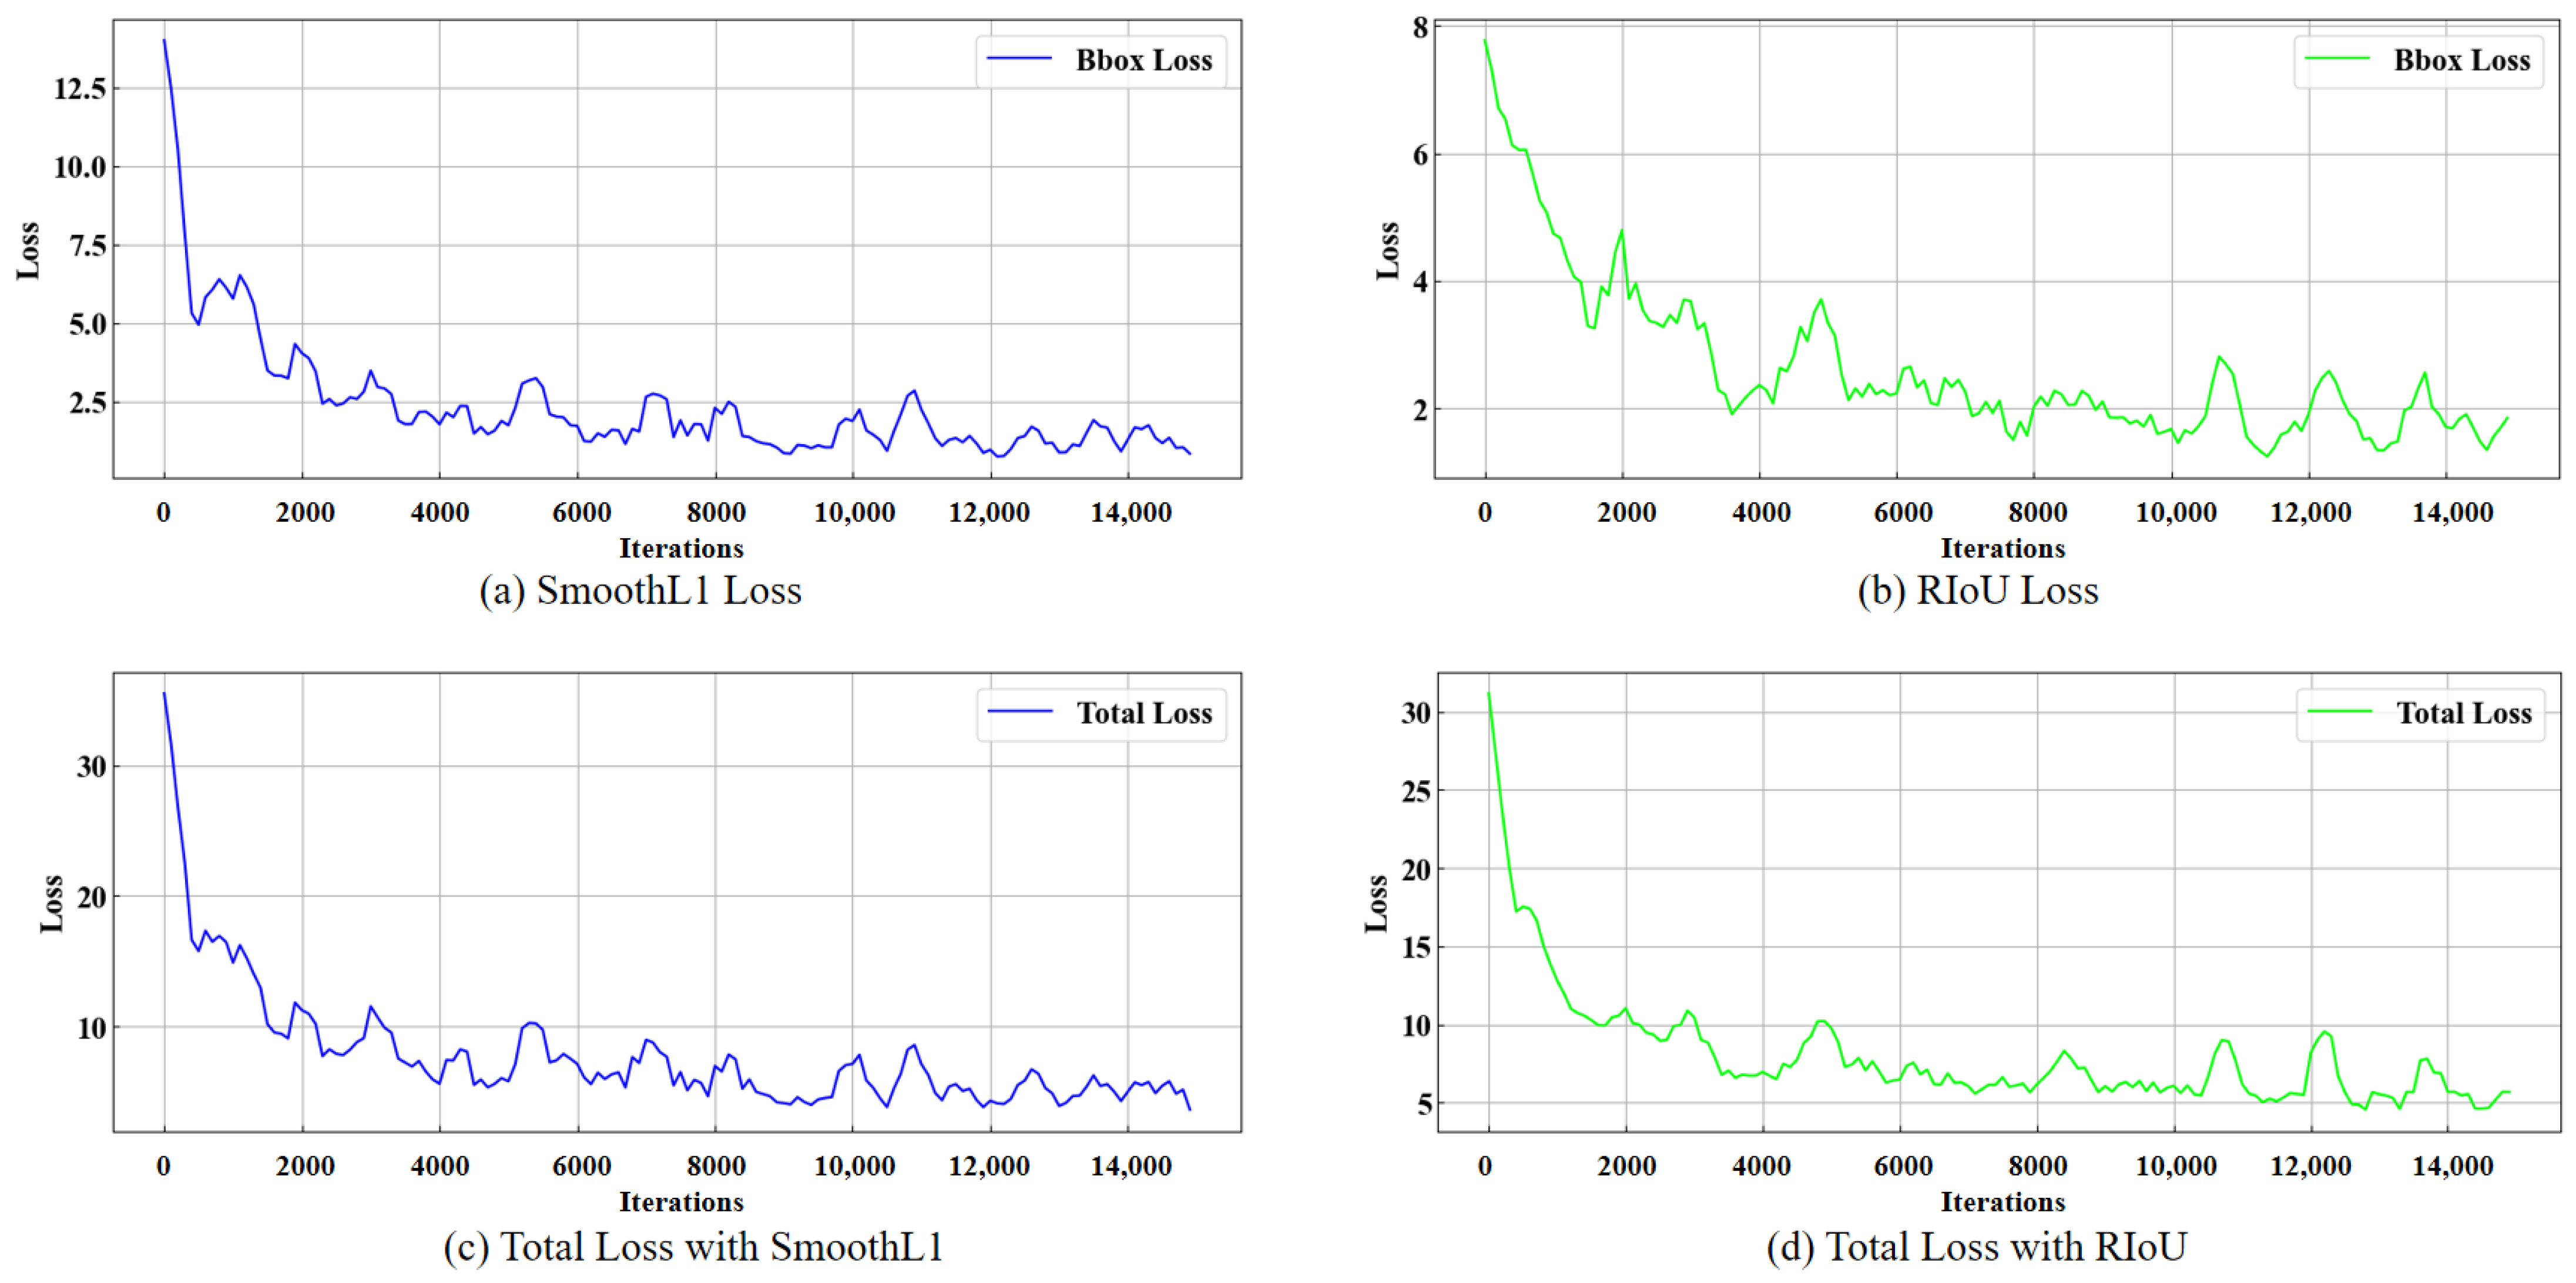
  • A bounding box loss function that covers the area deviation, center deviation, and shape deviation is designed to better limit the generation of redundant bounding boxes, namely RIoU Loss. The model is trained to generate bounding boxes more accurately with the new loss function.

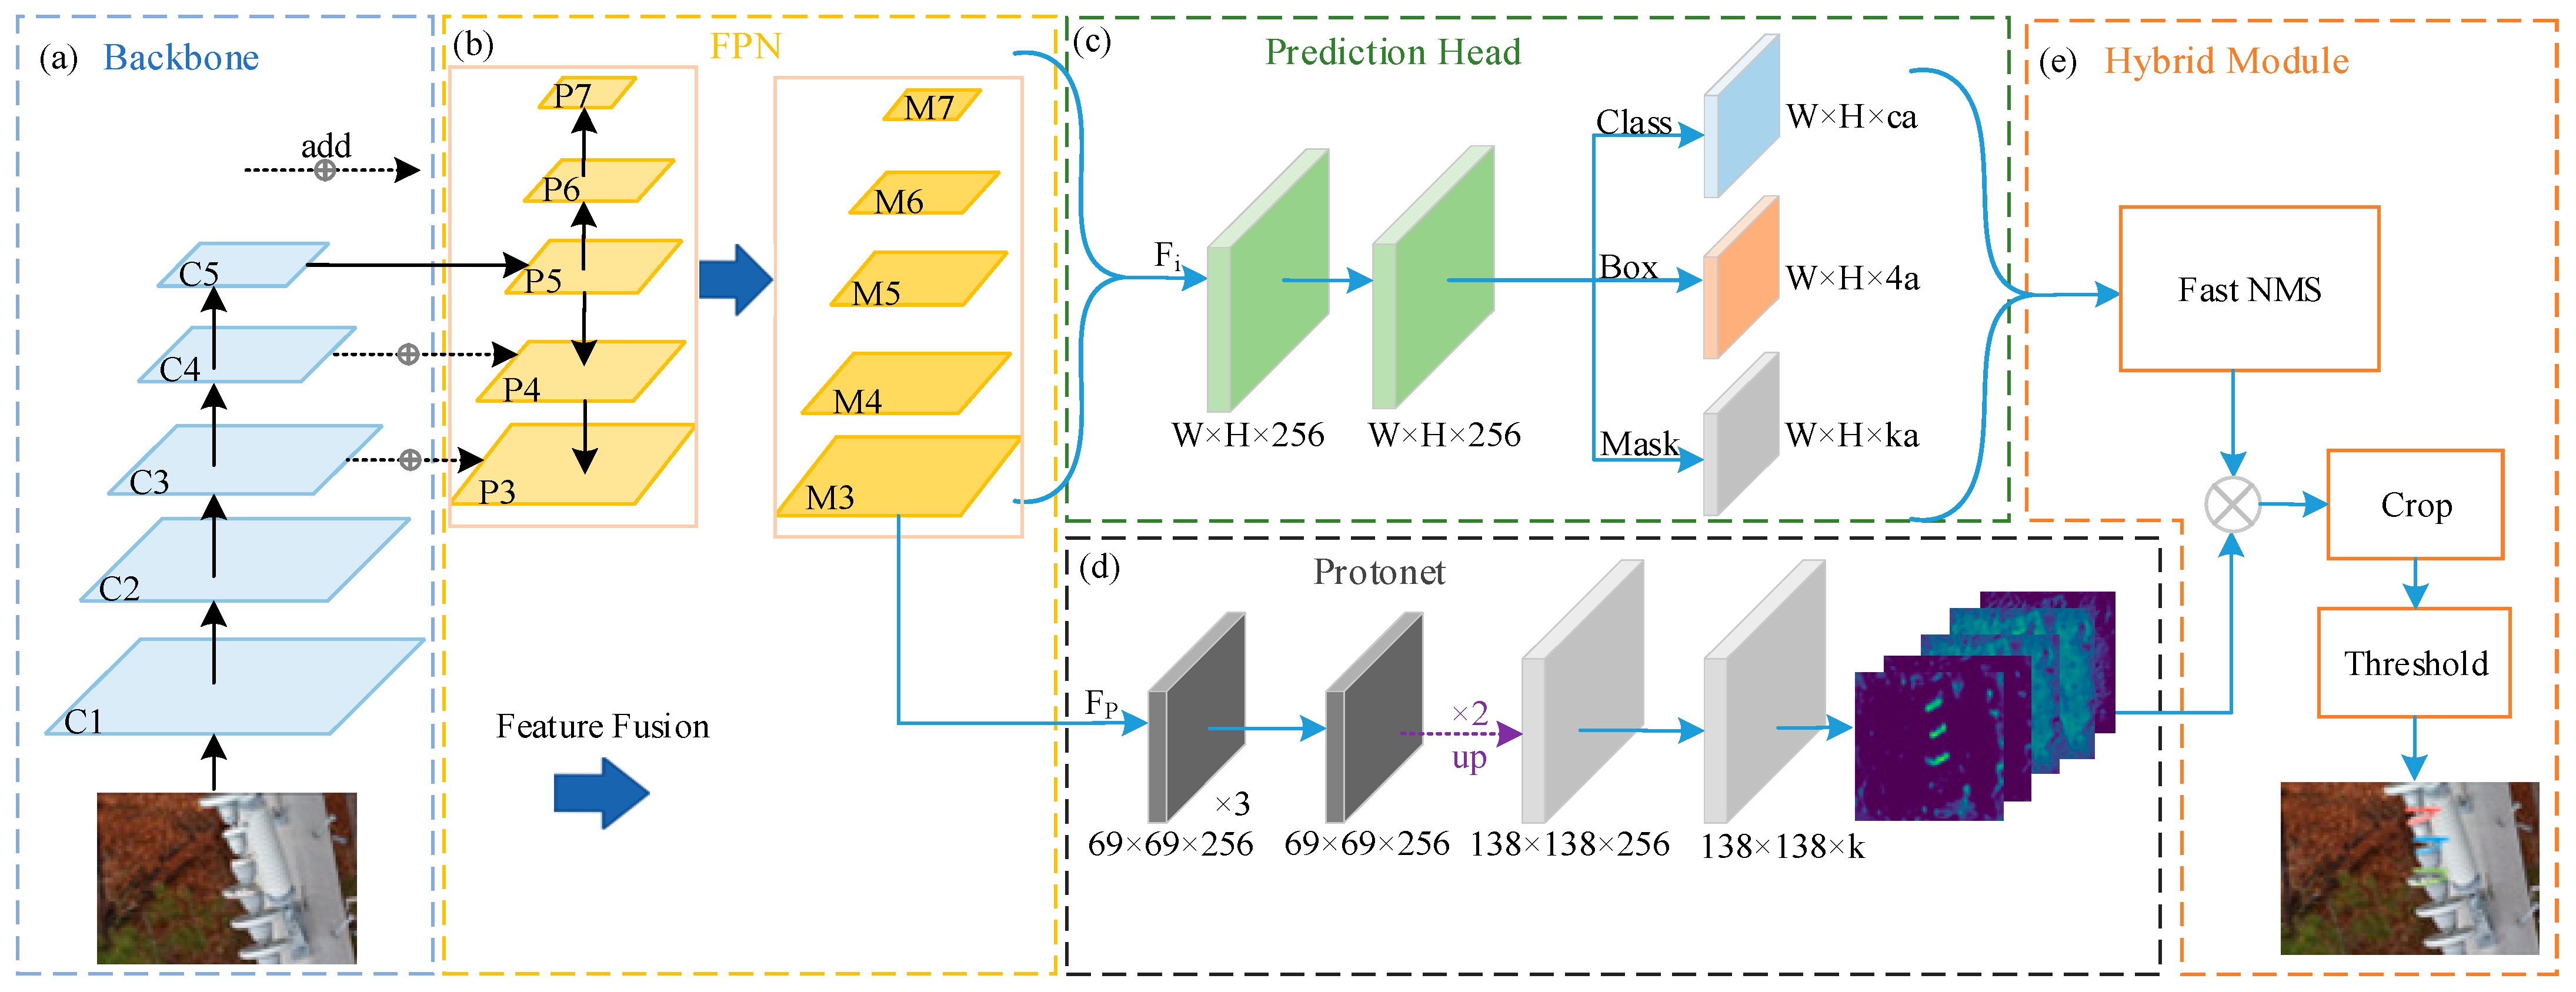
3. Instance Segmentation Framework Based on Improved YOLACT

YOLACT (You Only Look At CoefficienTs) is a simple and fast real-time instance segmentation model. The overall architecture design is lightweight. Its segmentation accuracy and speed are well-balanced, which makes it convenient for deployment on edge devices. The YOLACT network consists of two parallel processing branches: the mask prediction branch, Protonet (prototype mask branch), and the object detection branch prediction head. The Protonet branch learns the feature representation of the target instance in the image and generates prototype masks for a single instance using a fully convolutional network structure, which contains the semantic and shape information of the target instance. The prediction head predicts the corresponding mask coefficients for each candidate box to obtain the position of instances in the image. The two branches perform parallel calculations, greatly improving the running speed of the entire model. Finally, the mask coefficients are fused with the prototype mask through matrix multiplication to obtain the final prediction result, shortening the inference time of the model and meeting real-time requirements. Despite its balanced performance in real-time instance segmentation, YOLACT has a lower accuracy compared to two-stage instance segmentation algorithms, while YOLACT’s detection speed can still be improved, as it does not use a lightweight backbone network [30]. Therefore, this paper will mainly improve the network from the perspective of accuracy, while also improving the inference speed of the network. The overall network structure of the improved YOLACT is shown in Figure 1.
The improved YOLACT model consists of five parts: (a) a backbone network, (b) a feature fusion network, (c) a head network, (d) a prototype mask network, and (e) a hybrid module. The backbone used in (a) is MobileNetV2, and the modified FPN module will be introduced in the next section. In the outputs of three branches of (c) the head network, a is the number of anchor boxes, c is the number of categories, and k is the number of prototype masks. For the quick and accurate segmentation of insulator images, we improve the backbone network, FPN module, and bounding box loss function, respectively, taking the characteristics of insulator defect segmentation into consideration, so as to improve the segmentation performance of the model.

3.1. MobileNetV2 Embedded with Serial-scSE Attention Module

The original YOLACT network used the ResNet-101 deep residual network as its feature extraction network, which not only ensured the accuracy of YOLACT in detection, but also induced huge computational complexity. In order to reduce the computational complexity of the backbone network, this paper introduces MobileNetV2, which reduces the parameter and computational complexity of the model by using deep separable convolutions and linear bottlenecks. Compared with ResNet-101, although MobileNetV2 significantly reduces the number of parameters and computation, it does not lose much accuracy [8]. Considering the speed and accuracy performance of the network, it is chosen as the new backbone network. In order to ensure the accuracy of the model to meet the task of insulator segmentation, this paper introduces an attention mechanism for the backbone network. Attention mechanisms have shown outstanding performances in improving the performance of convolutional networks, but most attention methods sacrifice model speed for a better accuracy performance. To balance the accuracy and speed, an S-scSE (Serial-scSE) module based on the scSE mechanism [9] is designed and embedded into MobileNetV2. The structure of Serial-scSE is shown in Figure 2.
The original scSE block runs two sub-modules independently and in parallel, and sums the feature maps output by the two modules to obtain the final feature map UscSE. Due to the small size of the insulator defect, the detection accuracy is very sensitive to the spatial information of the feature map. Referring to the structure of CBAM [31], this paper improves the scSE into a serial structure so that the feature map is first processed by the channel attention module of the cSE (Spatial Squeeze and Channel Excitation Block) and then transmitted to the sSE (Channel Squeeze and Spatial Excitation Block) module. As shown in Figure 2, the Serial-scSE attention structure consists of cSE and sSE through serial connection.
As a set of feature maps U is input into the S-scSE module, supposing that the size of the input feature maps is H × W × C, they are firstly processed by the channel attention module cSE. The cSE first converts the feature maps into another form: U = [u1, u2, u3, …, un], where U ∈ RH×W×C and ukRH×W×1, then generates a weight vector of Z ∈ R1×1×C through the mixed pooling layer, which is global average pooling in the original scSE. In the defect detection, most of the defect parts have a higher brightness, and the mixture of GAP (global average pooling) and GMP (global maximum pooling) is used to better focus on the defective part in the insulator defetct image. The element zk in Z can be calculated by Equation (1):
z k = α × 1 H × W i H i W u k ( i , j ) + β × M a x ( u k ( i , j ) )
where α and β are the weights of GAP and GMP. Z is then converted into a new vector Z′ through two 1 × 1 convolution layers, and the non-correlation is increased by the Sigmoid and normalization layer to obtain Sigmoid(Z′). Finally, U is calibrated by Sigmoid(Z′) to obtain the feature map UcSE. The calculation can be expressed as follows:
U c S E = [ σ ( z 1 ) u 1 , σ ( z 2 ) u 2 , σ ( z 3 ) u 3 , , σ ( z c ) u c ]
where σ(z′k) represents the relative importance of channel k. After the feature maps are processed by cSE, they are transmitted into the sSE module.
The goal of the sSE module is to recalibrate the importance of each element in every channel. sSE also first transforms the feature maps into the form: U = [u1,1, u1,2, u1,3, …, uH,W], where ui,jR1×1×C. After 1 × 1 convolution, the obtained weight matrix is represented as W, and then after being processed in the Sigmoid and normalization layer, it is multiplied by each element with the original feature map to obtain UsSE. The calculation is as shown in Equation (3):
U s S E = [ σ ( W 1,1 ) u 1,1 , σ ( W 1,2 ) u 1,2 , σ ( W 1,3 ) u 1,3 , , σ ( W H , W ) u H , W ]
where Wi,j represents the relative importance of each element in a single channel. Furthermore, residual connection is constructed between U and UsSE to prevent gradient disappearance.
The output feature map US–scSE can be expressed as:
U S s c S E = U + U s S E ( U c S E )
where U is the input feature map, UcSE is the feature map of the channel attention output with global maximum pooling, and UsSE(UcSE) is the output feature map of spatial attention. It is added to the original feature map in the end to obtain the final output.

3.2. Modified FPN Based on Feature Fusion

After realizing the light weight of the model, in order to further optimize its accuracy performance, this paper improves the feature fusion network in the model. The FPN network will fuse the features of different feature layers, and then predict on the fused feature map. In the original YOLACT model, the FPN module passes the P3–P7 output feature maps to the target detection module, and the P3 feature map is directly used as the input for the prototype mask branch. The high-level feature map has rich semantic information and the use of high-level feature maps is conducive to the network’s understanding of the target. In the original YOLACT algorithm, the P3 layer, which is the input of the prototype mask branch, does not use the high-level feature information, while P5–P7 do not use the bottom-level information. This design has the disadvantage of using the feature information, which limits the accuracy of the model’s detection and segmentation. In order to make full use of the information of each layer, a feature fusion structure is proposed. Figure 3 shows the structure of FPN with feature fusion.
As shown in Figure 3, the P4–P7 feature map is firstly up-sampled by bilinear interpolation to achieve the same size as P3, which is recorded as E3–E7. Then, they are weighted and added to another layer. Specifically, E5, E6, and E7 are added to E3, E4, and E5, respectively, which brings the high-level information to the lower layer. Meanwhile, E3 and E4 are added to E6 and E7, enhancing the location information of the top-layer maps. After the E3–E7 maps are obtained, the next step is to down-sample them back to their original size, in which we use convolution and the Sigmoid layer, generating M3–M7 maps. Finally, the M3–M7 maps are passed to the Prediction module and Protonet. However, considering that the scale span from the P3 feature layer to the P7 feature layer is too large, skip connection is used between Pi and Mi in order to avoid the gradient disappearance or gradient explosion that may occur in training. The calculation process of Mi can be expressed by the following formula:
M i = S i g m o i d ( P i + C o n v ( α i + 2 × u p s a m p l e ( P i + 2 ) + P i ) ,               if     i = 3 , 4 , 5 S i g m o i d ( P i + C o n v ( α i 3 × u p s a m p l e ( P i 3 ) + P i ) ,                 if     i = 6 , 7      
where Conv represents convolution using 3 × 3 or 1 × 1 kernels and different steps, upsample represents up-sampling the Pi feature map to the size of P3, and αi represents the weight hyper-parameter of the i-th layer.
The new feature fusion method improves the input maps of the detection module and proto-mask module by using feature fusion, but with an additional attention module added, the feature maps could be further improved. Therefore, this paper introduces ECA-Net to optimize the overall quality of the feature map output by the FPN. ECA-Net proposes a dimensionless local cross-channel interaction strategy, which performs the appropriate cross-channel interactions while reducing the model complexity and maintaining its accuracy performance [10]. The process of the ECA structure is to first perform global pooling, then pass through a partial connection layer FC[k], and finally activate through a layer of Sigmoid. FC[k] is a connection operation of k nodes, which is not a conventional full connection, and it is implemented in the code through one-dimensional convolution. The overall operation of ECA can be expressed as:
E C A ( x ) = x × σ ( C o n v 1 d 1 × 1 ( G M P ( x ) ) )
where x represents the input tensor, σ is the Sigmoid activation function, and C o n v 1 d 1 × 1 represents one-dimensional 1 × 1 convolution. GMP represents global maximum pooling, as we use it instead of GAP (global average pooling) in this paper. Due to the fact that all levels of the feature maps output by FPN will be used by subsequent modules, the ECA module is placed after each feature layer Pi output by the original FPN in this paper. The improved feature fusion module and ECA calculation process are shown in Figure 4.

3.3. Improved Bounding Box Loss Function for Redundant Boxes

The original YOLACT network uses Smooth L1 as the loss function for bounding boxes, which was proposed in Faster R-CNN. Smooth L1 can calculate the loss of the length and width of the prediction box and the offset of the horizontal and vertical coordinates of the center point, as shown in the following formulas:
L s m o o t h L 1 = i = { x , y , w , h } S m o o t h L 1 ( i g t i p )
S m o o t h L 1 ( x ) = 0.5 x 2 ,                       i f     x < 1 x 0.5 ,         o t h e r w i s e
In the above formulas, xp, yp, wp, and hp, respectively, represent the horizontal and vertical coordinates of the center point of the prediction box and the width and height of the prediction box, while xgt, ygt, wgt, and hgt, respectively, represent the horizontal and vertical coordinates of the center point of the ground truth box and the width and height of the ground truth box.
This paper notes that, although YOLACT is a single-stage instance segmentation algorithm, its mask segmentation is not separated from object detection. In fact, although the prototype mask branch is independent from the Prediction module, the final instance mask segmentation quality of YOLACT still depends on the accuracy of the prediction boxes output by the Prediction module, so the quality of the prediction boxes also affects the segmentation quality. However, the Smooth L1 bounding box loss function ignores a lot of information, especially as it does not take into account three important pieces of information: area deviation, center deviation, and shape deviation. In the experiment, this paper found that the lack of this information in the Smooth L1 during training can lead to a low quality of the model’s prediction box, thereby limiting the overall detection accuracy.
For the insulator defect instance segmentation in this paper, due to the small size of the target instance, the detection of insulator defects is more sensitive to the area of the prediction box than a normal-sized target. It is likely for the instance segmentation algorithm to recognize the same target instance as multiple different instances, generating too many prediction boxes and leading to false detection and segmentation, ultimately reducing the accuracy of the model. As shown in Figure 5, this paper notes that the area of the redundant prediction box of these insulators is generally smaller than the area of the ground truth box, and it is very likely to appear inside the ground truth box.
In response to the above situations, a new loss function, RIoU Loss (Restrained-IoU Loss), is designed, which includes factors such as the intersection over union, center deviation, and shape deviation between the generated box and the ground truth box in the bbox loss calculation range. Meanwhile, it increases the punishment for small prediction boxes within the ground truth box and ultimately calculates the quality of the predicted box more accurately than the original loss function. According to the RIoU Loss function, the RIoU function is also obtained. The calculation process of RIoU Loss and RIoU is as follows:
R I o U   L o s s = 2 ( 1 I o U ) 2 + x o 2 + y o 2 w c 2 + h c 2 I o U + a r c t a n w g t h g t w p h p 2 I o U 2
R I o U = 1 R I o U   L o s s
In the above equations, xo represents the difference between the ground truth box center abscissa and the predicted box center abscissa, while yo represents the difference between the two vertical coordinates. Their sum represents the square of the distance between the two center points. wc represents the width of the minimum bounding rectangle of two boxes, hc represents the height of the minimum bounding rectangle, and the sum of the squares of these two is also the square of the diagonal length of the minimum bounding rectangle. wgt and hgt represent the width and height of the ground truth box, while wp and hp represent the width and height of the predicted box, respectively. It can be seen that the value of the RIoU Loss may be greater than 1, but it should be limited to between 0 and 1 so that it can allow the RIoU function to work normally. The limitation for RIoU Loss is as follows:
R I o U   L o s s = 1 ,                                       i f   R I o U   L o s s > 1 R I o U L o s s ,             i f   R I o U   L o s s 1
As shown in Equation (9), the proposed loss function consists of three parts. The left item is a penalty term for small prediction boxes. If the box is smaller relative to the ground truth box, it is more likely to be suppressed. When the IoU reaches a larger value, the loss value will be smaller, while when IoU reaches a smaller value, the loss value will rapidly increase. The middle term is a penalty term for the degree of deviation from the center of the prediction box. The farther the prediction box deviates from the center of the ground truth box, the easier it is to suppress it. The last item is a penalty term for shape similarity. When the aspect ratio of the predicted box differs significantly from the ground truth box, it indicates that the shape of the predicted box is incorrect and does not meet the requirements of the model. When the IoU of the prediction box is small, the loss value of the area penalty term is already large, which means that the quality of the prediction box is considered poor. When the IoU is large, we pay more attention to the center deviation and shape deviation. Hence, these two penalty terms are multiplied by the IoU and IoU2, respectively, to enhance their effectiveness, particularly when the IoU is large.
The three penalty terms proposed in this paper share a common principle: their values will rapidly increase with the degree of deviation from the correct box, and when the IoU is small, the penalty for the IoU is the main term. When the IoU is large, center deviation and shape deviation become the main penalty terms. This design aims to effectively minimize redundant target boxes and prevent the algorithmic misdetection of targets. Figure 6 shows a comparison of the RIoU Loss with the IoU Loss and GIoU Loss in three scenarios, with the red box representing the ground truth box and the green box representing the predicted box.
The IoU of the green box and the red box in Figure 6 is 0.45. The predicted boxes in (a) and (b) have the same shape and are similar rectangles to the ground truth box. While (a) has no center deviation, (b) deviates from the center of the ground truth box. Furthermore, (c) has no center deviation, but its aspect ratio is different from the ground truth box. Although the IoUs are both 0.45, the center deviation and shape deviation bring about additional penalties when calculating the RIoU loss function. The IoU Loss and GIoU Loss do not take into account the distance that the box deviates from the ground truth box, nor do they consider the shape of the predicted box. Therefore, it can be seen that neither the IoU loss function nor the GIoU loss function can effectively evaluate the quality of the box.

4. Experiment and Analysis

4.1. Environment and Data Set Settings

The experiment is based on the Pytorch 1.8.1 deep learning framework, running on Python 3.7 and a 64-bit Windows 10 operating system. The CPU is Ryzen 5600X @ 4.0 GHz, the GPU is NVIDIA RTX 3060Ti, and the graphic memory is 8 GB. CUDA version 11.1 and cuDNN version 8.1 are used as GPU accelerators. The publicly available data set used in this study is picked from IDID [32], totaling 500 initial images. In this paper, insulator defect images are annotated manually. To avoid over-fitting, image augmentation methods are used to preprocess the images. The images are augmented mainly through methods such as random cropping, random rotation, random mirroring, and random noise, as well as a combination of the above transformations. Finally, 4000 images are obtained and used to train the model, and the data set is allocated in a proportion of 3:1 as the training set and validation set. There are two classes of insulator defects, where class1 is a broken disk which is represented as defect1 and class2 is a burned disk which is represented as defect2. During training, the learning rate lr is set to 10−4, the BatchSize is set to 4, and the number of iterations is set to 15,000.

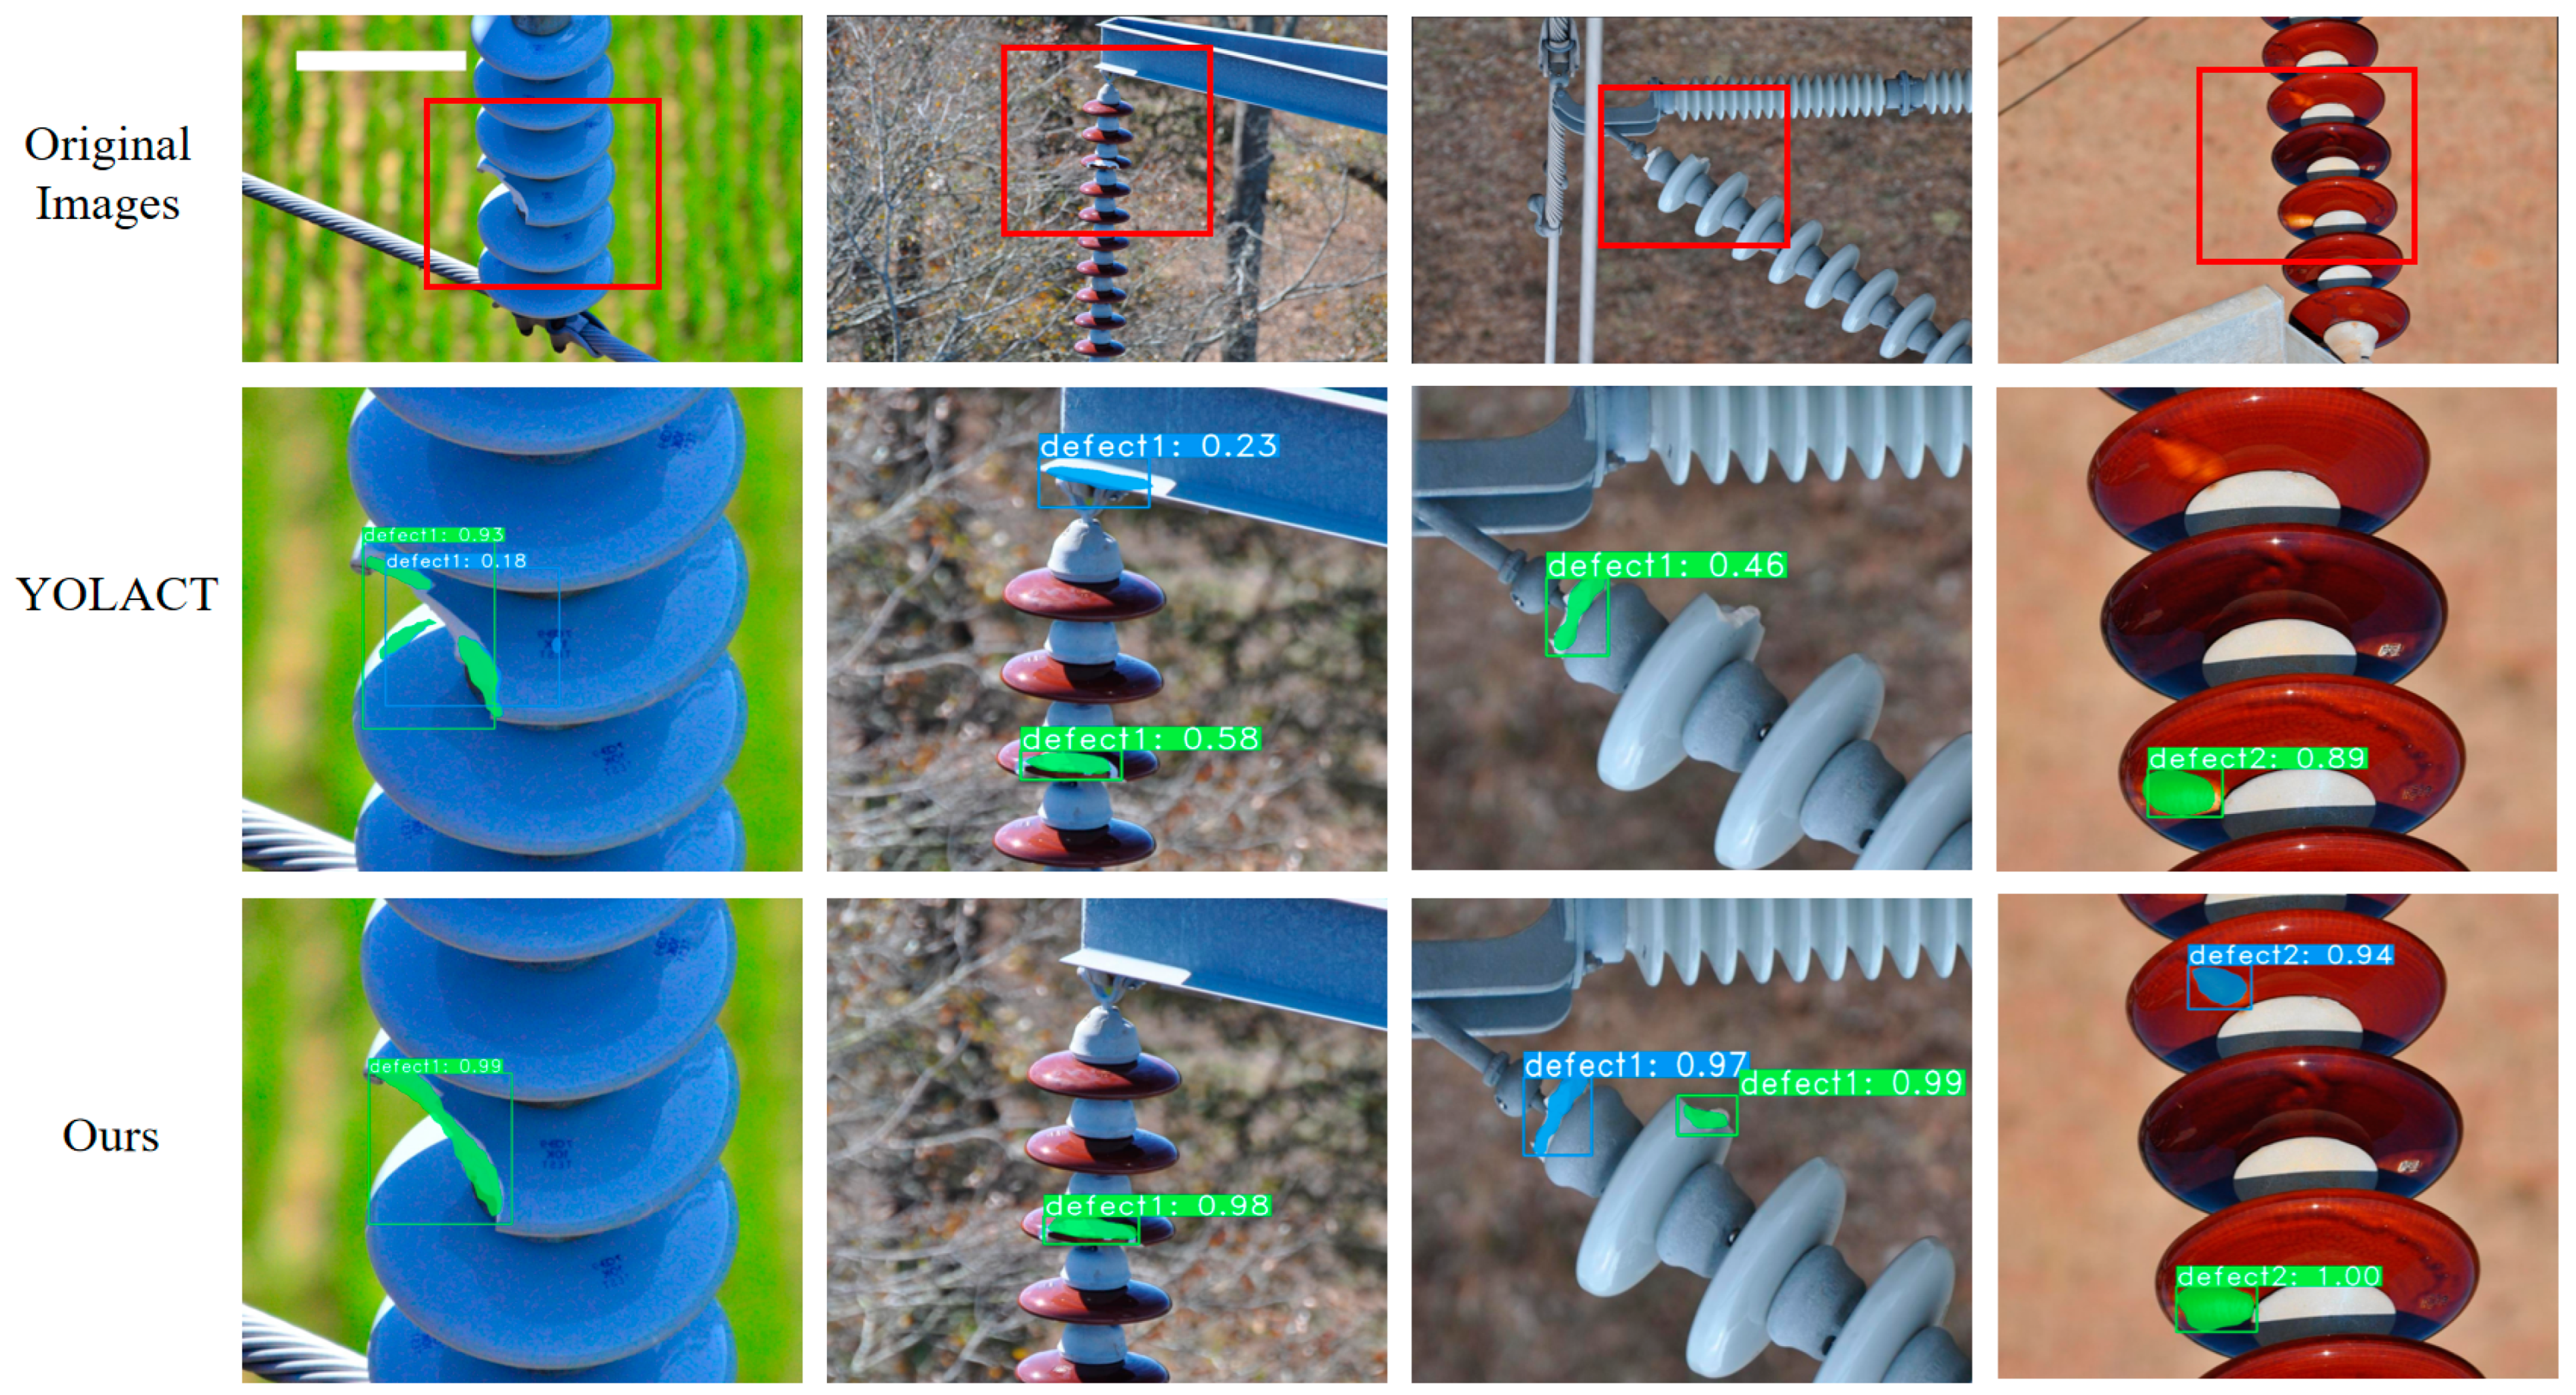
4.2. Visualization Results of the Model

Figure 7 shows the prototype mask and segmentation results generated by the improved model. In Figure 7, the first row of images is the original images entered into the model. The second row to the fourth line is the partial output of the prototype mask module, where the second row is the enhanced mask for the foreground target (i.e., the possible insulator defect instance target), the third row is the enhanced mask for the background target, and the fourth row is the mask for enhancing or suppressing different foreground targets, respectively. The prototype mask module generates a total of 32 prototype mask images. These prototype mask images are multiplied by the mask coefficients output by the prediction head and then linearly added to obtain the final segmentation mask, as the last row shows. More detailed segmentation results of the original model and the improved model are compared in Figure 8 and Figure 9.
In the left part of Figure 8, it can be seen that the problems of false detection that occurred in the original model are well resolved and redundant boxes of instances are suppressed in the improved model. Meanwhile, the right part of Figure 8 shows that some target boxes that were wrongly suppressed are retrieved in the improved model. We compare the specific bounding box and segmentation mask between YOLACT and the proposed model in Figure 9. In the original model, the target bounding box did not cover the entire target instance, and some target pixels were mistakenly divided into backgrounds. However, due to the improvement in the feature fusion module and RIoU Loss function in this paper, the position of the predicted box in the segmentation results generated by the improved method is more accurate. At the same time, the new feature fusion method enriches the position information contained in the feature map of the input prototype mask module, making the mask segmentation closer to the ground truth label.
Figure 10 shows the loss curves obtained by training YOLACT using Smooth L1 and training the improved model using the RIoU Loss function. The value of Smooth L1 is dependent on the image size, while RIoU Loss has the characteristic of scale translation invariance and it is independent of the image size. In order to make the value of the RIoU Loss closer to Smooth L1 so that it can fit the model better, the weight of the Smooth L1 loss is set to 1.5 while the weight of the RIoU loss is set to 7. Due to hardware limitations, especially the limited memory size of the GPU, this paper cannot take a larger value for the BatchSize and there are significant differences in the feature information between different batches, which inevitably leads to significant fluctuations in the loss value during the training process, and the small size of the instance target aggravates this situation. Due to the use of a lightweight backbone network, the improved model loss convergence speed is slightly slower than that of the original model. In order to obtain a better accuracy performance, this paper doubles the number of training iterations in the experiment, but due to the light weight of the model and the difficulty in learning the small defect object, it is found that the accuracy does not increase significantly after another 15,000 iterations of training and, sometimes, the accuracy will decline slightly. Based on the consideration of the balance between training time cost and the accuracy performance that the model can achieve, the number of iterations is set to 15,000.

4.3. Ablation Experiments

Ablation experiments are conducted in this paper based on the improved backbone network module, FPN module, and loss function. AP (Average Precision) is used as the model accuracy index, FPS (Frame per Second) is used as the model real-time performance index, and the baseline for comparison is the original YOLACT model with ResNet-101 as the backbone network. The experimental results are presented in Table 1, Table 2 and Table 3, which test the accuracy and speed of the model based on each improvement point, as well as the specific time consumption of each module. The FPN+ in the tables represents the improved FPN module.
It can be seen from Table 1 that, after the model introduces the modified MobileNetV2 as the backbone network, due to the sharp decrease in the network model size compared with the use of ResNet-101, while less channels and anchors are used in the Prediction module, the detection speed is immediately increased by 43.1 FPS, which is nearly twice the speed of the original model. However, the lightweight structure also leads to the mask mAP and bbox (bounding box) mAP being decreased by 0.79% and 4.88%, respectively, which is an inevitable defect of the lightweight backbone network. It can also be noted that the decrease in the mask mAP is much smaller than that of the bbox mAP. The reason is that, for the single-stage algorithm YOLACT, its Prediction module outputs bounding boxes for the instance targets, the Protonet module outputs the prototype mask images, and the two branches work in parallel and independently, and the location of the bbox will not affect the generation of the prototype mask. While the use of fewer anchors limits the performance of the Prediction module, the Protonet is unaffected, so the mAP of bbox decreases more than the mask mAP. After using feature fusion and introducing an ECA attention mechanism into the FPN module, the overall output of the FPN is optimized, resulting in a significant improvement in the accuracy of the final mask and bounding box. The RIoU Loss function improves the network performance while only affecting the training speed, so it will not reduce the speed performance of the network. Although these improvements in accuracy are based on increasing the additional computational load of the network, these additional computational loads do not have a significant impact due to the model being lightweight. Compared with the original network, the improved network only loses 3.30% of the bounding box accuracy, but increases the mask accuracy by 5.82% and the detection speed by 37.4 FPS. In order to verify the effectiveness of the improved FPN module and RIoU Loss function, experiments are also conducted on the ResNet-101 backbone network, and the results are shown in Table 2.
Similar to the data in Table 1, it is also shown in Table 2 that the use of the improved FPN module and RIoU Loss could both improve the accuracy performance of the model based on the ResNet-101 backbone network. But without a lightweight structure, the real-time performance is limited, as the improved FPN module increases the inference time of the model. In a scenario with low real-time performance requirements, the ResNet-based model can also be used to achieve a higher accuracy.
Figure 11 shows a comparison of the APS, APM, and APL between the original YOLACT and the improved model in this paper. APS is the average precision for small objects (area < 32 × 32 pixels), while APM is for medium objects (32 × 32 pixels < area < 96 × 96 pixels) and APL is for large objects (area > 96 × 96 pixels).
In Figure 11, it can be seen that the average precision of the bounding boxes of objects in all sizes is decreased, which is caused by the joint action of the lightweight backbone network and other improvement points in this paper. Since the proposed model in this paper improves the input feature map of Protonet, although the accuracy of bboxes is reduced, the segmentation accuracy of the network for targets of various sizes is still improved. Table 3 provides a more detailed comparison of the time consumption after the introduction of each module.
As the model improvements in this paper are carried out in a more lightweight way, the overall time consumption added to the network is less, and it will not significantly affect the real-time performance of the model. Furthermore, since we use fewer channels in the backbone and detection module, the time for both modules is significantly reduced. The increased time consumption of the model is mainly concentrated in the FPN module and object detection module. In Table 3, Others represents the parts of the model that will not be affected by the changes, such as data loading and copying. As observed from Table 1 and Table 3, the improved model achieves a better balance between accuracy and speed compared to the original model, and is more suitable for instance segmentation tasks of insulator defect images.

4.4. Comparison with Other Models

In order to further validate the instance segmentation effect for insulator defects of the proposed method, the proposed method is compared with other state-of-the-art algorithms, mainly comparing the inference speed and average mask accuracy of the model. The results compared with other models are shown in Table 4.
As shown in Table 4, the proposed algorithm still has a gap compared to other advanced methods in accuracy, but it also achieves an average mask accuracy of 37.1% and achieves the optimal detection speed. Compared with other models, our model is more suitable for task scenarios with certain requirements for real-time performance and accuracy. Furthermore, since the enhancement measures implemented in this paper do not significantly increase the model’s scale, its accuracy performance can be further enhanced by introducing a more intricate attention structure and other methodologies. Therefore, this method has certain potential and advantages in the insulator defect instance segmentation scenario.

5. Conclusions

In this paper, an improved YOLACT model is proposed to better complete the instance segmentation of insulator images, and the accuracy and speed of the model are both optimized. Firstly, MobileNetV2 is used as the lightweight backbone network and a Serial-scSE attention module is proposed and embedded in the backbone network. Then, the FPN in the algorithm is improved with feature fusion, which connects feature maps across layers. Afterward, the ECA attention module is also introduced into the modified FPN module, greatly improving the quality of the overall output feature map of the FPN module and optimizing the segmentation results of the model. Finally, in response to the problem that the original model’s bounding box loss function cannot train the model well, a new bounding box loss function, RIoU Loss, which covers area deviation, center deviation, and shape deviation, is designed to enhance the training effect of the model. The experimental results show that the improved model improves the mask accuracy by 5.82% with only a 3.30% loss in the bounding box accuracy, and also increases the FPS by 37.4%. The algorithm in this paper still has a gap in accuracy compared with other state-of-the-art algorithms. From a practical perspective, in future studies, the accuracy performance of the model can be further optimized by introducing other attention mechanisms and improving the prediction head.

Author Contributions

Conceptualization, J.W.; methodology, J.W. and Q.D.; software, Q.D., Z.Z. and R.X.; validation, Q.D. and X.T.; formal analysis, J.W.; investigation, J.W.; resources, J.W.; data curation Q.D., X.T. and R.X.; writing—original draft preparation, Q.D.; writing—review and editing, J.W.; visualization, X.T., R.X. and Z.Z.; supervision, J.W.; project administration, J.W.; funding acquisition, J.W. All authors have read and agreed to the published version of the manuscript.

Funding

This research was supported by Project of Education Department of Jilin Province (Grant No. JJKH20240148KJ) and the Science and Technology Development Project of Jilin Province (Grant No. 20200403075SF).

Institutional Review Board Statement

Not applicable.

Informed Consent Statement

Not applicable.

Data Availability Statement

Data are contained within the article.

Acknowledgments

The authors are grateful to the editors and reviewers for their work in the review. Meanwhile, Ye Zhang (Baishan Power Supply Company, State Grid Jilin Electric Power Co., Ltd., Baishan 134300, China) has provided important help to this research, which the authors are also grateful to.

Conflicts of Interest

The authors declare no conflicts of interest.

References

  1. Ma, Y.; Zhang, Y. Insulator detection algorithm based on improved Faster-RCNN. J. Comput. Appl. 2022, 42, 631–637. [Google Scholar]
  2. Luo, X.; Yu, F.; Peng, Y. UAV power grid inspection defect detection based on deep learning. Power Syst. Prot. Control 2021, 50, 132–139. [Google Scholar] [CrossRef]
  3. Huang, X.; Zhang, Y.; Wang, L.; Mei, H.; Zhang, Z.; Wen, L. Infrared image segmentation and temperature reading of composite insulator strings based on mask-rcnn algorithm. High Volt. Electr. 2021, 57, 87–94. [Google Scholar] [CrossRef]
  4. Yi, J.; Wu, P.; Jiang, M.; Huang, Q.; Hoeppner, D.J.; Metaxas, D.N. Attentive neural cell instance segmentation. Med. Image Anal. 2019, 55, 228–240. [Google Scholar] [CrossRef] [PubMed]
  5. Panero, M.R.; Schiopu, I.; Cornelis, B.; Munteanu, A. Real-time instance segmentation of traffic videos for embedded devices. Sensors 2021, 21, 275. [Google Scholar] [CrossRef] [PubMed]
  6. Li, Y.; Xiao, L.; Liu, Z.; Liu, M.; Fang, P.; Chen, X.; Yu, J.; Liu, J.; Cai, J. SMR-RS: An Improved Mask R-CNN Specialized for Rolled Rice Stubble Row Segmentation. Appl. Sci. 2023, 13, 9136. [Google Scholar] [CrossRef]
  7. Hafiz, A.M.; Bhat, G.M. A survey on instance segmentation: State of the art. Int. J. Multimed. Inf. Retr. 2020, 9, 171–189. [Google Scholar] [CrossRef]
  8. Sandler, M.; Howard, A.; Zhu, M.; Zhmoginov, A.; Chen, L.C. Mobilenetv2: Inverted residuals and linear bottlenecks. In Proceedings of the IEEE Conference on Computer Vision and Pattern Recognition, Salt Lake City, UT, USA, 18–22 June 2018; pp. 4510–4520. [Google Scholar]
  9. Roy, A.G.; Navab, N.; Wachinger, C. Concurrent spatial and channel ‘squeeze & excitation’in fully convolutional networks. In Proceedings of the Medical Image Computing and Computer Assisted Intervention—MICCAI 2018: 21st International Conference, Granada, Spain, 16–20 September 2018; pp. 421–429. [Google Scholar]
  10. Wang, Q.; Wu, B.; Zhu, P.; Li, P.; Zuo, W.; Hu, Q. ECA-Net: Efficient channel attention for deep convolutional neural networks. In Proceedings of the IEEE/CVF Conference on Computer Vision and Pattern Recognition, Online, 10 June 2020; pp. 11534–11542. [Google Scholar]
  11. Hariharan, B.; Arbeláez, P.; Girshick, R.; Malik, J. Simultaneous detection and segmentation. In Proceedings of the Computer Vision—ECCV 2014: 13th European Conference, Zurich, Switzerland, 6–12 September 2014; pp. 297–312. [Google Scholar]
  12. He, K.; Gkioxari, G.; Dollár, P.; Girshick, R. Mask r-cnn. In Proceedings of the IEEE International Conference on Computer Vision, Venice, Italy, 22–29 October 2017; pp. 2961–2969. [Google Scholar]
  13. Ren, S.; He, K.; Girshick, R.; Sun, J. Faster r-cnn: Towards real-time object detection with region proposal networks. IEEE Trans. Pattern Anal. Mach. Intell. 2016, 39, 1137–1149. [Google Scholar] [CrossRef] [PubMed]
  14. Huang, Z.; Huang, L.; Gong, Y.; Huang, C.; Wang, X. Mask scoring r-cnn. In Proceedings of the IEEE/CVF Conference on Computer Vision and Pattern Recognition, Long Beach, CA, USA, 16–20 June 2019; pp. 6409–6418. [Google Scholar]
  15. Kirillov, A.; Wu, Y.; He, K.; Girshick, R. Pointrend: Image segmentation as rendering. In Proceedings of the IEEE/CVF Conference on Computer Vision and Pattern Recognition, Online, 10 June 2020; pp. 9799–9808. [Google Scholar]
  16. Wu, Y.; Kirillov, A.; Massa, F.; Lo, W.Y.; Girshick, R. Detectron 2. Available online: https://github.com/facebookresearch/detectron2 (accessed on 15 July 2023).
  17. Liu, S.; Jia, J.; Fidler, S.; Urtasun, R. Sgn: Sequential grouping networks for instance segmentation. In Proceedings of the IEEE International Conference on Computer Vision, Venice, Italy, 22–29 October 2017; pp. 3496–3504. [Google Scholar]
  18. Gao, N.; Shan, Y.; Wang, Y.; Zhao, X.; Yu, Y.; Yang, M.; Huang, K. Ssap: Single-shot instance segmentation with affinity pyramid. In Proceedings of the IEEE/CVF International Conference on Computer Vision, Seoul, Republic of Korea, 27 October–2 November 2019; pp. 642–651. [Google Scholar]
  19. Bolya, D.; Zhou, C.; Xiao, F.; Lee, Y.J. Yolact: Real-time instance segmentation. In Proceedings of the IEEE/CVF International Conference on Computer Vision, Seoul, Republic of Korea, 27 October–2 November 2019; pp. 9157–9166. [Google Scholar]
  20. Chen, H.; Sun, K.; Tian, Z.; Shen, C.; Huang, Y.; Yan, Y. Blendmask: Top-down meets bottom-up for instance segmentation. In Proceedings of the IEEE/CVF Conference on Computer Vision and Pattern Recognition, Online, 10 June 2020; pp. 8573–8581. [Google Scholar]
  21. Tian, Z.; Shen, C.; Chen, H.; He, T. FCOS: A Simple and Strong Anchor-Free Object Detector. IEEE Trans. Pattern Anal. Mach. Intell. 2022, 44, 1922–1933. [Google Scholar] [CrossRef] [PubMed]
  22. Wang, B.; Dong, M.; Ren, M.; Wu, Z.; Guo, C.; Zhuang, T.; Pischler, O.; Xie, J. Automatic fault diagnosis of infrared insulator images based on image instance segmentation and temperature analysis. IEEE Trans. Instrum. Meas. 2020, 69, 5345–5355. [Google Scholar] [CrossRef]
  23. Han, G.; Zhang, M.; Wu, W.; He, M.; Liu, K.; Qin, L.; Liu, X. Improved U-Net based insulator image segmentation method based on attention mechanism. Energy Rep. 2021, 7, 210–217. [Google Scholar] [CrossRef]
  24. Ma, J.; Qian, K.; Zhang, X.; Ma, X. Weakly supervised instance segmentation of electrical equipment based on RGB-T automatic annotation. IEEE Trans. Instrum. Meas. 2020, 69, 9720–9731. [Google Scholar] [CrossRef]
  25. Li, T.; Zhou, J.; Song, G.; Wen, Y.; Ye, Y.; Chen, S. Insulator infrared image segmentation algorithm based on dynamic mask and box annotation. In Proceedings of the 2021 11th International Conference on Power and Energy Systems, Shanghai, China, 18–20 December 2021; pp. 432–435. [Google Scholar]
  26. Wang, S.; Liu, Y.; Qing, Y.; Wang, C.; Lan, T.; Yao, R. Detection of Insulator Defects with Improved ResNeSt and Region Proposal Network. IEEE Access 2020, 8, 184841–184850. [Google Scholar] [CrossRef]
  27. Qiu, Z.; Zhu, X.; Liao, C.; Shi, D.; Qu, W. Detection of Transmission Line Insulator Defects Based on an Improved Lightweight YOLOv4 Model. Appl. Sci. 2022, 12, 1207. [Google Scholar] [CrossRef]
  28. Antwi-Bekoe, E.; Liu, G.; Ainam, J.P.; Sun, G.; Xie, X. A deep learning approach for insulator instance segmentation and defect detection. Neural Comput. Appl. 2022, 34, 7253–7269. [Google Scholar] [CrossRef]
  29. Xuan, Z.; Ding, J.; Mao, J. Intelligent Identification Method of Insulator Defects Based on CenterMask. IEEE Access 2022, 10, 59772–59781. [Google Scholar] [CrossRef]
  30. Gu, W.; Bai, S.; Kong, L. A review on 2D instance segmentation based on deep neural networks. Image Vis. Comput. 2022, 120, 104401. [Google Scholar] [CrossRef]
  31. Woo, S.; Park, J.; Lee, J.Y.; Kweon, I.S. Cbam: Convolutional block attention module. In Proceedings of the European Conference on Computer Vision, Munich, Germany, 8–14 September 2018; pp. 3–19. [Google Scholar]
  32. Lewis, D.; Kulkarni, P. Insulator Defect Detection. Available online: https://ieee-dataport.org/competitions/insulator-defect-detection (accessed on 29 March 2023).
  33. Wang, X.; Zhang, R.; Kong, T.; Li, L.; Shen, C. Solov2: Dynamic and fast instance segmentation. Adv. Neural Inform. Proc. Syst. 2020, 33, 17721–17732. [Google Scholar]
  34. Bolya, D.; Zhou, C.; Xiao, F.; Lee, Y.J. YOLACT++ Better Real-Time Instance Segmentation. IEEE Trans. Pattern Anal. Mach. Intell. 2022, 44, 1108–1121. [Google Scholar] [CrossRef] [PubMed]
Figure 1. Structure of the improved YOLACT network.
Applsci 14 03623 g001
Figure 2. Structure of Serial-scSE.
Applsci 14 03623 g002
Figure 3. Structure of FPN with feature fusion.
Applsci 14 03623 g003
Figure 4. Structure of the improved FPN module combined with ECA.
Applsci 14 03623 g004
Figure 5. Redundant prediction boxes in insulator defect instance segmentation.
Applsci 14 03623 g005
Figure 6. Comparison of three loss functions: IoU Loss, GIoU Loss, and RIoU Loss.
Applsci 14 03623 g006
Figure 7. Prototype masks and segmentation results of improved YOLACT network.
Applsci 14 03623 g007
Figure 8. Comparison of segmentation results between original model and the proposed method.
Applsci 14 03623 g008
Figure 9. Comparison of bounding box and segmentation mask.
Applsci 14 03623 g009
Figure 10. Comparison of SmoothL1 Loss and RIoU Loss Curves.
Applsci 14 03623 g010
Figure 11. Comparison of APS, APM, and APL between YOLACT and the proposed model.
Applsci 14 03623 g011
Table 1. Results of ablation experiments.
ModelBackboneFPN+RIoU
Loss
Mask
mAP/%
Bbox
mAP/%
Mask
AP50/%
Bbox
AP50/%
FPS
YOLACTResNet-101××31.3255.2874.9495.0534.9
Model1MobileNetV2××30.5350.4074.8992.8778.0
Model2×33.2851.3075.2392.4172.3
Model3×34.1551.4275.1192.8378.1
Ours37.1451.9876.8292.5572.3
Table 2. Results of ablation experiments on ResNet-101 backbone network.
ModelBackboneFPN+RIoU
Loss
Mask
mAP/%
Bbox
mAP/%
Mask
AP50/%
Bbox
AP50/%
FPS
YOLACTResNet-101××31.3255.2874.9495.0534.9
Model1×34.5456.9176.4395.2929.7
Model2×34.8757.1276.7295.1634.8
Model338.6658.0577.5095.4729.8
Table 3. Time consumption comparison of different structure (ms).
ModelBackboneFPN+RIoU
Loss
BackboneFPNDetectOthersTotal
YOLACTResNet-101××13.130.8715.475.1134.58
Model1×13.253.2215.505.1037.07
Model2×13.180.8715.235.2234.50
Model313.193.2115.585.2537.23
Model4MobileNetV2××5.660.908.015.1019.67
Model5×5.483.208.035.2221.93
Model6×5.520.898.155.1519.71
Ours5.593.238.025.1521.99
Table 4. Comparison with other models.
ModelBackboneFPSMask mAP/%
Mask R-CNN [12]ResNet-1016.237.4
Solov2 [33]ResNet-10131.137.0
YOLACTResNet-10134.931.3
YOLACT++ [34]ResNet-10132.432.7
OursMobileNetV272.337.1
Disclaimer/Publisher’s Note: The statements, opinions and data contained in all publications are solely those of the individual author(s) and contributor(s) and not of MDPI and/or the editor(s). MDPI and/or the editor(s) disclaim responsibility for any injury to people or property resulting from any ideas, methods, instructions or products referred to in the content.

