Article

Lessons Learnt from the Influencing Factors of Forested Areas’ Vulnerability under Climatic Change and Human Pressure in Arid Areas: A Case Study of the Thiès Region, Senegal

by
Bonoua Faye
1,
Guoming Du
1,2,*,
Quanfeng Li
1,2,
Hélène Véronique Marie Thérèse Faye
3,
Jeanne Colette Diéne
2,
Edmée Mbaye
4 and
Henri Marcel Seck
5
1
School of Public Administration and Law, Northeast Agricultural University, Harbin 150030, China
2
School of Economics and Management, Northeast Agricultural University, Harbin 150030, China
3
Department of Economics, Cheikh Hamidou Kane University, Dakar 15126, Senegal
4
Department of Geography, Cheikh Anta Diop University, Dakar P.O. Box 5003, Senegal
5
Department of Geography, UFR Sciences and Technologies, Assane Seck University, Ziguinchor P.O. Box 523, Senegal
*
Author to whom correspondence should be addressed.
Appl. Sci. 2024, 14(6), 2427; https://doi.org/10.3390/app14062427
Submission received: 4 January 2024 / Revised: 8 March 2024 / Accepted: 8 March 2024 / Published: 13 March 2024
(This article belongs to the Section Ecology Science and Engineering)

Abstract

:

Featured Application

The integrated analysis method for understanding the main driving factors shaping forested areas proposed in this paper can provide helpful insight into sustainable and long-term land use systems in Senegal.

Abstract

Understanding the factors influencing the vulnerability of forested areas is crucial for human well-being and effective governance of ecosystem supply and demand. Based on remote sensing data, this study also considered ten natural and human variables as indexes to explore the main influencing factors that may impact the vulnerability of the Thies region’s forested areas. The 2005, 2010, 2015, and 2020 satellite image data were processed using ArcGIS 10.6 and ENVI 5.1 software. The methodology includes using the transfer matrix approach and calculating the geographic landscape index to describe the dominant morphology of forested areas. Furthermore, a mixed linear regression model was built to establish the connection between forested areas and the potential contributing components. Our study revealed that the forested areas led to relative fragmentation, with an average of 88 patches for Aggregation Index (AI), 3.25 for Largest Patch Index (LPI), 2.50 for Patch Density (PD), and 112 for Landscape Shape Index (LSI) between 2005 and 2020. In addition, the transfer matrix indicated that the loss of forestry areas was about −78.8 km2 for agricultural land, −127.8 km2 for bare land, and −65.3 km2 for artificial surfaces. The most critical factors that influenced forested areas were agricultural and manufactural added value, rainfall (p < 0.05), slope, distance to the road, and agricultural sown area (p < 0.001). Overall, this investigation has revealed that the effective management of forested areas in the Thies region requires an understandable assessment. It was observed that both human anthropogenic and natural factors significantly contribute to the decline in forested areas.

1. Introduction

Forested areas play a significant socio-economic role in human livelihoods. In recent years, concerns regarding the decline in forest resources have been investigated. According to the literature, unregulated urban development poses a significant risk to groundwater quality [1] and exerts critical pressure on natural resources. Moreover, changes in the functioning of the Earth’s ecological systems present a significant threat to human survival [2]. For instance, issues such as food security are closely tied to the protection of cultivated land [3] and depend, in part, on the sustainable use of natural resources [4]. Hence, scientific research finds the challenges facing forested areas intriguing, especially in the context of uncoordinated economic development and the degradation of the ecological environment [5]. These challenges require solid and long-term solutions, particularly in arid regions such as Senegal.
In arid regions, desertification is frequently associated with the deterioration of soil quality, which depends on various factors, including environmental changes and anthropogenetic effects. Forest clearing significantly affects the climate system and land–atmosphere interactions [6], leading to changes in land use and land cover (LULC), which can influence various ecosystems and have implications for natural habitats and human survival [7]. In Senegal’s Sahel region, droughts and human activities, such as farming, cattle overgrazing, bushfires, and monoculture, have negatively impacted the delicate ecological balances [5,8].
If socio-economic development poses a challenge to properly preserving terrestrial ecosystem services, natural factors also play a significant role. Global climate change is projected to increase the severity and length of droughts across many regions, potentially pushing ecosystems beyond their tipping points [9]. According to Tappan (2004), Senegal has experienced a decline in forest cover, with forest decreasing from 4.4% in 1965 to 2.6% in 2000 [10]. Additionally, Senegal faces the repercussions of rainfall variability, leading to the degradation of its natural environment [8]. Following a drought, there is a decline in plant cover, erosion, runoff, and intensified processes of salinization in the soil [11]. These factors, including rain and hydric erosion, are closely linked, contributing to the deterioration of terrestrial ecosystem services that threatens human well-being.
In Senegal’s Thies region, considered to be the country’s second economic region, rapid socio-economic development is exerting critical pressure on land use, particularly in forested areas. In the past few years, implementing Blaise Diagne International Airport and establishing the Special Integrated Economic Zone have significantly altered the interface between urban and rural areas in the region. It has been highlighted that the mangrove forests in the southern part of our study area face constant influences from socio-economic and natural factors, and forested areas dropped by −41.01 km2 from 2000 to 2020 [5]. This continuous reduction in forested areas is a concerning trend, particularly given the need to eradicate poverty and enhance food production. Continuous land degradation, in contradiction with poverty eradication efforts, will exacerbate pressure on agricultural land and forested areas in the Thies region.
The current human pressures on the forest resources in many Sahel countries, such as Senegal, exceed the capacities of natural plants to regenerate, seriously threatening their existence [12]. To manage biodiversity on farmland, including forested areas, various policies are available for farmers to establish, operate, or maintain field edge habitats to benefit wildlife, landscape, and public amenities [13]. However, farmers’ skills and knowledge concerning land protection policies and natural resource preservation in Senegal are still weak [14]. In this context, understanding the process and mechanisms of changes in forested areas requires analyzing the relationship between the current dominant forested area’s morphology and its influencing factors.
Existing research indicates various factors contributing to the vulnerability of forested areas and their mechanisms. Effective methodologies for conducting a comprehensive analysis and simultaneously evaluating factors causing the fragmentation of forested areas include studies focused on avian biodiversity, woody vegetation structure evolution, the spatial heterogeneity of ecosystem service supply, cultural ecosystem services, and soil organic matter degradation in tropical coastal wetlands [15,16,17,18]. However, these influencing factors are still not fully understood, and the forest vulnerability in Senegal requires a holistic analysis considering both natural and human factors. To address this gap, our study aims to (1) explore the forested areas and exchange status between 2005 and 2020, (2) interpret the dominant morphology fragmentation level, and (3) understand the process of the fragmentation of forested areas leading to their vulnerability through a mixed linear regression model.

2. Literature Review

Analyzing issues in forested areas requires suitable methods and data. To our knowledge, social surveys and Landsat image interpretation are the main methods for gathering information on issues in forested areas. Questionnaires are widely used tools in empirical social science, but often lack geographical and temporal accuracy [19,20]. Conversely, the increasing availability and volume of remote sensing data offer access to spatial land use information containing extensive time series [21]. Various methods are available for evaluating land use changes, especially in forests. The multiple linear regression correlation matrix, logistic regression, Gray correlation analysis, and Pearson correlation coefficient are utilized to assess the impact of climate change on species diversity, assess windthrow impacts on forest stands, and determine the intercorrelation between natural and socio-economic factors driving agricultural land use [5,22,23,24]. In 2011, N.H. Ravindranath investigated the vulnerability index of agriculture and forests to climate change pressure [25]. Further, the Normalized Difference Vegetation Index (NDVI) was used to evaluate the response of vegetation productivity to greening and drought [26,27,28]. Parallelly, landscape index and multiple regression revealed landscape patterns’ temporal and spatial evolutions and their driving factors [29]. In a nutshell, these studies often overlook factors such as the expansion of agriculture, and the integration of natural and socio-economic data is lacking in regard to examining forested areas issues comprehensively. Further, this study chose the multiple linear regression model, which provides a more comprehensive overview of the data and the relationships between variables. It is a powerful tool for elucidating the complex interplay between multiple factors and a given outcome, offering insights that can guide strategic planning, policy formulation, and scientific research.
As the population grows, the pressure on forest resources intensifies, leading to biodiversity loss. Humans have been estimated to have modified over 50% of the Earth’s land surface [30]. Climate change affects ecosystems and the well-being of rural households that rely on ecosystem services for their livelihoods [31]. However, understanding the underlying factors contributing to forest vulnerability in arid regions is more complex. Various socio-economic factors determine deforestation and degradation [32]. Agricultural activities are crucial for human existence, as they provide essential resources and support economies. Recently, it has been acknowledged that forests are often cleared to create new agricultural lands to comply with the growing food demand of the world’s population. Conversely, agricultural expansion into subtropical and tropical forests causes significant environmental damage [33]. For instance, socio-economic factors include setting forests ablaze, increasing farming activities, growing populations, and poverty-induced deforestation [34] in many African countries. High agricultural added value in proximity to forested areas may indicate intensive agricultural practices contributing to deforestation and increased habitat fragmentation. While the added value of agriculture might encourage more intensive farming practices that can spare forests, it can also lead to further agricultural expansion into forested areas if not managed sustainably. Senegal offers an interesting case, because approximately 81.37% of plots did not have formal documents [14]. Furthermore, manufacturing value may be associated with industrial activities contributing to water pollution and forest fragmentation. Therefore, industrial activities such as mining may significantly alter the natural balance of ecosystems.
Between 2015 and 2016, the Thiès region witnessed a 26% increase in corporate contributions attributed to establishing companies like Dangote, GCO, and SEPHOS.PID. Therefore, industrial activities have recorded significant development in the Thies region, and mining is a significant driver of deforestation. While mines simultaneously clear native forests for mineral extraction, they also establish new infrastructure, indirectly facilitating further clearing [35]. Further, mining operations require significant land clearing to access underground resources. These activities not only lead to the direct loss of forest cover, but also cause soil erosion. The mining activities in the commune of Taiba Ndiaye, in the northern part of our study area, significantly influence the local population’s socio-economic life [36]. In addition, road construction contributes to the loss of forest areas [37]. The connection between transportation infrastructure and forest vulnerability is noteworthy. The development and presence of transportation infrastructure can impact forests by leading to habitat fragmentation, increased human access, and changes in land use, all contributing to the heightened vulnerability of forest ecosystems. Dependence on forest resources for fuelwood, timber, and non-timber forest products may lead to overharvesting and degradation, making forests more vulnerable to disturbances.
Hypothesis 1 (H1).
Deforestation, expansion of agriculture, and population growth coupled with manufacturing activities can increase the vulnerability of forests by reducing their extent and altering their composition.
Climate change causes substantial vegetation shifts across the world [38]. Climate and environmental risks related to rainfall shortages [8] are common in Senegal, particularly in the north. Variability in rainfall, especially reductions, can make forests more susceptible to deforestation. So, as temperatures rise, there may be shifts in the vegetation zones in Senegal. These changes can result in altered ecosystem dynamics and increased vulnerability to disturbances. Previous research findings have indicated that elevation and topography influence the orientation of cultivated land ridges [39]. Consequently, the physical characteristics of the land, such as its topography, influence the vulnerability of forests. Factors such as slope, elevation, and soil types can affect water drainage and susceptibility to erosion, impacting overall forest health. In essence, slope and elevation can affect the amount of water an area receives, influencing the types of vegetation that can thrive. High-elevation forests on steep slopes may be particularly susceptible to landslides and soil erosion during extreme weather events, such as heavy rainfall. Additionally, forests on steep slopes are more prone to erosion because runoff water moves more rapidly, carrying soil away. Notably, the Thies region’s topography exhibits significant elevation, which may have various implications for surrounding natural environmental elements. Therefore, the relationship between slope, elevation, and forest degradation is complex. Understanding these interactions is essential for effective forest management and formulating strategies to mitigate degradation.
Furthermore, in the context of climate change, rising temperatures and fluctuations in rainfall pose significant challenges to the natural environment. A decline in vegetation index indicates vegetation loss, which can result from deforestation activities. Drought leads to plant cover, soil, runoff, and accentuation acidification [11]. In essence, prolonged periods of drought can make forest landscapes more susceptible to fragmentation. Several previous analyses have documented the impacts of deforestation on precipitation across the tropics [40,41]. Africa’s temperature is predicted to increase by 3 °C to 4 °C by the end of the 21st century [38], posing a threat to the natural ecosystem. Altered climate conditions, such as rising temperatures, extended droughts, or changes in rainfall patterns, can stress forests. Precisely, rising temperatures can increase the frequency and severity of droughts while simultaneously causing forest dieback, leading to forest degradation. Also, understanding the spatio-temporal variations in rainfed agriculture is crucial for promoting food security, socio-economic stability, and protecting vulnerable ecosystems [42]. Rainfall plays a crucial role in the structure and function of terrestrial ecosystems [43]. Changes in natural environmental elements, such as alterations in rainfall patterns, may render forests especially vulnerable to disruptions that can lead to cascading impacts on biodiversity and ecosystem services. Prolonged periods of drought can stress trees, making them more susceptible to diseases, while excessive rainfall can lead to soil erosion. Natural factors drive scientific contribution and novelty by advancing our understanding of ecosystem dynamics and identifying vulnerable areas. Additionally, they can inform climate change adaptation strategies, enhance ecosystem resilience, and foster cross-disciplinary collaboration. Overall, the natural and socio-economic factors considered in this study are interconnected and collectively influence land use decisions, including forest sustainability and economic development. In other words, the relationship between these factors and deforestation is complex. Population growth and economic activities such as agricultural expansion, mining, and road building may directly contribute to forest loss. In contrast, environmental and physical factors, namely, climate and topography, may influence the vulnerability and resilience of forests to human activities (Figure 1). In sum, the processes described above are interlinked, forming a complex web of interactions that can exacerbate environmental degradation and socio-economic challenges. For instance, population growth increases food demand, leading to agricultural expansion and intensified deforestation, which can exacerbate the impacts of rainfall variability and lead to greater vulnerability to climate change. Similarly, topography and slope influence where and how agriculture can expand, affecting soil erosion rates and water availability.
Hypothesis 2 (H2).
Natural factors such as rainfall variability and topography can be crucial in shaping a forest’s vulnerability to various disturbances.

3. Materials and Methods
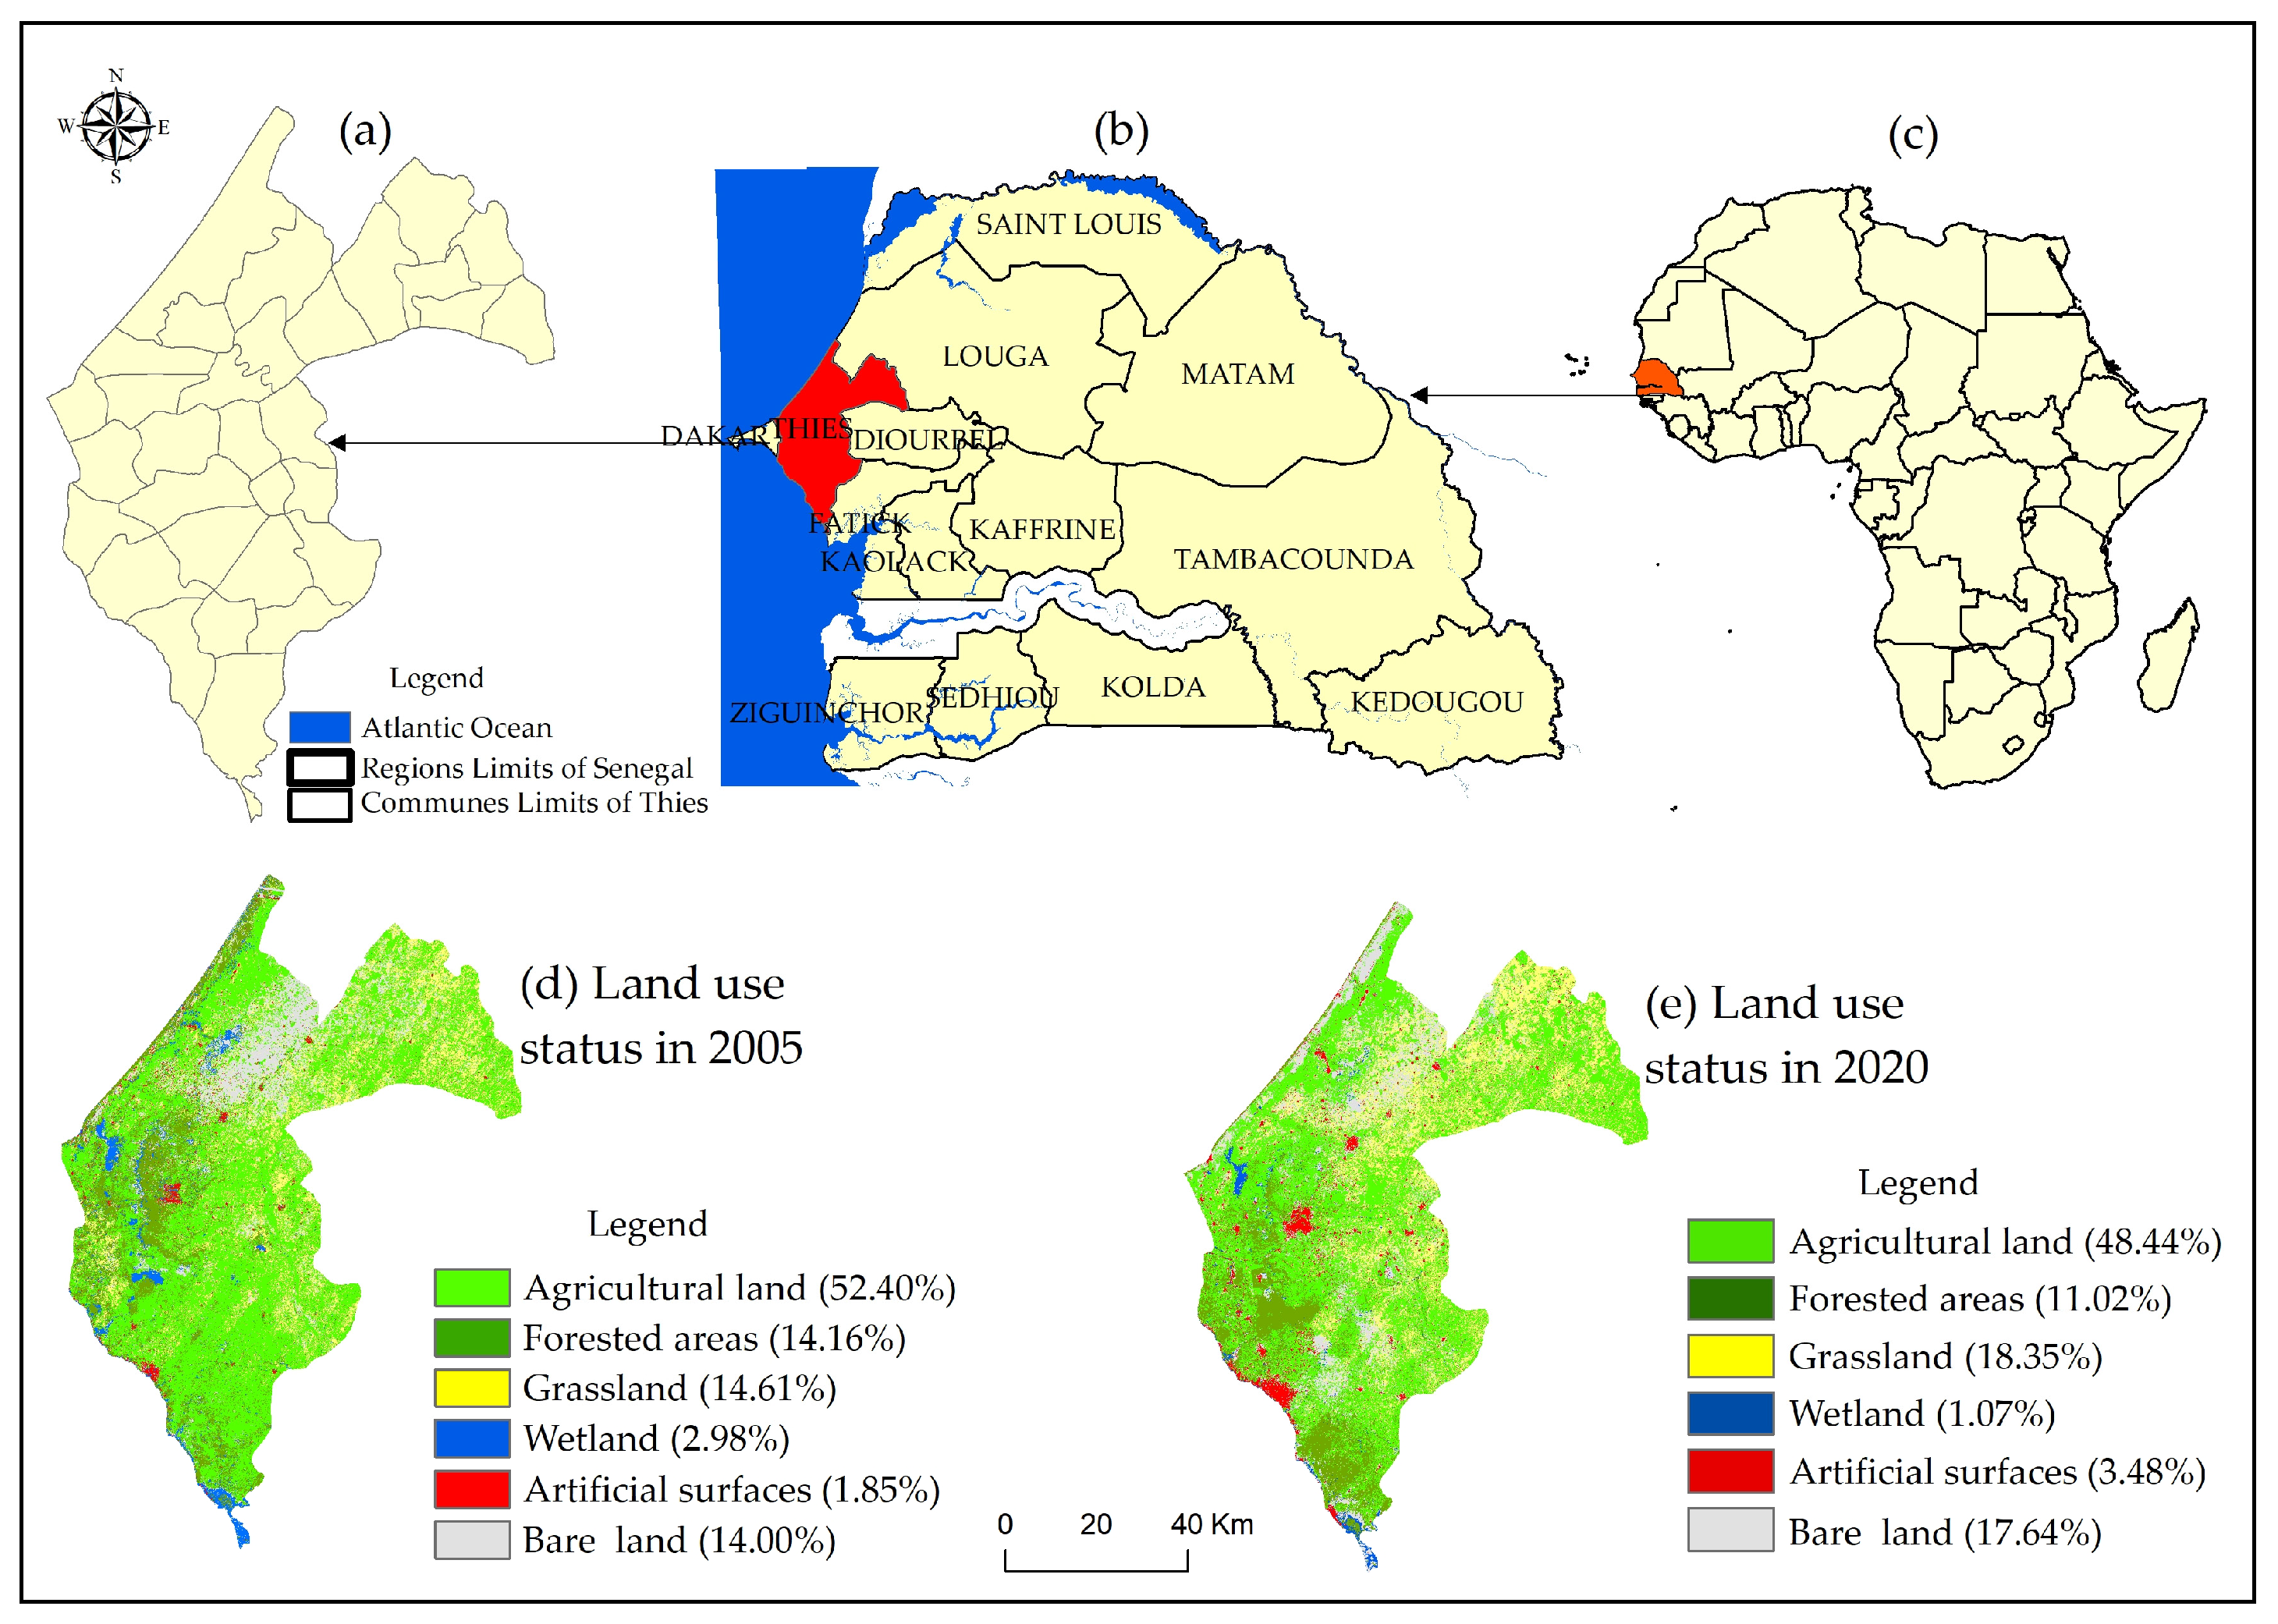
3.1. Study Area

The Thiès region spans from latitude 10°44′46″ to 10°52′46″ N and from longitude 78°39′11″ to 78°44′13″ W. It covers approximately 6669.6 km2, which accounts for 3.35% of Senegal’s total land area. Considering the importance of peanut and vegetable production, the Thiès region plays a critical role in Senegal’s economy. In 2020, peanuts and millet collectively constituted 78.1% of the total crop production, while vegetable cultivation, covering one-third of cultivated areas, contributed approximately 30.25% to the national output. The “Niayes Zone”, situated on the Thies region’s coastal line, contributes significantly to employment through market gardening, which fulfills more than 50% of Senegal’s need for fruits and vegetables (CIDRAD, 2022). In addition, from 1986 to 2021, the shrub savannah area decreased from 10,883.45 hectares to 7414.46 hectares, marking a decline of 29.29%. Exploring the data from the National Agency of Statistics and Demography (ANSD) in 2020, we found that about 51.8% of farmers’ plots faced socio-economic or natural factors. In 2020, this accounted for about 2,162,831 inhabitants (ANSD). From 2009 to 2018, urban growth in the Thiès region exceeded 7% [8]. The urbanization trend will be poised to amplify through the initiative of multiple projects, including establishing the “Ndayane” port. Accordingly, this context highlights the dual challenge of substantial socio-economic development and the imperative for effective land management.
Regarding land use classification, Figure 2 indicates that agricultural land constituted 52.40% of the total in 2005, decreasing to 48.40% by 2020, while grassland area accounted for 14.61% in 2005 and increased to 18.4% in 2020. Conversely, artificial surfaces represented 3.5% in 2020 and 1.85% in 2005. Consequently, agricultural and grassland dominated the land use morphology, comprising 66.78% of the total land area in 2020. In summary, two significant conclusions can be drawn: decreases in agricultural land (−0.005%), forested areas (−0.015%), and wetlands (−0.043%) from 2005 to 2020, coupled with simultaneous increases in grassland (0.017%), bare land (0.017%), and artificial surfaces (0.059%) from 2005 to 2020. The topography of the Thiès region is predominantly flat, except for the “Plateau of Thiès”, reaching an altitude of 141 m. The highest recorded temperature in the area is 33.2 °C. According to data compiled by the National Agency of Civil Aviation and Meteorology (ANACIM), the interannual rainfall patterns showed an average of approximately 461.65 mm from 2000 to 2020. The prevalent soil characteristics include mild leaching and tropical sandy soils with a ferruginous component [10].

3.2. Data Source

The Ecological Monitoring Centre (CSE) in Senegal supplied shapefile data delineating the administrative commune boundaries. For this research, all 31 administrative communes were considered to explore the features of forested areas from 2005 to 2020. The remote sensing data used in the study were collected from various satellites, namely Landsat 7 ETM + C1, Landsat 5, and Landsat 8 OLI. These satellite imageries were sourced from the United States Geological Survey (USGS) website, boasting a spatial resolution of 30 m (http://eartheplorer.usgs.gov/, accessed between July and August 2022). Furthermore, socio-economic data, including population statistics and climatic data such as rainfall, were gathered in November 2022. ANSD, the World Bank (WB), and the ANACIM of Senegal provided the respective datasets for this research.
Accurately determining forested areas in Senegal hinges on the crucial consideration of the collection time for satellite images. Senegal experiences two primary seasons that define its weather trends: a dry season extending from November to April or May and a rainy season from May or June to October, contingent on specific geographical location [44]. The Thiès region’s rainy season extends from July to October [45], coinciding with the rainfall in our research area. However, to optimize the identification of features related to land use types, we opted for the rainy months to mitigate the impact of clouds and seasonal variations. Thus, following Feteri et al., the choice of Landsat images primarily relied on factors such as the availability of cloud cover percentages [46]. Due to these constraints, the collection of Landsat data was confined to the period from September through to November.

3.3. Method

Considering the scope of the study area, two satellite images were captured annually. Subsequently, given the features of the remote sensing data, pre-processing was deemed necessary to enhance clarity. Various steps were taken to achieve this. Initially, to enhance the image quality, the layers were re-projected to align with the reference projection system of the study area, specifically the World Geodetic System (WGS)_1984_Complex_UTM_Zone_28N (EPSG:31028). Then, we resampled the images to 50 m, the standard resolution for all images [47]. Geometric correction procedures were executed, including atmospheric correction, gap filling in Landsat 7 ETM, and image mosaicking via ENVI 5.1 software. Following these processes, supervised classification was employed to categorize land use types for this study, involving selecting training samples for each land cover class. Referencing the classification system by Anderson JR et al. [48], we reclassified the land use types into six (6) categories: agricultural land, forested areas, grassland, wetland, artificial surfaces, and bare land (Table 1). After converting raster data into polygons, the ArcGIS 10.6 platform was utilized to conduct statistical analyses related to land use types, focusing on the statistics of forested areas over various periods.
A precise evaluation is crucial for conducting a land use change analysis and classification. However, the complete precision values derived from the post-classified images generated for 2005, 2010, 2015, and 2020 exhibited yearly variations. Notably, the least accurate year was 2020, registering at 0.91, while the highest accuracy was recorded in 2005, reaching 0.92. However, the overall accuracy for the entire study period remained consistent at 0.91. Furthermore, the kappa coefficient stood at approximately 89.4%, signifying a high consistency and accuracy in the simulation results compared to the actual Land Use and Land Cover (LULC) distribution. This is noteworthy, as the generally accepted standard accuracy for LULC classification is around 85% [49].

3.3.1. Tracking the Origins and Flow of Forested Areas

Analyzing the source and pathways of forested areas can help to discern the dynamics of land loss or acquisition from or to other land types (transfer in or out) [50]. Indeed, this process involves several sequential steps. Initially, we introduced the land use transfer transition matrix to compute the transition characteristics of land use types. The transition matrix encapsulated the area transferred out during the initial period and the area transferred in during the concluding period. The following equation was used to calculate the transition matrices:
S i j = S 11 S 12 S n 21 S 21 S 22 S n 22 S n 1 S n 2 S n n
where n represents the land use type before and after the transfer; i, j (i, j 1, 2 ..., n) represent the land use type before and after the transfer, respectively, and Sij represents the land use area i land type before land conversion to type j land type after the transition [14].
Secondly, the transfer matrix was used to determine the forested areas’ amount and the net transition area transfer. Then, based on the above steps, the amount of “transition reduction” or “transition gain” in the net transition area of forested areas in different periods was calculated according to the equations above. The specific formula is described below:
F A l o s s   i ,   j = A L i , j A L I   × 100         i j ,         F A g a i n   i ,   j = F A i , j F A I   × 100         i j ,
F A N l o s s   i ,   j = ( F A   j , i F A i , j ) / ( F A i F A i ) × 100   i j ,
where FAloss (i),j is the ratio of areas converted from forested areas into land use type j FA (i),j to the total area of all types of land converted from forested areas in the year i (∆FAi). FAgain (i),j is the ratio of areas of land use type i converted into forested areas (FAi,j) to the total areas of all types of land converted into forested areas in year j (∆FAj). Here, j refers to the column number and i refers to the line number in the land transition matrix. Both FAloss (i),j and FAgain (i),j are the contribution rates of land use of certain types converted from or into forested areas. FANloss (i),j refers to the net transition rate of forested areas contributed by land use type j, calculated as the ratio of the net converted area from land use type j into forested areas (FAj,iFAi,j) to the total net converted land areas into forested areas in the year i (FA.iFAi) [51].

3.3.2. Determining the Forested Area’s Dominant Morphology

This study chose four indicators, namely, Patch Density (PD), the Largest Patch Index (LPI), the Aggregate Index (AI), and the Landscape shape Index (LSI), for assessing the forested areas’ dominating morphology in Thiès Region from 2005 to 2020. The ArcGIS and FRAGSTAT.4.2 software were used to compute these four indicators for characterizing the changes in the forested area’s dominant morphology in 2005, 2010, 2015, and 2020.
(a)
Determination method of the Patch Density (PD)
As expressed in Equation (4), PD represents the patch number of one specific landscape type per one hundred hectare area [50]. PD is an “aggregation metric” describing forested area fragmentation in this study. The larger the value, the greater the fragmentation of the landscape. So, a low PD implies fewer patches and the continuity of forested areas, while higher values denote more patches, spatial dispersion, and discontinuity.
P D = n i A
where ni is the number of patches of forested areas that change landscape type i and A is the total area of the forested areas.
(b)
Determination method of the Largest Patch Index (LPI)
LPI reflects the dominant patch type in the changing landscape of forested areas and indirectly reflects the direction and magnitude of disturbances to human activity. The calculation method is presented in Equation (5):
L P I = m a x ( a i , a n ) A × 100
LPI values are expressed in percentage and range of 0 < LPI ≤ 100; a is the patch area and n is the number of patches in the forested areas. The LPI approaches 0 when the largest patch of the corresponding patch type is increasingly small. LPI = 100 when the entire landscape consists of a single patch of the corresponding patch type, and the largest patch comprises 100% of the landscape.
(c)
Determination method of the Aggregation Index (AI)
In forested area change research, spatial pattern aggregation levels must be measured within a single map class and over the same period. So, AI reflects the degree of patch-type clustering in the forested areas that change the landscape. AI assumes that the highest collection level (AI = 100) comprises pixels that share all possible edges. A class whose pixels share no edges (are completely disaggregated) has the lowest level of aggregation (AI = 0). AI reflects the degree of aggregation of patches of forested areas. Low AI values indicate fewer aggregation levels in forested areas and vice versa [52].
A I = 2 ln n + i = l n j = l n P i j   ln ( P i j   )
where n is the number of classes in the landscape and pi,j is the total number of times class i is adjacent to class j, divided by the number of times class i is adjacent to all other classes, including itself. AI ranges from 0 to 100, with 0 indicating the least contagion [53].
(d)
Determination method of the Landscape shape Index (LSI)
LSI quantitatively measures landscape complexity or heterogeneity. LSI is an aggregation metric. Also, it is the ratio between the actual landscape edge length and the hypothetical minimum edge length [54]. The minimum edge length equals the edge length if only one patch is present.
  L S I = E m i n E
where E is the total edge length on cell surfaces and minE is the minimum total edge length on cell surfaces.

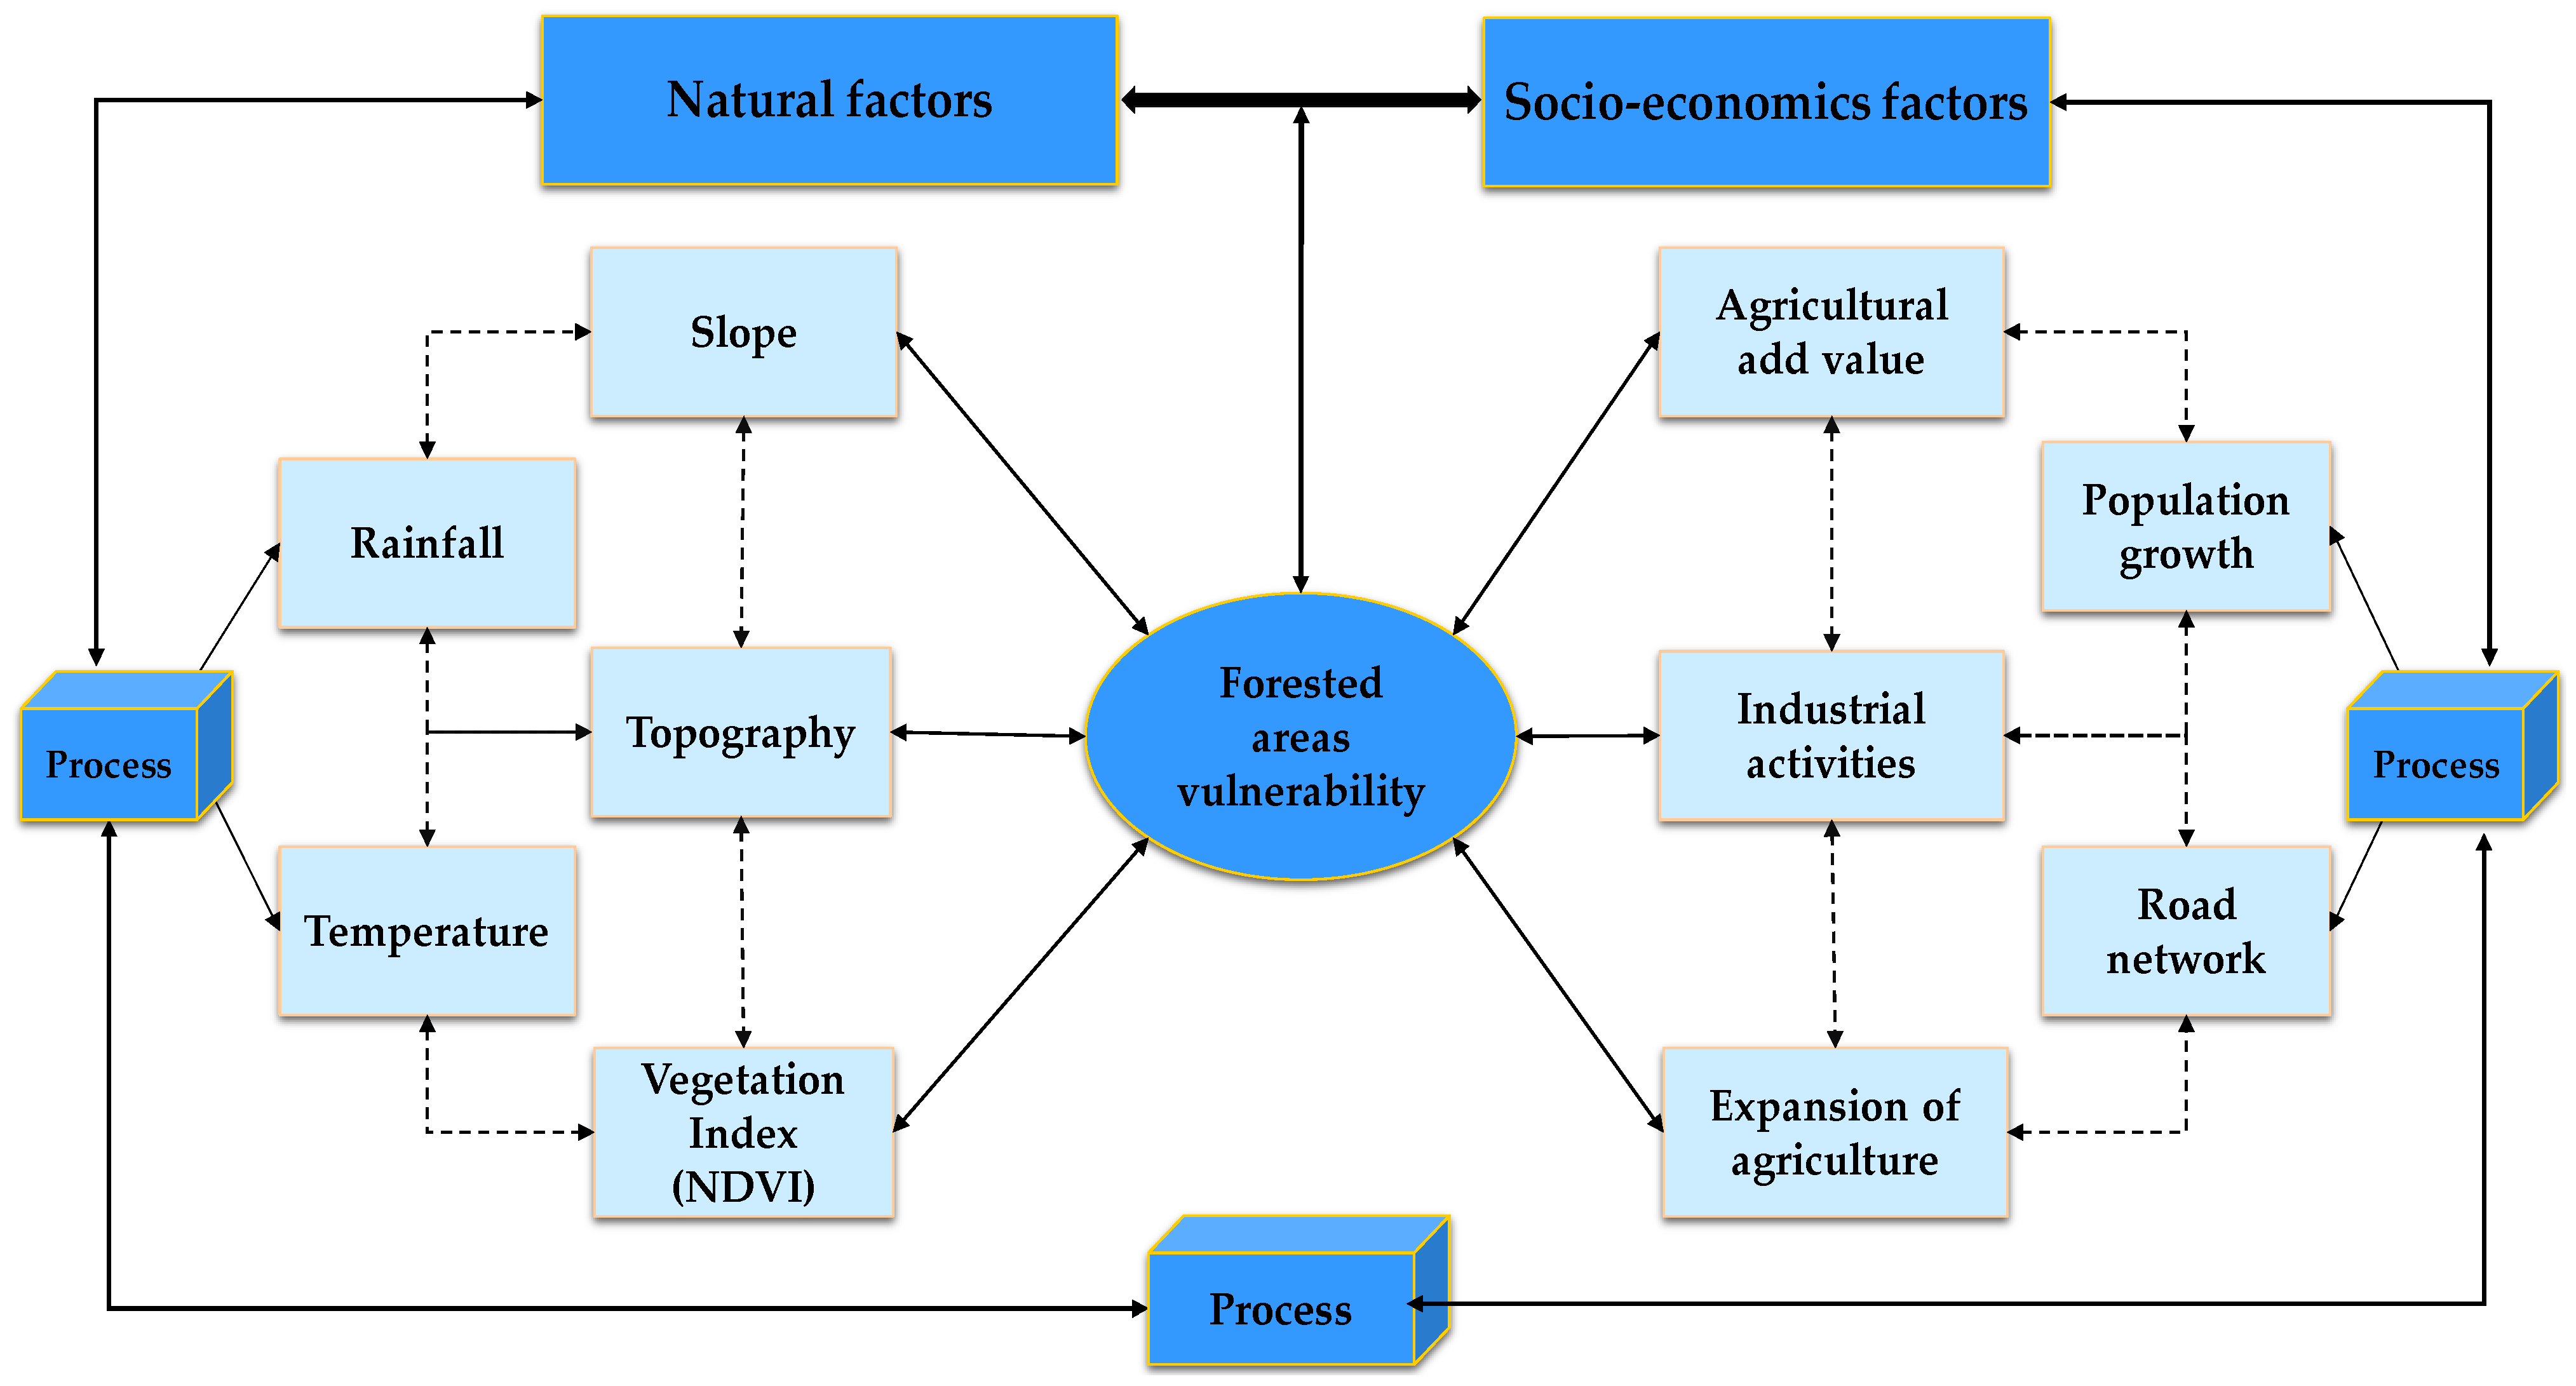
3.3.3. Identifying Key Underlying Factors

Between 2009 and 2018, cultivated land increased by 14.53% in the groundnut basin of Senegal [8]. Expanding agricultural land (1) can increase the vulnerability of forested areas [41]. In addition, prior work has highlighted that precipitation, such as rainfall (2), determines the potential distribution of terrestrial vegetation and constitutes the principal factor in the genesis and evolution of soil. The importance of the socio-economic development of the African continent is on the rise in the context of climate change, incorporating elements such as rising temperatures (3) and pressure on land [55], particularly in forested areas. Climate, topography, flora, soils, and other natural resources are all considered as parts of the concept of land, specifically the use of forested areas. As a result, essential factors related to land evolution must be considered when assessing forested area changes.
The nexus between elevation (4), vegetation index (5), and forested areas is closely linked. A comprehensive scientific analysis of natural factors such as elevation and road distance (6) may be essential in implementing effective policy strategies for forested areas. Elevation and topography influence cultivated land ridge orientation [39]. In the study area, the topography is relatively high in the west. The maximum elevation is located at the center at 141 m. Or, in the south, the low value reached −13 (Figure 3). This situation may negatively impact the conservation of forested areas.
For this reason, these variables are chosen as indicators. Also, erosion reduces soil quality and induces the degradation of forested areas. From then on, the slope degree (7) can cause potential soil erosion that can reduce the soil quality and induce the degradation of forested areas. From the point of view of socio-economic development, increasing population density (8) and manufacturing added value (9) lead to the extension of road and highway networks and worsening pressure on forested areas. Finally, agricultural added value (10) is integrated into the variables to understand the effect of agricultural land use on forested areas. These integrated data may help to comprehensively assess the factors influencing forested areas in the Thiès region. This study selected the forested area’s dominant morphology, namely, PD, LPI, AI, and LSI, as dependent variables.
A mixed linear regression model was built to explore the potential influencing factors on forested areas in the Thiès region. The multiple regression model was formulated as follows:
Y = a + β 1   X 1 + β 2 X 3 + + β n X n
Here, Y represents the dependent variable, and X1,…, and Xn are the n independent variables. In calculating the weights a, b1,, bn, a regression analysis ensures the maximal prediction of the dependent variable from the set of independent variables and is performed by least squares estimation [56].

4. Results

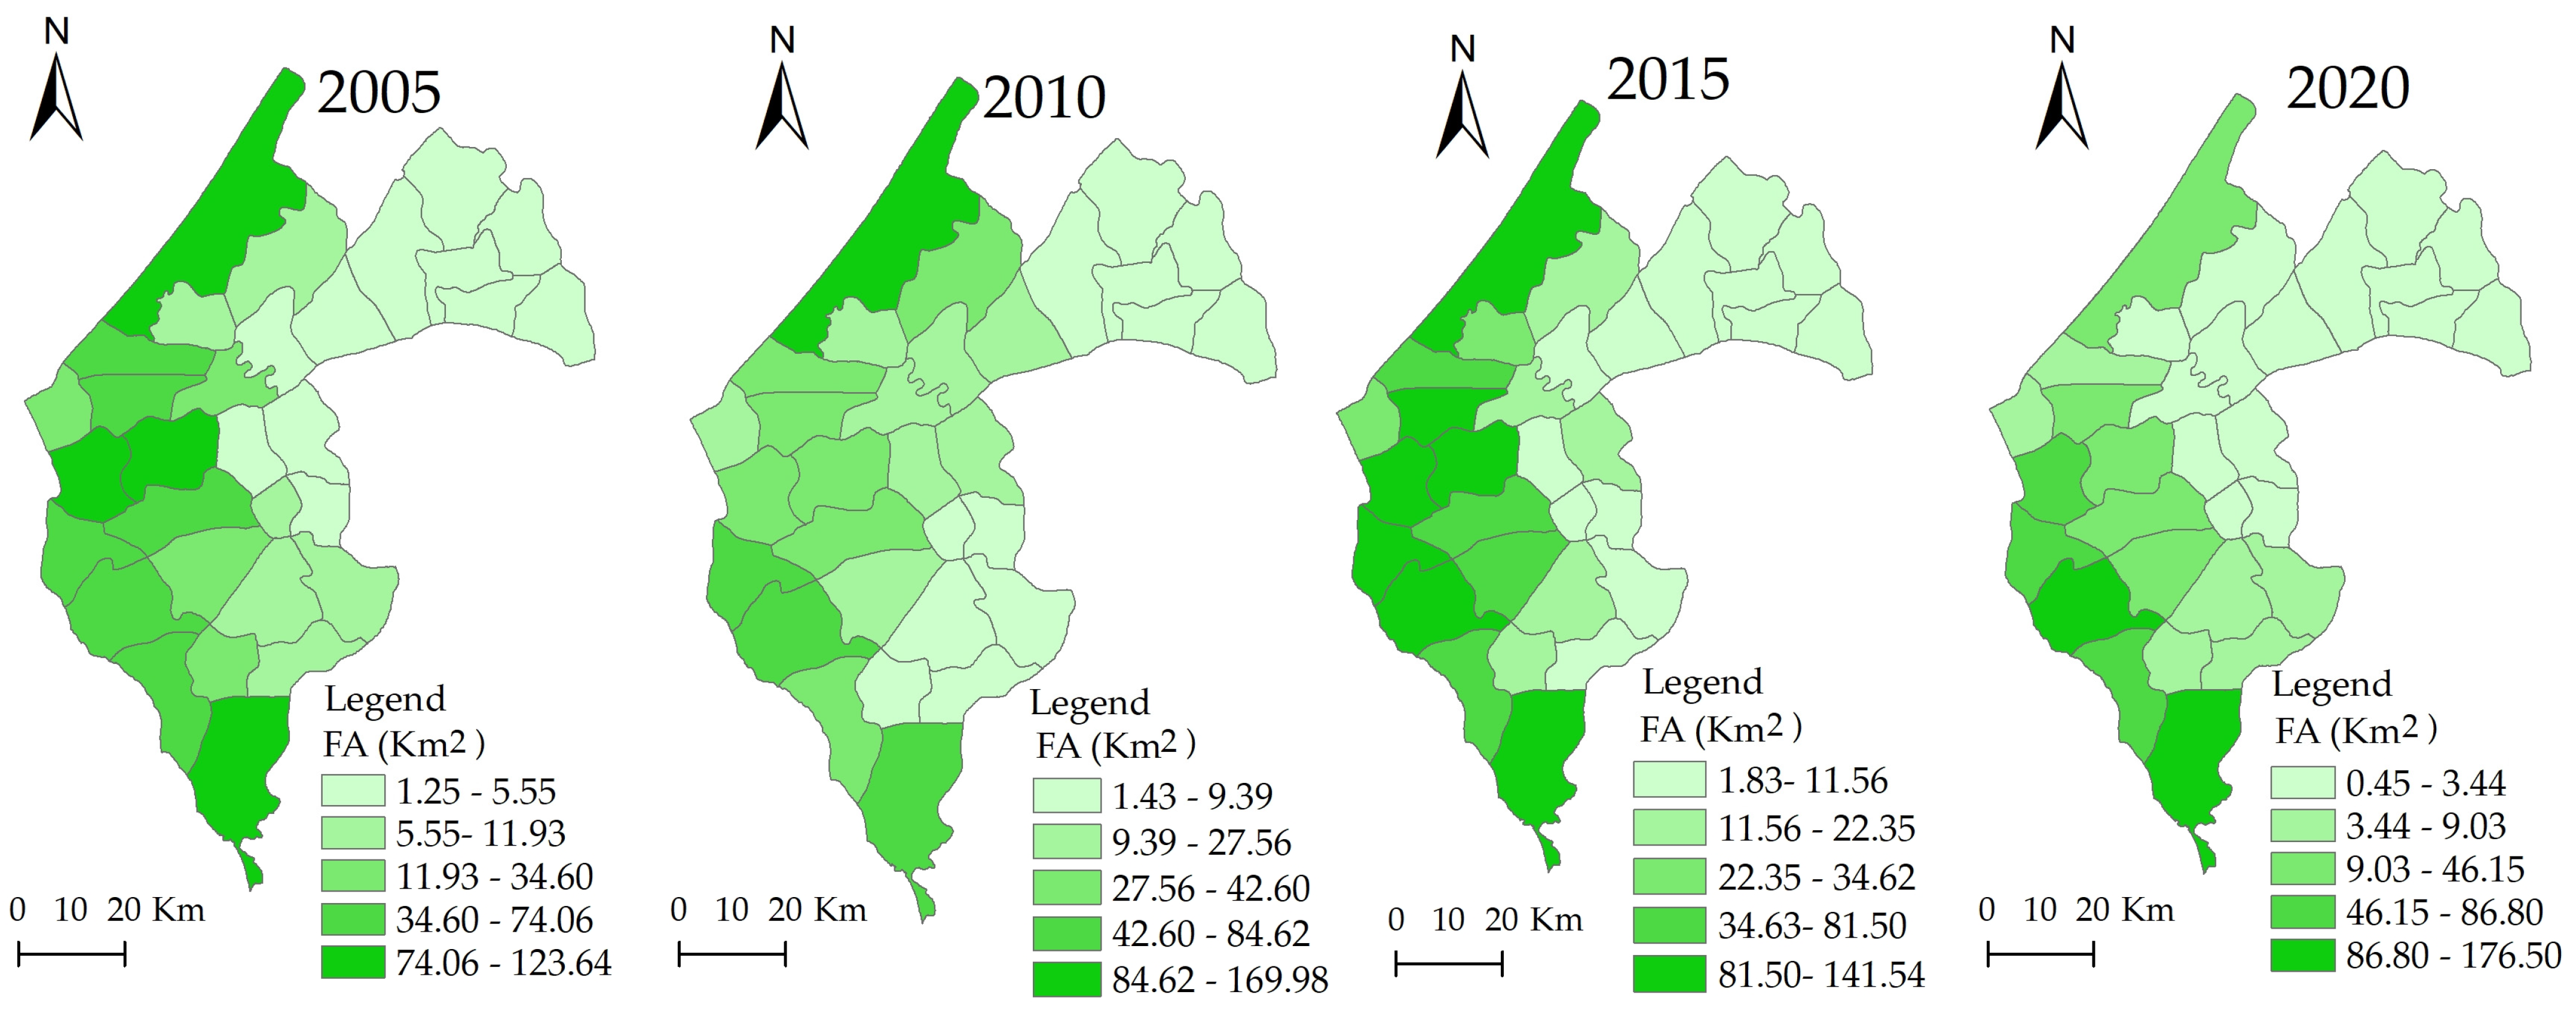
4.1. Exploring the Forested Area’s Evolution Status

Developing effective policies for ecosystem management necessitates a timely and comprehensive understanding of the status and trends in forested areas. It is crucial to recognize the various characteristics exhibited by the evolution of these areas. Spatially, forested areas in the Thiès region are unevenly distributed, with concentrations primarily along the western border adjoining the Atlantic Ocean, notably in communes such as Mboro and Darou Khoudouss (Figure 4). The study area stretches along the northern coastline from Kayar to Saint Louis, encompassing the Mont-Rolland, Thies, and Keur Moussa communes in the central region and the Ngueniene commune in the south.
The evolution of forested areas is intricately linked to other land use types, notably, cultivation. An analysis of temporal trends (Table 2) reveals fluctuations over different periods. In 2005, forested areas comprised approximately 14.16% of the total land area, declining to 10.18% by 2010, representing a decrease of −0.019%. However, from 2010 to 2015, there was a slight increase of 0.046%, followed by a decrease of −0.024% from 2015 to 2020. Overall, the study period (2005–2020) witnessed a reduction of −0.015% in forested areas, while artificial surfaces and grasslands experienced growth. Looking into these findings, ecosystem services, particularly those provided by forested areas, exhibit distinct patterns in the Thiès region due to spatial heterogeneity, rich biodiversity, population growth, resource endowment, fragile political landscapes, and ongoing urbanization processes.

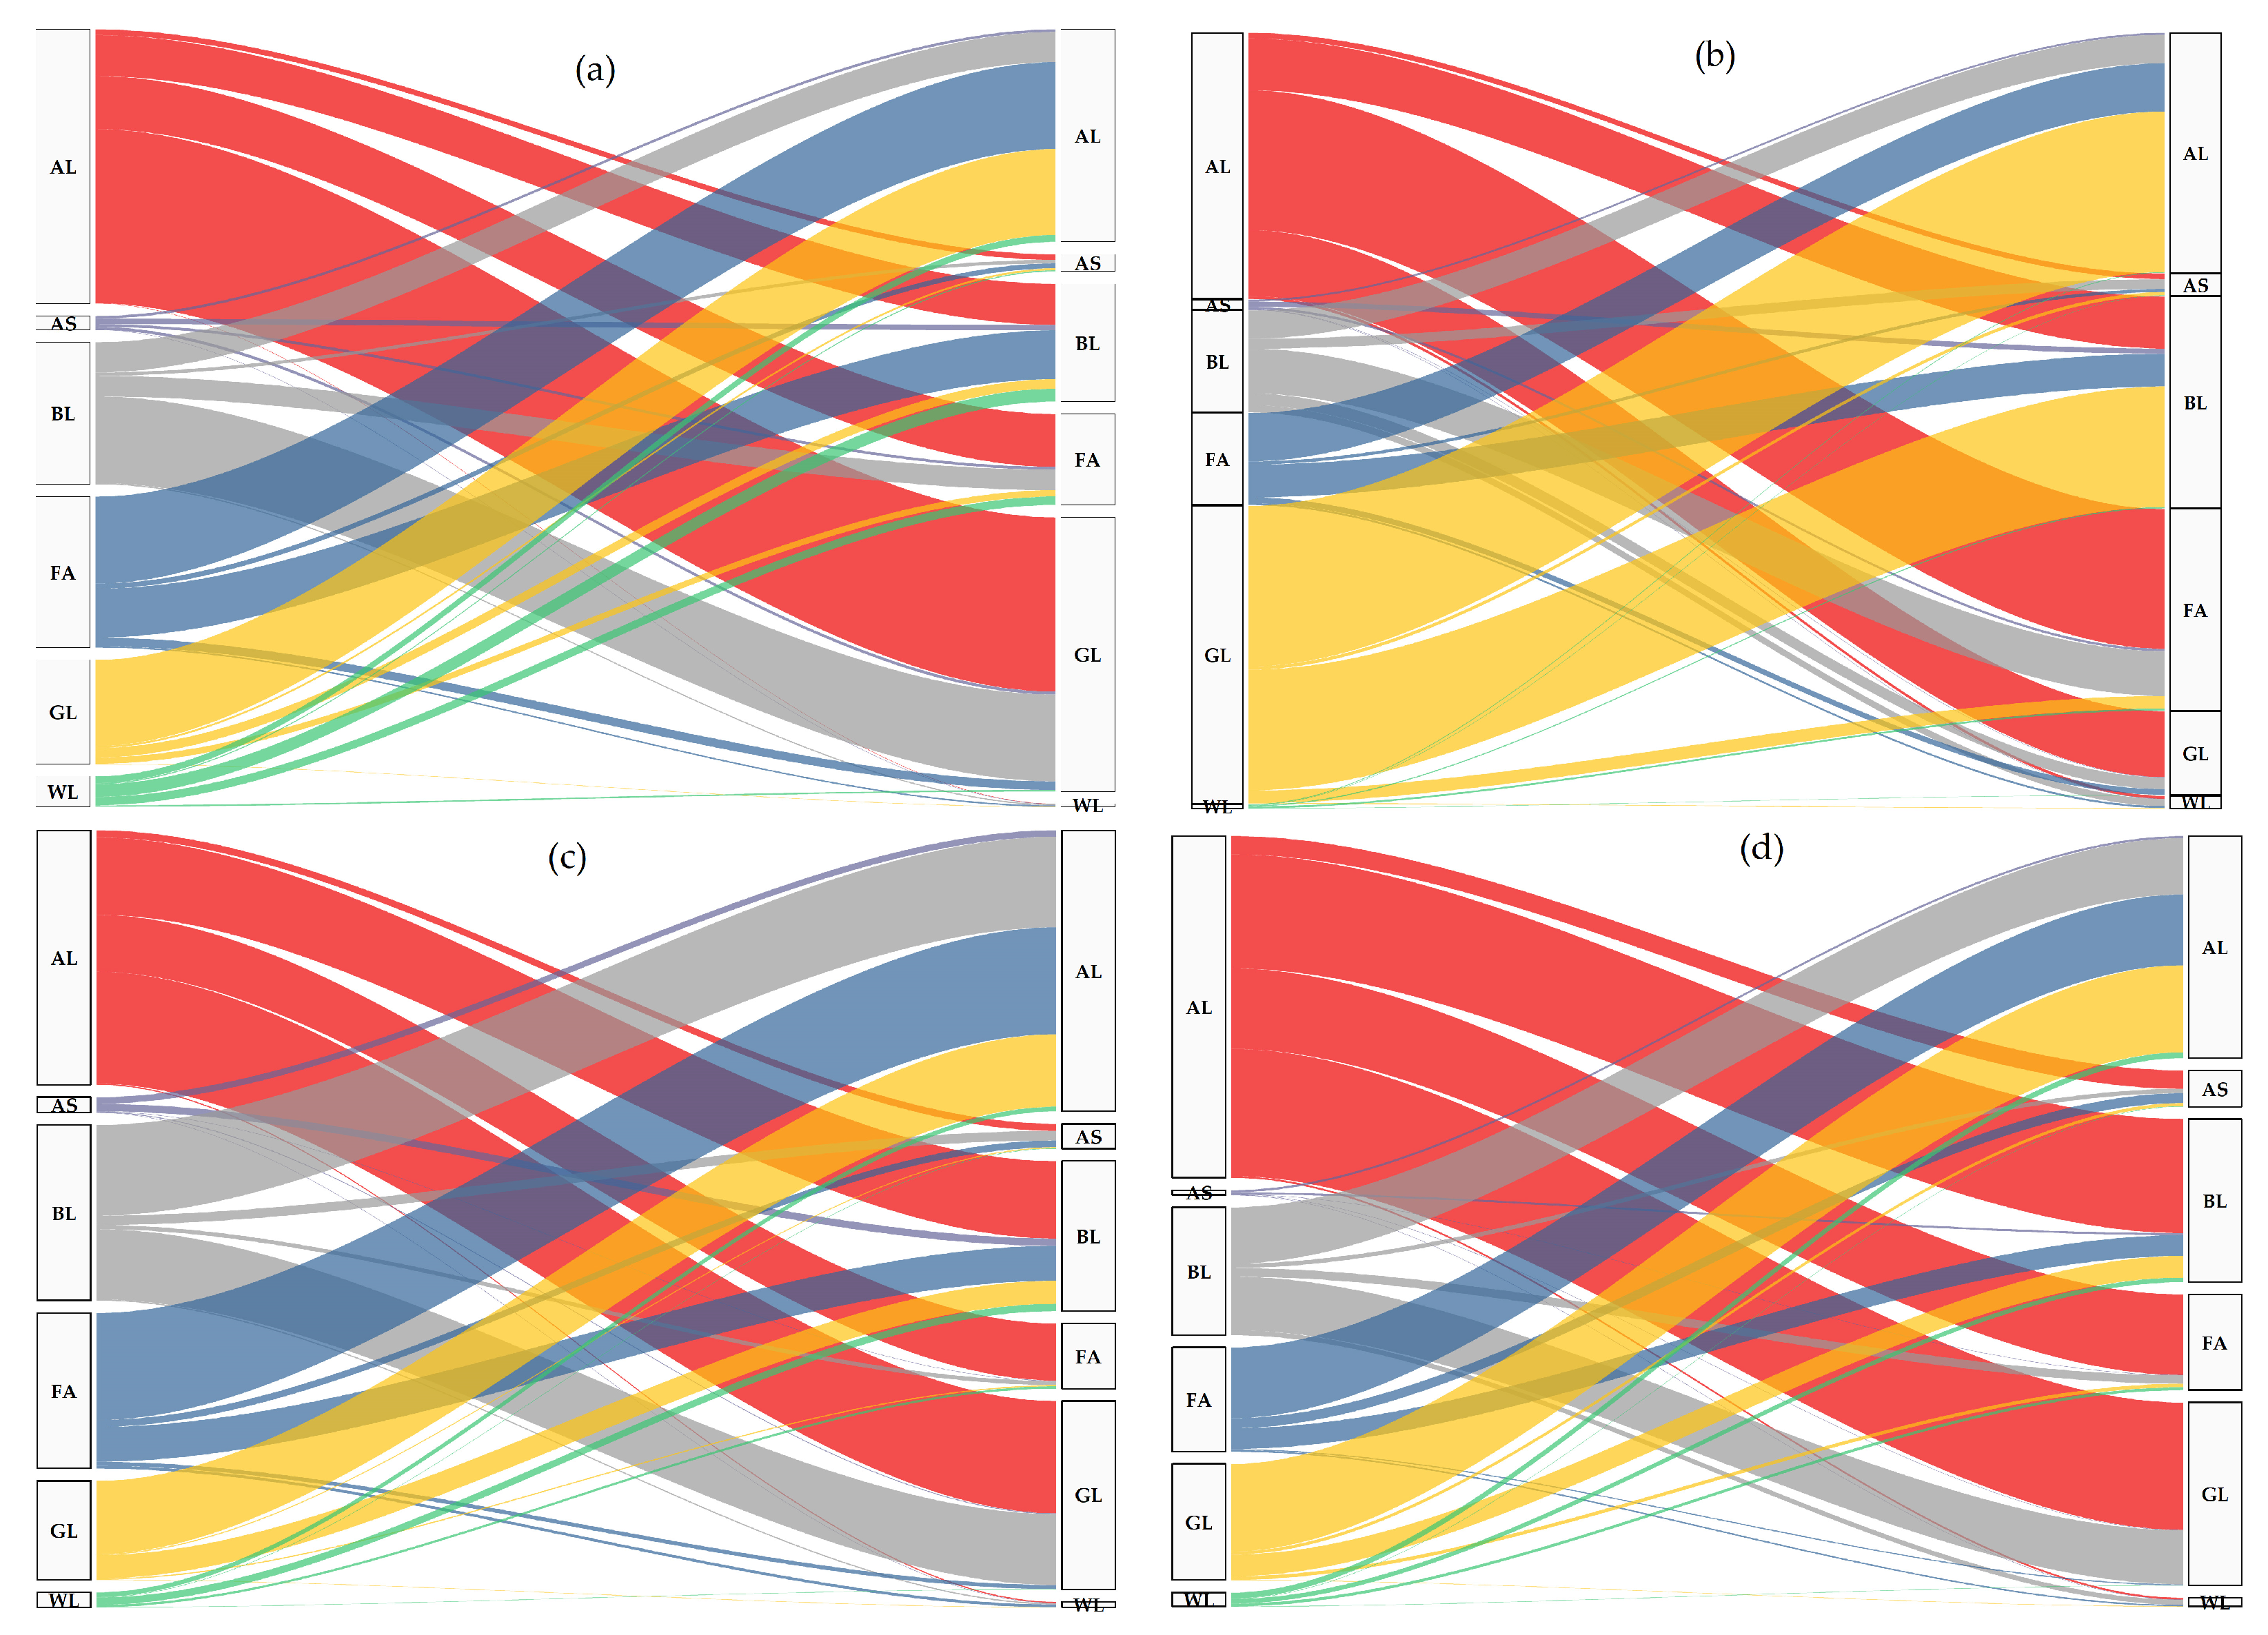
4.2. Analysis of the Forested Areas’ Exchange Status

Understanding the dynamics of forested areas in relation to other land use types is crucial for effective forest management. Analyzing the exchange status between different land use types provides valuable insights into the factors influencing forestry areas. As displayed in Figure 5 and Table 3, the findings from the matrix transfer vary across different periods. Notably, the period from 2010 to 2015 indicated a significant transfer of agricultural land (592.6 km2) to forested areas (Figure 5b), while approximately 204.6 km2 of forested areas was lost. This shift resulted in ecological enhancements in land use.
Similarly, the exchange status between forested areas and artificial surfaces revealed a net transfer of 12.2 km2 to forest areas compared to 22.6 km2 from forest areas, resulting in a net loss of approximately −10.4 km2 of forested areas between 2005 and 2010. Thus, the inter-period indicates that agricultural land was the most critical land use type that impacted forested areas (Figure 5). Therefore, these findings indicate the importance of the responsible management of agricultural land.
The research period spanning from 2005 to 2020 served as a comprehensive pivot for exploring the global intensity of the exchange between forested areas and other land use types that may influence their vulnerability. In the context of the interplay between agricultural land and forested areas, the analysis shows a net loss of forested areas (−78.8 km2) with a transfer of approximately 370.5 km2 into forested areas compared to a transfer out of 449.39 km2. In addition, the nexus between ecological and bare land shows that forested areas were lost at about −127.8 km2. Or, artificial surfaces (−65.3 km2) and grassland (−0.30 km2), although causing a loss of forested areas, did not exceed the amount transferred out of agricultural land regarding forested areas. Therefore, agriculture and bare land emerged as the primary factors influencing the vulnerability of forested areas, with agriculture being the most significant contributor to forest loss (Figure 6).
In summary, agricultural land, bare land, and artificial surfaces had the most significant impact on forested areas. However, the complex and fluctuating relationship between forests and other land use types underscores the uncertainty surrounding the impact of land use changes on ecosystem services, particularly in forested areas. Accordingly, enforcing land use regulations that promote sustainable forest resource use and protect agricultural land from transition is fundamental in the Thiès region.

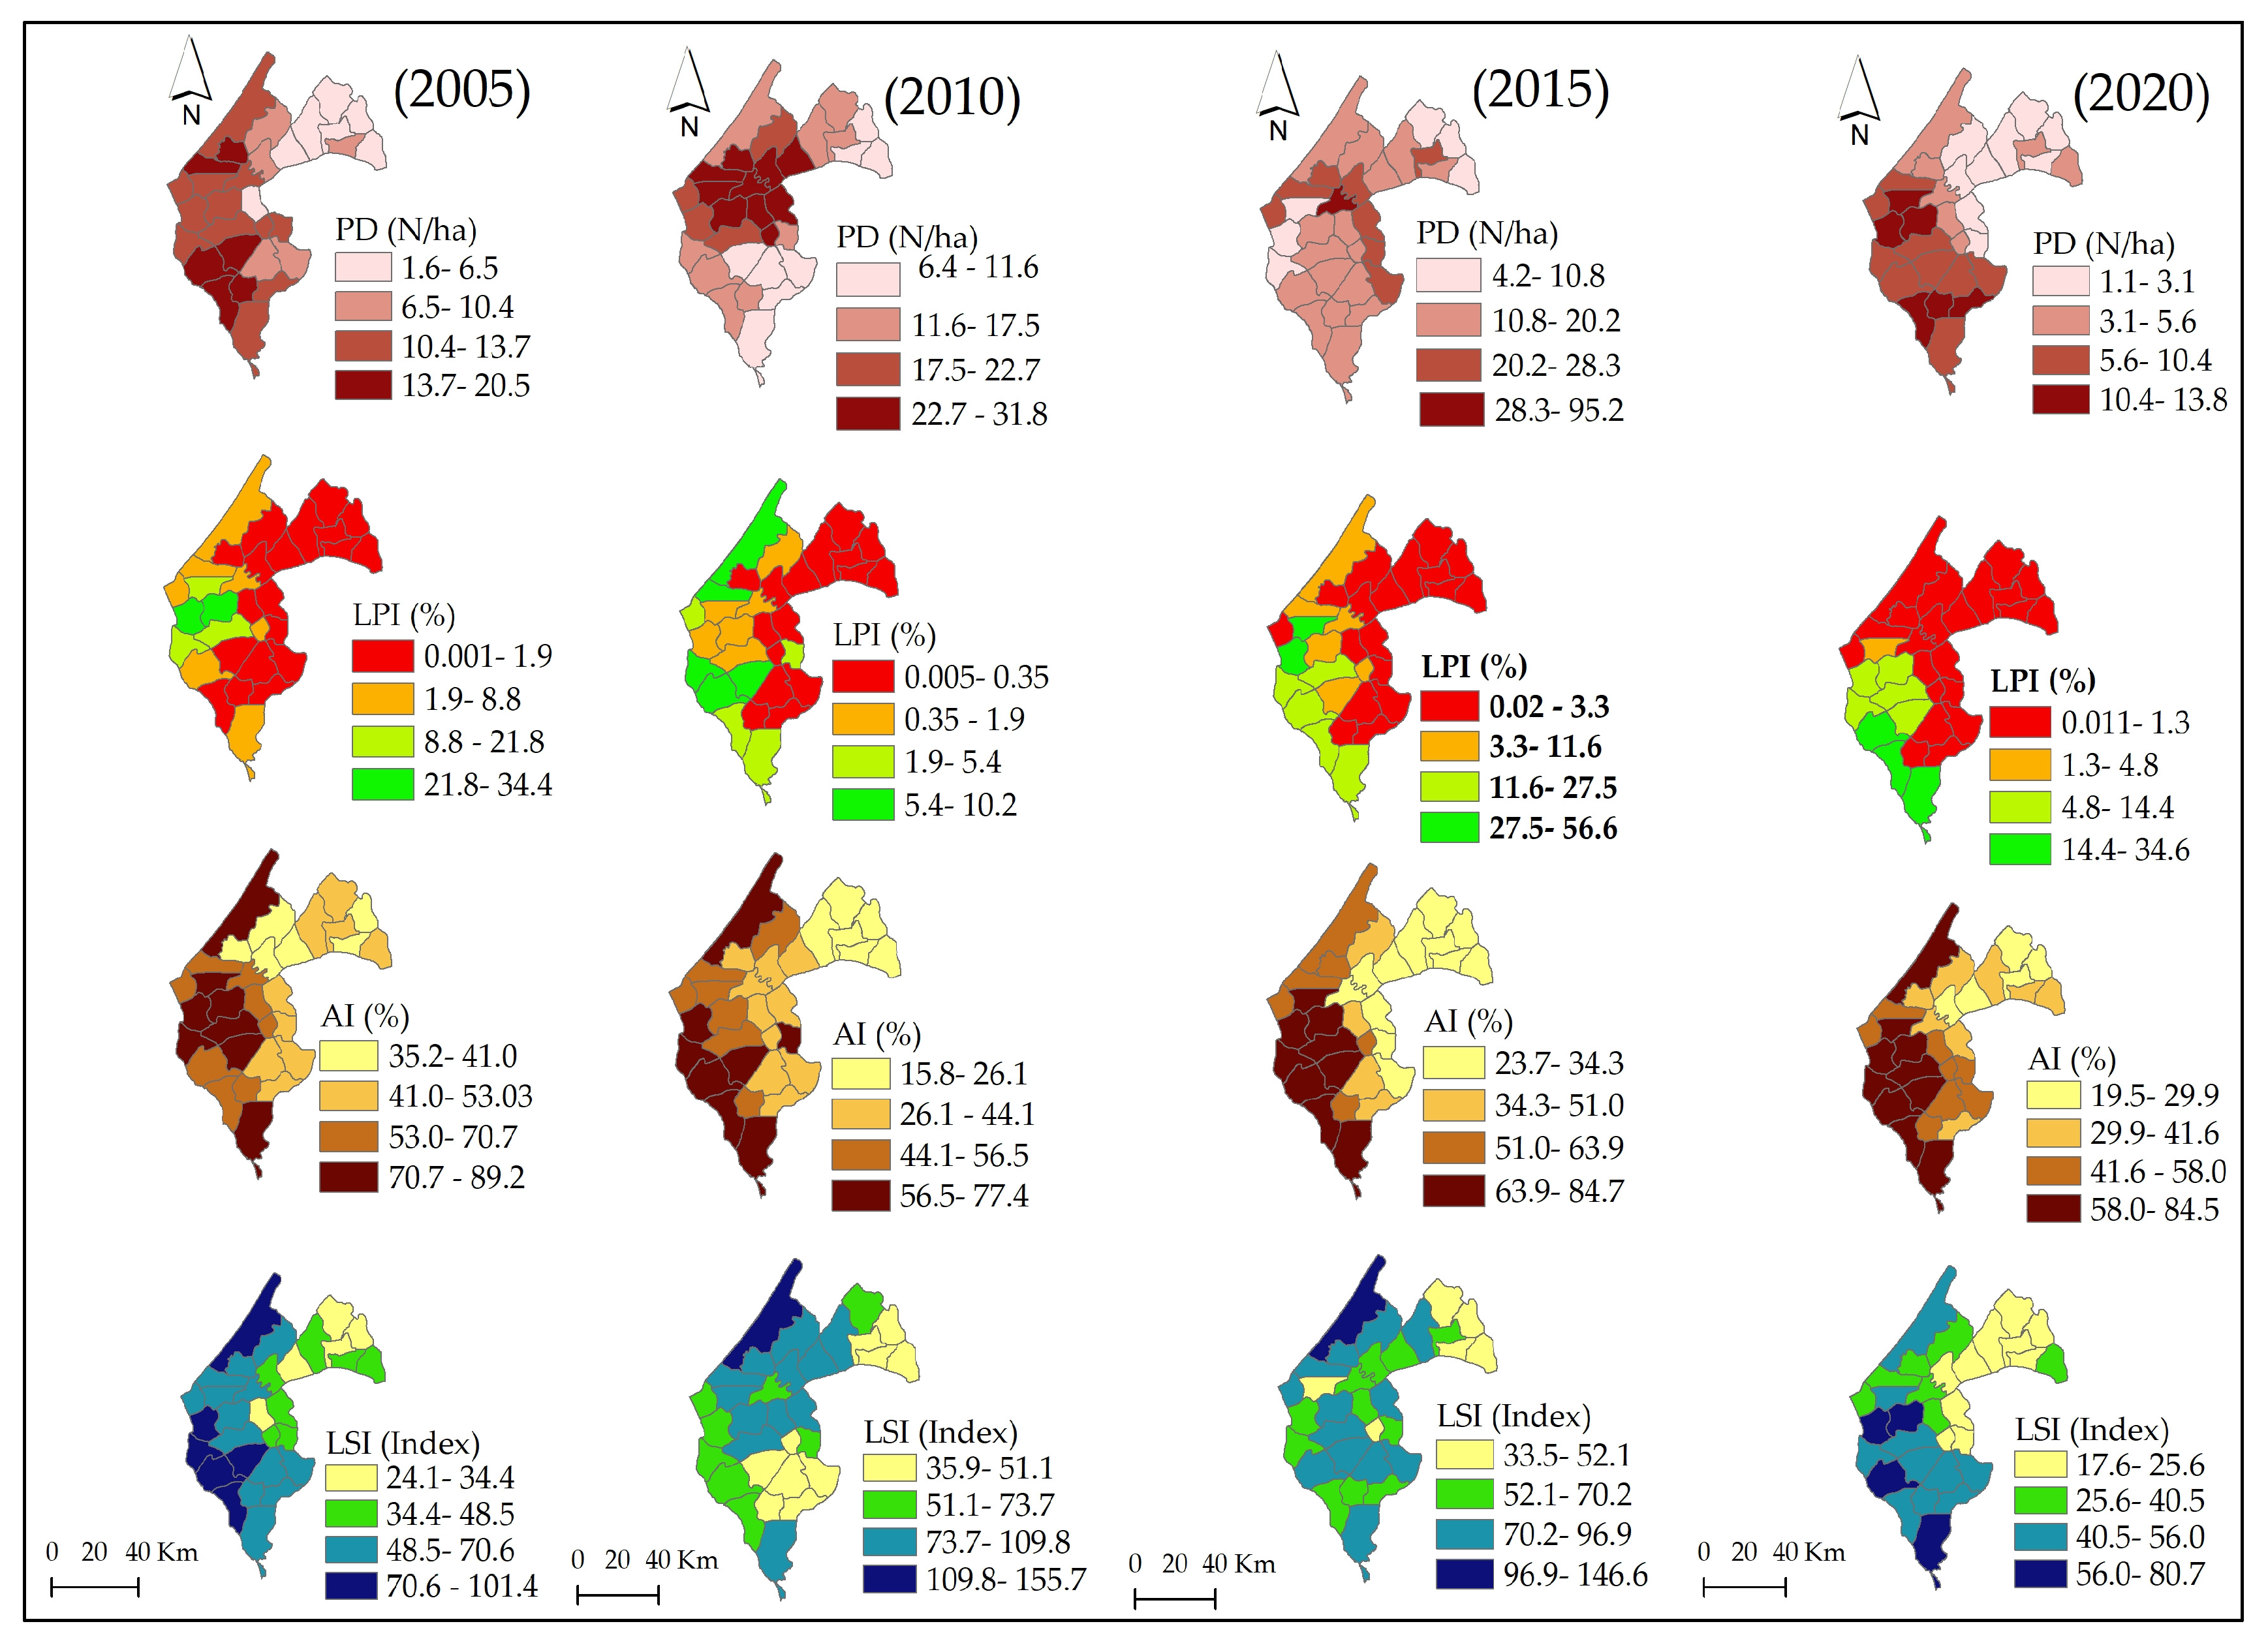
4.3. Characteristics of Forested Areas’ Dominant Morphology

Resampled remote sensing data with a spatial resolution of 50 m for 2005, 2010, 2015, and 2020 were imported into Fragstats 4.2 to compute the PD, LPI, AI, and LSI. The literature indicates that PD is the number of patches of forested areas per unit area. PD, representing the number of forested area patches per unit area, is crucial to the spatial characteristics of the forested areas and their management system. In 2005 and 2020, significant PD values were observed in the western and southern regions, while lower values were found in the eastern and northern regions (Figure 7). Despite variations in PD, LPI, AI, and LSI, forest fragmentation was consistently high in the Thiès region, suggesting greater vulnerability in the east compared to the west and south.
From 2005 to 2020, the average PD in the Thiès region was approximately 2.5 patches per 100 hectares, peaking at 4 patches in 2010. This indicates increasing fragmentation as PD values rose. The Largest Patch Index (LPI), which measures dominance, averaged around 3.25 patches from 2005 to 2010, indicating small patches and fragmented forested areas. Notably, in 2015, there were six critical patches compared to one in 2010, highlighting increased fragmentation. Similarly, the Landscape Shape Index (LSI), reflecting patch shape complexity, averaged about 112 patches during the study period, with higher values in 2010 (147 patches) compared to 2020 (73 patches). The Aggregation Index (AI) also showed minimal variation, averaging 88 patches throughout the study period, with slight differences between the highest (91 patches in 2020) and lowest (83 patches in 2010) values (Table 4).

4.4. Relationship between Potential Driving Factors and Forested Areas

Among the ten selected variables, all except population density and vegetation index demonstrated a significant relationship with forested areas, contributing to a complex landscape. Rising temperatures and altered rainfall patterns are evident. Notably, the correlation between rainfall and both LPI and LSI (p < 0.05) indicates adverse effects on forested areas in the Thiès region. Forest exploitation through agriculture significantly influences (p < 0.05) and shapes forested areas in the Thiès region. This influence is further highlighted by the relationship between LPI and slope (0.032493) with a p-value < 0.05, indicating a significant impact on forested area morphology. In addition, the results also indicate a significant correlation between AI (0.000837), LSI (0.00358), and slope, which emphasizes the influence of topography on forest fragmentation (Table 5).
Agricultural production is closely tied to the expansion of cultivated land, as indicated by its nexus with AI (0.05894). Interestingly, despite significant population growth, forested areas in the Thiès region have not been substantially impacted, contrasting with trends observed in East African nations where human activities have significantly altered natural landscapes. Thus, the analysis of the dominant forested areas’ morphology in the Thiès region reveals complex interactions between human activities, climate change, and socio-economic factors. These findings underscore the importance of addressing these factors to ensure sustainable forest management, warranting attention from both the government and scholarly communities. In a nutshell, the results of this study partially disproved our initial hypotheses. Vegetation index, temperature, and population density did not influence forested areas in the Thiès region. Moreover, this is a valuable scientific outcome, as it can refine understanding and lead to new hypotheses.

5. Discussion

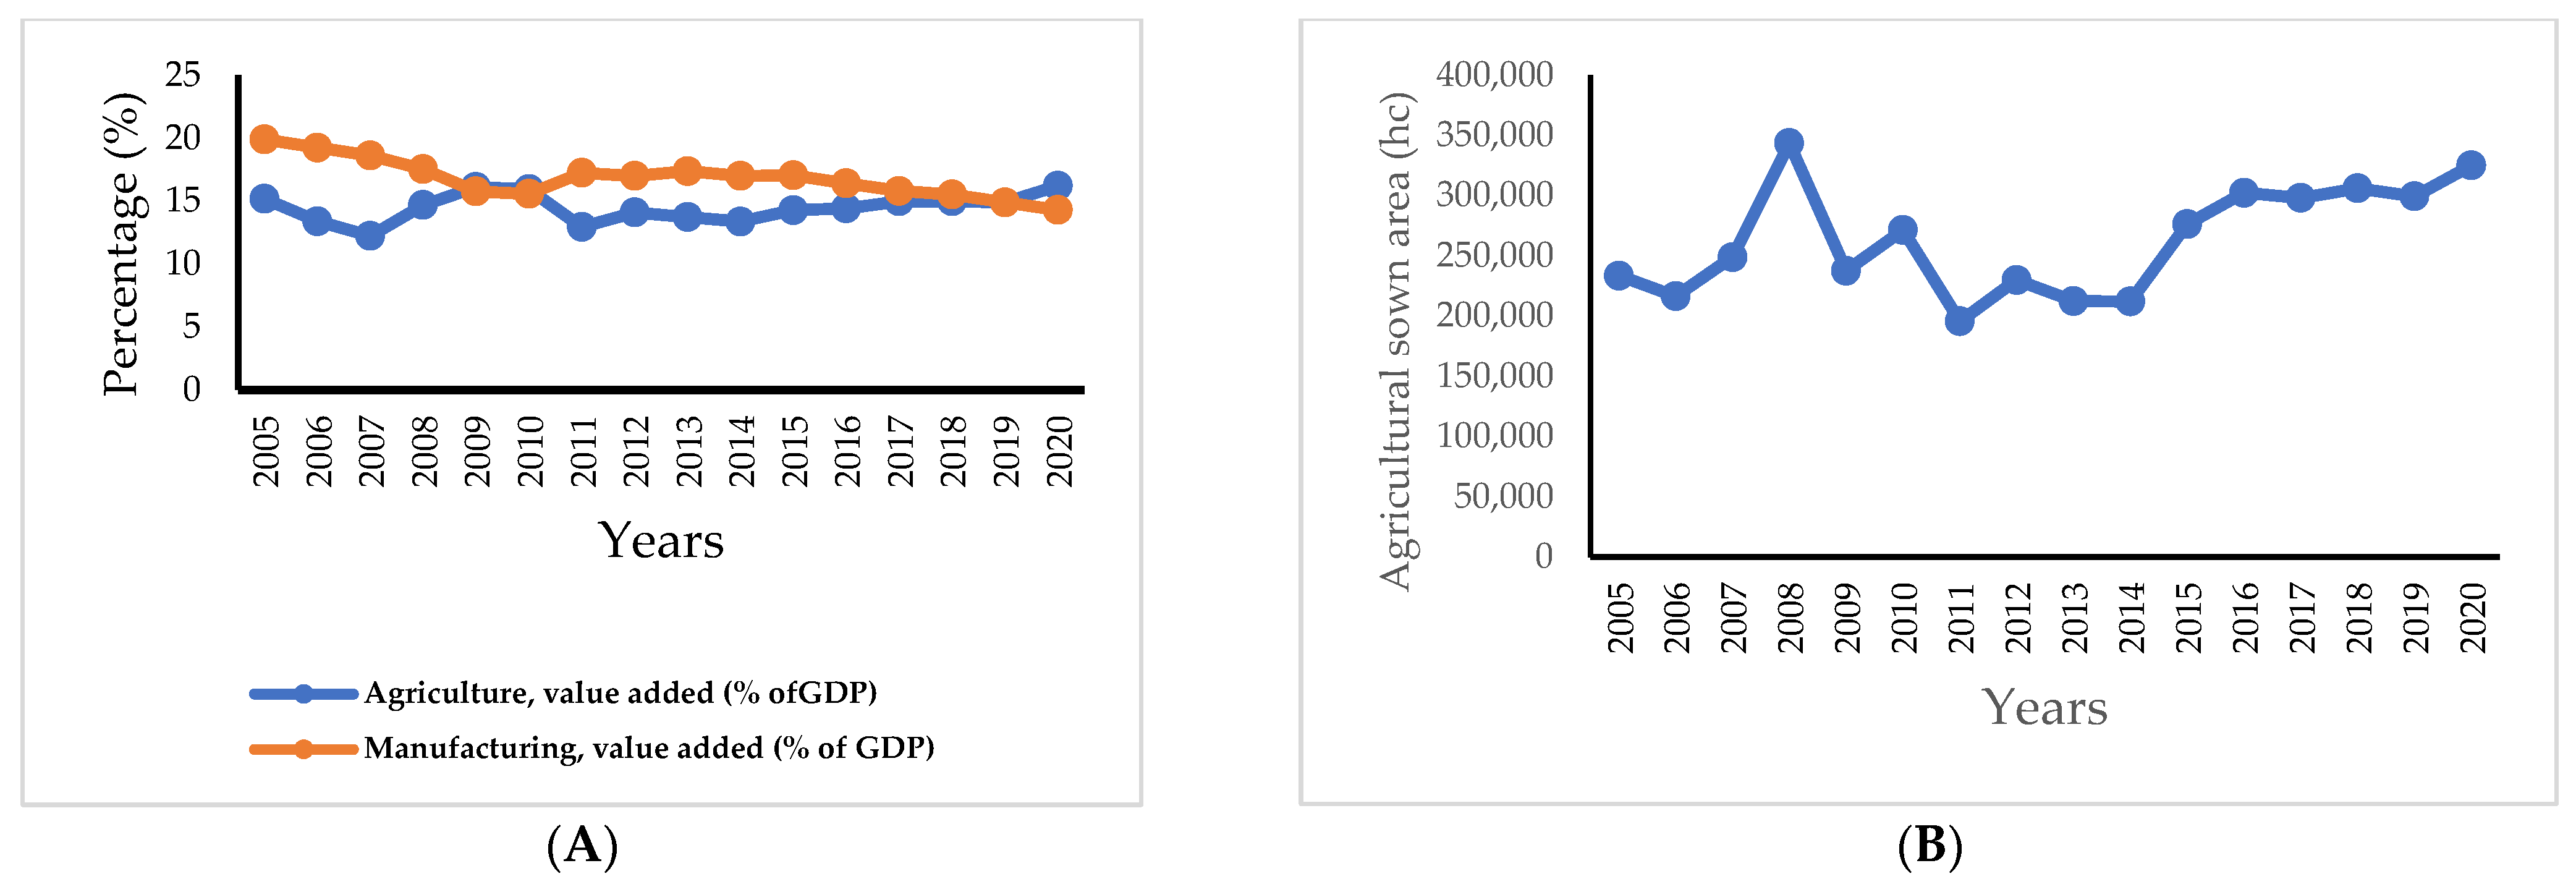
5.1. Socio-Economic Factors Influencing Forested Areas

Dakar, the capital of Senegal, is a rapidly expanding metropolitan city in sub-Saharan Africa [1]. Consequently, the rapid urban sprawl of Dakar has resulted in the expansion of the Thiès region, situated 70 km away from Dakar. Since 2007, the Thiès region has been known for hosting significant socio-economic development projects. Additionally, in the department of Tivaouane (northern Thiès region), notable land investments have been observed since 1960 with the establishment of the Chemical Industries of Senegal (ICS), which exploits phosphate resources on land traditionally used for habitation and agropastoral tradition. Since then, the number of mining companies operating in the Thiès region has increased exponentially. Presently, approximately nineteen companies (not an exhaustive list) are located in the northern and central parts of the Thiès region. The results of this study indicate that the difference in the transfer in and out of bare land regarding forested areas was about −138.39 km2 between 2005 and 2020. In essence, a considerable loss of forested areas can be attributed to the negative impacts of urbanization and mining activities. Rapid urban population growth without efficient land use management may lead to inadequate housing and negatively impact forested areas [57]. The Thiès region had approximately 1,788,864 inhabitants in 2013, with a projected increase to 2,464,554 inhabitants by 2025 (ANSD). In 2017, the Dakar region accounted for 39.5% of Senegal’s economic units, while the Thiès and Diourbel regions accounted for 11.5% and 9.9%, respectively [58]. Regarding the role of the Thiès region in Senegal’s economy, the decline in and degradation of forested areas can significantly impact both present and future ecosystem value.
Crop rotation is essential for implementing ecological civilization policies [3]. A previous study in the Thiès region, based on survey data from 2022, highlighted that approximately 42% of respondents had not changed their crops in the last five years [59]. Monoculture not only impacts agricultural land, but also makes forested areas more fragile. Therefore, implementing agricultural policy reform and redesigning biodiversity conservation practices must go hand in hand. In Senegal, extensive livestock breeding provides income to alleviate poverty and mitigate low agricultural production. In addition, by 2030, urban beef consumption is projected to grow by more than 361% in low-income countries, including Senegal. Feeding livestock remains one of the most critical challenges in Senegal. Henceforth, extensive human activity will continue to affect forested areas, particularly protected forests. Thus, the decrease in forested areas (−0.015%) noted in this study may be attributed to extensive breeding and intensified mining activities. In addition, according to ANSD data, about 28.41% of farmers’ plots were under conventional sustainable land management. This situation significantly reduces the Thiès region’s current terrestrial ecosystem services. Hence, previous studies have highlighted that the exploitation of forest resources plays a central role in Senegal’s economy, and the level of degradation of forested areas is becoming increasingly alarming [14]. These anthropogenetic factors coincide with natural factors such as considerable rainfall variability, impacting the ecosystem of “Niaye” and the forest of “Pout City” located at the center of the Thiès region. Globally, as depicted in Figure 8, the intensity of manufacturing, particularly mining and the expansion of cultivated areas, may negatively impact forested areas in the Thiès region.

5.2. Natural Factors Influencing Forested Areas

The agricultural land (−0.005%) and forested areas (−0.015%) in the Thiès region experienced a decline between 2005 and 2020. This declining trend can significantly impact the supply and demand of ecosystem services for societies. Then, the values of ecosystem services through agricultural production and maintaining suitable forested areas are closely intertwined. As a result, reducing forested areas may lead to degradation and soil quality deterioration, directly impacting agricultural production and household livelihoods. Soils in Senegal are susceptible to erosion, runoff, and the exacerbation of soil acidification and salinization [11]. Figure 9 illustrates the variability in rainfall across different periods. The trend curve (red line in Figure 9) indicates a decrease in rainfall during the period. This situation hampers the evolution of forested areas. Consequently, the consequences of rainfall decline are directly reflected in environmental degradation, with drought leading to the degradation of ecosystem services. Additionally, rainfall plays a dual role in forest issues, acting as a double-edged knife. Senegal is a rainfed agriculture country. So, a decrease in annual rainfall in one year might discourage farmers from increasing their agricultural sown area for the following year. Therefore, this decreased sown area can facilitate the temporary regeneration of the forest cover. This may explain why forested areas increased between 2010 and 2015 (Table 2) and the significant relationship between agricultural land and forested areas.
Since its independence, various development plans have shaped agricultural policies in Senegal [60]. However, none of these policies have adequately addressed issues such as erosion or soil salinization. In essence, the practical approach of land use policies fails to adequately consider the local socio-ecological and cultural realities of the population regarding the protection of forested areas. Moreover, dryness can have a negative impact on the cultivated land area. Yields are crucial for the rural population. However, agricultural production remains low due to the degradation of environmental quality and climatic conditions such as rainfall variability. In combination with the degradation of forested areas, low and declining soil fertility has long been recognized as a significant impediment to intensifying agriculture in the Thiès region. Effectively, factors such as rainfall and topography, which contribute to erosion, significantly affect forested areas in the Thiès region. Implementing sustainable forest management practices and enhancing ecosystem resilience can help to mitigate the harmful effects of rainfall variability on forested areas. In conclusion, addressing deforestation requires a multidimensional approach considering the interplay of human, economic, and environmental factors.

5.3. Policy Implications

Ecological protection and restoration efforts are crucial for reversing ecological degradation. Several significant influencing factors contribute to the vulnerability of forested areas in the Thiès region, reflecting human livelihood activities. For instance, in the Thiès region, between 2015 and 2020, there was a net transition of approximately 43.22 km2 for artificial surfaces. Therefore, establishing sustainable policies for the long-term protection of forested areas is imperative. Hence, based on the impact of agricultural land use extension in this study, there is an urgent need to implement a comprehensive approach to determine the limits or orientation of expanding agricultural land. In essence, implementing a thorough method to determine the expansion limits of agricultural land and enhance designated protected areas while considering the sensibility of forested areas is crucial.
Regarding the sensitivity of soil in the study area, it is important to encourage and support sustainable agricultural practices that minimize the use of harmful chemicals, promote ecological diversity, and prevent soil erosion. Furthermore, it is important to encourage private property owners to voluntarily establish conservation restrictions and legal agreements that limit certain types of development on their land to preserve its ecological value. Moreover, the expansion of breeding activities also appears to have a significant impact on the ecosystem. Therefore, it is necessary to implement regulations and guidelines for development projects to delimit breeding activities and prevent habitat destruction, deforestation, and other activities that can harm forested areas. Furthermore, our framework quantifies the transfer in and out, providing critical insights into understanding the relationship between forested areas and other land use types. Thus, this study provides valuable insight into the urgent need to implement a management policy enabling regulated land transfer from forested areas to bare land. In summary, effectively managing suitable forested areas in arid zones, such as those in the regions discussed, requires a robust network between socio-economic and natural factors.

5.4. Limitations and Future Research Perspectives

In Senegal’s Thiès region, a predominantly rural economy relies on rainfed production systems and the exploitation of ecosystem values, particularly forests, which are critical drivers for economic growth. Therefore, conducting suitable research on the status of forested areas is pivotal for continuously ensuring the livelihood of the population. However, the lack or scarcity of documents and statistics directly related to our study area limited our investigations, as documents and statistics were fundamental components for analyzing our objectives. Moreover, human activities in Senegal, such as the current breeding trends, are extensive and have not been clearly understood. This study also did not determine the trends and impacts of these issues on forested areas.
Additionally, education level, farmers’ environmental knowledge, available water capacity, infiltration capacity, and political factors such as land tenure [23,24,60] may be helpful for forested areas’ management. Fundamentally, farmers with a deep understanding of environmental processes and sustainable practices are more likely to engage in behaviors that protect and preserve forested areas. Secure land tenure can also empower communities and individuals to invest in long-term conservation practices. Moreover, areas with higher water capacity may support a wider variety of plant life and are generally more resilient to drought and other climate-related stresses. These factors should be considered in future research. Mixed linear regression models often require a large amount of high-quality data to be reliable. Alternatively, the amount of data used during the study period seems relatively low, which may have had a potential impact on the results. Furthermore, to our knowledge, there is a lack of coordination between remote sensing and GIS efforts in Senegal, which may have resulted in imperfections in the data quality. Due to issues like cloud cover, the data were collected between September and November, potentially impacting the accuracy of the results.
Therefore, integrating socio-economic and natural data into research, along with a questionnaire to collect information on farmer activities in rural areas, particularly regarding the supply, flow, and demand of ecosystem service values, may provide valuable information for preserving the suitability of forested areas. In the context of the Thiès region, formulating policies and processes to improve the value of ecosystem services requires careful consideration of the impact of socio-economic factors in space and time at the local level, particularly at the micro-scale. Additionally, from a geographical perspective, future research should focus on the local level, including the specific evolution of forested areas in the “Zone Niayes” (western coastal area), which represents crucial forested areas (Figure 4). Similarly, exploring the impact of mining activities in the central, northern, and southern parts of the Thiès region would be valuable, utilizing sophisticated data collection processes and ensuring the accuracy of remote sensing data.
In the Thiès region, an estimated 81% of farmers lack property rights, a situation that presents a significant challenge for appropriate land management. A combination of factors such as population growth, industrial development, intensive mining, and agricultural expansion places considerable stress on forest areas. Without timely intervention, the cumulative impact of environmental conditions and intense socio-economic development could lead to the ongoing degradation of these forests. Consequently, there is an urgent need for predictive research and appropriate land use policies in the Thiès region. Such measures are essential for understanding the dynamics between forest evolution and intensive development and to safeguard the future of these forested areas.

6. Conclusions

The ability to assess ecological change is a prerequisite to studying ecosystem function and evolution concerning agricultural land management. In this study, we compiled an innovative database of regional-level coverage for 31 communes observed over fifteen years. This current finding showed that forested areas led to relative fragmentation, with an average of 88 patches for AI, 3.25 for LPI, 2.50 for PD, and 112 for LSI between 2005 and 2020. In addition, the transfer matrix indicated that the loss of forestry areas was about −78.8 km2 for agricultural land, −127.8 km2 for bare land, and −65.3 km2 for artificial surfaces. Agricultural and manufactured added value, rainfall (p < 0.05), slope, distance to the road, and agricultural sown area (p < 0.001) were the most critical factors that influenced forested areas. Hence, it is important to acknowledge that the scarcity of documents and statistics directly pertaining to our study area constrained our investigations. Moreover, the remote sensing period holds promise for yielding significant results; however, factors such as cloud cover may have influenced our findings. Therefore, future research endeavors should aim to integrate socio-economic and natural data. The development of a comprehensive questionnaire tailored to gather information on farmer activities in rural areas, particularly in exploring the supply, flow, and demand of ecosystem service values, could offer valuable insights for preserving the suitability of forested areas. Effective and sustainable ecosystem services necessitate the concurrent management of agricultural, bare land, and forested areas.

Author Contributions

Conceptualization, B.F. and G.D.; methodology, B.F. and J.C.D.; software, B.F.; validation, B.F. and G.D.; formal analysis, B.F. and J.C.D.; investigation, B.F., H.V.M.T.F. and J.C.D.; resources, B.F. and G.D.; data curation, B.F.; writing—original draft preparation, B.F. and H.V.M.T.F.; writing—review and editing, B.F., Q.L., H.M.S., J.C.D., E.M. and G.D.; visualization, B.F. and G.D.; supervision, B.F. and G.D.; project administration, G.D. and B.F.; funding acquisition, G.D. All authors have read and agreed to the published version of the manuscript.

Funding

This current work was supported by the National Key R&D Program of China (grant No. 2021YFD1500101).

Institutional Review Board Statement

Not applicable.

Informed Consent Statement

Not applicable.

Data Availability Statement

The raw data supporting the conclusions of this article will be made available by the authors on request.

Conflicts of Interest

The authors declare no conflicts of interest.

References

  1. Pouye, A.; Faye, S.C.; Diédhiou, M.; Gaye, C.B.; Taylor, R.G. An evaluation of groundwater vulnerability assessment methods in a rapidly urbanizing city: Evidence from Dakar, Senegal. Environ. Earth Sci. 2022, 81, 410. [Google Scholar] [CrossRef]
  2. Li, Q.; Wang, L.; Du, G.; Faye, B.; Li, Y.; Li, J.; Liu, W.; Qu, S. Dynamic Variation of Ecosystem Services Value under Land Use/Cover Change in the Black Soil Region of Northeastern China. Int. J. Environ. Res. Public Health 2022, 19, 7533. [Google Scholar] [CrossRef]
  3. Liang, C.; Du, G.; Faye, B. The influence of cultivated land transfer and Internet use on crop rotation. Front. Sustain. Food Syst. 2023, 7, 1172405. [Google Scholar] [CrossRef]
  4. Richardson, R.B. Ecosystem Services and Food Security: Economic Perspectives on Environmental Sustainability. Sustainability 2010, 2, 3520–3548. [Google Scholar] [CrossRef]
  5. Faye, B.; Du, G.; Li, Q.; Sané, T.; Mbaye, E.; Zhang, R. Understanding the characteristics of agricultural land transition in Thiès region, Senegal: An integrated analysis combining remote sensing and survey data. Front. Environ. Sci. 2023, 11, 1124637. [Google Scholar] [CrossRef]
  6. Sy, S.; Noblet-Ducoudré, N.; Quesada, B.; Sy, I.; Dieye, A.; Gaye, A.; Sultan, B. Land-Surface Characteristics and Climate in West Africa: Models’ Biases and Impacts of Historical Anthropogenically-Induced Deforestation. Sustainability 2017, 9, 1917. [Google Scholar] [CrossRef]
  7. Haque, M.N.; Mahi, M.M.; Sharif, M.S.; Rudra, R.R.; Sharifi, A. Changes in the economic value of ecosystem services in rapidly growing urban areas: The case of Dhaka, Bangladesh. Environ. Sci. Pollut. Res. 2023, 30, 52321–52339. [Google Scholar] [CrossRef] [PubMed]
  8. Faye, B.; Du, G. Agricultural Land Transition in the “Groundnut Basin” of Senegal: 2009 to 2018. Land 2021, 10, 996. [Google Scholar] [CrossRef]
  9. Chen, Q.; Timmermans, J.; Wen, W.; van Bodegom, P.M. Ecosystems threatened by intensified drought with divergent vulnerability. Remote Sens. Environ. 2023, 289, 113512. [Google Scholar] [CrossRef]
  10. Tappan, G.; Sall, M.; Wood, E.; Cushing, M. Ecoregions and land cover trends in Senegal. J. Arid Environ. 2004, 59, 427–462. [Google Scholar] [CrossRef]
  11. Ndong The evolution of rainfall in Senegal and the consequences of the recent drought on the environment (French). Rev. Geogr. Lyon 1995, 70, 193–198. [CrossRef]
  12. Ayenikafo, O.M.; Wang, Y.F. Land use/land cover changes analysis in sudano guinean region of benin. Appl. Ecol. Environ. Res. 2021, 19, 715–726. [Google Scholar] [CrossRef]
  13. Ma, M.; Hietala, R.; Kuussaari, M.; Helenius, J. Impacts of edge density of field patches on plant species richness and community turnover among margin habitats in agricultural landscapes. Ecol. Indic. 2013, 31, 25–34. [Google Scholar] [CrossRef]
  14. Faye, B.; Du, G.; Mbaye, E.; Liang, C.; Sané, T.; Xue, R. Assessing the Spatial Agricultural Land Use Transition in Thiès Region, Senegal, and Its Potential Driving Factors. Land 2023, 12, 779. [Google Scholar] [CrossRef]
  15. Vincke, C.; Diédhiou, I.; Grouzis, M. Long term dynamics and structure of woody vegetation in the Ferlo (Senegal). J. Arid Environ. 2010, 74, 268–276. [Google Scholar] [CrossRef]
  16. Leroux, L.; Clermont-Dauphin, C.; Ndienor, M.; Jourdan, C.; Roupsard, O.; Seghieri, J. A spatialized assessment of ecosystem service relationships in a multifunctional agroforestry landscape of Senegal. Sci. Total Environ. 2022, 853, 158707. [Google Scholar] [CrossRef]
  17. Santarém, F.; Saarinen, J.; Brito, J.C. Assessment and prioritization of cultural ecosystem services in the Sahara-Sahelian region. Sci. Total Environ. 2021, 777, 146053. [Google Scholar] [CrossRef]
  18. Kaba, M.; Mesnage, V.; Sakho, I.; Faye, S.; Boussafir, M. Processes controlling the organic matter degradation in a tropical coastal wetland: Mboro, Senegal. Catena 2022, 217, 106419. [Google Scholar] [CrossRef]
  19. Taczanowska, K.; Latosińska, B.; Brandenburg, C.; Leisch, F.; Czachs, C.; Muhar, A. Lobbying in social media as a new source of survey bias. J. Outdoor Recreat. Tour. 2023, 44, 100689. [Google Scholar] [CrossRef]
  20. Yan, W.; Sakairi, T. Geo CPS: Spatial challenges and opportunities for CPS in the geographic dimension. J. Urban Manag. 2019, 8, 331–341. [Google Scholar] [CrossRef]
  21. Viana, C.M.; Girão, I.; Rocha, J. Long-Term Satellite Image Time-Series for Land Use/Land Cover Change Detection Using Refined Open Source Data in a Rural Region. Remote Sens. 2019, 11, 1104. [Google Scholar] [CrossRef]
  22. Ogawa-Onishi, Y.; Berry, P.M.; Tanaka, N. Assessing the potential impacts of climate change and their conservation implications in Japan: A case study of conifers. Biol. Conserv. 2010, 143, 1728–1736. [Google Scholar] [CrossRef]
  23. Klaus, M.; Holsten, A.; Hostert, P.; Kropp, J.P. Integrated methodology to assess windthrow impacts on forest stands under climate change. For. Ecol. Manag. 2011, 261, 1799–1810. [Google Scholar] [CrossRef]
  24. Feng, F.; Wang, L.; Hou, W.; Yang, R.; Zhang, S.; Zhao, W. Analyzing the dynamic changes and causes of greenspace landscape patterns in Beijing plains. Ecol. Indic. 2024, 158, 111556. [Google Scholar] [CrossRef]
  25. Ravindranath, N.H.; Rao, S.; Sharma, N.; Nair, M. Climate Change Vulnerability Profiles for North East India. 2011. Available online: https://www.researchgate.net/publication/243970955_Climate_change_vulnerability_profiles_for_North_East_India (accessed on 16 February 2024).
  26. Liang, L.; Chen, F.; Sh, L.; Niu, S. NDVI-derived forest area change and its driving factors in China. PLoS ONE 2018, 13, e0205885. [Google Scholar] [CrossRef]
  27. Hou, X.; Zhang, B.; Chen, J.; Zhou, J.; He, Q.-Q.; Yu, H. Response of Vegetation Productivity to Greening and Drought in the Loess Plateau Based on VIs and SIF. Forests 2024, 15, 339. [Google Scholar] [CrossRef]
  28. Wang, B.; Wang, Z.; Zhang, D.; Li, L.; Zhao, Y.; Luo, T.; Wang, X. Spatial and Temporal Variation in Primary Forest Growth in the Northern Daxing’an Mountains Based on Tree-Ring and NDVI Data. Forests 2024, 15, 317. [Google Scholar] [CrossRef]
  29. Li, M.; Li, X.; Liu, S.; Lyu, X.; Dang, D.; Dou, H.; Wang, K. Analysis of the Spatiotemporal Variation of Landscape Patterns and Their Driving Factors in Inner Mongolia from 2000 to 2015. Land 2022, 11, 1410. [Google Scholar] [CrossRef]
  30. Hooke, R.L.B.; Martín-Duque, J.F.; Pedraza, J. Land transformation by humans: A review. GSA Today 2012, 22, 4–10. [Google Scholar] [CrossRef]
  31. Bauer, T.; de Jong, W.; Ingram, V.; Arts, B.; Pacheco, P. Thriving in turbulent times: Livelihood resilience and vulnerability assessment of Bolivian Indigenous forest households. Land Use Policy 2022, 119, 106146. [Google Scholar] [CrossRef]
  32. Ullah, S.; Gang, T.; Rauf, T.; Sikandar, F.; Liu, J.Q.; Noor, R.S. Identifying the socio-economic factors of deforestation and degradation: A case study in Gilgit Baltistan, Pakistan. GeoJournal 2022, 87, 1657–1670. [Google Scholar] [CrossRef]
  33. Levers, C.; Romero-Muñoz, A.; Baumann, M.; De Marzo, T.; Fernández, P.D.; Gasparri, N.I.; Gavier-Pizarro, G.I.; Le Polain de Waroux, Y.; Piquer-Rodríguez, M.; Semper-Pascual, A.; et al. Agricultural expansion and the ecological marginalization of forest-dependent people. Proc. Natl. Acad. Sci. USA 2021, 118, e2100436118. [Google Scholar] [CrossRef]
  34. Ullah, S.; Wu, Y.; Khan, A.I. Evaluating the Socioeconomic Factors on Deforestation in Northern Pakistan: A Study on Existing Economic Incentive Tools for Reducing Deforestation. Sustainability 2023, 15, 5894. [Google Scholar] [CrossRef]
  35. Siqueira-Gay, J.; Sonter, L.J.; Sánchez, L.E. Exploring potential impacts of mining on forest loss and fragmentation within a biodiverse region of Brazil’s northeastern Amazon. Resour. Policy 2020, 67, 101662. [Google Scholar] [CrossRef]
  36. Seck, H.M.; Dieye, E.H.B.; Solly, B.; Sane, T. Mining and socio-economic consequences in river local authorities : Example of theChemical Industries of Senegal (ICS). Afr. Sci. 2021, 19, 93–105. Available online: https://www.researchgate.net/publication/358351421_Extraction_miniere_et_consequences_socio-economiques_dans_les_collectivites_locales_riveraines_exemple_des_industries_chimiques_du_Senegal_ICS (accessed on 15 January 2023).
  37. Caliskan, E. Environmental impacts of forest road construction on mountainous terrain. Iran. J. Environ. Health Sci. Eng. 2013, 10, 23. [Google Scholar] [CrossRef]
  38. Parracciani, C.; Buitenwerf, R.; Svenning, J.C. Impacts of Climate Change on Vegetation in Kenya: Future Projections and Implications for Protected Areas. Land 2023, 12, 2052. [Google Scholar] [CrossRef]
  39. Du, G.; Guo, T.; Ma, C. Effects of Topographic Factors on Cultivated-Land Ridge Orientation in the Black Soil Region of Songnen Plain. Land 2022, 11, 1489. [Google Scholar] [CrossRef]
  40. Smith, C.; Baker, J.C.A.; Spracklen, D.V. Tropical deforestation causes large reductions in observed precipitation. Nature 2023, 615, 270–275. [Google Scholar] [CrossRef]
  41. Kouassi, J.-L.; Gyau, A.; Diby, L.; Bene, Y.; Kouamé, C. Assessing Land Use and Land Cover Change and Farmers’ Perceptions of Deforestation and Land Degradation in South-West Côte d’Ivoire, West Africa. Land 2021, 10, 429. [Google Scholar] [CrossRef]
  42. Altoom, M.B.; Adam, E.; Ali, K.A. Mapping and Monitoring Spatio-Temporal Patterns of Rainfed Agriculture Lands of North Darfur State, Sudan, Using Earth Observation Data. Land 2023, 12, 307. [Google Scholar] [CrossRef]
  43. Moradi, E.; Darabi, H.; Heydari Alamdarloo, E.; Karimi, M.; Kløve, B. Vegetation vulnerability to hydrometeorological stresses in water-scarce areas using machine learning and remote sensing techniques. Ecol. Inform. 2023, 73, 101838. [Google Scholar] [CrossRef]
  44. Ecological Monitoring Centre Annuaire sur L’environnement et les Ressources Naturelles au Seneal. Quatrieme Edition. Senegal. pp. 12–19. Available online: https://www.cse.sn/index.php (accessed on 28 August 2021).
  45. Sagna, P.; Ndiaye, O.; Diop, C.; Niang, A.; Sambou, P. Does the climate variability recently observed in Senegal correspond to that described in the scenarios of the Intergovernmental Panel on Climate Change (IPCC)? (French). Pollut. Atmos. 2015, 227, 17. [Google Scholar] [CrossRef]
  46. Teferi, E.; Bewket, W.; Uhlenbrook, S.; Wenninger, J. Understanding recent land use and land cover dynamics in the source region of the Upper Blue Nile, Ethiopia: Spatially explicit statistical modeling of systematic transitions. Agric. Ecosyst. Environ. 2013, 165, 98–117. [Google Scholar] [CrossRef]
  47. Díaz-Pacheco, J.; van Delden, H.; Hewitt, R. The Importance of Scale in Land Use Models: Experiments in Data Conversion, Data Resampling, Resolution and Neighborhood Extent; Springer: Cham, Switzerland, 2018; pp. 163–186. [Google Scholar]
  48. Anderson, J.R.; Hardy, E.E.; Roach, J.T.; Witmer, R.E. A Land Use and Land Cover Classification System for Use with Remote Sensor Data; United States Government Printing Office: Washington, DC, USA, 1976. [Google Scholar]
  49. Kumar, S.; Radhakrishnan, N.; Mathew, S. Land use change modelling using a Markov model and remote sensing. Geomatics, Nat. Hazards Risk 2014, 5, 145–156. [Google Scholar] [CrossRef]
  50. Kubacka, M.; Żywica, P.; Vila Subirós, J.; Bródka, S.; Macias, A. How do the surrounding areas of national parks work in the context of landscape fragmentation? A case study of 159 protected areas selected in 11 EU countries. Land Use Policy 2022, 113, 105910. [Google Scholar] [CrossRef]
  51. Li, Q.; Dong, Z.; Du, G.; Yang, A. Spatial Differentiation of Cultivated Land Use Intensification in Village Settings: A Survey of Typical Chinese Villages. Land 2021, 10, 249. [Google Scholar] [CrossRef]
  52. Lyu, L.; Gao, Z.; Long, H.; Wang, X.; Fan, Y. Farmland Use Transition in a Typical Farming Area: The Case of Sihong County in the Huang-Huai-Hai Plain of China. Land 2021, 10, 347. [Google Scholar] [CrossRef]
  53. He, H.S.; DeZonia, B.E.; Mladenoff, D.J. An aggregation index (AI) to quantify spatial patterns of landscapes. Landsc. Ecol. 2000, 15, 591–601. [Google Scholar] [CrossRef]
  54. Chen, F.; Chen, J.; Wu, H.; Hou, D.Y.; Zhang, W.W.; Zhang, J.; Zhou, X.G.; Chen, L.J. A landscape shape index-based sampling approach for land cover accuracy assessment. Sci. China Earth Sci. 2016, 59, 2263–2274. [Google Scholar] [CrossRef]
  55. World Meteorological Organization. Climate and Land Degradation; World Meteorological Organization: Geneva, Switzerland, 2005; ISBN 9263109893. [Google Scholar]
  56. Moore, A.W.; Anderson, B.; Das, K.; Wong, W.K. Combining Multiple Signals for Biosurveillance. In Handbook of Biosurveillance; Elsevier Inc.: Philadelphia, PA, USA, 2006; pp. 235–242. ISBN 9780123693785. [Google Scholar]
  57. Faye, B.; Du, G.; Zhang, R. Efficiency Analysis of Land Use and the Degree of Coupling Link between Population Growth and Global Built-Up Area in the Subregion of West Africa. Land 2022, 11, 847. [Google Scholar] [CrossRef]
  58. Ministry of Economy Finance and Planning. The Global Report of the General Census of Enterprises. 2017. Available online: www.ansd.sn (accessed on 30 March 2022).
  59. Marfurt, F.; Haller, T.; Bottazzi, P. Green Agendas and White Markets: The Coloniality of Agroecology in Senegal. Land 2023, 12, 1324. [Google Scholar] [CrossRef]
  60. Savari, M.; Khaleghi, B. Factors influencing the application of forest conservation behavior among rural communities in Iran. Environ. Sustain. Indic. 2024, 21, 100325. [Google Scholar] [CrossRef]
Figure 1. The interconnection between natural and socio-economic factors.
Applsci 14 02427 g001
Figure 2. The localization of the study area: (a) regional location of the area; (b) Senegal, and (c) African continental; (d,e) land use features of the study area.
Applsci 14 02427 g002
Figure 3. The potential natural driving factors selected in the present study.
Applsci 14 02427 g003
Figure 4. Forested areas’ status in the Thiès Region during 2005, 2010, 2015, and 2020.
Applsci 14 02427 g004
Figure 5. (ac) Indicate the exchange between other land use types and forested areas in 2005–2010, 2010–2015, and 2015–2020, respectively; (d) shows the study period (2005–2020).
Applsci 14 02427 g005
Figure 6. The transition patch: (A) represents the transfer in, from other land use types to forested areas, and (B) the transfer out from forested areas to other land use types; (C) represents the difference between transfer in and out of forested areas in different periods (2005–2020). AL = agricultural land; FA = forested areas; GL = grassland; WL = wetland; AS = artificial surfaces; and BL = bare land. P1, P2, P3, and over the period represent 2005–2010, 2010–2015, 2015–2020, and 2005–2020 respectively.
Applsci 14 02427 g006
Figure 7. Characteristics of forested areas’ dominant morphology evolution in 2005, 2010, 2015, and 2020, with PD = Patch density; LPI = Largest Patch Index; AI = Aggregation Index; and LSI = Landscape Shape Index.
Applsci 14 02427 g007
Figure 8. (A) Agricultural and manufacturing, value added (%), (B) agricultural sown area evolution 2005–2020.
Applsci 14 02427 g008
Figure 9. The evolution of rainfall in the Thiès region from 2005 to 2020.
Applsci 14 02427 g009
Table 1. Procedure for identifying land use types.
NLevel ILevel IICode
1Agricultural landPermanent crops, permanent pasture, agro-business landAL
2Forested areasClassified forests, casuarina, nature reserves, mangroves, open forestsFA
3GrasslandSparse grass, moderate and dense grasslandGL
4WetlandLakes; permanent water and no permanent water, bottom land, reservoirs, and pondWL
5Artificial surfacesUrban and built-up areas, rural settlements, photovoltaic power generation land, transportation facilitiesAS
6Bare landSandy land, ancient mining and quarrying areas, soil salinity, bare land, other lands that are not used until the mapping timeBL
Table 2. The statistics of the forested areas during 2005, 2010, 2015, and 2020.
Years/Values
2005201020152020
Km2%Km2%Km2%Km2%
Forested Areas944.6614.16678.9410.181143.2517.14735.0511.02
Table 3. Quantitative analysis of land type shifts at the interval level (km2).
PeriodLand Use TypesTransfer in (Gain)Transfer out (Loss)Net Transition
2005–2010Agricultural land940.991214.2−273.29
Artificial surfaces75.6961.4214.26
Forested areas403.00668.72−265.72
Grassland1214.01460.07753.94
Bare land521.30628.68−107.38
Wetland13.36135.17−121.81
2010–2015Agricultural land1017.631127.68−110.05
Artificial surfaces93.8142.5651.24
Forested areas854.16389.85464.30
Grassland355.371263.04−907.68
Bare land897.68432.03465.65
Wetland53.9317.3736.55
2015–2020Agricultural land1269.561149.99119.56
Artificial surfaces112.1468.9243.22
Forested areas293.99702.12−408.13
Grassland845.14442.01403.12
Bare land677.50792.98−115.49
Wetland25.2467.53−42.29
Table 4. Changes in the overall landscape pattern index in the Thiès region from 2005 to 2020.
YearsPatch Density (PD N/ha)Largest Patch Index (LPI %)Aggregation Index (AI %)Landscape Shape Index (LSI Index)
20052.003.0089.00111.00
20104.001.0083.00147.00
20153.006.0089.00116.00
20201.003.0091.0073.00
Table 5. Regression analysis results for forested areas’ morphology and driving factors.
The Forested Area’s Dominant Morphology
Potential Driving FactorsPatch Density (PD.)Largest Patch Index (LPI)Aggregation Index (AI.)Landscape Shape Index (LSI)
Intercept0.5926280.197340.1927650.175783
Population density (X1)0.3433060.6679030.7796020.593753
Agricultural add value (X2)0.2298830.7195110.4653020.041496 **
Manufactural add value (X3)0.1883350.032147 **0.016104 **0.010387 **
Rainfall (X4)0.1395070.018172 **0.2219160.032033 **
Temperature (X5)0.9556650.2390730.3595190.342206
Elevation (X6)0.06503 *0.5846450.5041270.809186
Slope (X7)0.9590890.032493 **0.000837 ***0.00358 ***
Distance to road (X8)0.7205320.8429690.9741410.007938 ***
Vegetation Index (X9)0.6234250.2118930.4734350.120847
Agricultural land evolution (X10)0.44310.8231740.05894 **0.401954
* p < 0.1, ** p < 0.05, *** p < 0.01.
Disclaimer/Publisher’s Note: The statements, opinions and data contained in all publications are solely those of the individual author(s) and contributor(s) and not of MDPI and/or the editor(s). MDPI and/or the editor(s) disclaim responsibility for any injury to people or property resulting from any ideas, methods, instructions or products referred to in the content.

