Abstract
This paper aims to verify the effectiveness of a process of superficial protection based on nanotechnologies produced by 4Ward360 and specifically developed for aeronautical applications on composite material aircraft. The Dardo aircraft, a composite VLA category manufactured by CFM Air, was taken as a reference case and two application/investigation areas were identified. The potential anticorrosive behavior of the nanotechnology treatment was investigated when applied to the metal joints of the aircraft, such as the wing–fuselage attachments usually made of Al-2024-T3 aluminum alloy. Furthermore, the potential increased effectiveness in cleaning was investigated as another possible application concerning the parts made of composite material both solid and in a sandwich configuration and the plexiglass parts of the canopy.
1. Introduction
The first studies on nanotechnologies date back to 1959 [1] and today, these technologies are widespread in all sectors. The strong growth in interest and diffusion of these technologies can be well represented by the analysis of the number of scientific articles on the subject in the three major world scientific journals (Nature, Science, PNAS) from 1991 to 2016 [2], or from the analysis of the growth of the “impact factor” of the scientific journal “Nanotechnology”, which, from 2000 to 2020, rose from a value of 1.6 to 3.6 [3]. This strong research footprint has poured into the industrial field with force, exceeding 9000 patents in 2008 [3]. Nanotechnologies have been applied to the transportation sector in order to increase the performance of components on land, air, and sea vehicles. Some examples in the automotive field [4] are the use of nanotechnologies in automotive paints in order to guarantee greater resistance and corrosion prevention; the use of nanotechnologies in order to improve the resistance of surfaces to UV rays; the application of carbon nanotubes as substitutes for metal parts in order to reduce vehicle weight; applications of nanotechnological coatings in the cylinders of internal combustion engine (ICE) in order to reduce friction with relative gains in terms of fuel consumption and a reduction in pollution. In the aeronautical sector [4,5], at the moment, the number of applications of nanotechnologies is still very low and limited to the coatings sector. As regards the development of new “light” materials and/or materials made with innovative technologies, the most promising candidates are polymeric nanocomposites reinforced with carbon nanotubes and boron nitride and epoxy resins reinforced with nanoclays.
These materials offer a high ratio between toughness and weight, impact resistance and radiation protection, and the prospect is to develop multifunctional composites. Accordingly, integrated nanosensors for structural health monitoring are also under investigation. Nanostructured metals, on the other hand, find applications in the parts most subject to corrosion and wear (landing gears, brakes, etc.). Finally, coatings (in the form of thin films), including nanopowders, can be used as self-cleaning or antiglare layers for windows.
In [6], different types of nanoparticles, nanofibers, and nanocoating that can be used for reinforcement, surface modification, and property enhancement in FRP composites are presented.
In the field of fatigue properties of aluminum alloy materials, in [7], it is shown that an Al–Cu alloy processed using in situ TiC nanoparticle additions coupled with a stir-casting method displays a combination of outstanding mechanical properties in comparison with cast aluminum alloys. A recent review paper [8] explores advancements in corrosion protection techniques for aerospace aluminum alloys, highlighting the transition from conventional methods such as chromate conversion coatings and anodizing to more sustainable and efficient alternatives. Recent developments encompass a spectrum of innovations, including rare-earth element-based coatings, organic–inorganic hybrids, advanced polymer solutions, and the integration of nanotechnology. The literature concerning the use of nanotechnologies to enhance the performance of aerospace materials is certainly lacking in experimental evidence and procedures that quantitatively define their real effectiveness. The present article delves into two specific aspects. Firstly, it examines corrosion phenomena in metals. Nanotech formulations are applied to aluminum alloy specimens via spraying, followed by a post-corrosion fatigue test to assess the treatment’s efficacy in reducing corrosion and enhancing fatigue life. The integration of nanotechnology is also compared with classical primer treatments. Secondly, an innovative comparative test to evaluate the “ease of cleaning” between untreated dirty surfaces and those treated with nanotechnological formulations is developed. This approach aims to gather data from samples, initially validate results through ground tests on full-scale aircraft, and subsequently evaluate the impact of nanotechnology surface treatments in real operational scenarios. The subsequent sections detail the test procedures, results, and evaluations of the treatment effectiveness in both application domains.
2. The Dardo Aircraft
The Dardo aircraft (Figure 1) is a light aircraft designed to operate from short fields as are typically found in logistically austere environments. It is able to operate up to a service ceiling of 12,000 ft, and never exceeds a speed of 170 KCAS. It must also carry a max fuel content of 80 Kg that allows for an endurance of 4 h. The nominal range is in the order of 350 NM.
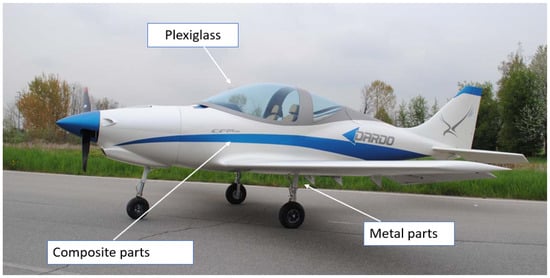
Figure 1.
Dardo aircraft.
3. Corrosion and Fatigue Test
The aircraft is capable, according to the CS-VLA rules, of conducting normal-operation takeoffs in no more than a 500 m (1500 ft) ground run and normal-operation landings in no more than a 400 m (1200 ft) ground run under the following conditions: (1) field elevation, 0 m (SL); (2) temperature, ISA; (3) airfield surface, dry MOB; (4) take-off weight 750 kg. Furthermore, the aircraft is capable of achieving at least a maneuvering minimum load factor requirement of +3.8 g, −2.0 g at a basic flying design mass (BFDM) of 750 Kg, and sustain a 10 kts crosswind when taxiing.
The complete primary structure is made of carbon fiber. Where useful for weight-reduction purpose and in order to optimize load path, a large use of unidirectional carbon fiber has been introduced. The engine cowlings are made of two parts with carbon fiber. The wing and the fuselage are made as a single item. The complete fuselage, vertical fin included, is made of two half-shell joined together by a longitudinal splice along the upper/lower center line. The wing is made by joining together the main spar, the secondary spar, and the ribs to the wing’s upper and lower skins. The wing is attached to the fuselage by four fittings at the main spar and four fittings at the secondary spar. Each fitting is connected to the fuselage by two bolts. The main landing gear structure and its retraction system are fitted to the main spar. Hinges of flaps and ailerons are connected to the secondary spar. The fuel tanks are installed into the wing. A “Karman” fairing is accommodating the fuselage and wing profiles. The horizontal empennage is connected to the fuselage by locators, placed at the leading edge. All the movable surfaces are connected to the main structure by aluminum alloy fittings and steel bolts.
The phenomenon of corrosion, which occurs in metals, is influenced by numerous and different factors that are related mainly to the operating environment of the component [9,10]. The following test based on ASTM G31-21 [11] has for objective to investigate the possibility of reducing the corrosion phenomena that could occur in metal parts such as the wing–fuselage attachments, through the use of a new surface coating produced by the 4Ward360 company, made with nanotechnologies, and comparing it to the currently used primer treatment. The process used for the treatment of the specimens was spray coating, a widely recognized industrial method which involves the application of suspensions of diverse nanoparticles to cover a range of materials with varying shapes [12]. Nanoparticles contained within atomized droplets are applied onto surfaces, resulting in a nanostructured coating once the liquid solvent evaporates. Spray coating offers several advantages over alternative methods, such as minimal liquid wastage, precise control over the film thickness and surface roughness, and the ability to use a wide array of fluids with different viscosities. Its simplicity makes spray coating easily adaptable to large computer-controlled production systems [13]. The most appropriate geometric solution recommended by the standard is the rectangular one; therefore, for the test in question, this type of specimen was modified in shape to create the classic “dog bone”, so as to be able to cope, after the test of corrosion, with the fatigue test [14].
The dimensions of each specimen can be deduced from Figure 2 and Table 1. The standard specimens were modified by introducing two holes, a central one of 2 mm necessary to increase the stress intensity factor and therefore limit the duration of the next fatigue test. A second hole of 5 mm was present at one end to allow immersion in the corrosion tank.
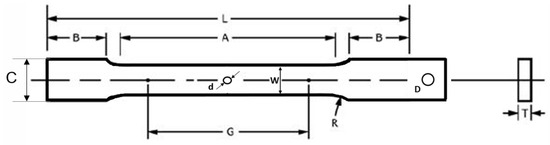
Figure 2.
Specimen’s geometry definition.

Table 1.
Modified standard specimen.
Table 2 lists all the specimens subjected to this test with an indication of the specimens subjected to the corrosion process and the specimens which were instead only subjected to the fatigue test. MF000 is the reference for the untreated and uncorroded test specimen. Only in the case of load type 1 was a fatigue test conducted on MF000, which showed comparable values to those of [15] for the same 2024-T3 aluminum alloy and kt = 2.36 (MF 000-MIL). For load types 2 and 3, the values from [15] were included as a single reference and indicated as MF000-MIL. MCF 001/002/003 corresponds to the first specimen of the family made of raw aluminum without any surface coating, which was subjected to the corrosion phase and to the subsequent fatigue test. MCS 010/011/012 corresponds to the sample of the aluminum family with nanotechnological treatment, which was not subjected to the corrosion test but only to the fatigue test with the purpose of comparing with its counterpart, MCF 007/008/009, which was instead subjected to the corrosive process.
Table 2.
List of specimens under corrosion and fatigue tests.
The test was conducted in three phases:
3.1. Prolonged Immersion Corrosive Test
This type of test involves a continuous and prolonged (20 days) immersion test in a solution of sodium chloride in deionized water with a concentration of 35 g/L with a variation of 1 g/L.
According to the standard, it is necessary that each test sample has at least one duplicate within the same immersion bath; for this reason, it was decided to create three specimens for each type of sample to be tested: three raw aluminum specimens (2024 T3), three aluminum specimens with primer without nanotechnology coating, and three specimens without primer with nanotechnology coating. During the entire immersion period, once a day, the temperature of the environment (mean value: 15 °C) and that of the solution (mean value: 17 °C) were measured in each tank together with the air humidity (around 70%). Two measurements of the pH of the solutions of the three tanks were also performed, one in the middle of the test after about 10 days of immersion and one at the end to verify the constancy of the value.
In the three tanks, it was possible to observe some important characteristics: all three tanks showed an accumulation of sodium chloride at the bottom in correspondence to each sample, as if each one had attracted the salt to itself, which had no way of adhering completely to the metal surface, precipitating into the solution. It should be noted that the solute accumulations were more consistent in the untreated raw aluminum specimens and in the nanotechnology-treated ones, while on those treated with the primer, there were no traces of salt evidence, but they could already show bubbles of the surface treatment.
In image (A) of Figure 3, it is possible to observe the aluminum specimens marked with the identification code, before immersion in the bath and in (B) immediately after the phase of extraction from the corrosive bath. A loss of luster was noted for the raw aluminum specimens, a darker coloring and the presence of numerous encrustations of salt as well as a lower smoothness to the touch. A loss of luster was noted for the Al-primer together with surface bubble formation as previously mentioned. Finally, for the specimens treated with nanotechnologies, a loss of luster of the metal and a darker coloration were noted but with less formation of salt encrustations. Also in that case, a reduction in smoothness was found.
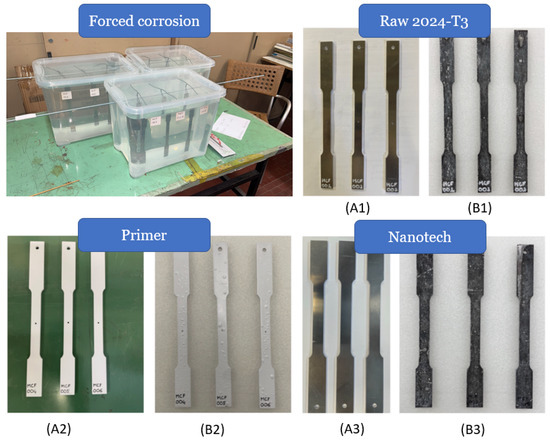
Figure 3.
Specimens: (A1–A3) before corrosion; (B1–B3) after corrosion. “Raw 2024-T3”: aluminum without corrosion protection; “Primer”: aluminum treated with a standard primer; “Nanotech”: aluminum treated with nanotechnology.
3.2. Fatigue Test
The INSTROM 8801 machine (Figure 4), available at Politecnico di Torino-DIMEAS structural laboratories, was used to carry out the fatigue tests. In addition to the 9 specimens subjected to corrosive treatment, the other 4 specimens were added, bringing the total of those mechanically tested to 13 in order to have a direct comparison between the same types of surface coatings with the only discriminating factor being the corrosive process undergone. All the samples reported in Table 2 were subjected to the fatigue test, highlighting those that underwent the corrosive process. Table 2 also shows the three selected load levels, the maximum and minimum force of the applied cycle, and the frequency of load application. The need to conduct fatigue tests, operating with three different load levels, arises from the need, albeit with the limitation of the reduced number of specimens, to approach the definition of the S-N curves [10,16].
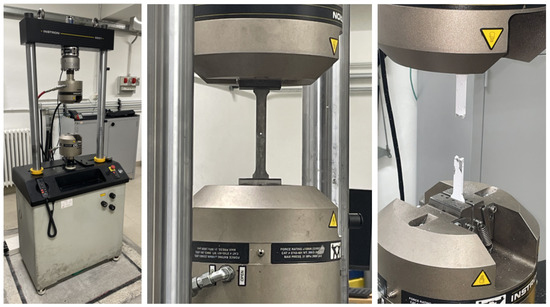
Figure 4.
Specimen installed in the fatigue test machine.
Figure 5 presents the number of cycles to failure of the specimens subjected to load type 1 corresponding to kN, kN, and a frequency of Hz. The specimens subjected to corrosion are also indicated. For this load, we note a significant reduction in fatigue life for the untreated MCF001 specimen and also for the Al-Primer specimen (MCF04) compared to the uncorroded case MF000, demonstrating the evident reduction in fatigue life due to the corrosion effect. The specimen treated with nanotechnologies (MCF007) in this case had a very similar behavior to that of the specimen of the same category not subjected to the corrosion process (MCS10), demonstrating an increased protective property against corrosion with an increase in fatigue life of +48% compared to raw Al, of +44% with respect to Al-Primer, and a small reduction of −1.44% when considering the uncorroded Nanotech specimen.
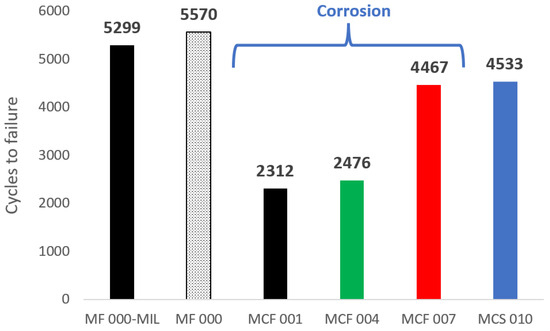
Figure 5.
Load type 1: , kN , and kN Hz.
The results relating to the intermediate load level indicated with type 2 and corresponding to KN, N, and a frequency of Hz are shown in Figure 6. Also in this case, an excellent behavior of the specimens treated with nanotechnologies and subjected to the corrosion process can be noted. In particular, the MCF008 specimen had an increase in life of +48% compared to raw aluminum (MCF002), +35% compared to the specimen treated with primer (MCF05), and a reduction of −29% compared to the specimen treated with nanotechnology but not corroded (MCS11). Finally, considering the lowest load level indicated in Figure 7 with type 3 and corresponding to a cycle defined by KN, N, and a frequency of Hz, we still noticed a better behavior of the specimen treated with nanotechnologies albeit reduced compared to the previous case. In this case the MCF009 specimen had an increased fatigue life compared to raw aluminum (MCF003) of +39%, while compared to the primer (MCF006), the life increase was 33%, and the reduction compared to the uncorroded case (MCS012) increased to −66%.
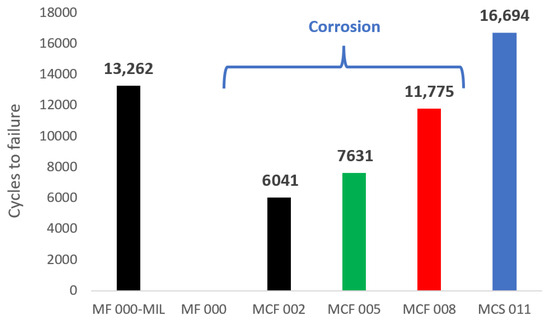
Figure 6.
Load type 2: kN, kN, and Hz.
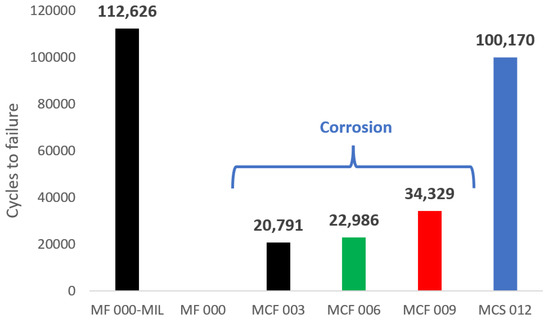
Figure 7.
Load type 3: kN, kN, Hz.
In order to get closer to the definition of the S-N curves and associate the effect of corrosion as well as the protective effect of the primer and the innovative nanotechnological treatment to a variation in the stress concentration factor , a modified Basquin equation was introduced [10,16]:
where are specific constants which in the particular case of Al2023-T3 assume the values: [16,17].
From Equation (1) and for all three load types, it is possible to obtain the global value obtained during the test as:
is determined by the effect of the sample shape (the presence of a hole introduces a (around 2.44 in our specific case)), the presence of corrosion through , and a possible stress release through :
Corrosion protection through primers or through innovative nanotechnological treatment is responsible for , which reduces the total .
Table 3 shows the results obtained.
Table 3.
Experimental stress concentration and release factors.
From the table, it can be seen that the average kt-shape obtained through the uncorroded samples MC010, MC011, MC012, and MF000 was approximately 2.36, in line with the kt-shape value obtained through the finite element method for which a kt-shape equal to 2.44 was obtained. The average kt value of the raw corroded specimens corresponding to the MCF001, MCF002, MCF003 specimens was 3.2, which led to the determination of the average value of the kt-corr, which was approximately 1.36. Comparable values were obtained in [18]. Then, considering the specimens treated with a primer, it was possible to estimate the kt-release relative to that treatment, which turned out to be 1.04, indicative of the fact that the primer could reduce the corrosive effect by only about 4%. Some signs of the loss of protective efficacy of the primer had already been seen during the corrosive bath phase when the formation of bubbles under the protective layer was noted.
As regards the specimens treated with MCF007, MCF008, and MCF009 nanotechnologies, the average value of kt was 2.58, which allowed us to calculate an average value of kt-release of about 1.19, with a maximum of 1.23 for higher loads where corrosion was less aggressive, and 1.14 at the lowest load.
Figure 8 shows the S-N curves considered for the different cases discussed. In blue are the specimens not subject to corrosion, in black are the corroded and unprotected specimens, in green are the specimens protected with primer, and finally, in red are the specimens protected with nanotechnologies and subjected to the corrosion test. In all specimens subjected to corrosive immersion, a greater effect of corrosion was observed at lower loads (load types 2 and 3), confirming not only an increase in the stress concentration factor (kt) but also a change in the slope, as indicated also in [9].
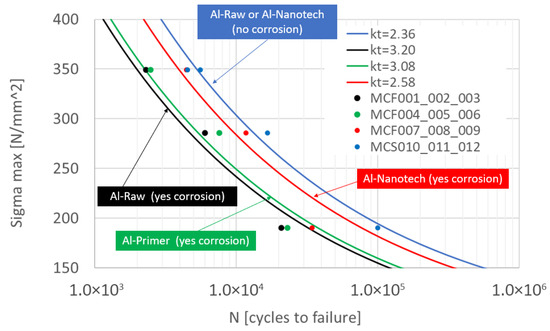
Figure 8.
S-N curve: blue: no corrosion; black: corroded specimens; green: primer protection; red: nanotechnology protection.
3.3. Fracture Area and SEM Analysis
Once the fatigue tests were completed, the failure areas were analyzed. An initial analysis was performed to identify the portion of the area attributable to fatigue failure and that attributable to static failure, which occurred once the residual section of the sample was no longer able to withstand the applied mechanical stress.
From Figure 9, where the results are divided by specimen category, it is possible to observe that, as could be expected, the extent of the fatigue failure section was more significant when the specimen under consideration was subjected to a lower stress: a lower mechanical load means a higher number of cycles, therefore a greater failure area due to fatigue. The graph also highlights what has already been observed previously: in each group of specimens, the best resistance to mechanical stress was always obtained with nanotechnology coating protection.
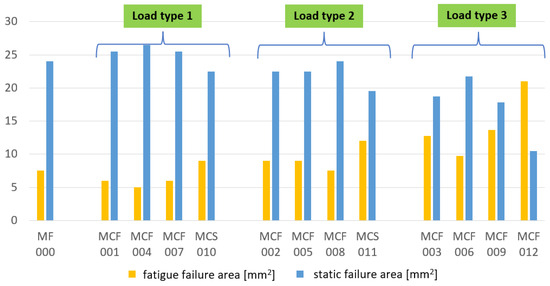
Figure 9.
Comparison of failure areas for each type of load.
From the electron microscope (SEM) analysis, as reported in Figure 10, production damage (scratches and streaks) could be seen on all specimens subjected to corrosion as well as signs of surface pitting [19]; however, they were more consistent in size and number in the case of raw aluminum and primer treatment, where a detachment from the metal surface was observed. Pitting corrosion also occurred in the case of aluminum treated with nanotechnologies, but with characteristics at first sight decidedly more limited than what occurred in the other two cases.
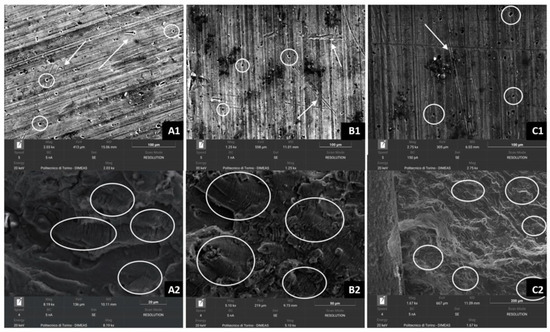
Figure 10.
SEM analysis: (A1,A2) MCF002; (B1,B2) MCF005; (C1,C2) MCF008.
Considering the limited number of specimens considered in this study and observing Figure 11, it can be cautiously stated that at the same magnification, the corroded specimen, MCF 008, had the same number of holes and imperfections as the uncorroded one, MCS 012, both treated with nanotechnology, and only increased in size. The raw aluminum samples showed notable differences: an increase in the number of imperfections in the corroded sample, MCF 002, compared to its uncorroded counterpart, MF 000. This aspect shows a general improvement in the ability to resist corrosion for the nanotechnology-treated specimens.
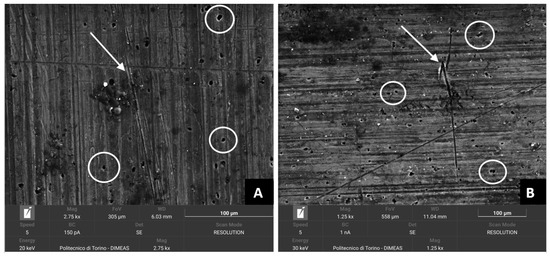
Figure 11.
Specimen surfaces MCF 008 (A) and specimen MCF 012 (B).
A significant presence of slip bands could also be noted in all specimens with a general direction of development of the phenomenon orthogonal to the application of the load [20,21].
The analysis conducted by an SEM microscope provided better evidence of how corrosion affected the surface finish of the metal: to observe the same type of damage related to the machining and fabrication of the metal specimens, the corroded raw aluminum specimen, MCF 002, was analyzed at a lower magnification, compared to the uncorroded raw aluminum specimen, MF 000, see Figure 12.
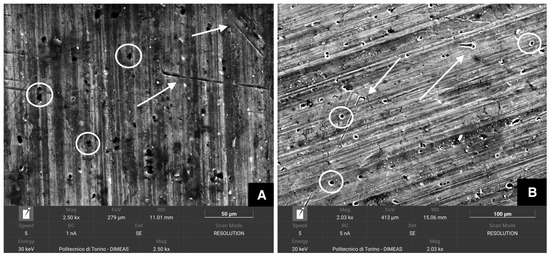
Figure 12.
Specimen surfaces MF 000 (A) and specimen MCF 002 (B).
The authors are further investigating the mechanism underlying the improvement in fatigue resistance in metallic materials when treated with silicate-based nanoparticles. At present, we can state that the initial cracks were noted to originate from pitting damage at numerous locations, as highlighted also in [20], where a detailed narrative of the entire damage evolution process in corrosion-nucleated fatigue was provided. A similar conclusion was derived in [21], where all the precorroded Al 2024-T4 specimens under investigation fractured from cracks associated with pitting. Results indicated that quantities such as pit surface area and surrounding pit proximity were as important as pit depth in determining when and where a crack would form. The same material as in the present work (Al2024-T3) was analyzed in [19], and similarly, a pit-to-crack transition was successfully observed using digital video techniques. Since a reduction in the number and size of corrosion pits was observed in specimens treated with nanotechnologies, this could correlate with the extension of fatigue life detected by experimental tests.
4. Cleanability Test
A second test was carried out in order to numerically compare the “ease of cleaning” of an untreated dirty surface, and one treated with nanotechnological formulations. The test, based on ASTM C756—Standard Test Method for Cleanability of Surface Finishes [22], consists in the application on the surface of the sample of an exact quantity of a fluorescent and water-soluble fouling agent. Subsequently, the surface is cleaned using a machine-repeatable cleaning procedure. The remaining dirt on the specimen after cleaning is extracted with an aqueous solvent. Finally, the fluorescence measurement of the solution extracted both from the tested specimen and from the specimen used as a standard is carried out. The above methodology permits one to obtain a standard parameter useful to evaluate the “ease of cleaning”. A cleanability index higher than one indicates that the tested surface is more difficult to clean than the standard surface, conversely an index lower than one indicates that the surface is easier to clean.
The test is characterized by four main phases:
4.1. Specimens Manufacturing
As anticipated, carbon fiber composite (CFC) is the most used material in the manufacture of the Dardo aircraft. To have a sample of material as representative as possible of that used for the aircraft, the composite specimens’ manufacturing followed the same procedures used by the CFM Air company to build the aircraft components. In particular, the manufacturing process of the CFC parts was obtained by a wet lay-up technique with GG-200-P (plain) woven carbon fiber and L287 epoxy resin. The specimens in 2024 T3 aluminum alloy underwent a much faster production process using a 3 mm plate for the realization. Finally, the plexiglass specimens were obtained from a sheet of material similar to that from which the canopy of the airplane was made.
Table 4.
List of specimens under cleaning tests.
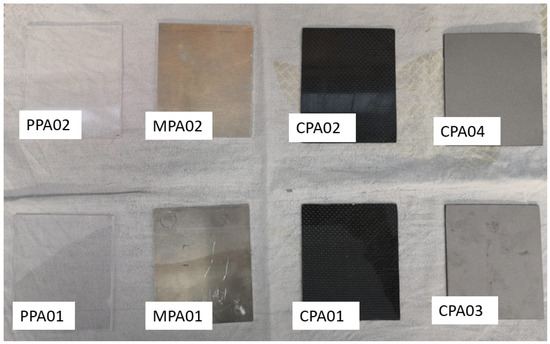
Figure 13.
Specimens under cleaning tests, see Table 4 for label definitions.
4.2. Preparation of the Fouling Solution
The fouling agent was a mixture consisting of 98% polyethylene glycol (PEG 400), 1% black dye, and 1% sodium fluorescein (Figure 14A). Sodium fluorescein was combined with polyethylene glycol inside a small container (Figure 14B) and the mixture was made homogeneous by means of an ultrasound sonicator alternating mixing periods with stop periods (Figure 14C). Last, the black dye was added. The mixture thus produced had to be stored in the sealed container for at least one night before use (Figure 14D).
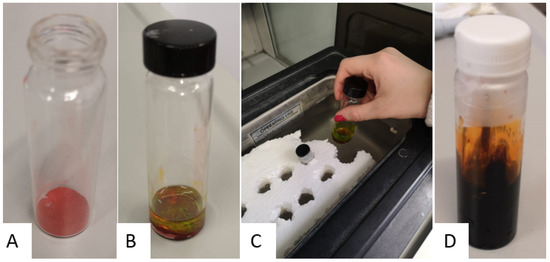
Figure 14.
Fouling solution preparation: (A) sodium fluorescein (B) mixture of 1% sodium fluorescein and 98% of PEG400 (C) ultrasound sonicator (D) final mixture with addition of 1% black dye.
4.3. Dirtying and Cleaning Procedure
The application of the fouling agent started by positioning the specimens to be treated on the work table and filling the tip of the 0.025 mL repeating pipette with the fouling solution. A series of drops were dropped until an 80 µL drop was deposited approximately in the center of each specimen.
The dirt head consisted of a 30 mm diameter polishing head with a Teflon adhesive tape glued to the relative surface to make it impermeable to the fouling agent. The cleaning head consisted of a 50 mm polishing head covered with four layers of cotton fabric, previously left for one night in a desiccator loaded with a saturated solution of potassium carbonate, with a humidity level of approximately 45%. The specimen had to be arranged in such a way that the fouling head rested exactly by gravity above the drop of dirt. The spindle was then started and left to act for one minute. Finally, the covered cleaning head was used after the cleaning tissue had been moistened in the center with 0.025 mL of water. The cleaning head was left to work for 22 s. At the end of the procedure, the cleaning head was removed without friction.
4.4. Fluorescence Extraction
The procedure for removing the residual dirt, often barely visible, from the central portion of the specimen on which the fouling/cleaning procedure was carried out was then started. To do this, 10 mL of distilled water was introduced into the extraction device within 30 min of the fouling procedure, respecting some indications given by the regulation. The first specimen was placed face up within the clamp frame of the extraction fixture. The sealed tube was then placed in the center of the specimen, so that the seal defined the solution extraction area. Once the tube had been locked in the frame with a slight pressure generated by the screwing of the wing nuts, 10 mL of distilled water was added, stirred, and left to rest for 3 min. Finally, with a Pasteur pipette, a portion of the solution obtained was inserted into the test tube, correctly labeled, and placed on the rack, while the subsequent samples were extracted.
Before proceeding with the measurement, it was necessary to set the wavelength of the ultraviolet source useful for exciting the sodium fluorescein, in our case set at 254 nm and the medium wavelength of the excited fluorescein’s fluorescent emission was set at 525 nm. The data thus obtained could finally be processed to obtain the cleanability index (CI), using the procedure described below. First of all, it was necessary to determine the correct fluorescence:
where is the corrected fluorescence of the specimen treated with nanotechnologies, is the fluorescence of the specimen treated with nanotechnologies, and is the distilled water fluorescence
Subsequently, the cleanability index was calculated as:
Cleanability index results are included in Table 5.
Table 5.
Cleanability index.
With the same amount of time to carry out the cleaning procedure, it can be noted that the Al2024 sample treated with nanotechnologies had a 16% increase in dirt removed, and the raw carbon treated with nanotechnologies had a 7% increase in dirt removed. The painted carbon treated with nanotechnologies had a 15% increase in dirt removed. Finally, the plexiglass treated with nanotechnologies had a decrease in dirt eliminated of 23%. Despite the apparently negative result obtained on the plexiglass, the results obtained on the composite and on the metal are promising in terms of efficacy of nanotechnology in terms of cleaning improvement. Likely, the ability of surfaces treated with nanotechnologies to be easier to clean (at least for CFC and Al2024) is due to the hydrophobicity characteristic that silicon nanoparticles are capable of attributing to the substrate on which they are applied. This property is also observable in Figure 15 where a visual comparison is made on the distribution of dirt in one treated and one untreated specimen. Extraction of the residual dirt and solution samples preparation is shown in Figure 16.

Figure 15.
Dirtying procedure (A–D) and cleaning procedure (E–G).
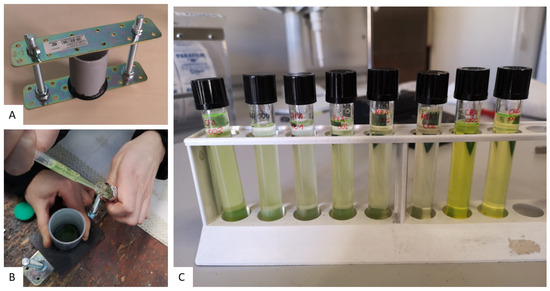
Figure 16.
Extraction of residual dirt: (A,B) extraction fixture; (C) test rack with solution samples.
5. Conclusions
The potential benefit of applying silicon-based nanotechnological treatments to aircraft components was preliminary evaluated on two specific applications regarding the post-corrosion fatigue behavior of 2024-T3 aluminum alloy components and the improved cleanability of composite and metallic surfaces. Improved post-corrosion fatigue behavior was demonstrated through a significant increase in the number of cycles needed to reach failure. The increase was always higher than 30%: for the first type of load, in fact, there was an increase in the number of cycles equal to 48% compared to untreated aluminum and equal to 44% compared to aluminum with the primer treatment; for the second type of load, there was an increase of 48% and 35%, respectively, while for the last type of load, the increases were 39% compared to aluminum untreated and 33% compared to aluminum with the primer treatment. On the cleanability aspect, the developed experimental procedure provided evidence of an increase in the ease of cleaning for three of four materials tested (raw carbon fiber, painted carbon fiber, and aluminum alloy).
Author Contributions
Conceptualization, E.C., J.C., F.G., A.F., V.S. and L.C.; methodology, E.C., J.C., A.F. and V.M.; validation, E.C., J.C., F.G., A.F., S.Z., V.M., V.S. and L.C.; formal analysis, E.C., J.C., F.G. and A.F.; investigation, E.C., J.C., F.G., A.F., S.Z., V.S. and L.C.; data curation, E.C., J.C., F.G., A.F., V.M. and V.S.; writing—original draft, E.C.; writing—review and editing, E.C., J.C., F.G., A.F., S.Z., V.M., V.S. and L.C. All authors have read and agreed to the published version of the manuscript.
Funding
This research received no external funding.
Institutional Review Board Statement
Not applicable.
Informed Consent Statement
Not applicable.
Data Availability Statement
The raw data supporting the conclusions of this article will be made available by the authors on request.
Conflicts of Interest
Author Sabrina Zuccalà was employed by the company 4Ward360, Authors Valentina Martilla, Vito Sapienza and Lorenzo Chesta were employed by the company CFM Air. The remaining authors declare that the research was conducted in the absence of any commercial or financial relationships that could be construed as a potential conflict of interest.
References
- Drexler, K.E. Engines of Creation: The Coming Era of Nanotechnology; The Anchor Books, Bantam Doubleday Dell Publishing Group: New York, NY, USA, 1986. [Google Scholar]
- Zhu, H.; Jiang, S.; Chen, H.; Roco, M. International perspective on nanotechnology papers, patents, and NSF awards (2000–2016). J. Nanoparticle Res. 2017, 19, 370. [Google Scholar] [CrossRef]
- Journal of Nanotechnology, 5-Year-Impact-of-Journal. Available online: https://academic-accelerator.com (accessed on 7 June 2023).
- Mathew, J.; Joy, J.; George, S.C. Potential applications of nanotechnology in transportation: A review. J. King Saud Univ. Sci. 2019, 31, 586–594. [Google Scholar] [CrossRef]
- Bhat, A.; Budholiya, S.; Sakthivel, A.; Hameed Sultan, M.T.; Hui, D.; Md Shah, A.; Safri, S. Review on nanocomposites based on aerospace applications. Nanotechnol. Rev. 2021, 10, 237–253. [Google Scholar] [CrossRef]
- Rashid, A.; Haque, M.; Islam, S.; Labib, K. Nanotechnology-enhanced fiber-reinforced polymer composites: Recent advancements on processing techniques and applications. Heliyon 2024, 10, e24692. [Google Scholar] [CrossRef] [PubMed]
- Yang, C.; Zhao, Q.; Zhang, Z.; Li, L.; Tian, W.; Liu, R.; Zhang, P.; Xu, Y.; Li, Y.; Zhang, Z.; et al. Nanoparticle additions promote outstanding fracture toughness and fatigue strength in a cast Al–Cu alloy. Mater. Des. 2019, 186, 108221. [Google Scholar] [CrossRef]
- Zhu, H.; Li, J. Advancements in Corrosion Protection for Aerospace Aluminum Alloys through Surface Treatment. Int. J. Electrochem. Sci. 2024, 19, 100487. [Google Scholar] [CrossRef]
- Yang, H.H.; Wang, Y.L.; Wang, X.S.; Pan, P.; Jia, D.W. Synergistic effect of environmental media and stress on the fatigue fracture behaviour of aluminium alloys: Synergistic effect of environmental media and stress on the fatigue fracture behavior of aluminum alloys. Fatigue Fract. Eng. Mater. Struct. 2016, 39, 1309–1316. [Google Scholar] [CrossRef]
- Schijve, J. Fatigue of Structures and Materials; Kluwer Academic Publishers: Alphen aan den Rijn, The Netherlands, 2001. [Google Scholar]
- ASTM G31-21; Standard Guide for Laboratory Immersion Corrosion Testing of Metals. ASTM International: West Conshohocken, PA, USA, 2021.
- Del Secco, B.; Trabucco, S.; Ravegnani, F.; Koivisto, A.; Zanoni, I.; Blosi, M.; Ortelli, S.; Altin, M.; Bartolini, G.; Costa, A.; et al. Particles Emission from an Industrial Spray Coating Process Using Nano-Materials. Nanomaterials 2022, 12, 313. [Google Scholar] [CrossRef] [PubMed]
- Girotto, C.; Rand, B.; Steudel, S.; Genoe, J.; Heremans, P. Nanoparticle-based, spray-coated silver top contacts for efficient polymer solar cells. Org. Electron. 2009, 10, 735–740. [Google Scholar] [CrossRef]
- ASTM E466; Standard Practice for Conducting Force Controlled Constant Amplitude Axial Fatigue Tests of Metallic Materials. ASTM International: West Conshohocken, PA, USA, 2021.
- MIL-HDBK-5H; Metallic Materials and Elements for Aerospace Vehicle Structures. US Department of Defense: Arlington, VA, USA, 1998; p. 1653.
- Al-Rubaie, K. A general model for stress-life fatigue prediction. Mater. Werkst. 2008, 39, 400–406. [Google Scholar] [CrossRef]
- Mazlan, S.; Yidris, N.; Zahari, R.; Gires, E.; Abang Haji Abdul Majid, D.L.; Ahmad, K. Prediction of fatigue life of aluminum 2024-T3 at low temperature by finite element analysis. J. Mech. Eng. Sci. 2020, 14, 7170–7180. [Google Scholar] [CrossRef]
- Frulla, G.; Avalle, G.; Sapienza, V. Preliminary evaluation of the fatigue behaviour of aluminium alloy in corrosive environment. Aircr. Eng. Aerosp. Technol. 2015, 87, 165–171. [Google Scholar] [CrossRef]
- Jones, K.; Hoeppner, D. Prior corrosion and fatigue of 2024-T3 aluminum alloy. Corros. Sci. 2006, 48, 3109–3122. [Google Scholar] [CrossRef]
- Walde, K.; Hillberry, B. Initiation and shape development of corrosion-nucleated fatigue cracking. Int. J. Fatigue 2007, 29, 1269–1281. [Google Scholar] [CrossRef]
- Song, H.; Liu, C.; Zhang, H.; Leen, S. A DIC-Based Study on Fatigue Damage Evolution in Pre-Corroded Aluminum Alloy 2024-T4. Materials 2018, 11, 2243. [Google Scholar] [CrossRef] [PubMed]
- ASTMC756; Standard Test Method for Cleanability of Surface Finishes. ASTM International: West Conshohocken, PA, USA, 2021.
Disclaimer/Publisher’s Note: The statements, opinions and data contained in all publications are solely those of the individual author(s) and contributor(s) and not of MDPI and/or the editor(s). MDPI and/or the editor(s) disclaim responsibility for any injury to people or property resulting from any ideas, methods, instructions or products referred to in the content. |
© 2024 by the authors. Licensee MDPI, Basel, Switzerland. This article is an open access article distributed under the terms and conditions of the Creative Commons Attribution (CC BY) license (https://creativecommons.org/licenses/by/4.0/).