
Evaluation of User-Centric Cell-Free Massive Multiple-Input Multiple-Output Networks Considering Realistic Channels and Frontend Nonlinear Distortion


Abstract
1. Introduction
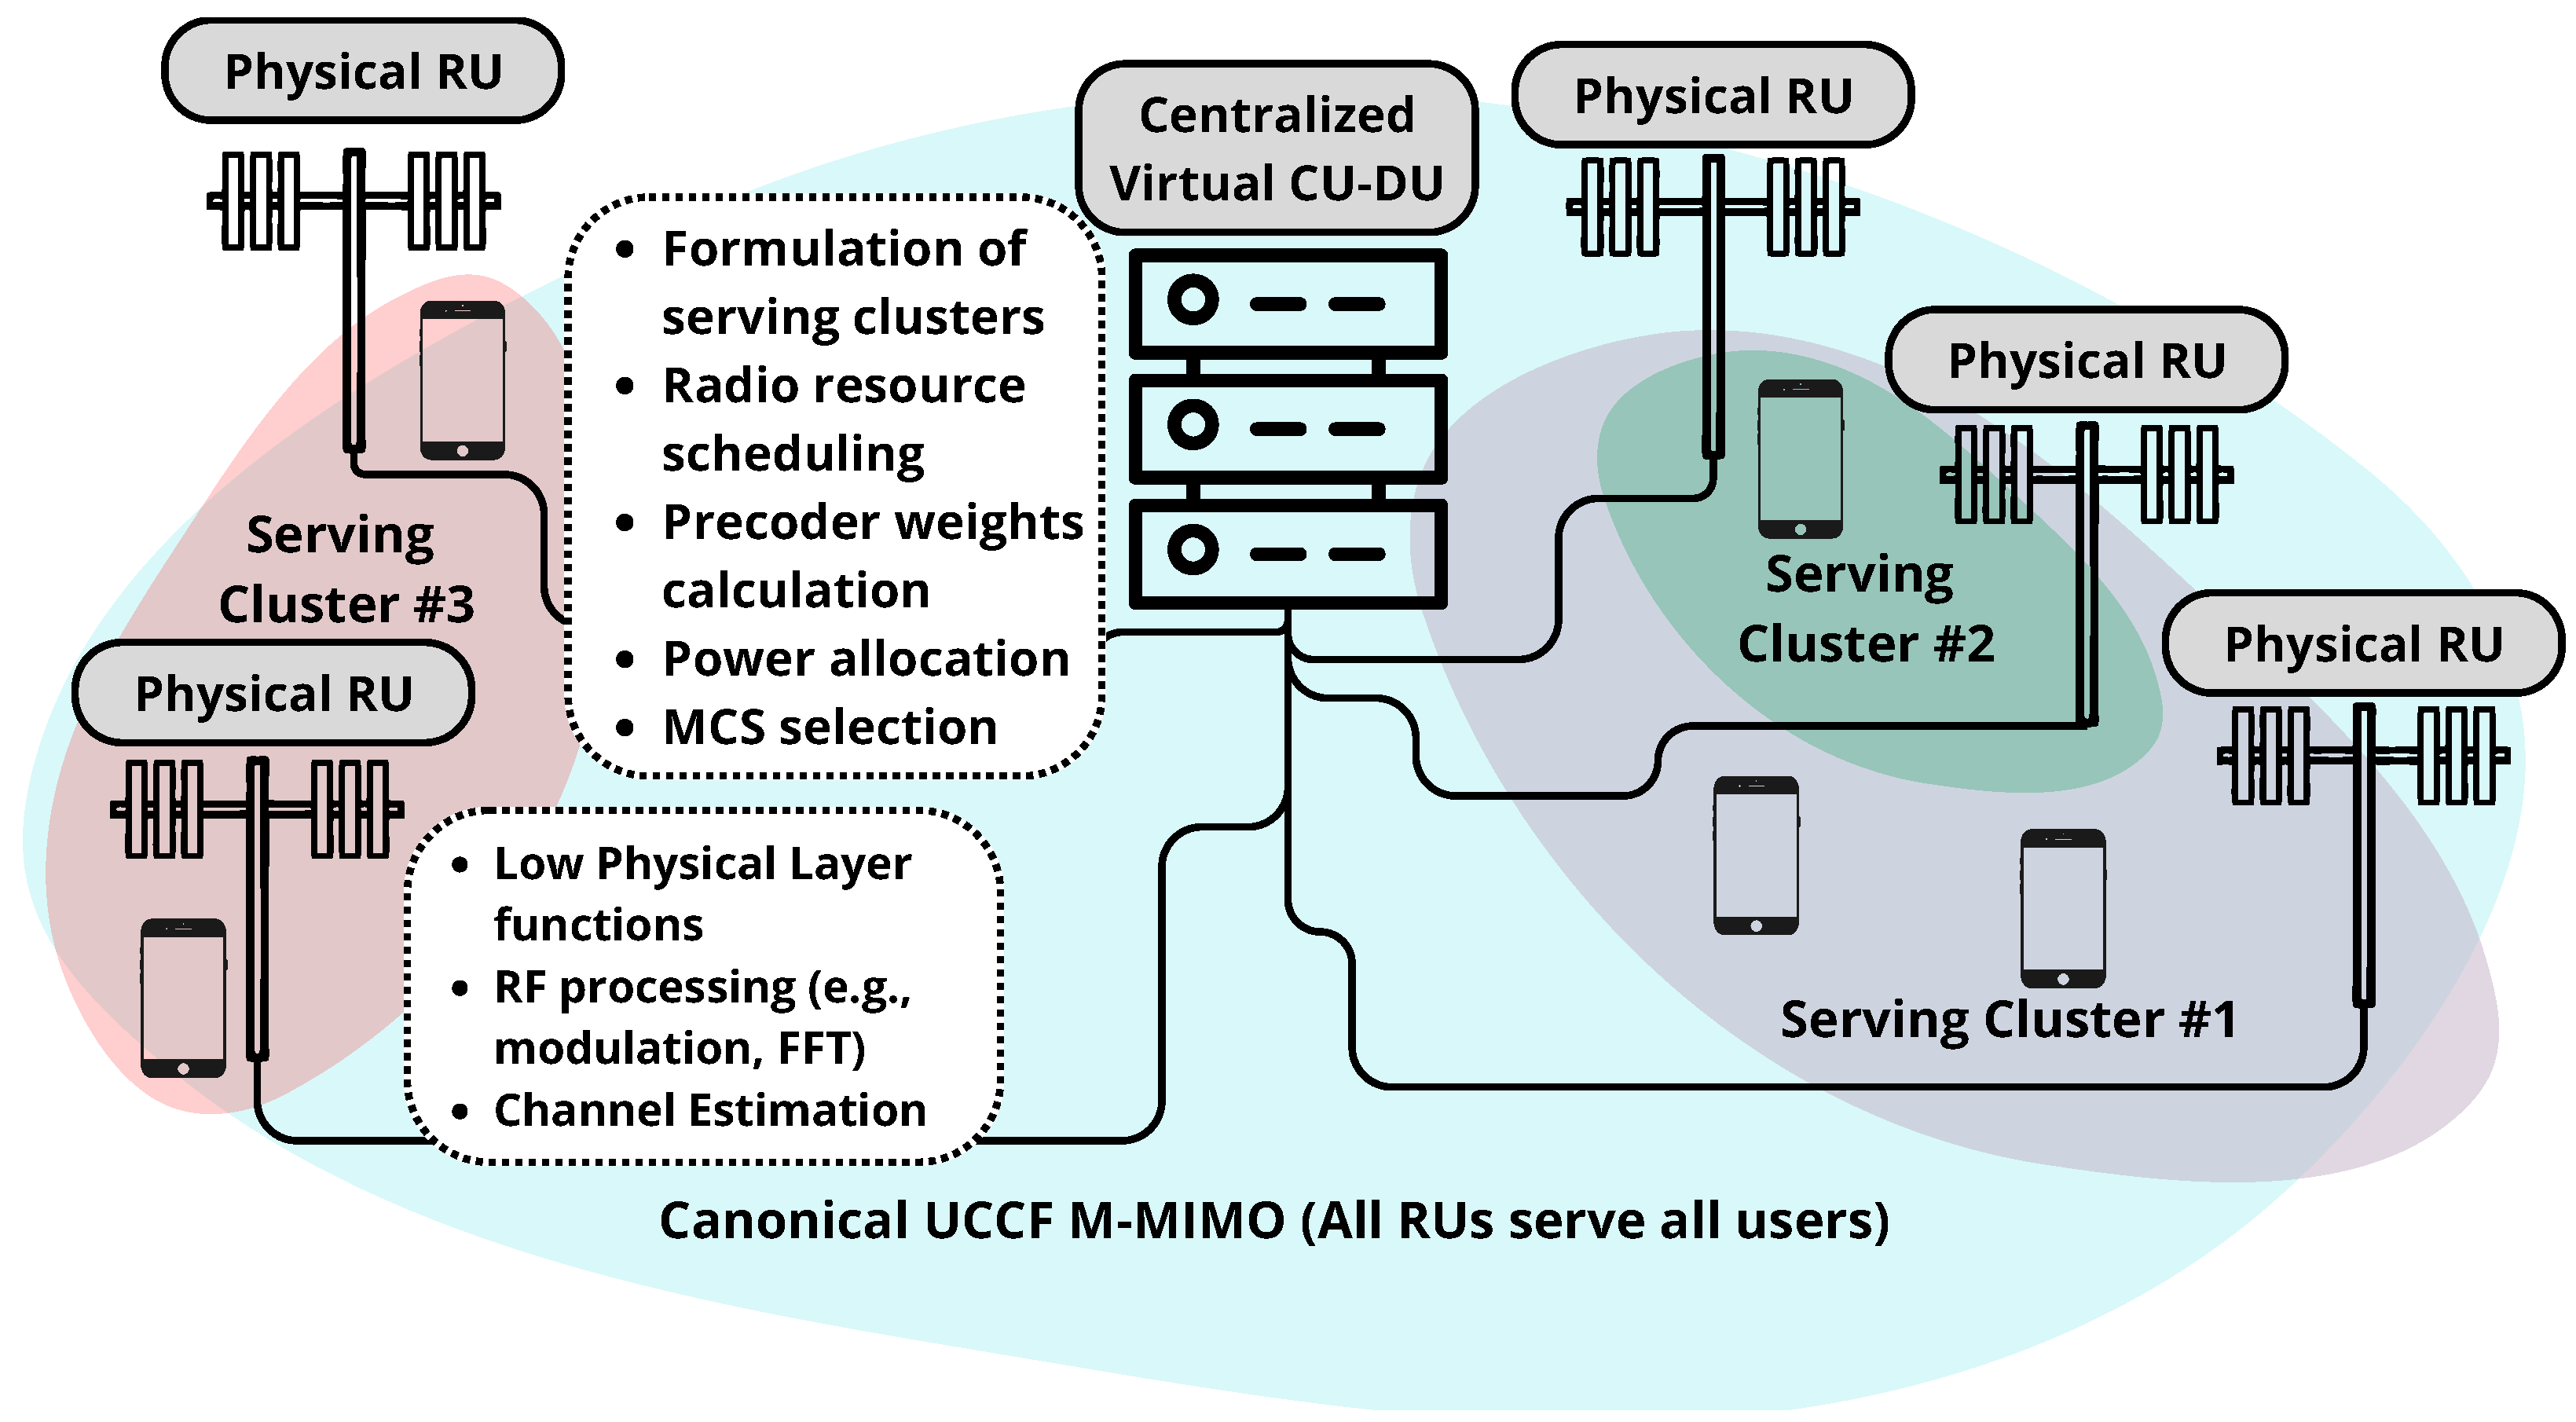
2. System Model
- Signal processing for channel estimation.
- Signal processing for data reception and transmission.
- Fronthaul signaling for data and Channel State Information (CSI) sharing.
- Power allocation optimization.
3. PA Nonlinear Model
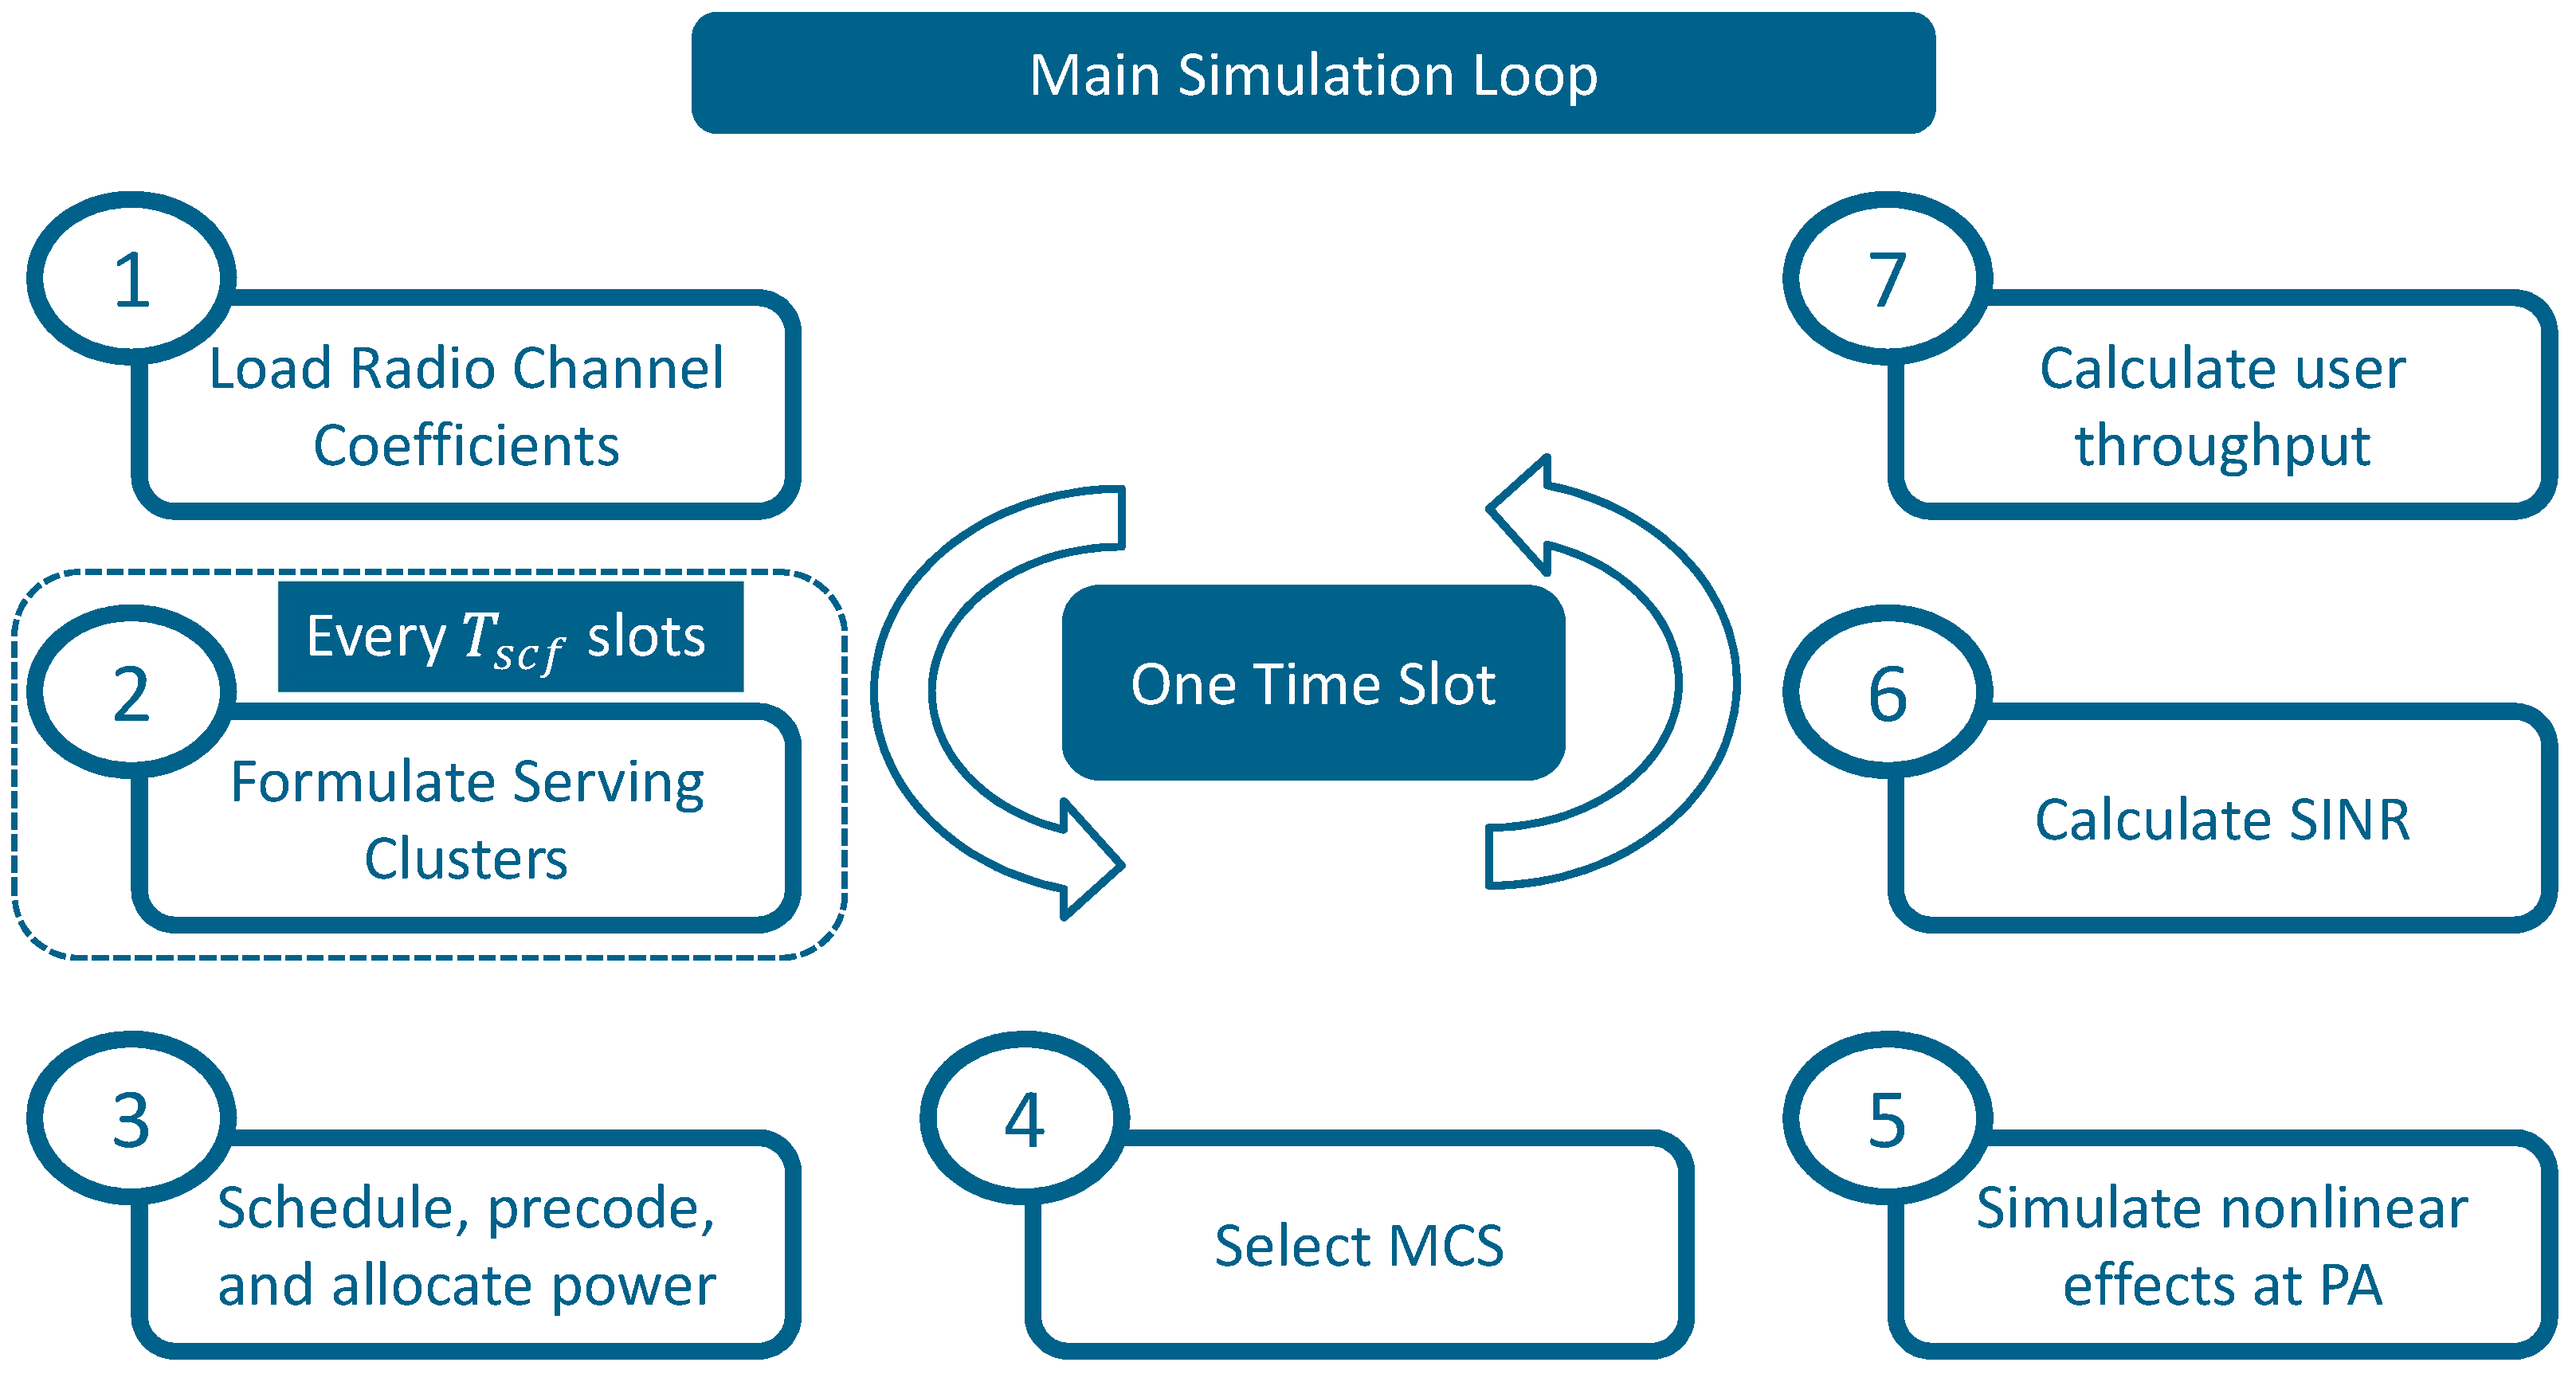
4. Simulation Environment
4.1. Generation of Radio Channel Coefficients
4.2. Formulation of Serving Clusters
4.3. Scheduling of Radio Resources, Precoding, and Power Allocation
| Algorithm 1 Radio resource scheduling in a UCCF M-MIMO network |
Require: past rate of each UE, inter-cluster interference calculated from the total past interference by each UE, radio channel coefficients, channel correlation threshold
|
4.4. MCS Selection
4.5. Simulation of Nonlinear Effects at PA
4.6. Calculation of Real SINR and BLER
4.7. Calculation of UE Rate
4.8. Simulation Scenario
5. Results
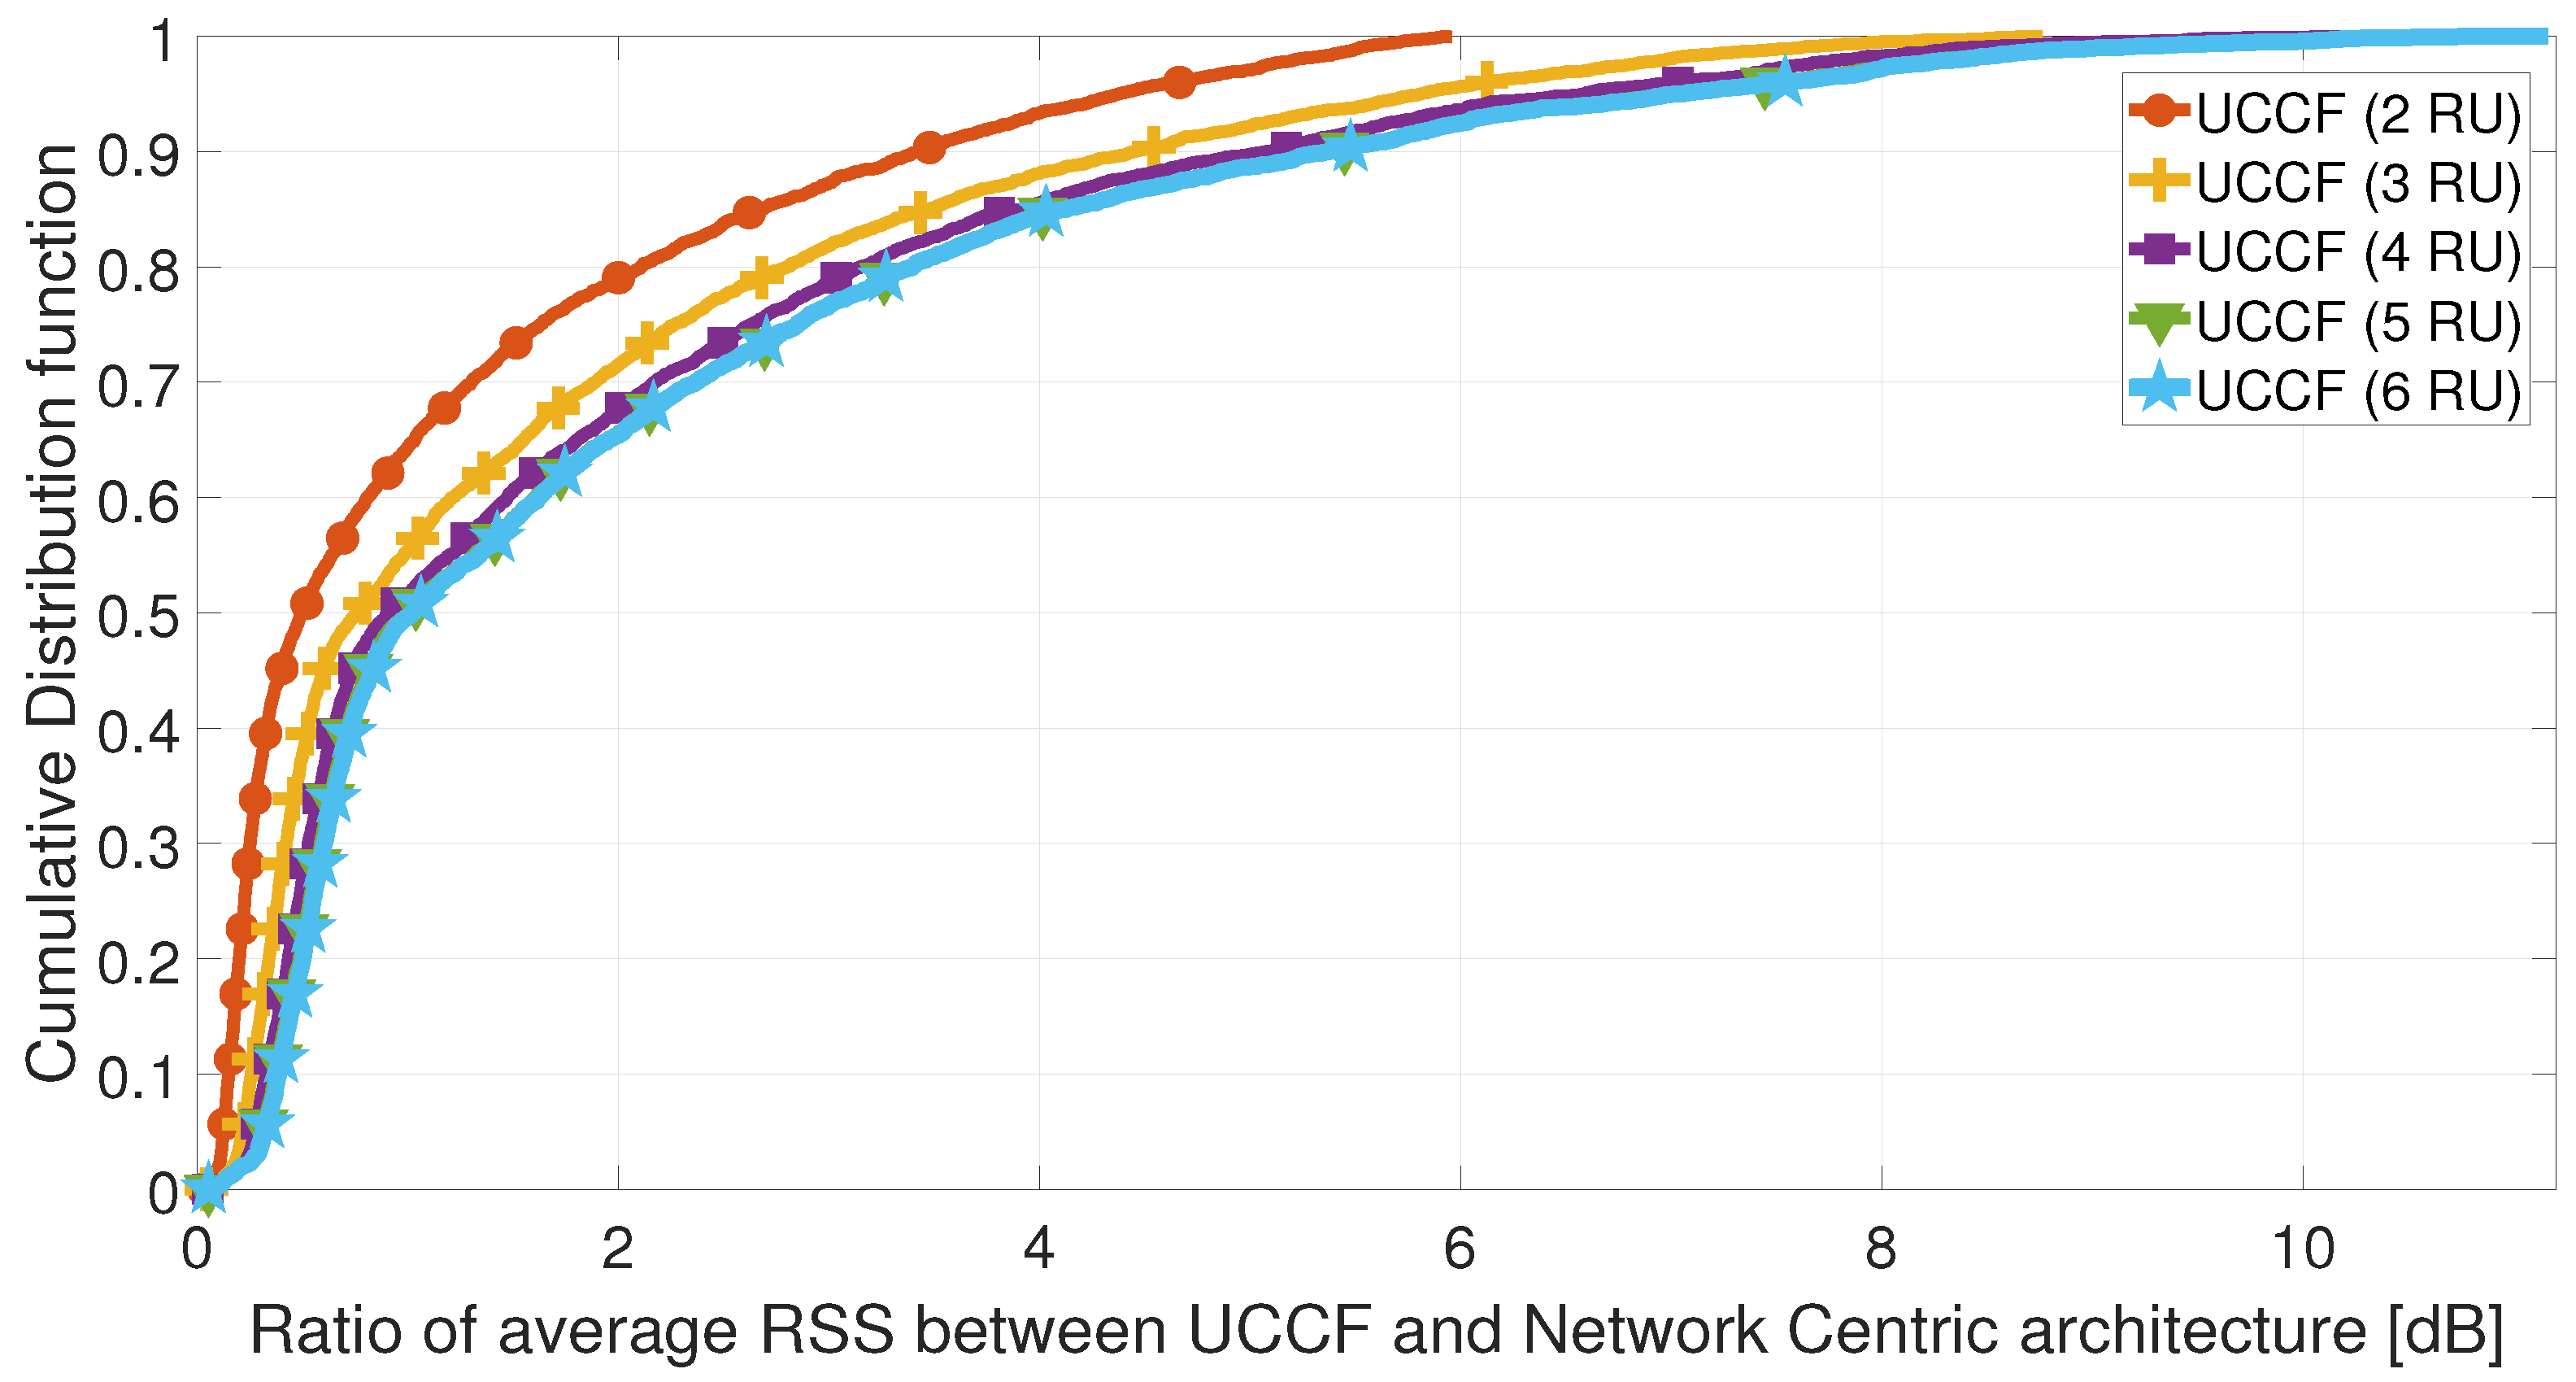
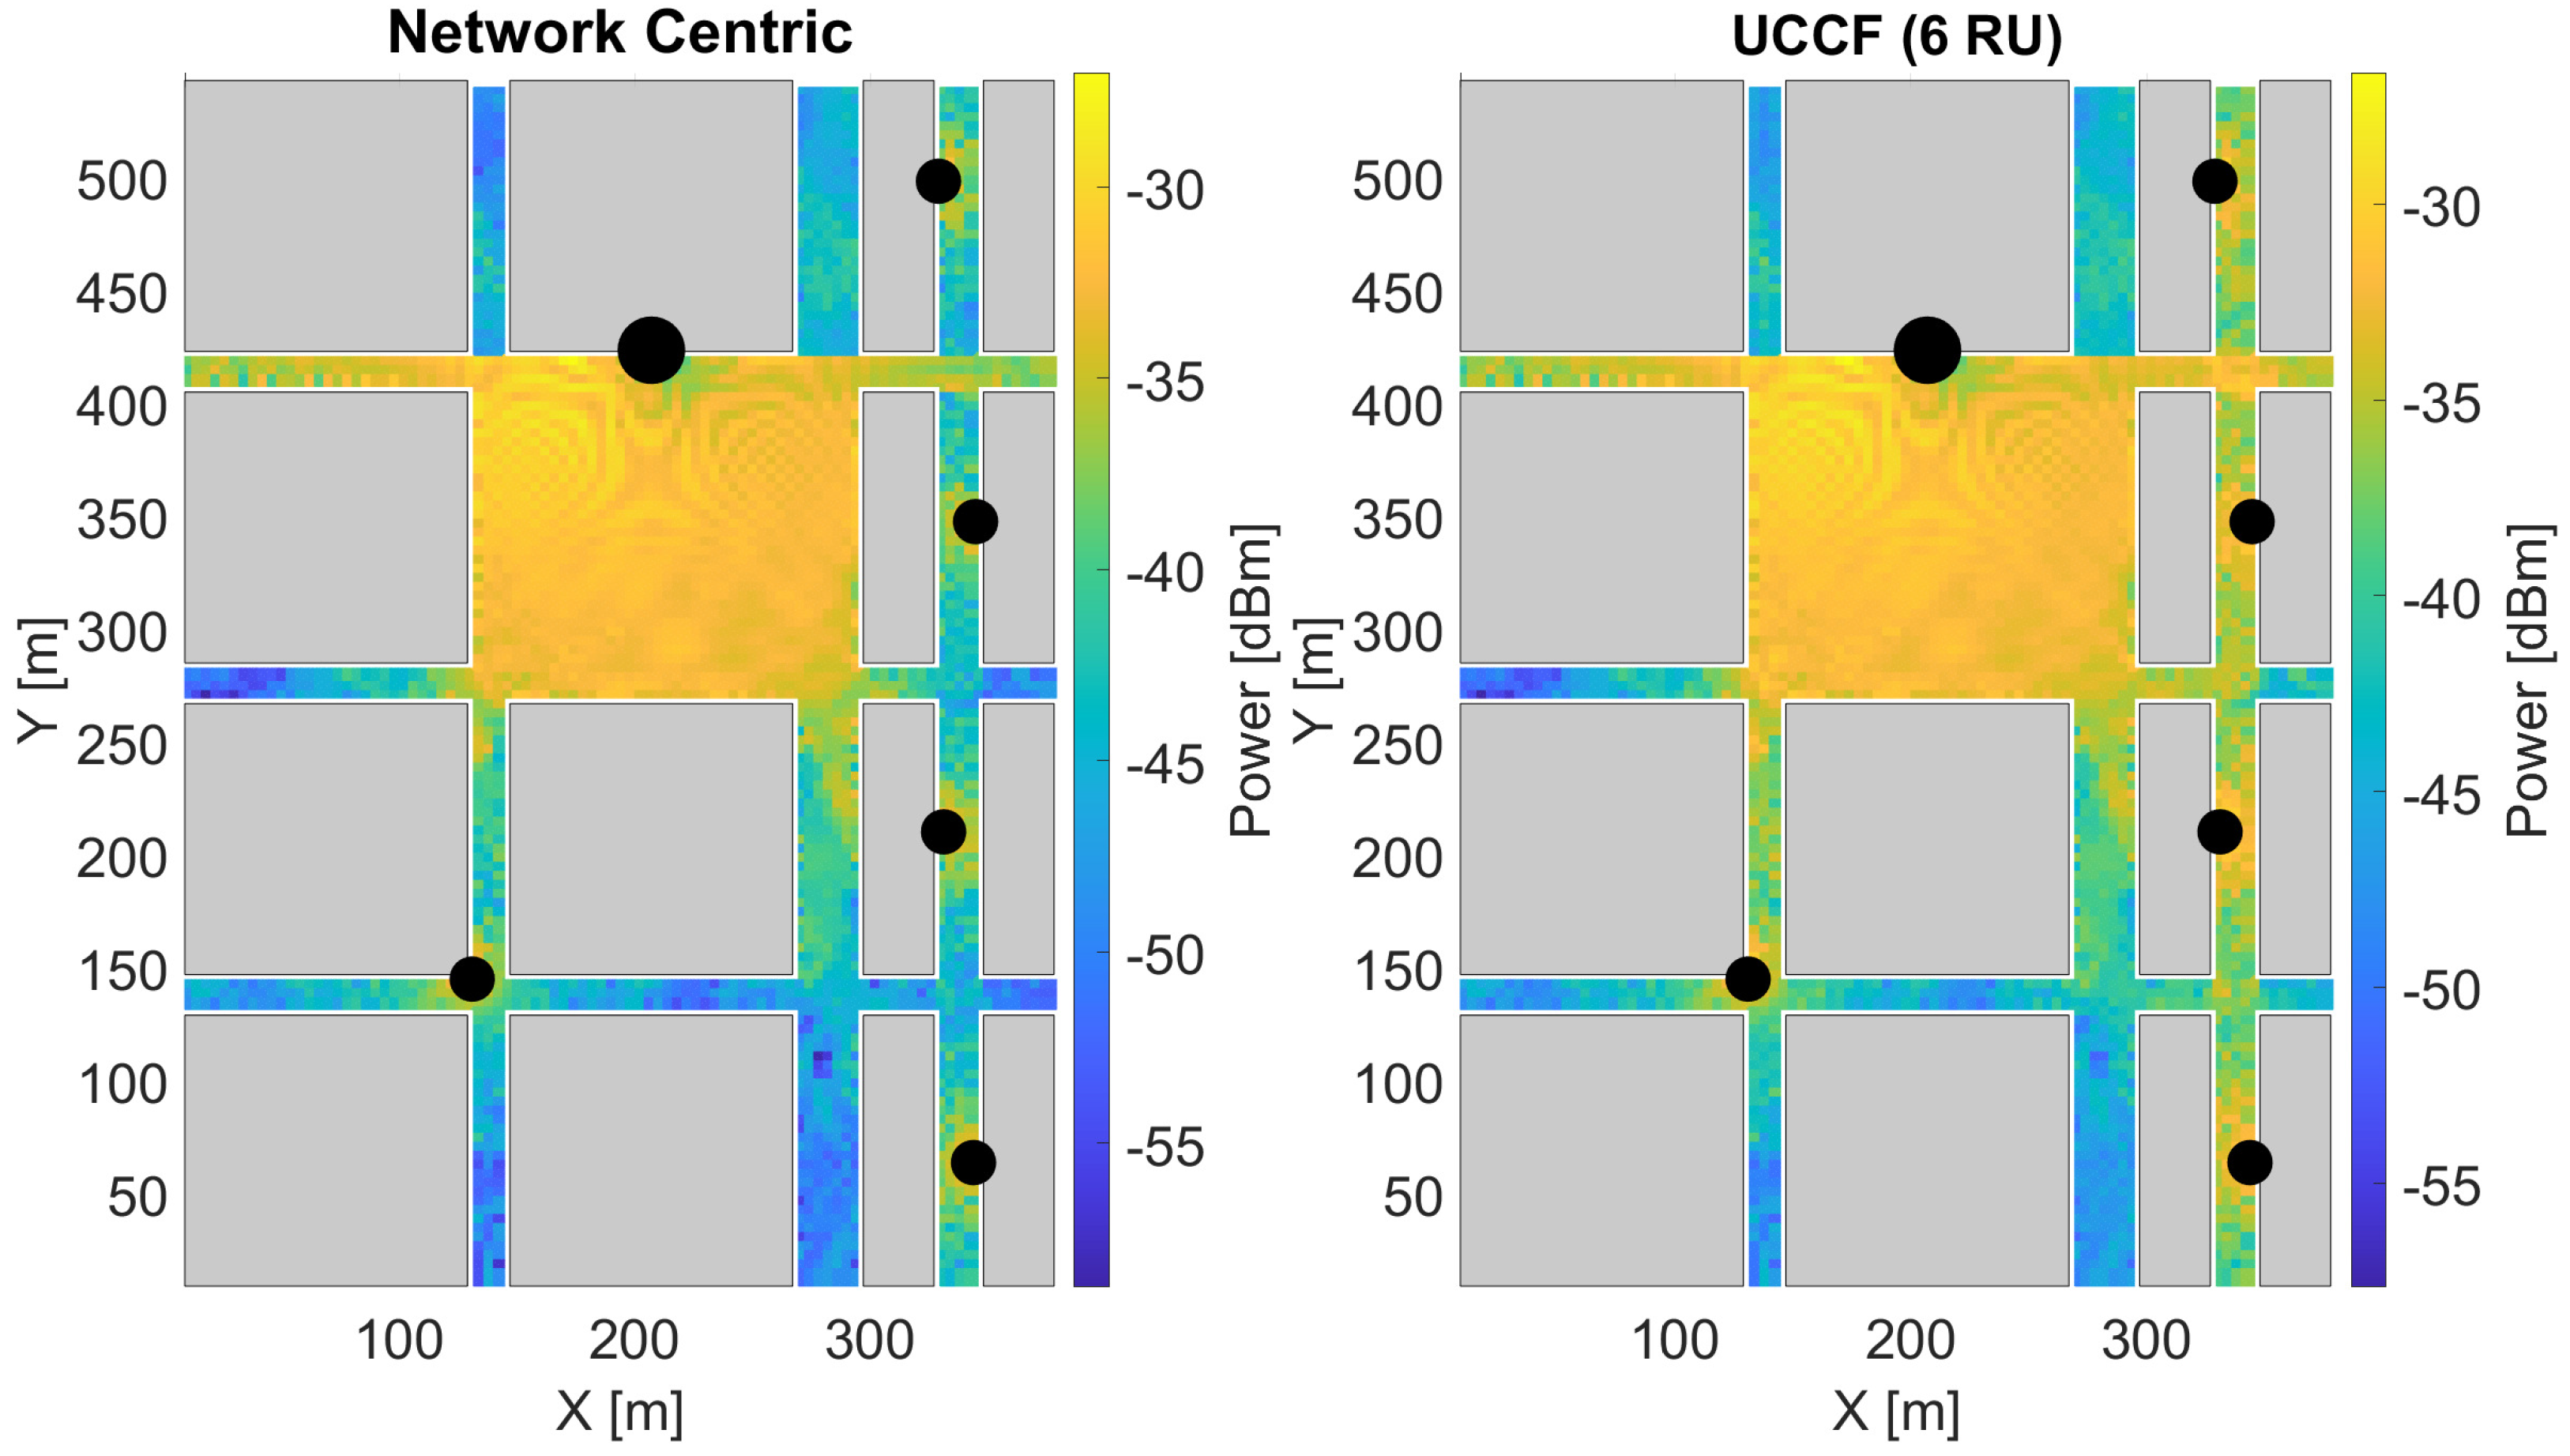
5.1. Coverage Analysis
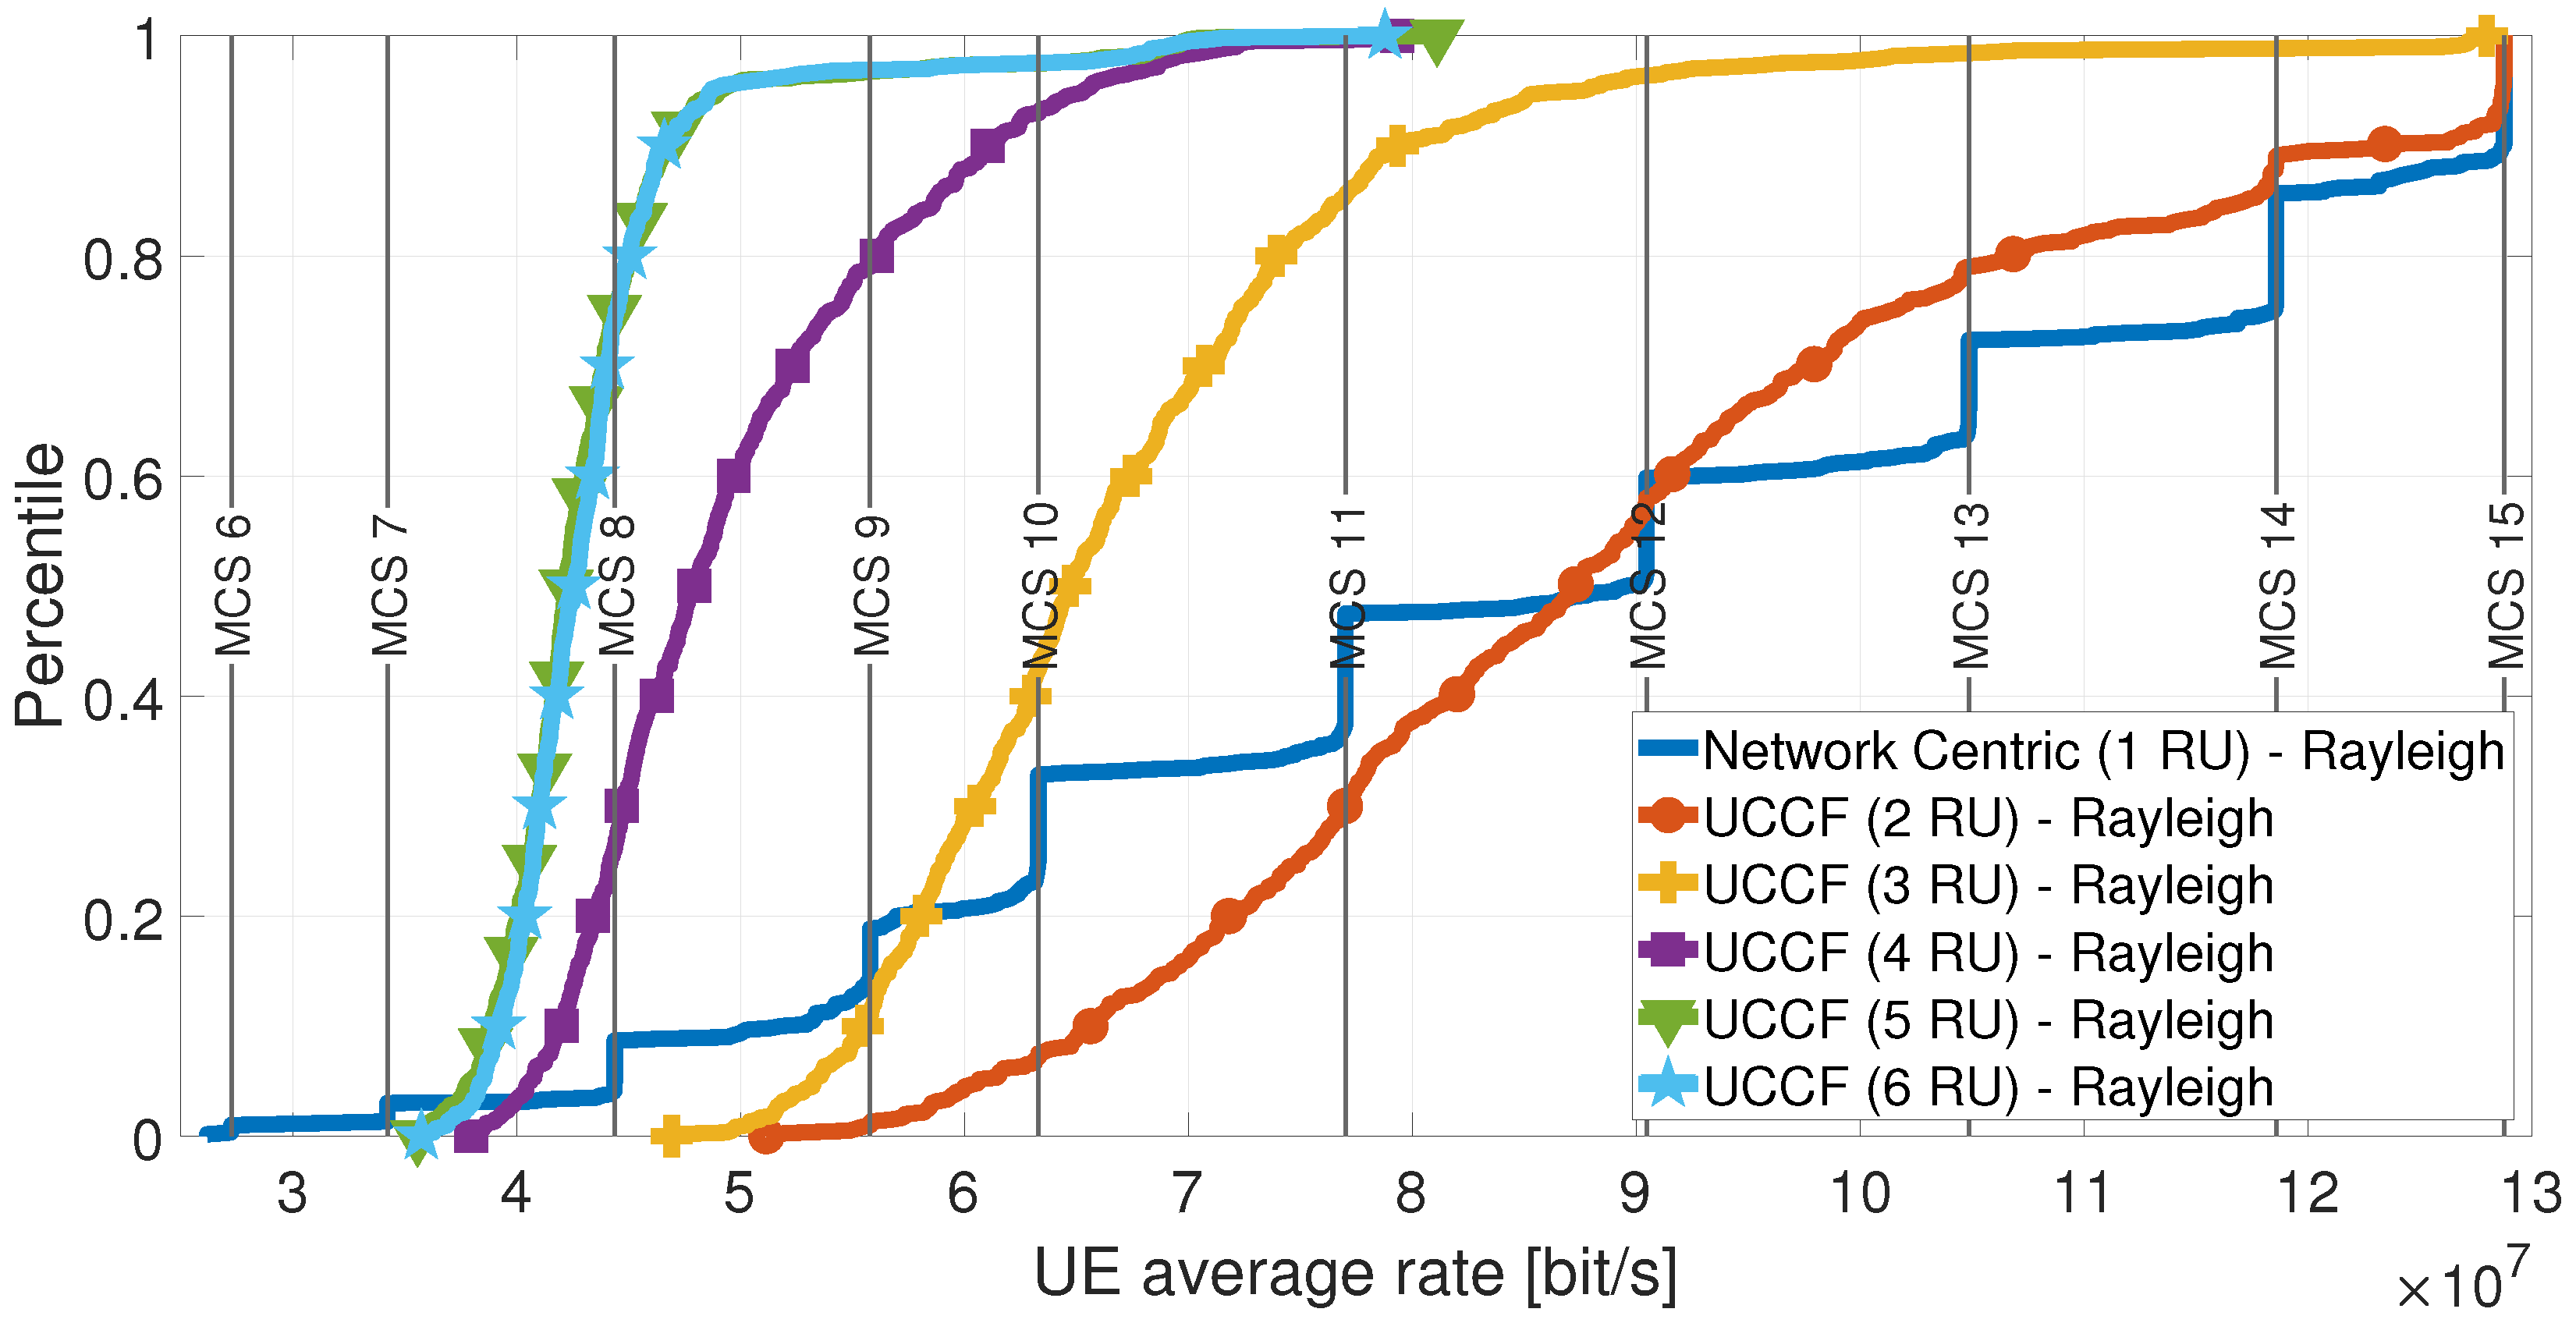
5.2. Throughput Analysis without Nonlinear Effects
5.2.1. Rayleigh Channel
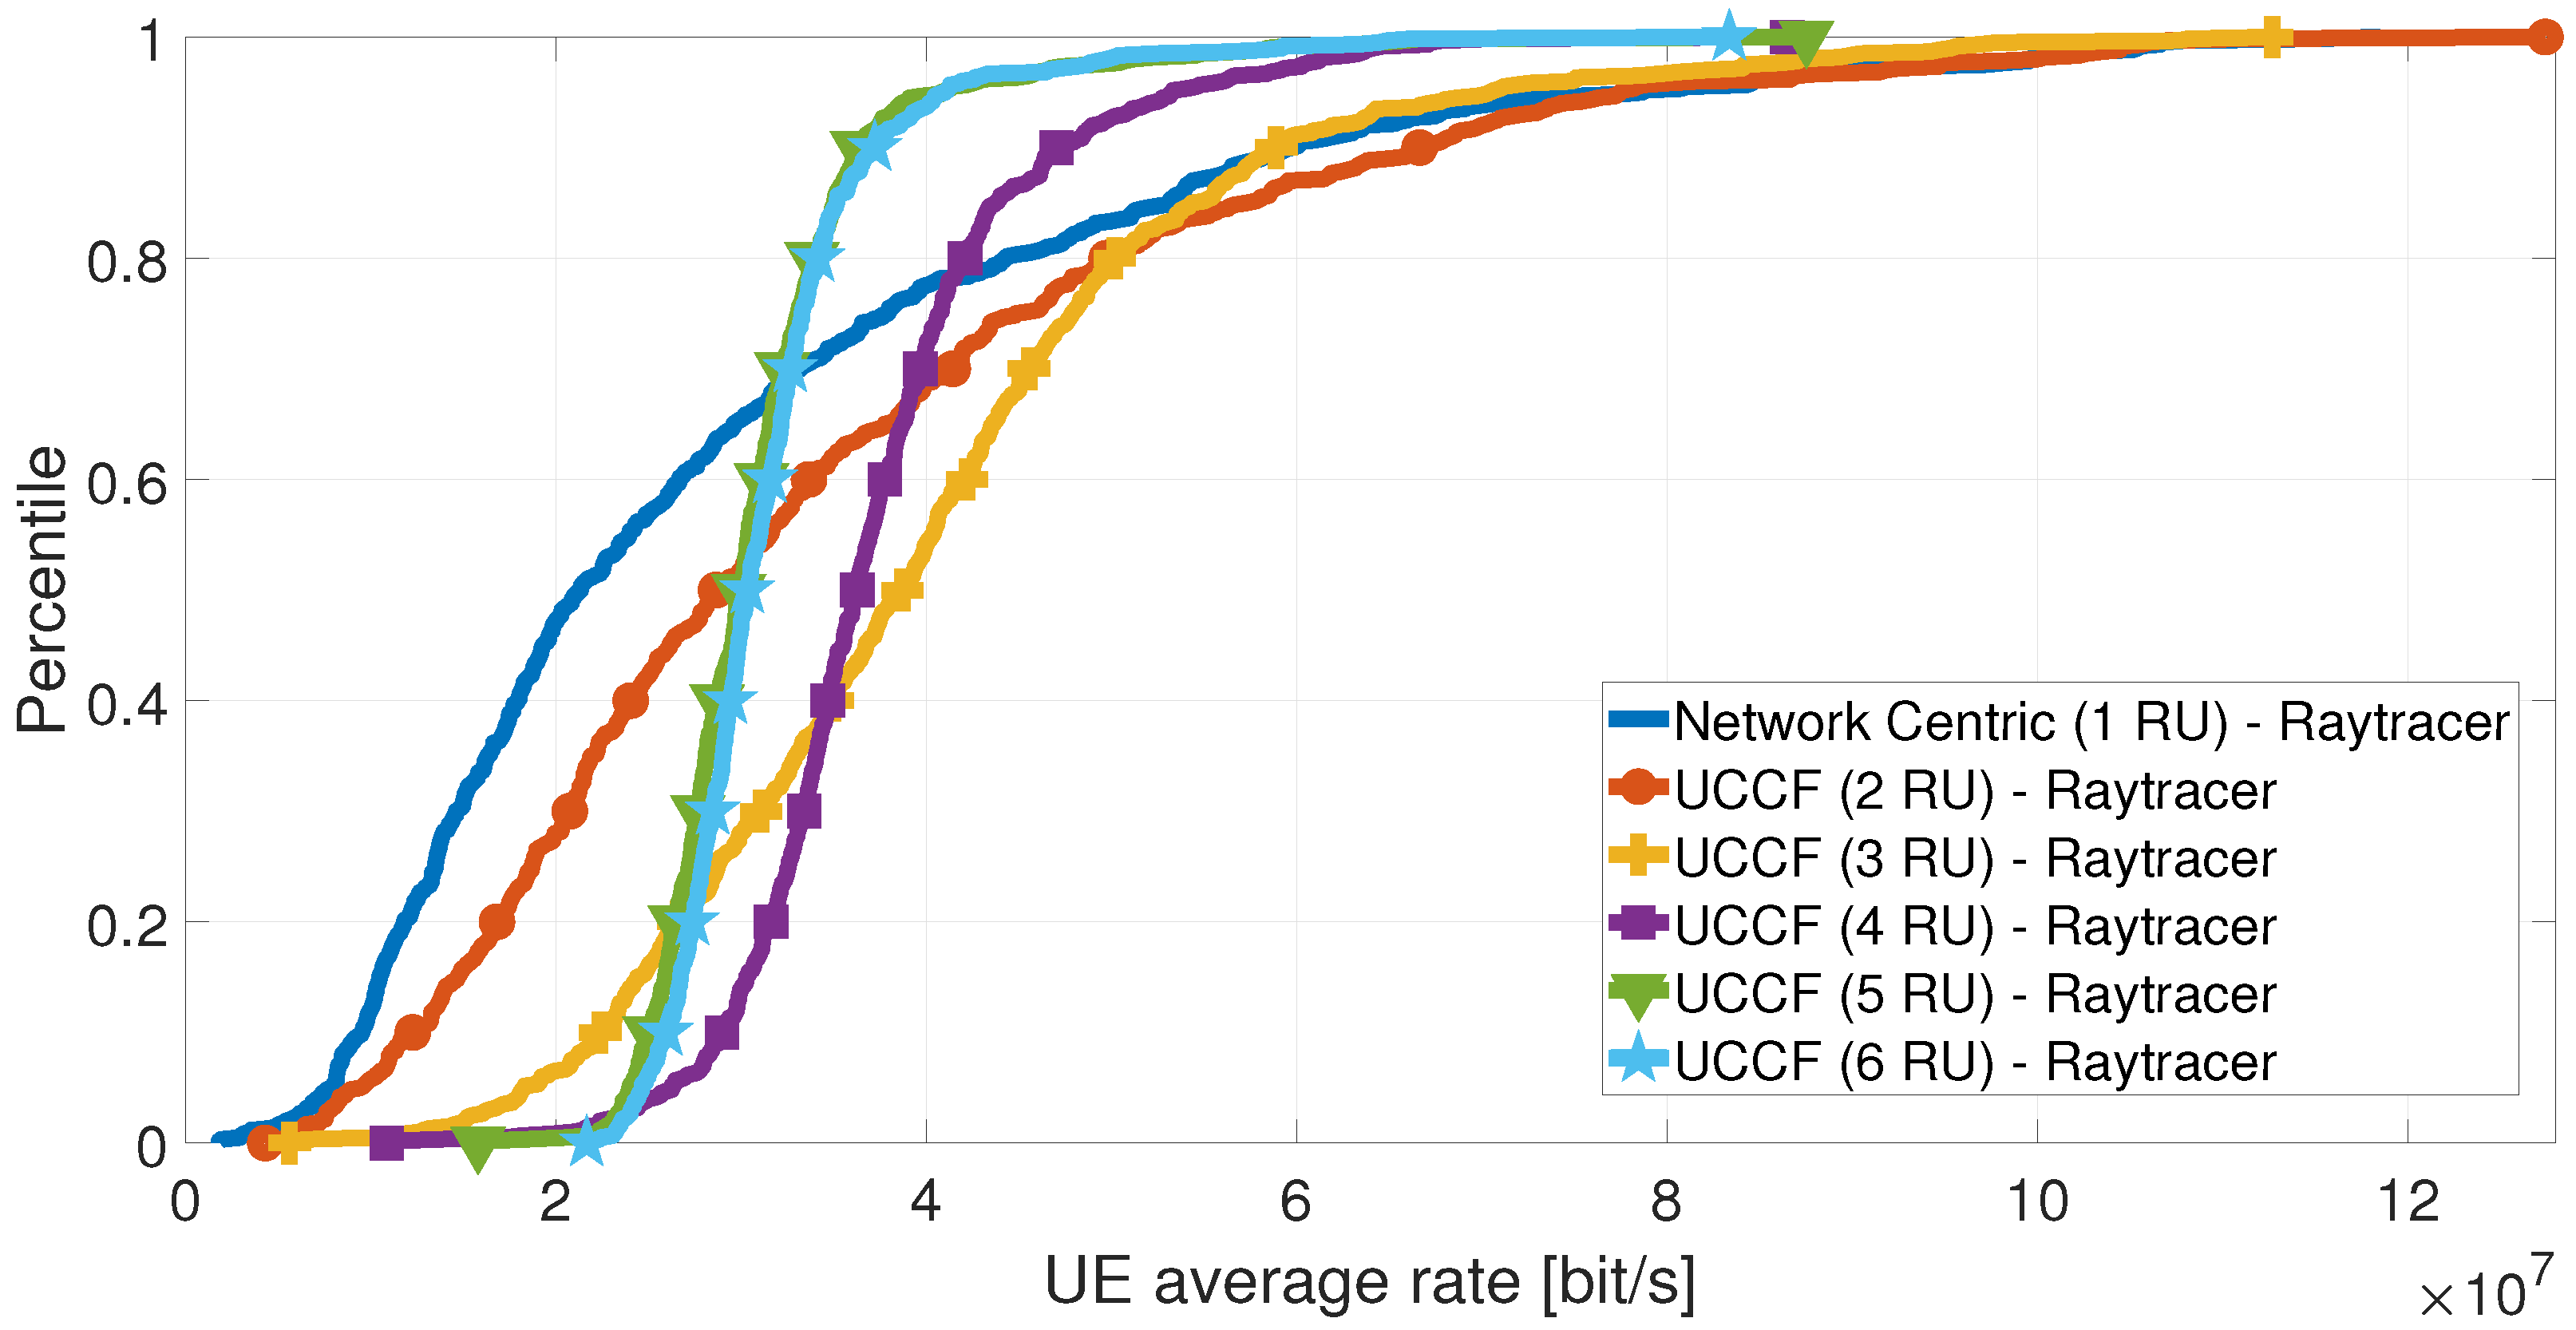
5.2.2. Ray-Tracer Channel
5.2.3. Comparison
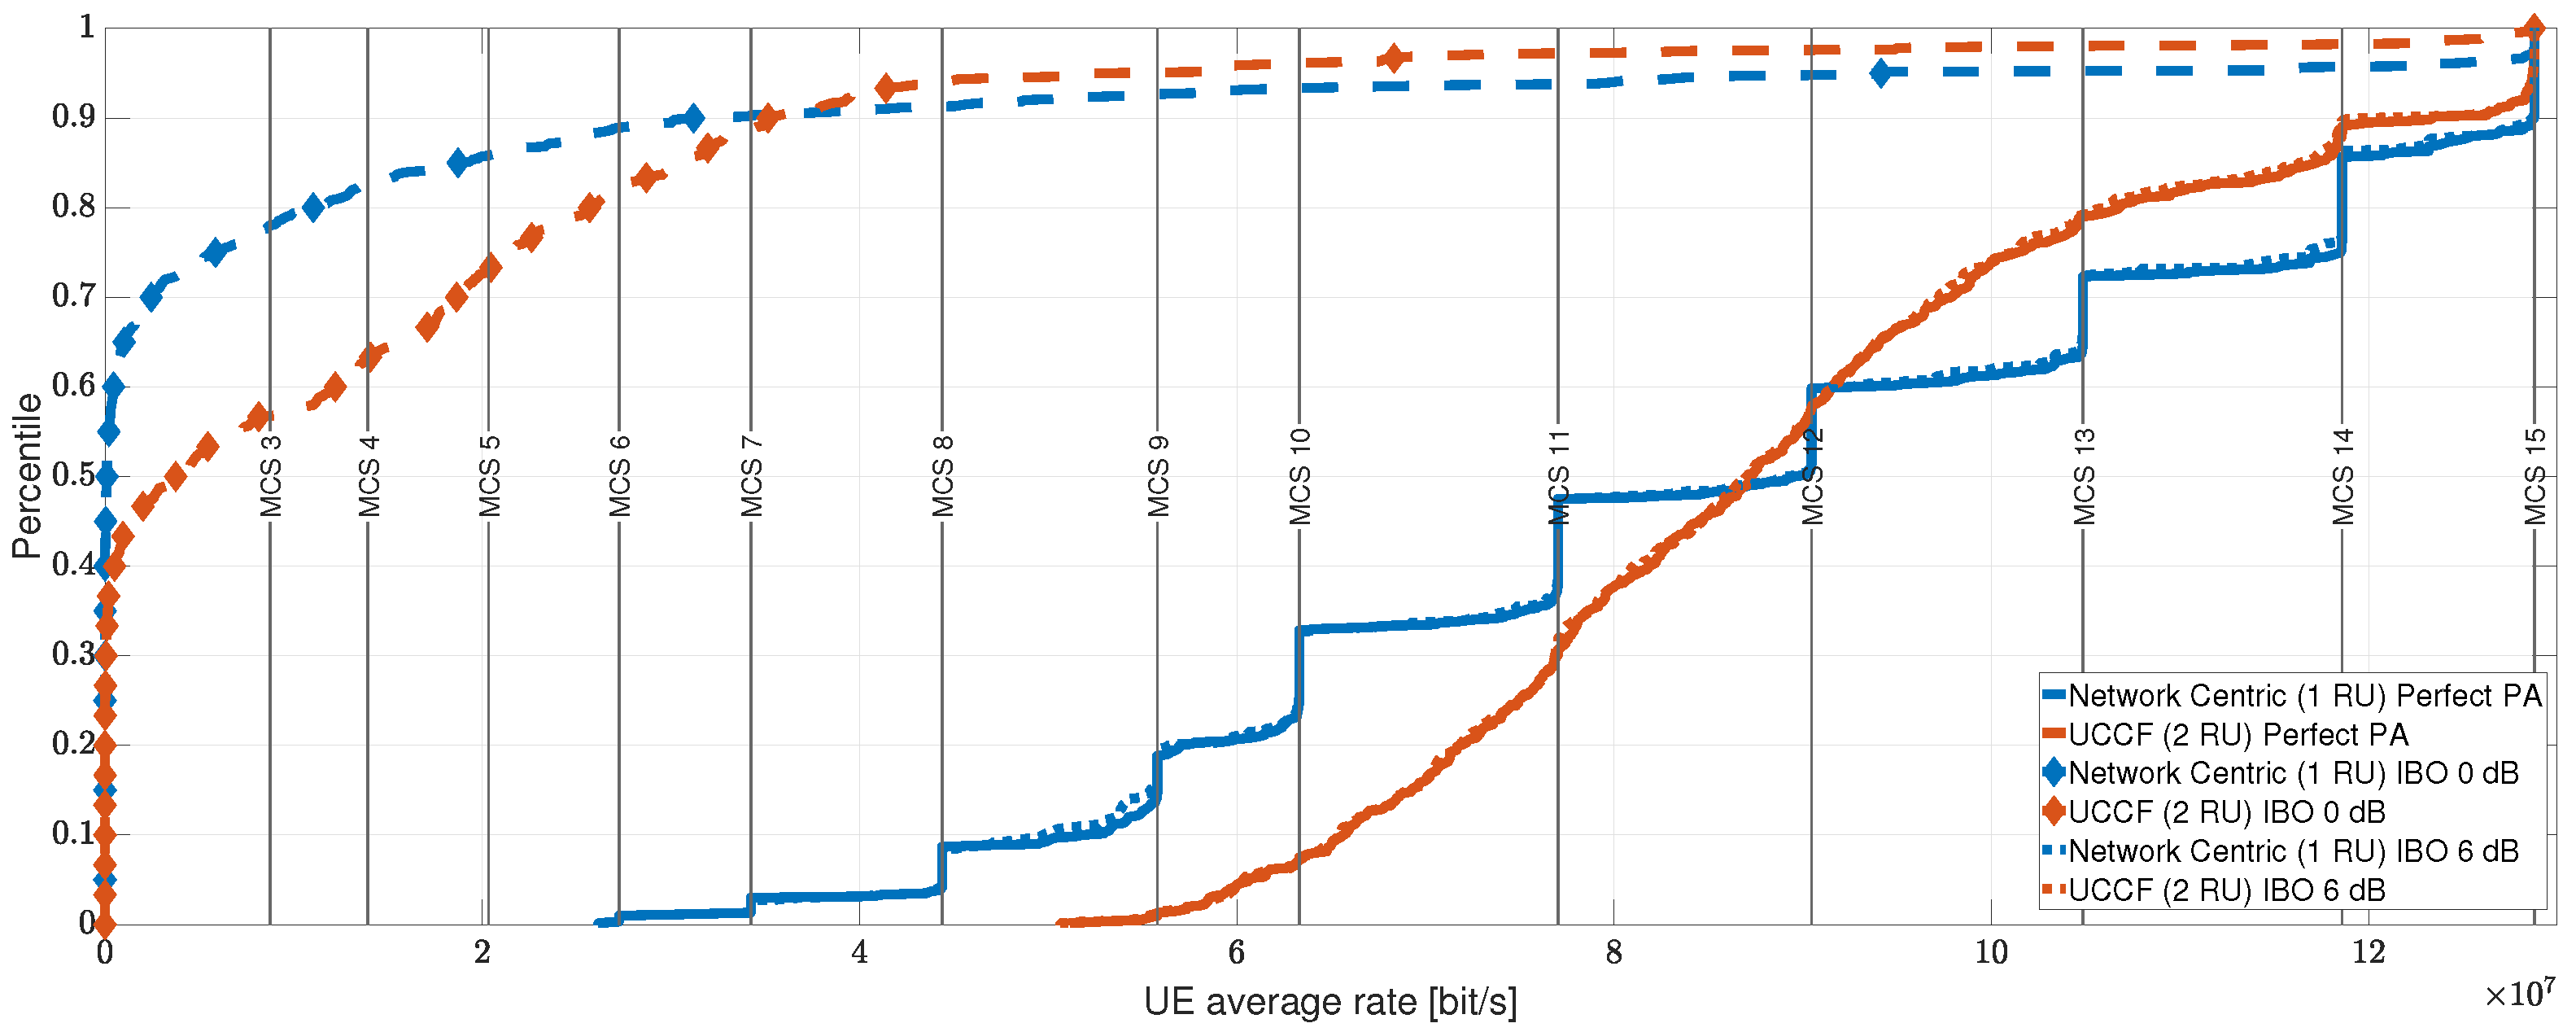
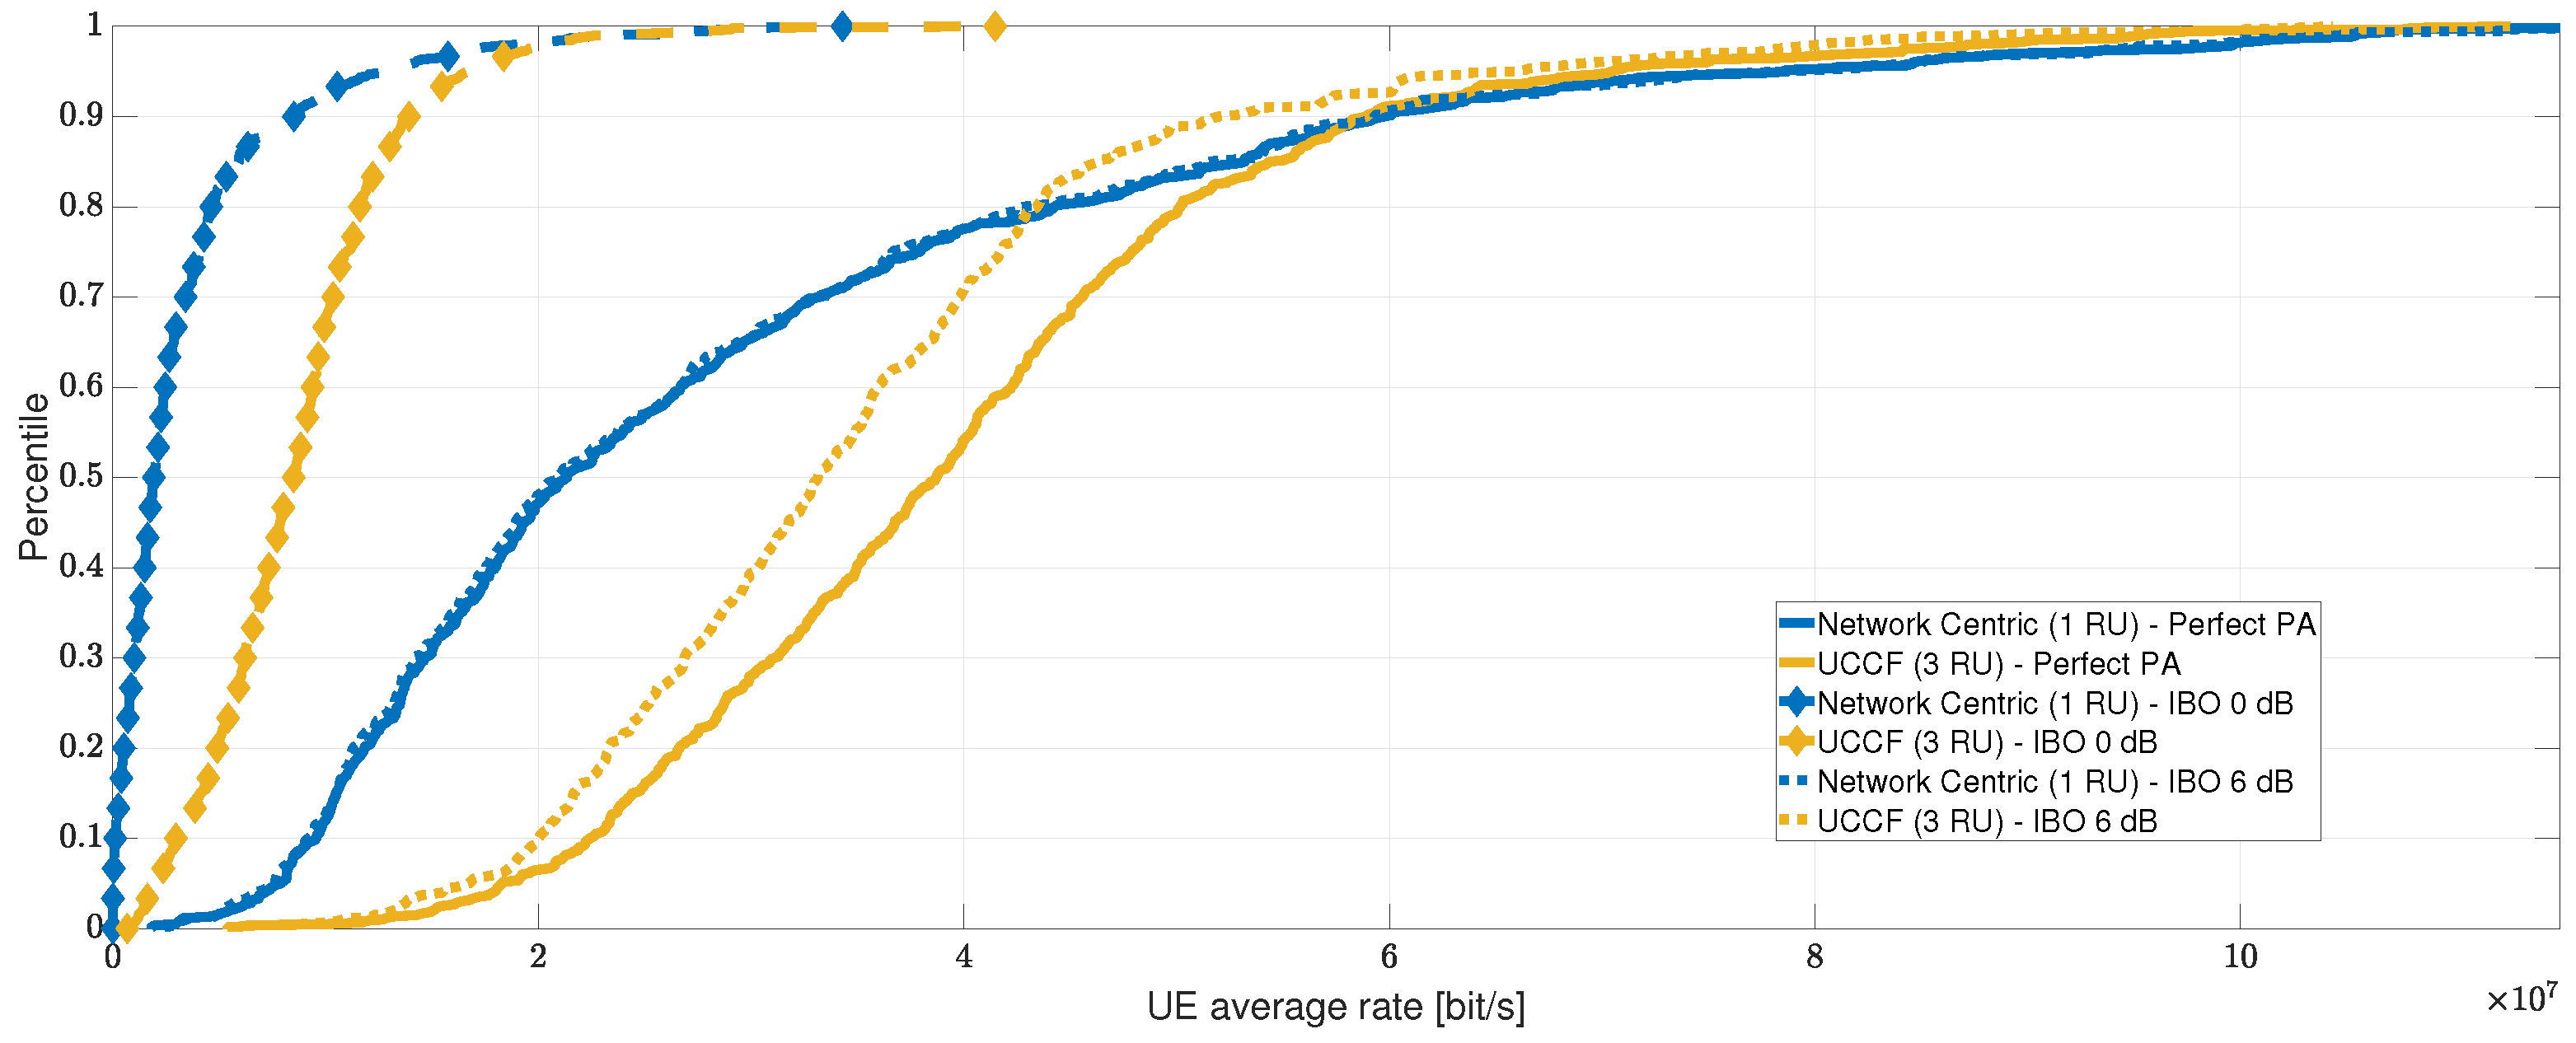
5.3. Throughput Analysis Considering Nonlinear Effects
6. Conclusions
Author Contributions
Funding
Institutional Review Board Statement
Informed Consent Statement
Data Availability Statement
Conflicts of Interest
Abbreviations
| BLER | Block Error Rate |
| BS | Base Station |
| CDF | Cumulative Distribution Function |
| CU | Central Unit |
| DU | Distributed Unit |
| EESM | Exponential Effective SINR Mapping |
| LoS | Line of Sight |
| MCS | Modulation and Coding Scheme |
| ML | Machine Learning |
| MNO | Mobile Network Operator |
| M-MIMO | Massive Multiple-Input-Multiple-Output |
| MU-MIMO | Multi-User MIMO |
| OFDMA | Orthogonal Frequency-Division Multiple Access |
| PA | Power Amplifier |
| PF | Proportional Fairness |
| RAN | Radio Access Network |
| RB | Resource Block |
| RF | Radio Frequency |
| RSRP | Reference Signal Received Power |
| RSS | Received Signal Strength |
| RU | Radio Unit |
| SINR | Signal-to-Interference-plus-Noise Ratio |
| UCCF | User-Centric Cell-Free |
| UE | User Equipment |
| ZF | Zero-Forcing |
References
- Akyildiz, I.F.; Kak, A.; Nie, S. 6G and Beyond: The Future of Wireless Communications Systems. IEEE Access 2020, 8, 133995–134030. [Google Scholar] [CrossRef]
- Xu, Y.; Gui, G.; Gacanin, H.; Adachi, F. A Survey on Resource Allocation for 5G Heterogeneous Networks: Current Research, Future Trends, and Challenges. IEEE Commun. Surv. Tutor. 2021, 23, 668–695. [Google Scholar] [CrossRef]
- Tugfe Demir, Ö.; Björnson, E.; Sanguinetti, L. Foundations of User-Centric Cell-Free Massive MIMO. Found. Trends® Signal Process. 2021, 14, 162–472. [Google Scholar] [CrossRef]
- Buzzi, S.; D’Andrea, C. Cell-Free Massive MIMO: User-Centric Approach. IEEE Wirel. Commun. Lett. 2017, 6, 706–709. [Google Scholar] [CrossRef]
- Ranjbar, V.; Girycki, A.; Rahman, M.A.; Pollin, S.; Moonen, M.; Vinogradov, E. Cell-Free mMIMO Support in the O-RAN Architecture: A PHY Layer Perspective for 5G and Beyond Networks. IEEE Commun. Stand. Mag. 2022, 6, 28–34. [Google Scholar] [CrossRef]
- Ammar, H.A.; Adve, R.; Shahbazpanahi, S.; Boudreau, G.; Srinivas, K.V. User-Centric Cell-Free Massive MIMO Networks: A Survey of Opportunities, Challenges and Solutions. IEEE Commun. Surv. Tutor. 2022, 24, 611–652. [Google Scholar] [CrossRef]
- Ngo, H.Q.; Ashikhmin, A.; Yang, H.; Larsson, E.G.; Marzetta, T.L. Cell-Free Massive MIMO: Uniformly great service for everyone. In Proceedings of the 2015 IEEE 16th International Workshop on Signal Processing Advances in Wireless Communications (SPAWC), Stockholm, Sweden, 28 June–1 July 2015; pp. 201–205. [Google Scholar] [CrossRef]
- Björnson, E.; Sanguinetti, L. Scalable Cell-Free Massive MIMO Systems. IEEE Trans. Commun. 2020, 68, 4247–4261. [Google Scholar] [CrossRef]
- Femenias, G.; Lassoued, N.; Riera-Palou, F. Access Point Switch ON/OFF Strategies for Green Cell-Free Massive MIMO Networking. IEEE Access 2020, 8, 21788–21803. [Google Scholar] [CrossRef]
- Ammar, H.A.; Adve, R.; Shahbazpanahi, S.; Boudreau, G.; Srinivas, K.V. Downlink Resource Allocation in Multiuser Cell-Free MIMO Networks With User-Centric Clustering. IEEE Trans. Wirel. Commun. 2022, 21, 1482–1497. [Google Scholar] [CrossRef]
- Zheng, J.; Zhang, J.; Björnson, E.; Li, Z.; Ai, B. Cell-Free Massive MIMO-OFDM for High-Speed Train Communications. IEEE J. Sel. Areas Commun. 2022, 40, 2823–2839. [Google Scholar] [CrossRef]
- Larsson, E.G.; Van Der Perre, L. Out-of-Band Radiation From Antenna Arrays Clarified. IEEE Wirel. Commun. Lett. 2018, 7, 610–613. [Google Scholar] [CrossRef]
- Kolomvakis, N.; Bavand, M.; Bahceci, I.; Gustavsson, U. A Distortion Nullforming Precoder in Massive MIMO Systems With Nonlinear Hardware. IEEE Wirel. Commun. Lett. 2022, 11, 1775–1779. [Google Scholar] [CrossRef]
- Mokhtari, Z.; Dinis, R. Sum-Rate of Cell Free Massive MIMO Systems With Power Amplifier Non-Linearity. IEEE Access 2021, 9, 141927–141937. [Google Scholar] [CrossRef]
- Hoffmann, M.; Kryszkiewicz, P. Reinforcement Learning for Energy-Efficient 5G Massive MIMO: Intelligent Antenna Switching. IEEE Access 2021, 9, 130329–130339. [Google Scholar] [CrossRef]
- Sohrabi, F.; Yu, W. Hybrid Digital and Analog Beamforming Design for Large-Scale Antenna Arrays. IEEE J. Sel. Top. Signal Process. 2016, 10, 501–513. [Google Scholar] [CrossRef]
- Hanzaz, Z.; Schotten, H.D. Analysis of effective SINR mapping models for MIMO OFDM in LTE system. In Proceedings of the 2013 9th International Wireless Communications and Mobile Computing Conference (IWCMC), Sardinia, Italy, 1–5 July 2013; pp. 1509–1515. [Google Scholar] [CrossRef]
- Kryszkiewicz, P. Efficiency Maximization for Battery-Powered OFDM Transmitter via Amplifier Operating Point Adjustment. Sensors 2023, 23, 474. [Google Scholar] [CrossRef]
- Azolini Tavares, C.H.; Marinello Filho, J.C.; Panazio, C.M.; Abrão, T. Input Back-Off Optimization in OFDM Systems Under Ideal Pre-Distorters. IEEE Wirel. Commun. Lett. 2016, 5, 464–467. [Google Scholar] [CrossRef]
- Riera-Palou, F.; Femenias, G.; Lopez-Perez, D.; Piovesan, N.; De Domenico, A. Sleep Mode Strategies for Energy Efficient Cell-Free Massive MIMO in 5G Deployments. In Proceedings of the 2023 IEEE International Conference on Communications Workshops (ICC Workshops), Rome, Italy, 28 May–1 June 2023; pp. 618–624. [Google Scholar] [CrossRef]
- Ito, M.; Kanno, I.; Amano, Y.; Kishi, Y.; Chen, W.Y.; Choi, T.; Molisch, A.F. Joint AP On/Off and User-Centric Clustering for Energy-Efficient Cell-Free Massive MIMO Systems. In Proceedings of the 2022 IEEE 96th Vehicular Technology Conference (VTC2022-Fall), London, UK, 26–29 September 2022; pp. 1–5. [Google Scholar] [CrossRef]
- Yoo, T.; Goldsmith, A. On the optimality of multiantenna broadcast scheduling using zero-forcing beamforming. IEEE J. Sel. Areas Commun. 2006, 24, 528–541. [Google Scholar] [CrossRef]
- Dahlman, E.; Parkvall, S.; Skold, J. 5G NR: The Next Generation Wireless Access Technology, 1st ed.; Academic Press, Inc.: Cambridge, MA, USA, 2018. [Google Scholar]
- Bossy, B.; Kryszkiewicz, P.; Bogucka, H. Optimization of energy efficiency in the downlink LTE transmission. In Proceedings of the 2017 IEEE International Conference on Communications (ICC), Paris, France, 21–25 May 2017; pp. 1–6. [Google Scholar]
- Hanzaz, Z.; Schotten, H.D. Performance evaluation of Link to system interface for Long Term Evolution system. In Proceedings of the 2011 7th International Wireless Communications and Mobile Computing Conference, Istanbul, Turkey, 4–8 July 2011; pp. 2168–2173. [Google Scholar] [CrossRef]
- Mollén, C.; Gustavsson, U.; Eriksson, T.; Larsson, E.G. Spatial characteristics of distortion radiated from antenna arrays with transceiver nonlinearities. IEEE Trans. Wirel. Commun. 2018, 17, 6663–6679. [Google Scholar] [CrossRef]
- 3GPP. NR; Physical channels and modulation (Release 18). TS 38.211 v.18.0.0, 3GPP. 2023. Available online: https://portal.3gpp.org/desktopmodules/Specifications/SpecificationDetails.aspx?specificationId=3213 (accessed on 17 January 2024).
- METIS. Mobile and wireless communications Enablers for the Twenty-twenty Information. In Deliverable D6.1, Simulation Guidelines v1.0; 2013; Available online: https://cordis.europa.eu/docs/projects/cnect/9/317669/080/deliverables/001-METISD61v1pdf.pdf (accessed on 17 January 2024).


| MCS | (bit/Hz) | Required EESM (dB) | |||
|---|---|---|---|---|---|
| 1 | 0.15 | 4.73 | −6.3 | 0.19 | 0.04 |
| 2 | 0.23 | 2.48 | −4.5 | 0.31 | 0.05 |
| 3 | 0.38 | 1.13 | −2.8 | 0.47 | 0.05 |
| 4 | 0.6 | 1.52 | −0.9 | 0.74 | 0.07 |
| 5 | 0.88 | 1.55 | 1.1 | 1.17 | 0.09 |
| 6 | 1.18 | 1.58 | 3.1 | 1.85 | 0.14 |
| 7 | 1.48 | 3.79 | 5.3 | 3.06 | 0.23 |
| 8 | 1.91 | 4.61 | 6.9 | 4.5 | 0.28 |
| 9 | 2.41 | 5.92 | 8.9 | 7.25 | 0.46 |
| 10 | 2.73 | 11.5 | 10.6 | 10.8 | 0.63 |
| 11 | 3.32 | 16.3 | 12.5 | 16.7 | 0.91 |
| 12 | 3.9 | 21.6 | 14.4 | 25.7 | 1.36 |
| 13 | 4.52 | 28.6 | 16.2 | 38.3 | 2.5 |
| 14 | 5.11 | 31.2 | 18.1 | 59.2 | 3.6 |
| 15 | 5.55 | 34.5 | 20.1 | 95.9 | 5.4 |
| Parameter | Value |
|---|---|
| Center frequency f | 3.6 GHz |
| Number of RBs | 69 |
| Time slot duration | 0.5 ms |
| Subcarrier spacing | 30 kHz |
| Number of CU–DUs | 1 centralized and virtual |
| Number of RUs | 6 (1 macro-RU, 5 micro-RUs) |
| RU installation height | macro-RU: 45 m; micro-RUs: 6 m |
| Rapp PA model smoothing factor p | 12 |
| Transmit power | macro-RU: 46 dBm; micro-RUs: 30 dBm |
| Number of antennas | macro-RU: 128; micro-RUs: 32 |
| Threshold of correlation coefficient | 0.7 |
| Maximum number of spatial layers | macro-RU: 32; micro-RUs: 8 |
| Wireless InSite configuration | 15 reflections, 1 diffraction |
Disclaimer/Publisher’s Note: The statements, opinions and data contained in all publications are solely those of the individual author(s) and contributor(s) and not of MDPI and/or the editor(s). MDPI and/or the editor(s) disclaim responsibility for any injury to people or property resulting from any ideas, methods, instructions or products referred to in the content. |
© 2024 by the authors. Licensee MDPI, Basel, Switzerland. This article is an open access article distributed under the terms and conditions of the Creative Commons Attribution (CC BY) license (https://creativecommons.org/licenses/by/4.0/).
Share and Cite
Hoffmann, M.; Kryszkiewicz, P. Evaluation of User-Centric Cell-Free Massive Multiple-Input Multiple-Output Networks Considering Realistic Channels and Frontend Nonlinear Distortion. Appl. Sci. 2024, 14, 1684. https://doi.org/10.3390/app14051684
Hoffmann M, Kryszkiewicz P. Evaluation of User-Centric Cell-Free Massive Multiple-Input Multiple-Output Networks Considering Realistic Channels and Frontend Nonlinear Distortion. Applied Sciences. 2024; 14(5):1684. https://doi.org/10.3390/app14051684
Chicago/Turabian StyleHoffmann, Marcin, and Paweł Kryszkiewicz. 2024. "Evaluation of User-Centric Cell-Free Massive Multiple-Input Multiple-Output Networks Considering Realistic Channels and Frontend Nonlinear Distortion" Applied Sciences 14, no. 5: 1684. https://doi.org/10.3390/app14051684
APA StyleHoffmann, M., & Kryszkiewicz, P. (2024). Evaluation of User-Centric Cell-Free Massive Multiple-Input Multiple-Output Networks Considering Realistic Channels and Frontend Nonlinear Distortion. Applied Sciences, 14(5), 1684. https://doi.org/10.3390/app14051684