
Study on the Microstructure and Permeability Characteristics of Tailings Based on CT Scanning Technology


Abstract
1. Introduction
2. Specimen Preparation and CT Image Acquisition
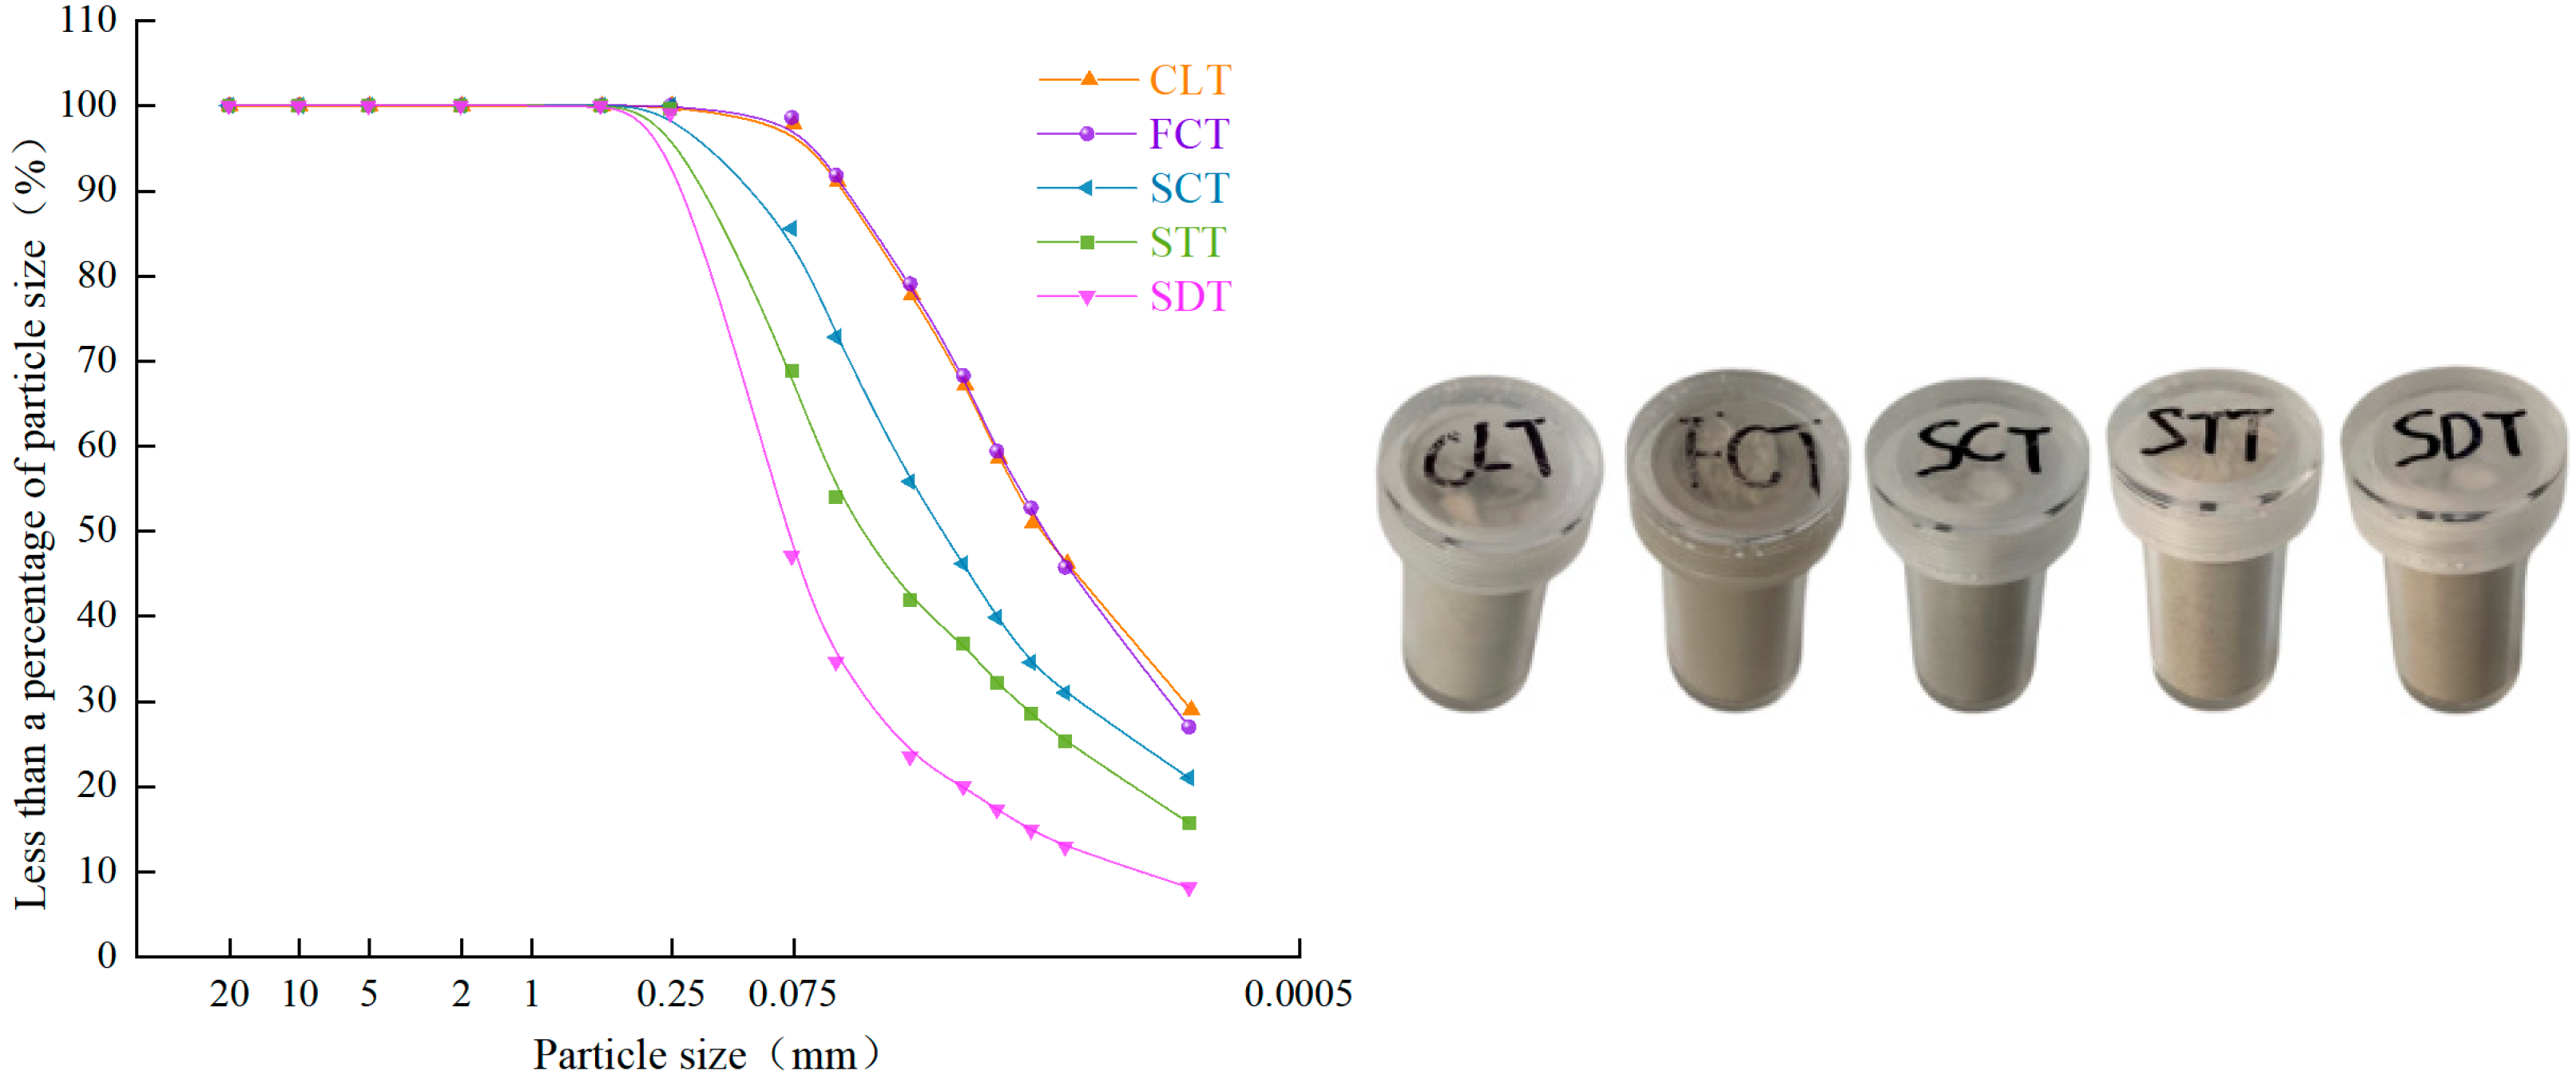
2.1. Specimen Preparation
2.2. Introduction to Micro-Ct Equipment and CT Image Acquisition
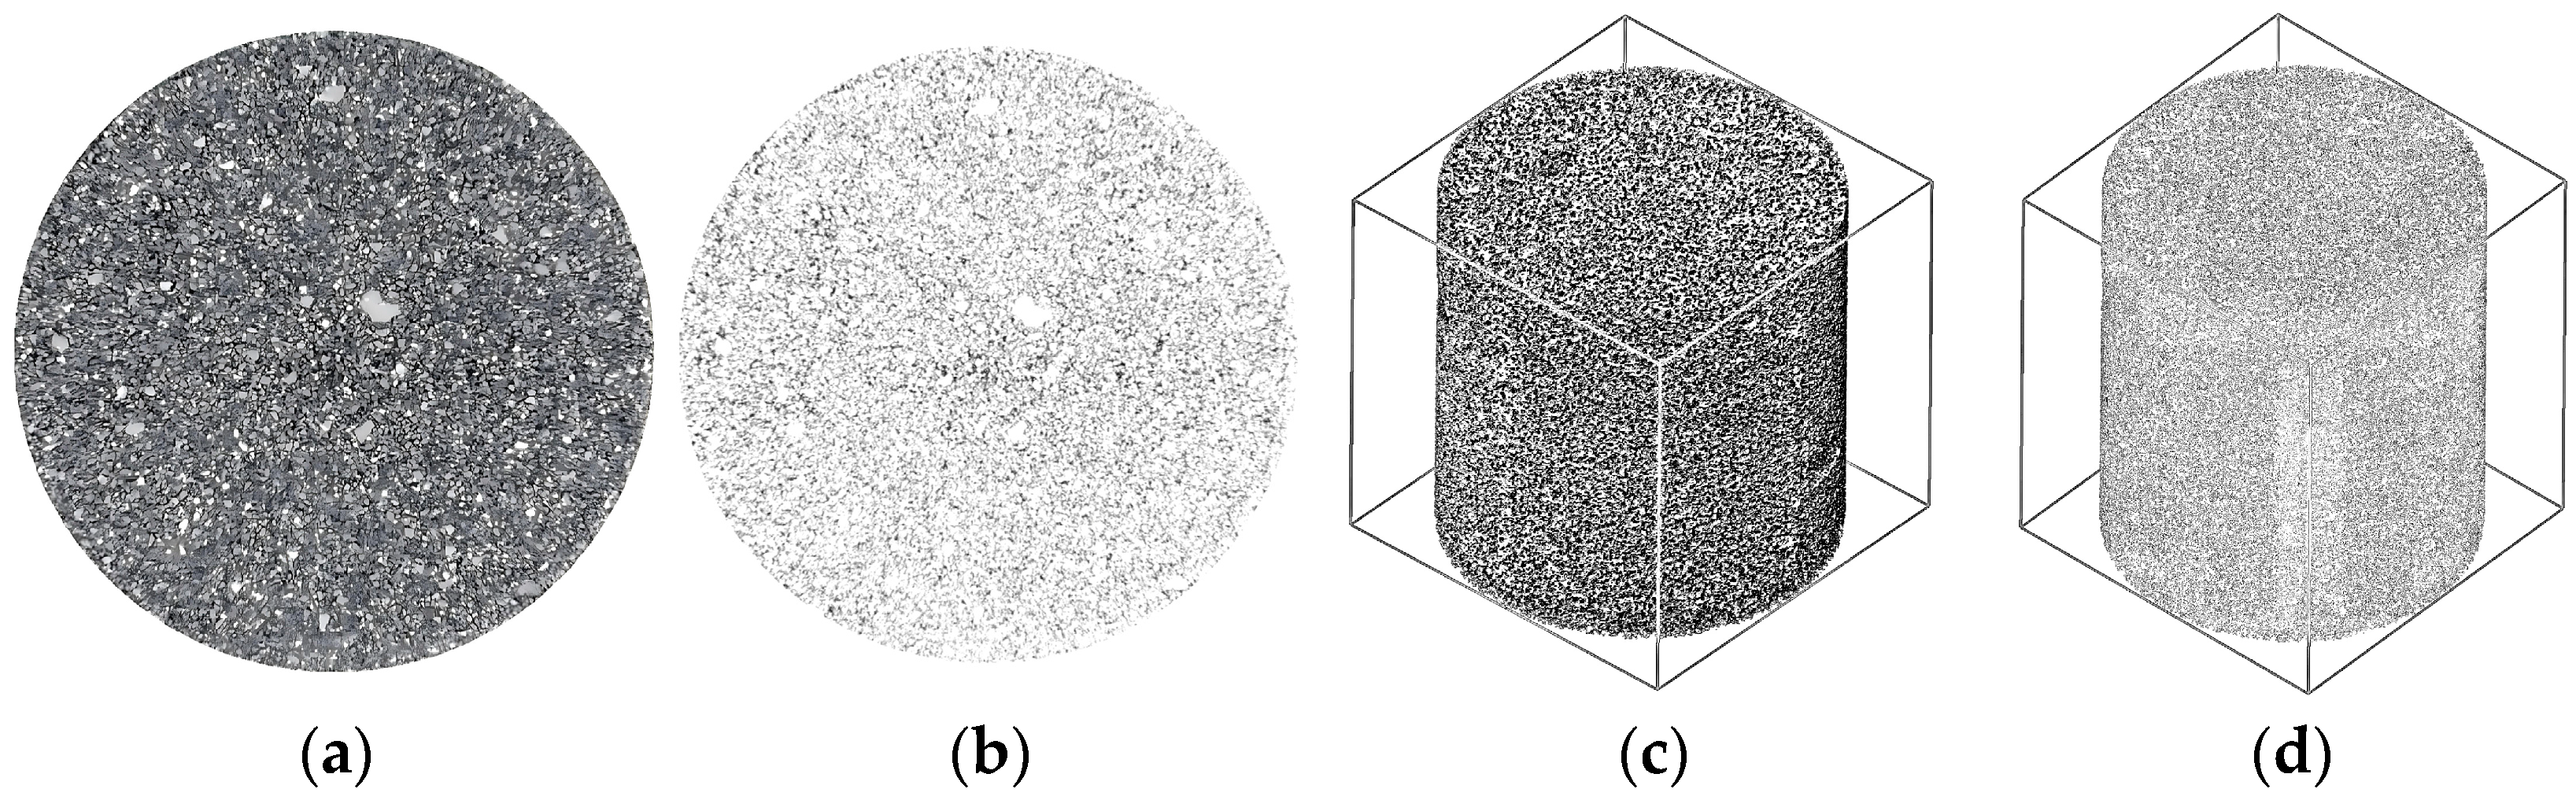
2.3. CT Image Processing and 3D Reconstruction
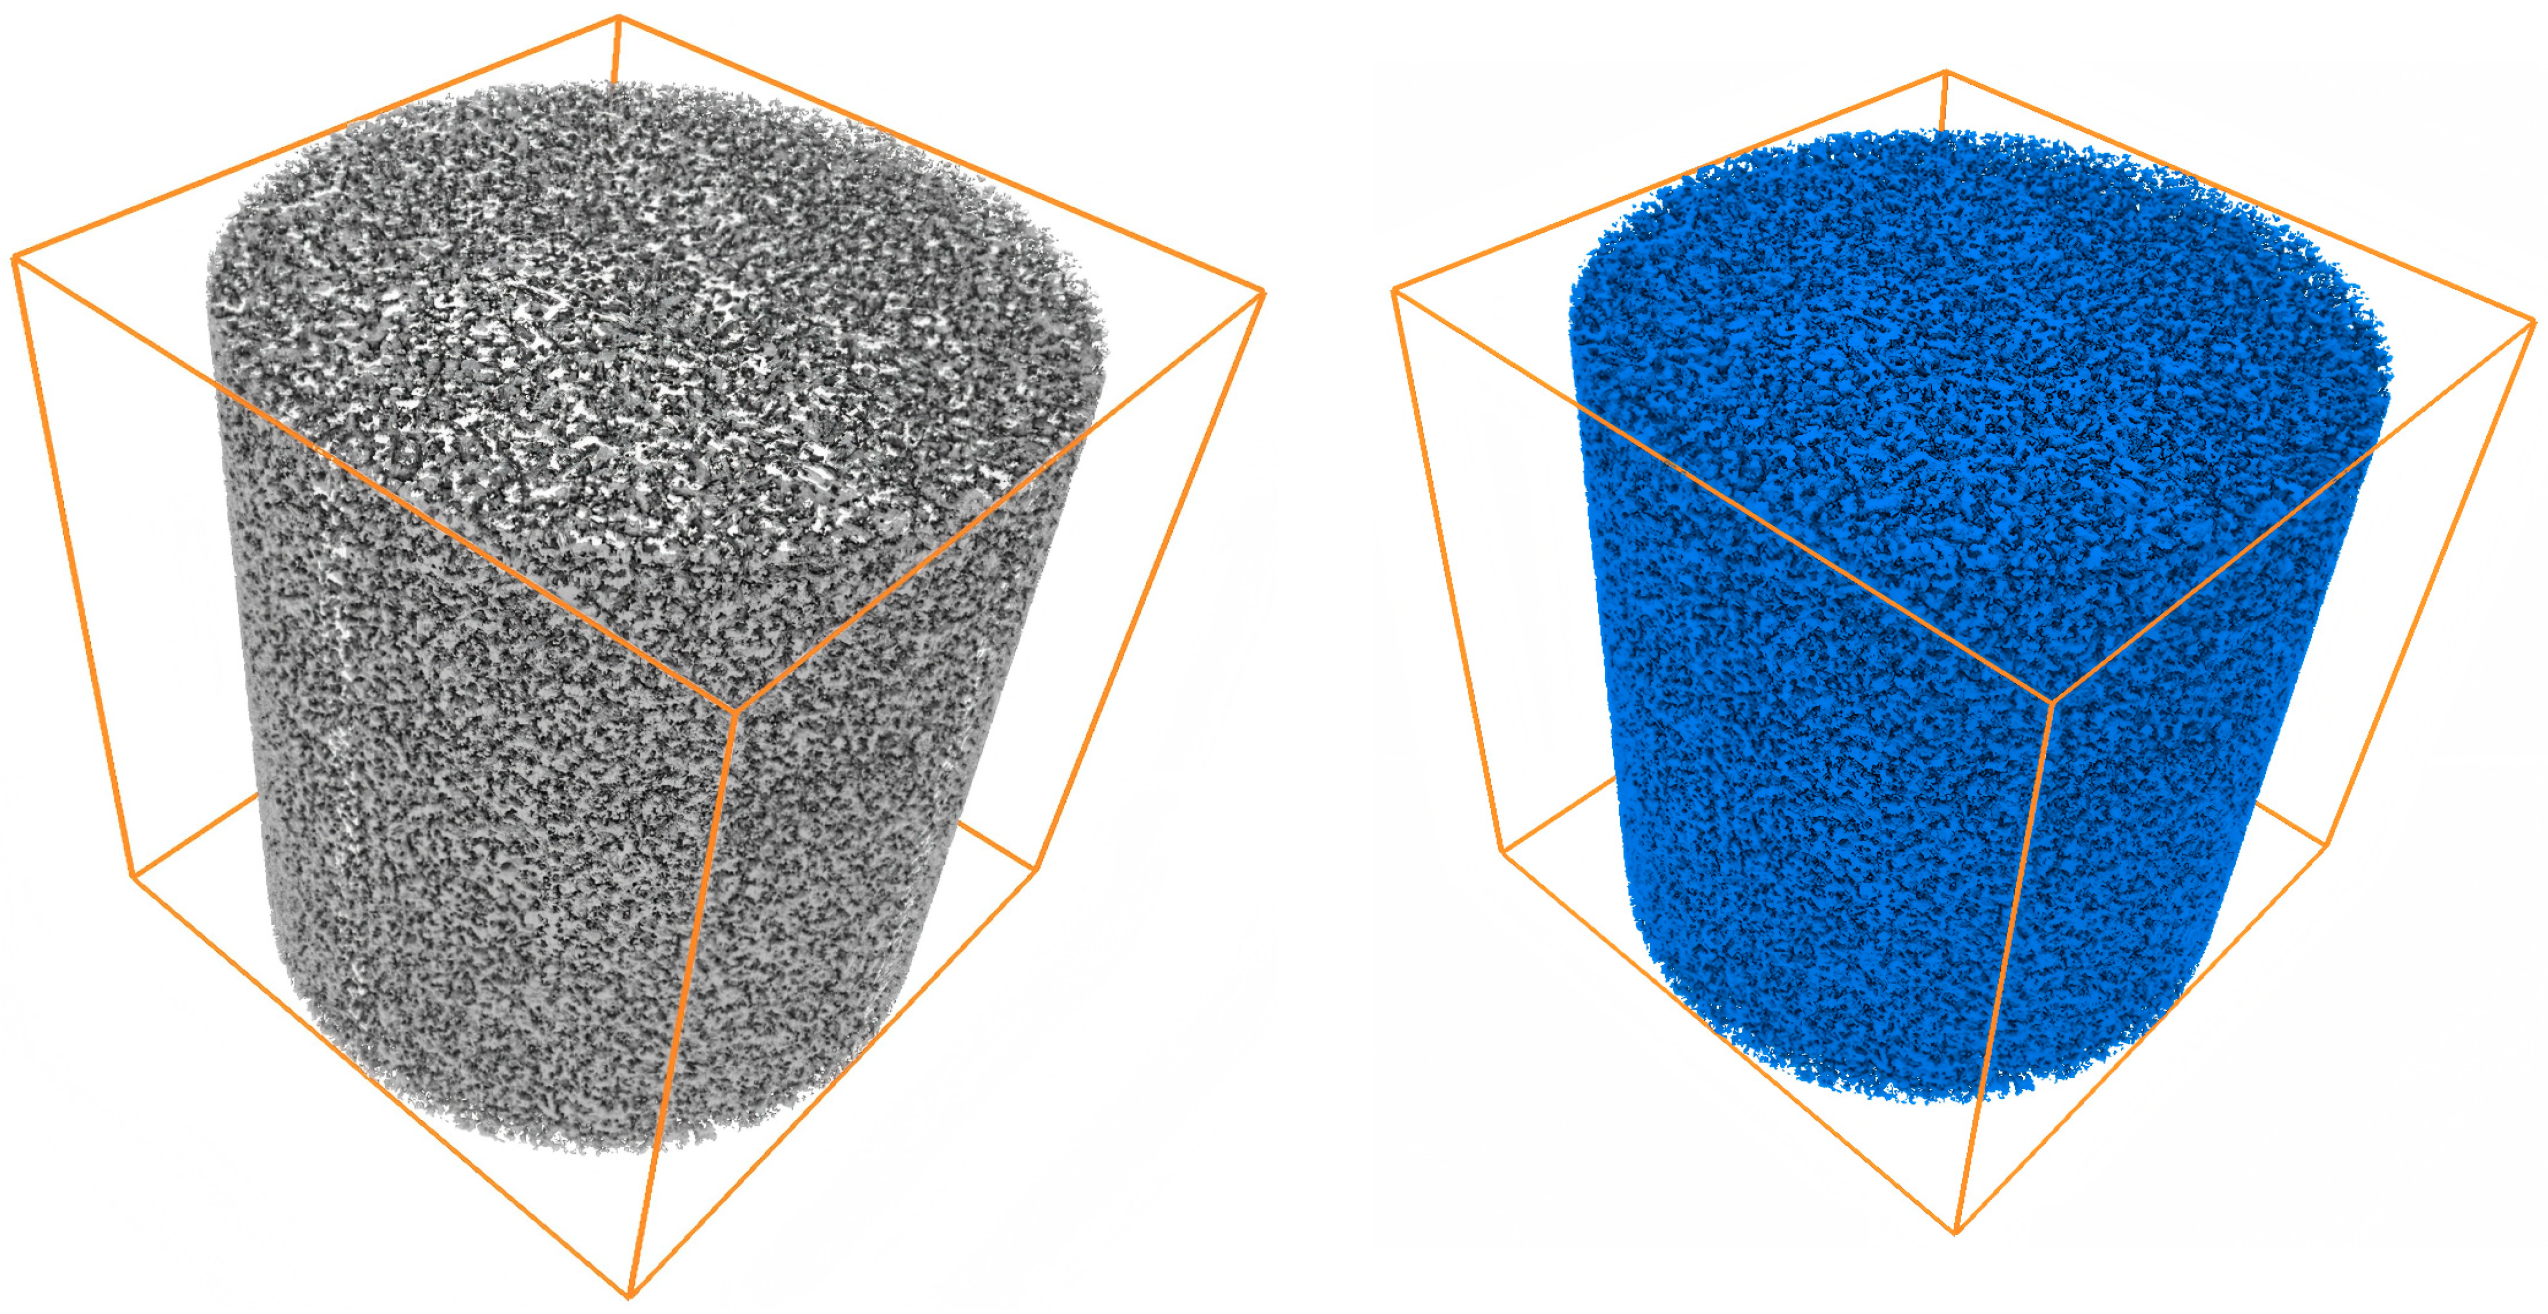
2.4. Three-Dimensional Rendering Model
3. Microscopic Characterization of Tailings Particles
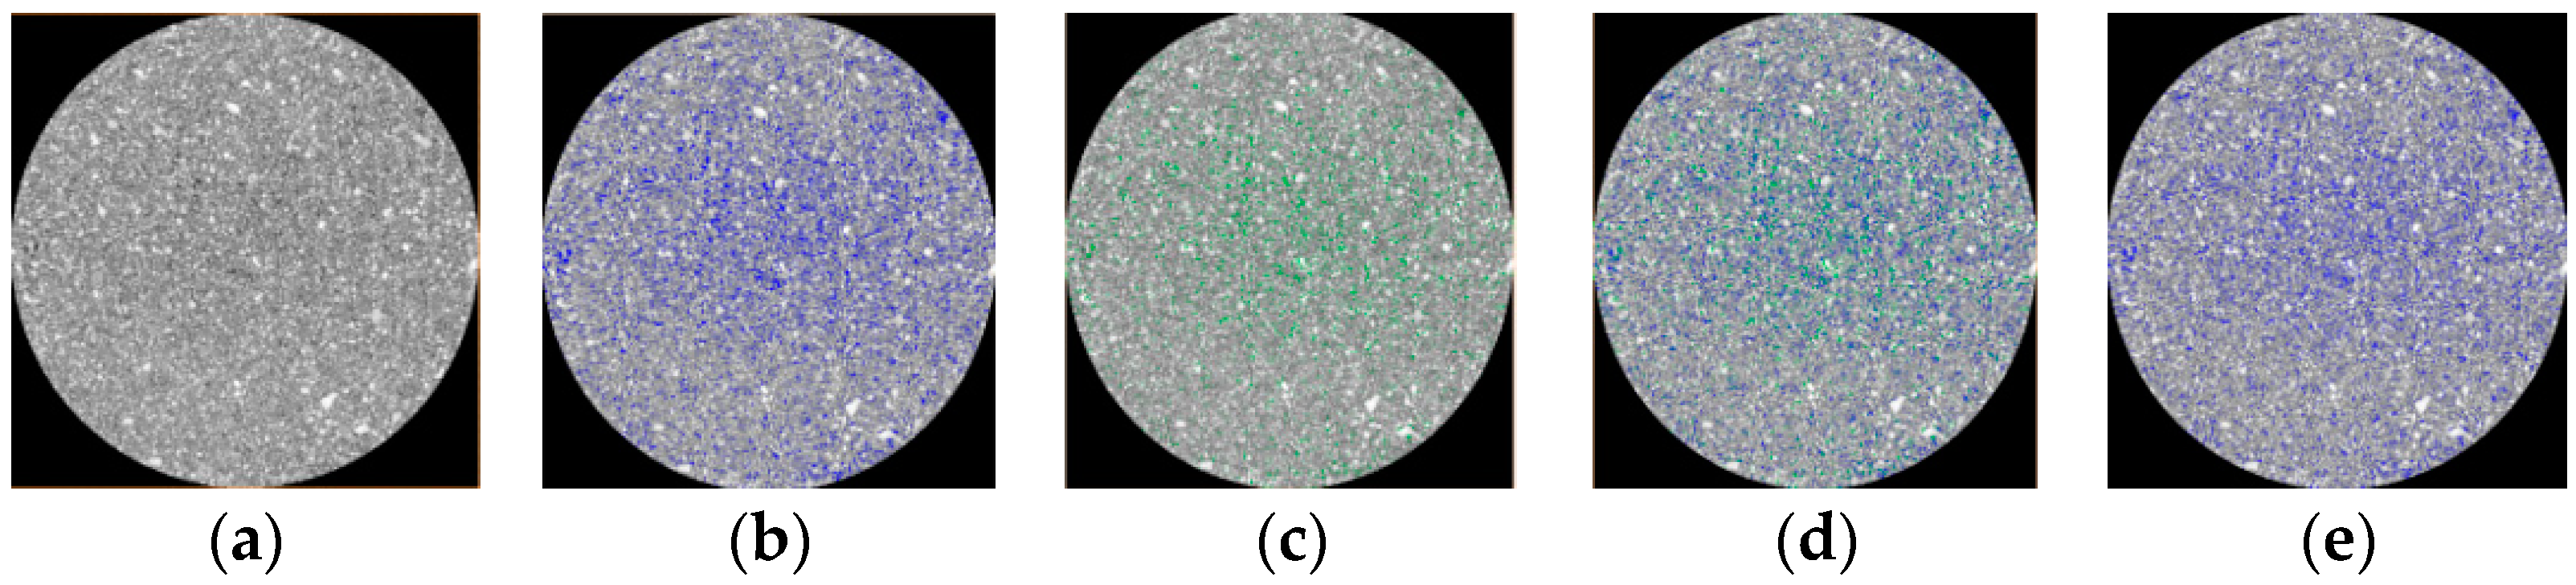
3.1. Pore Extraction
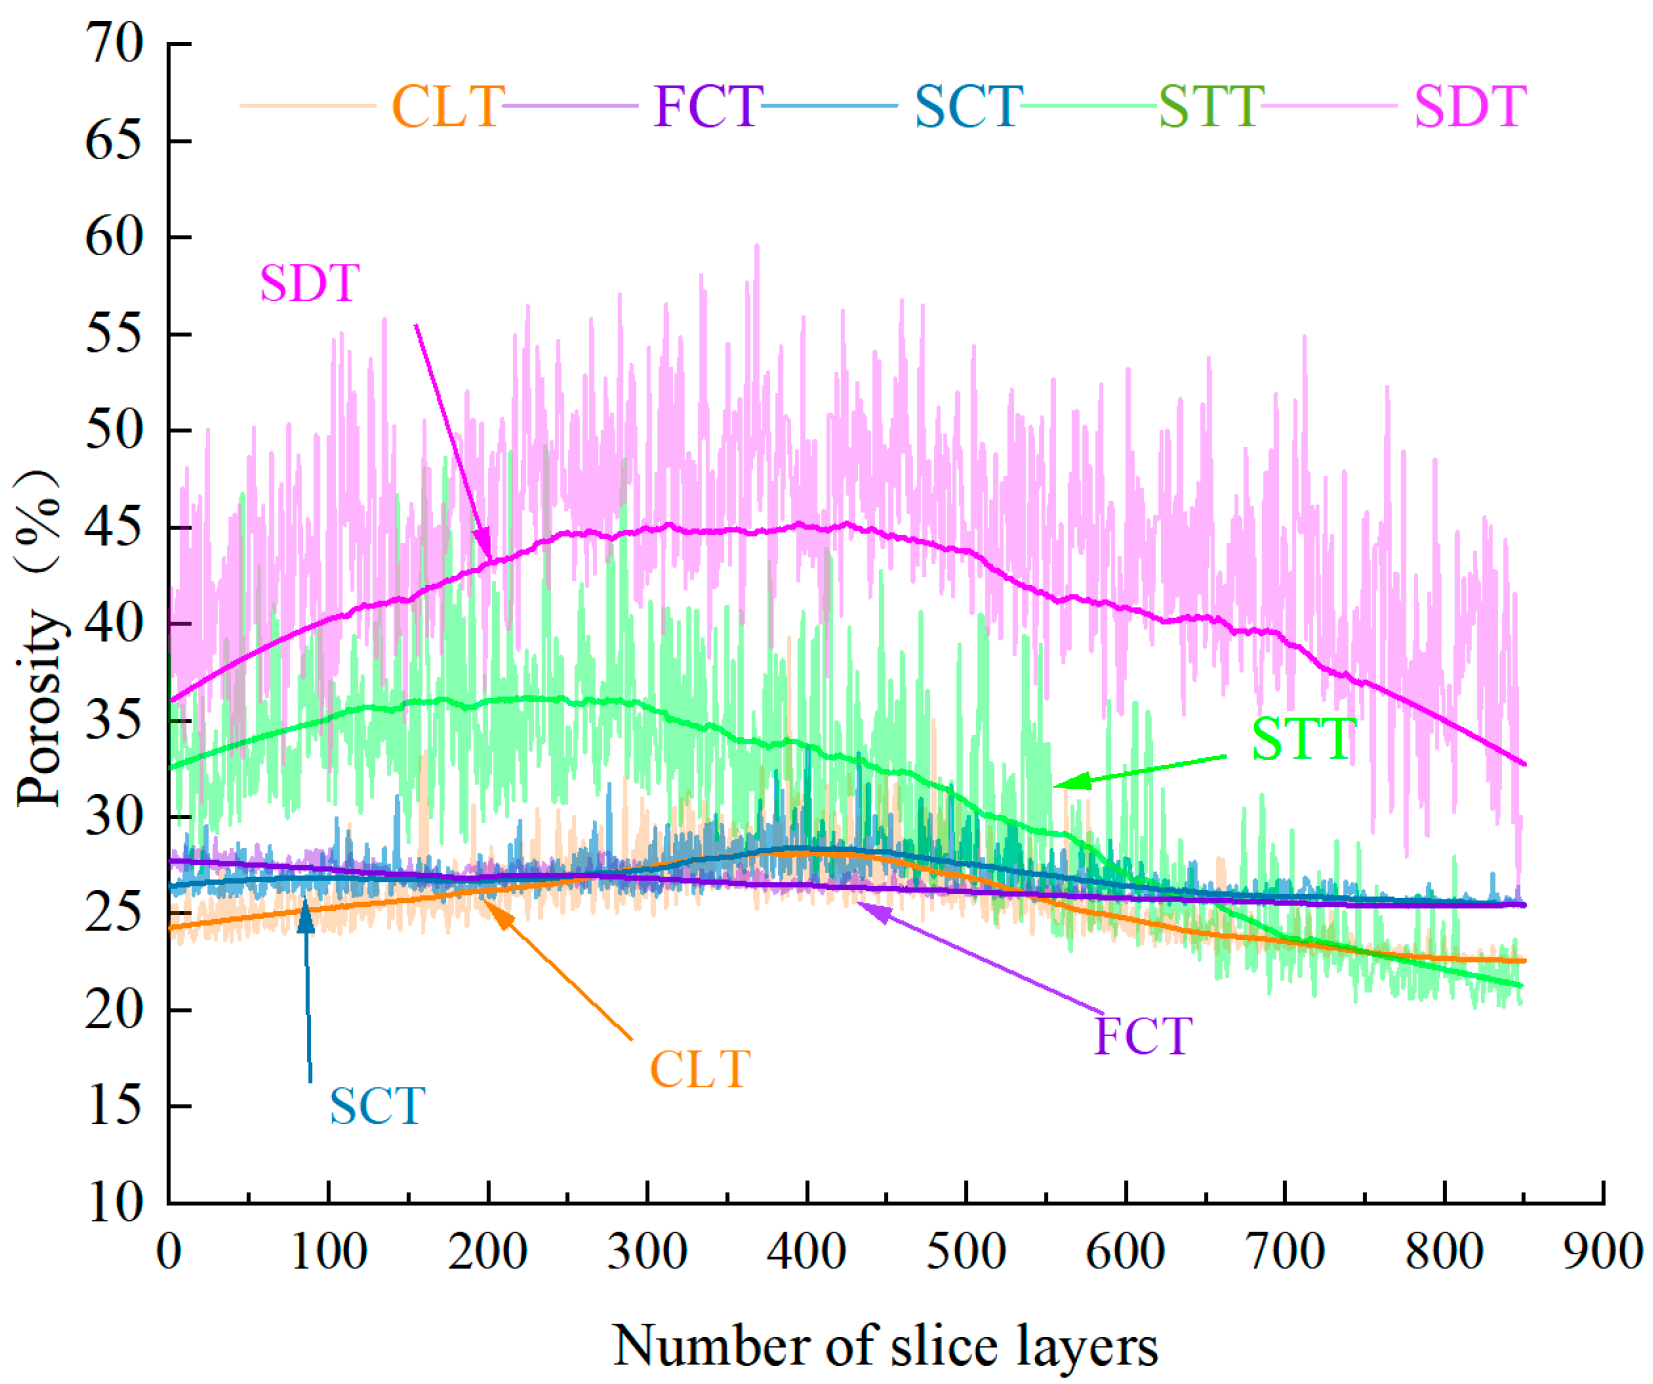
3.2. Layer-by-Layer Porosity
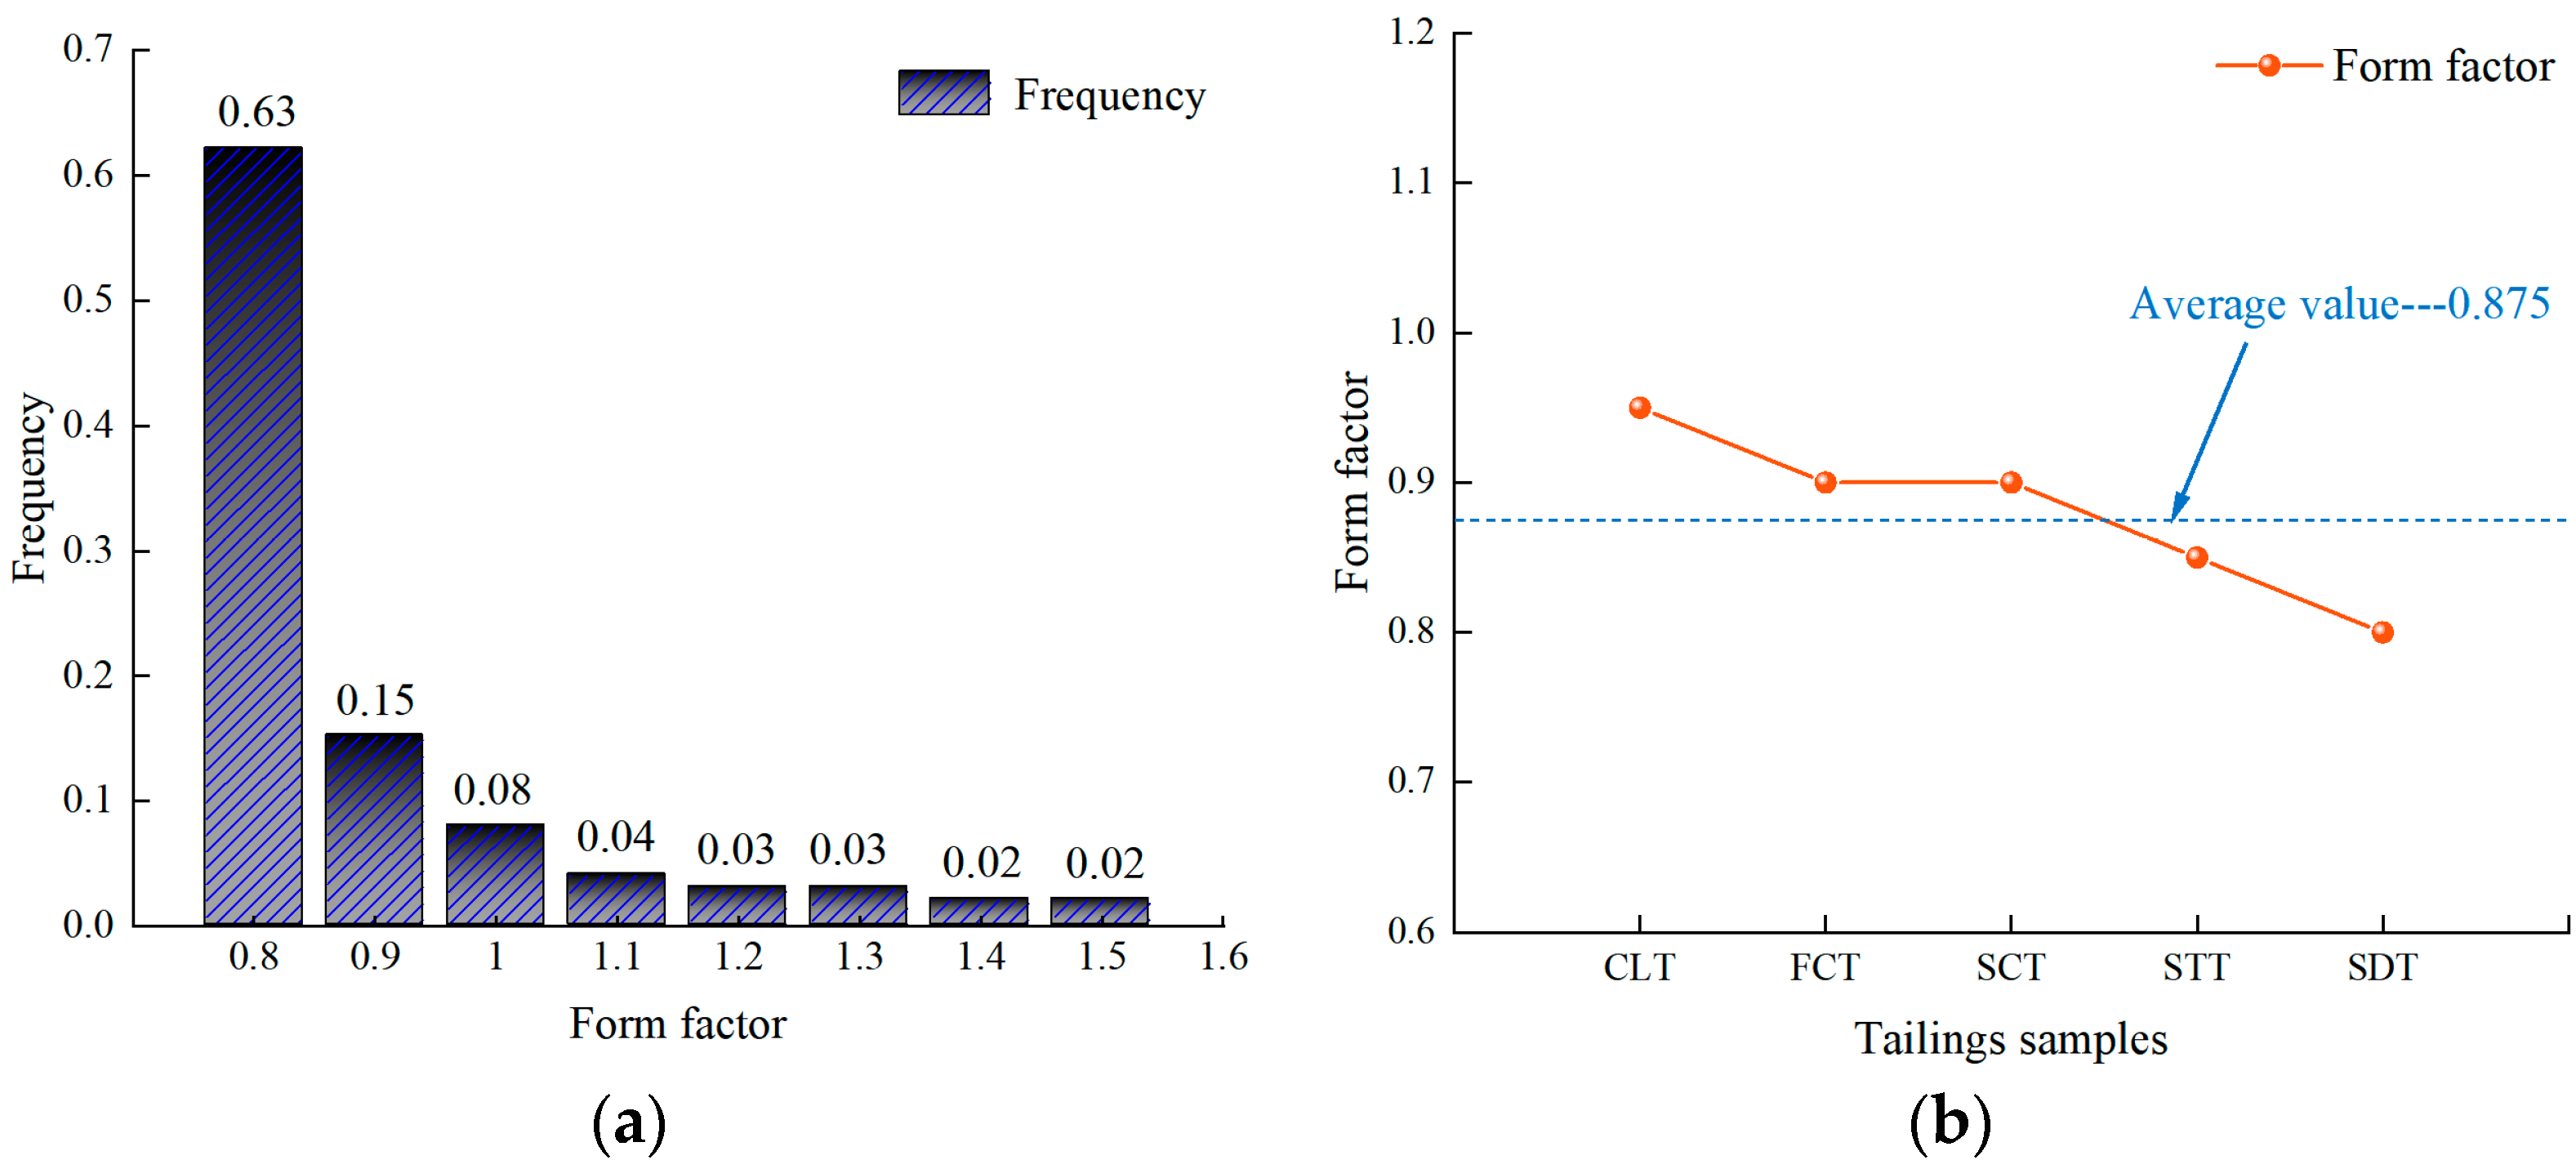
3.3. Microstructure Characterization
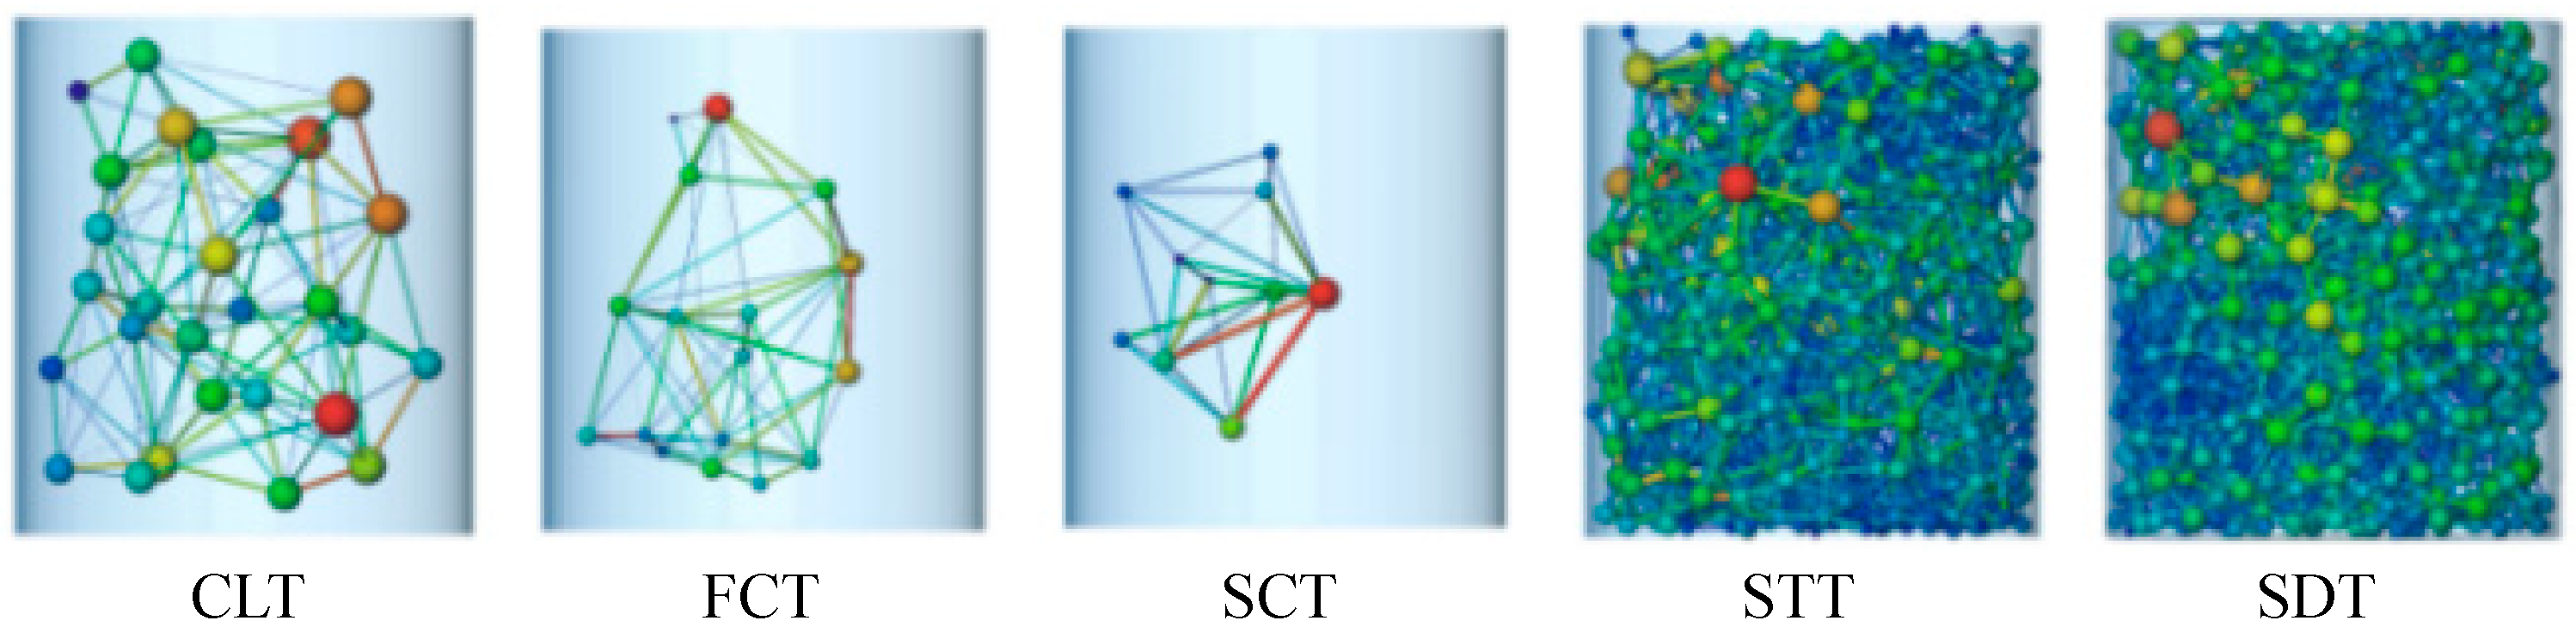
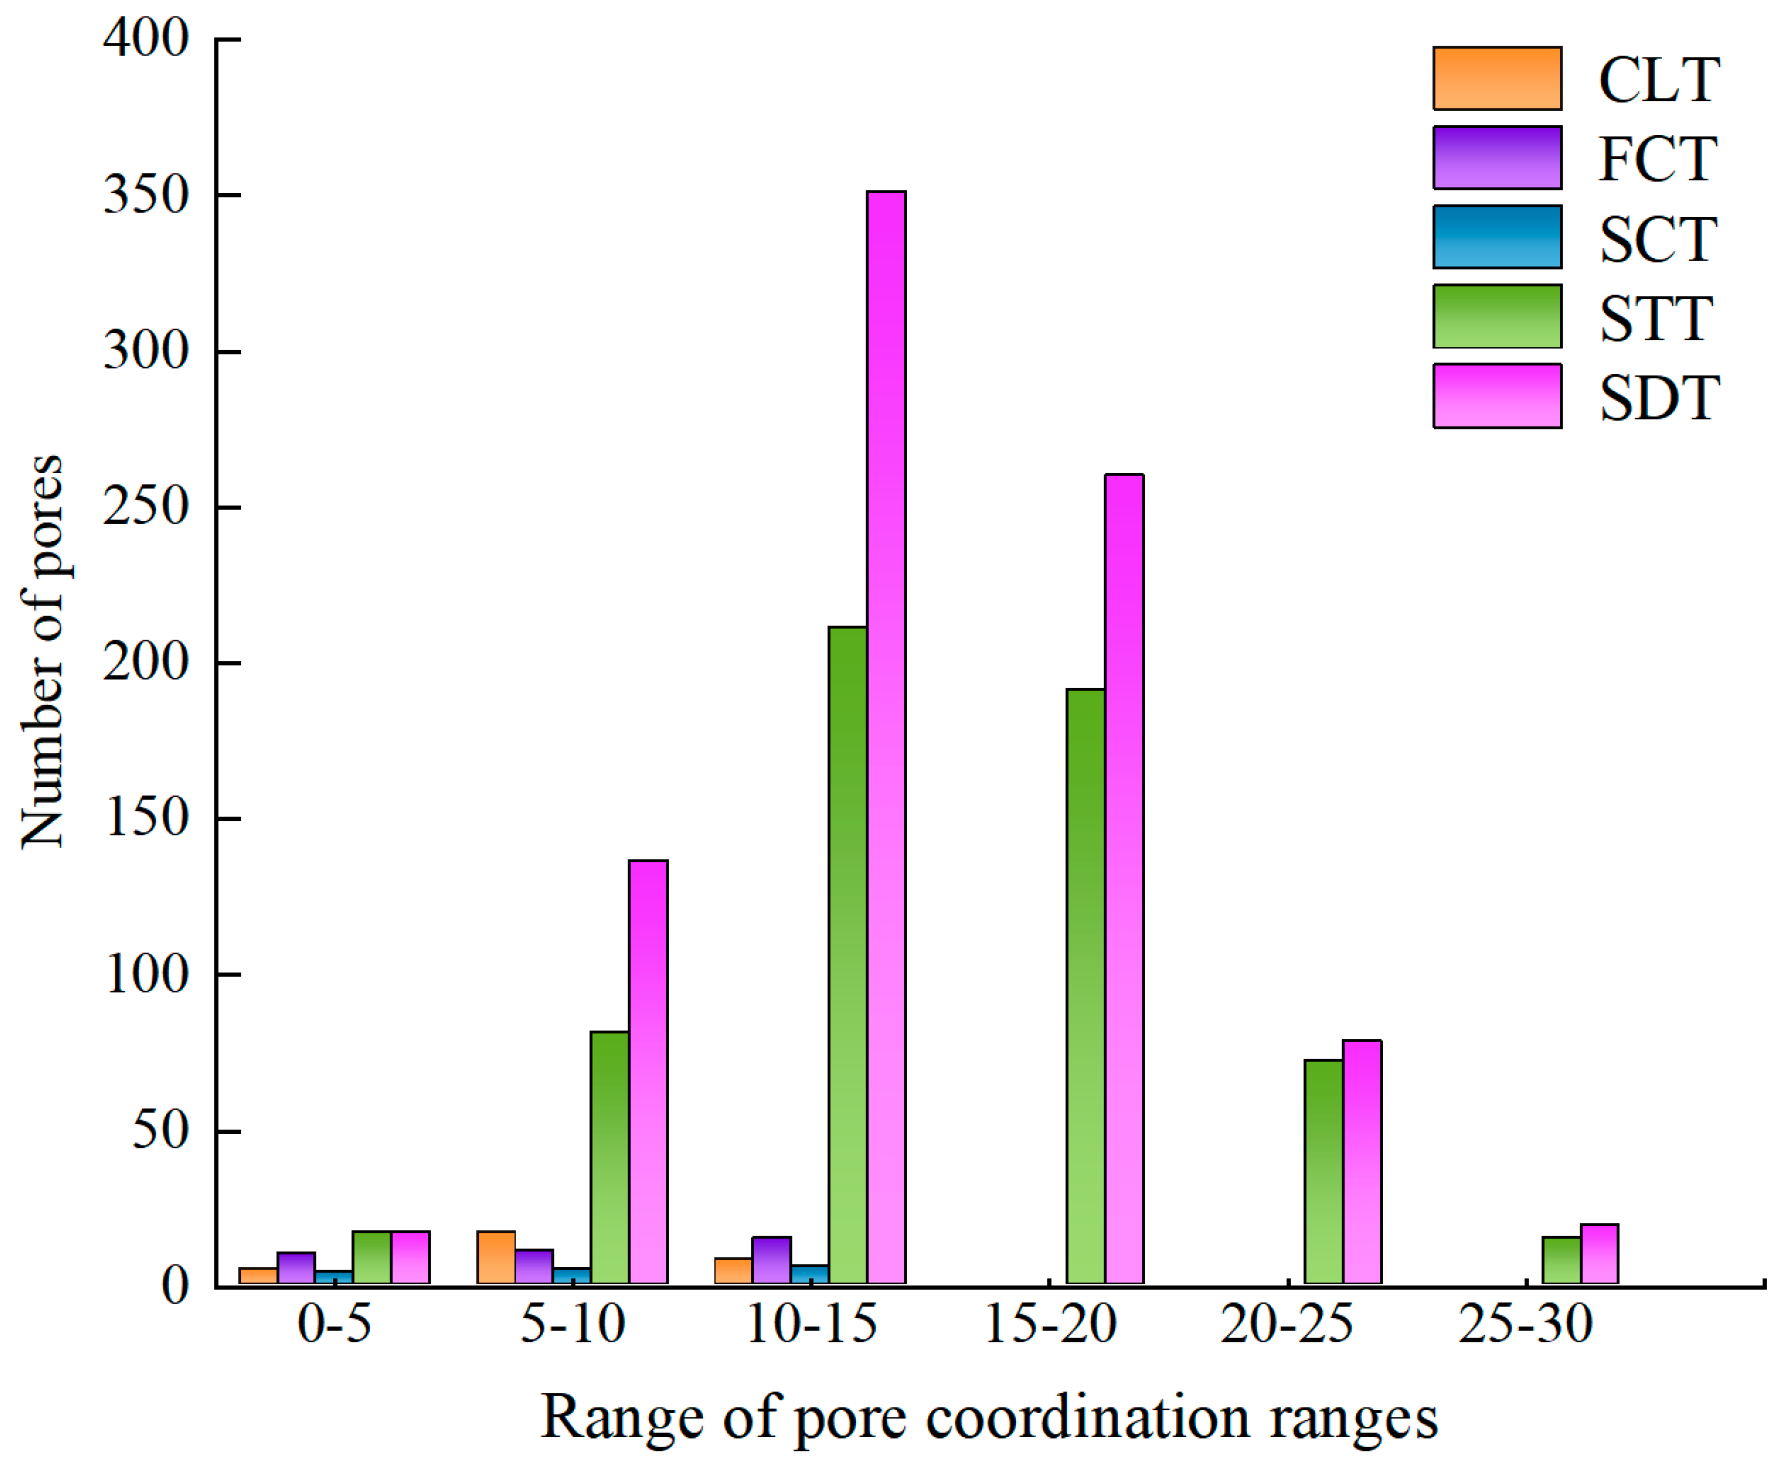
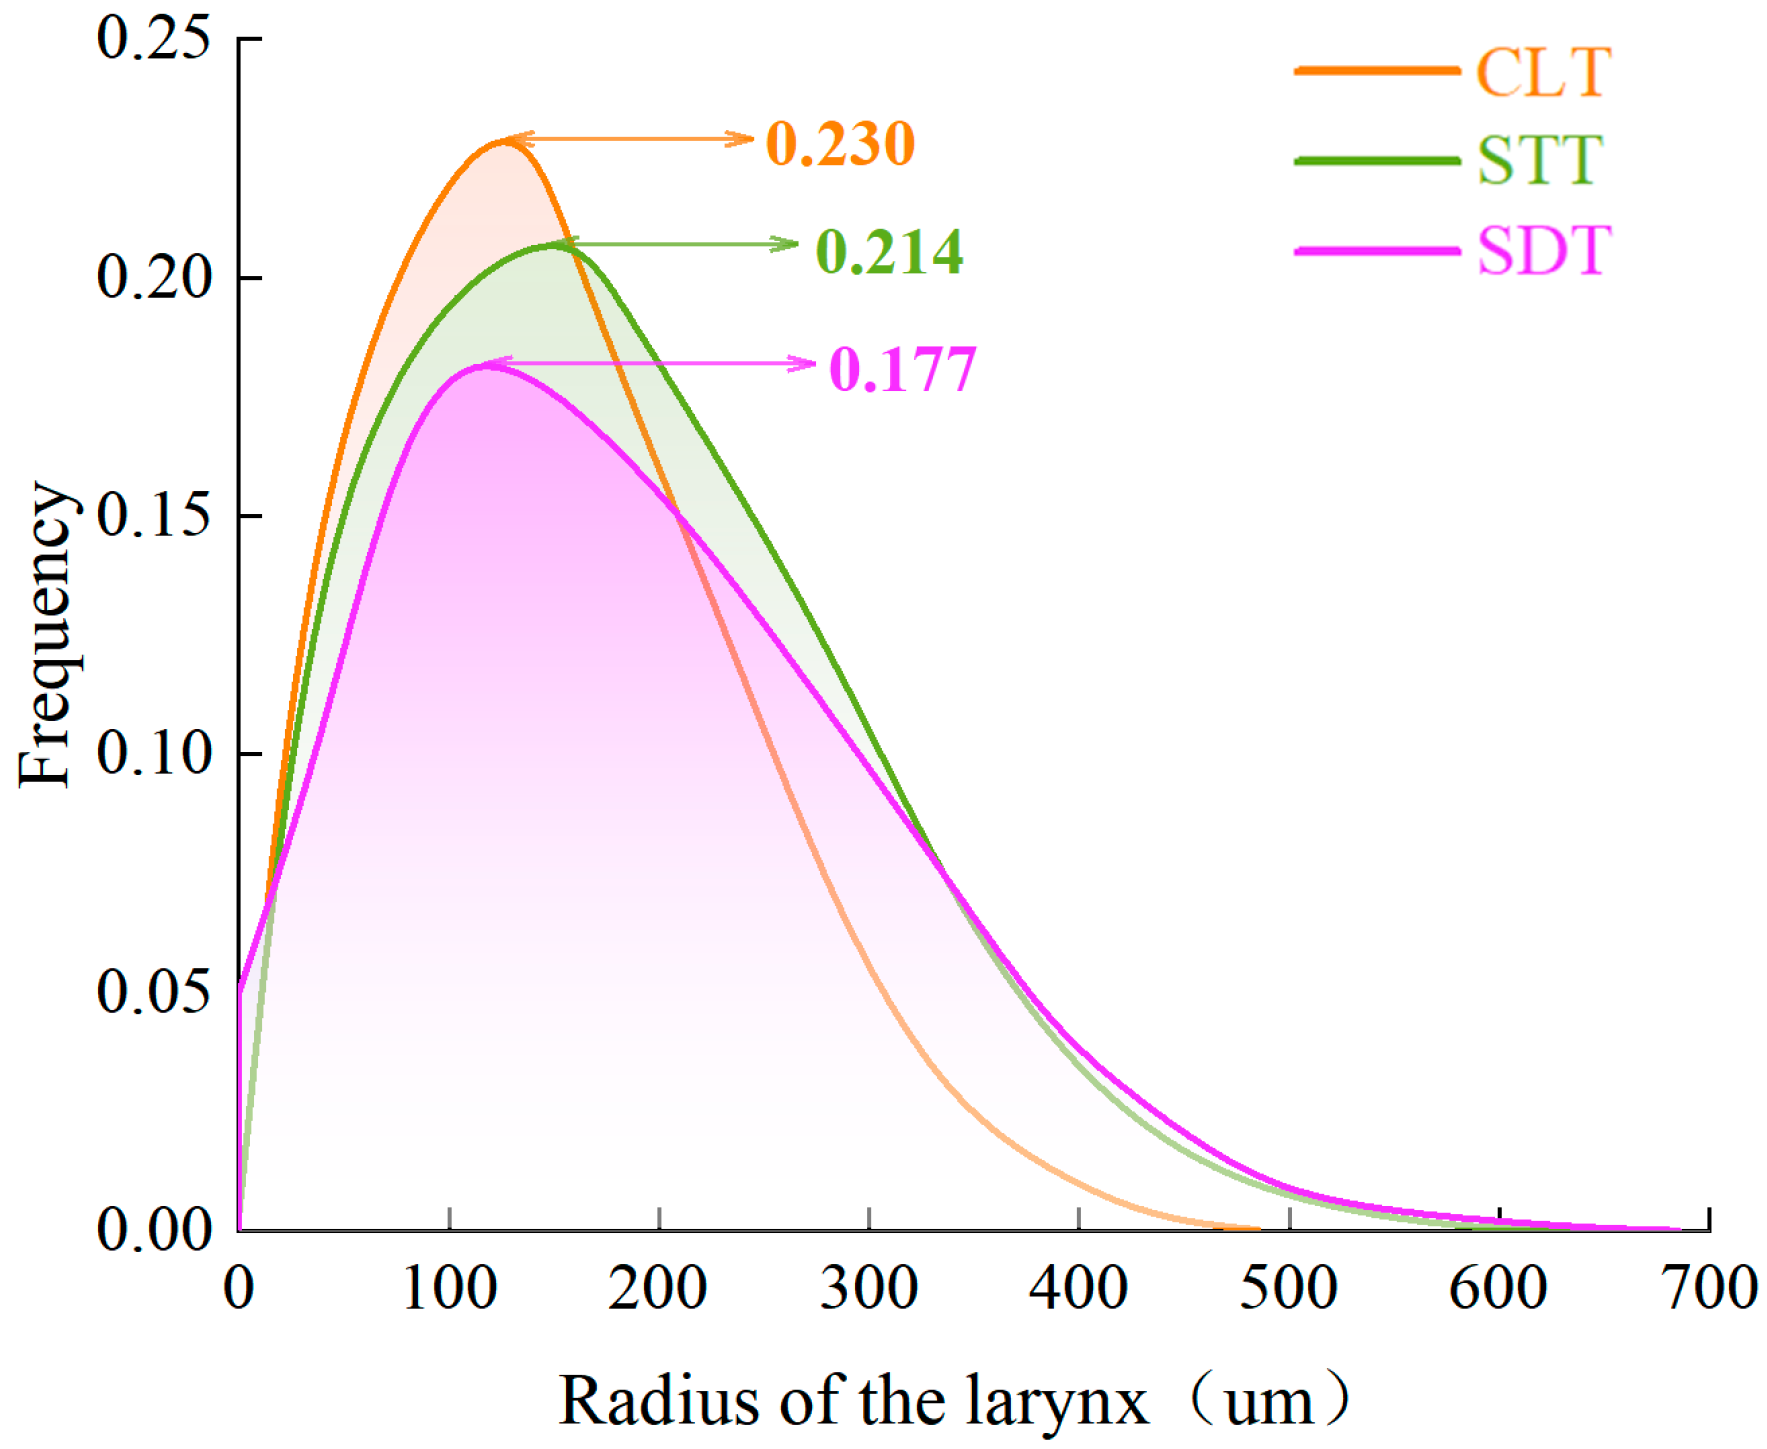
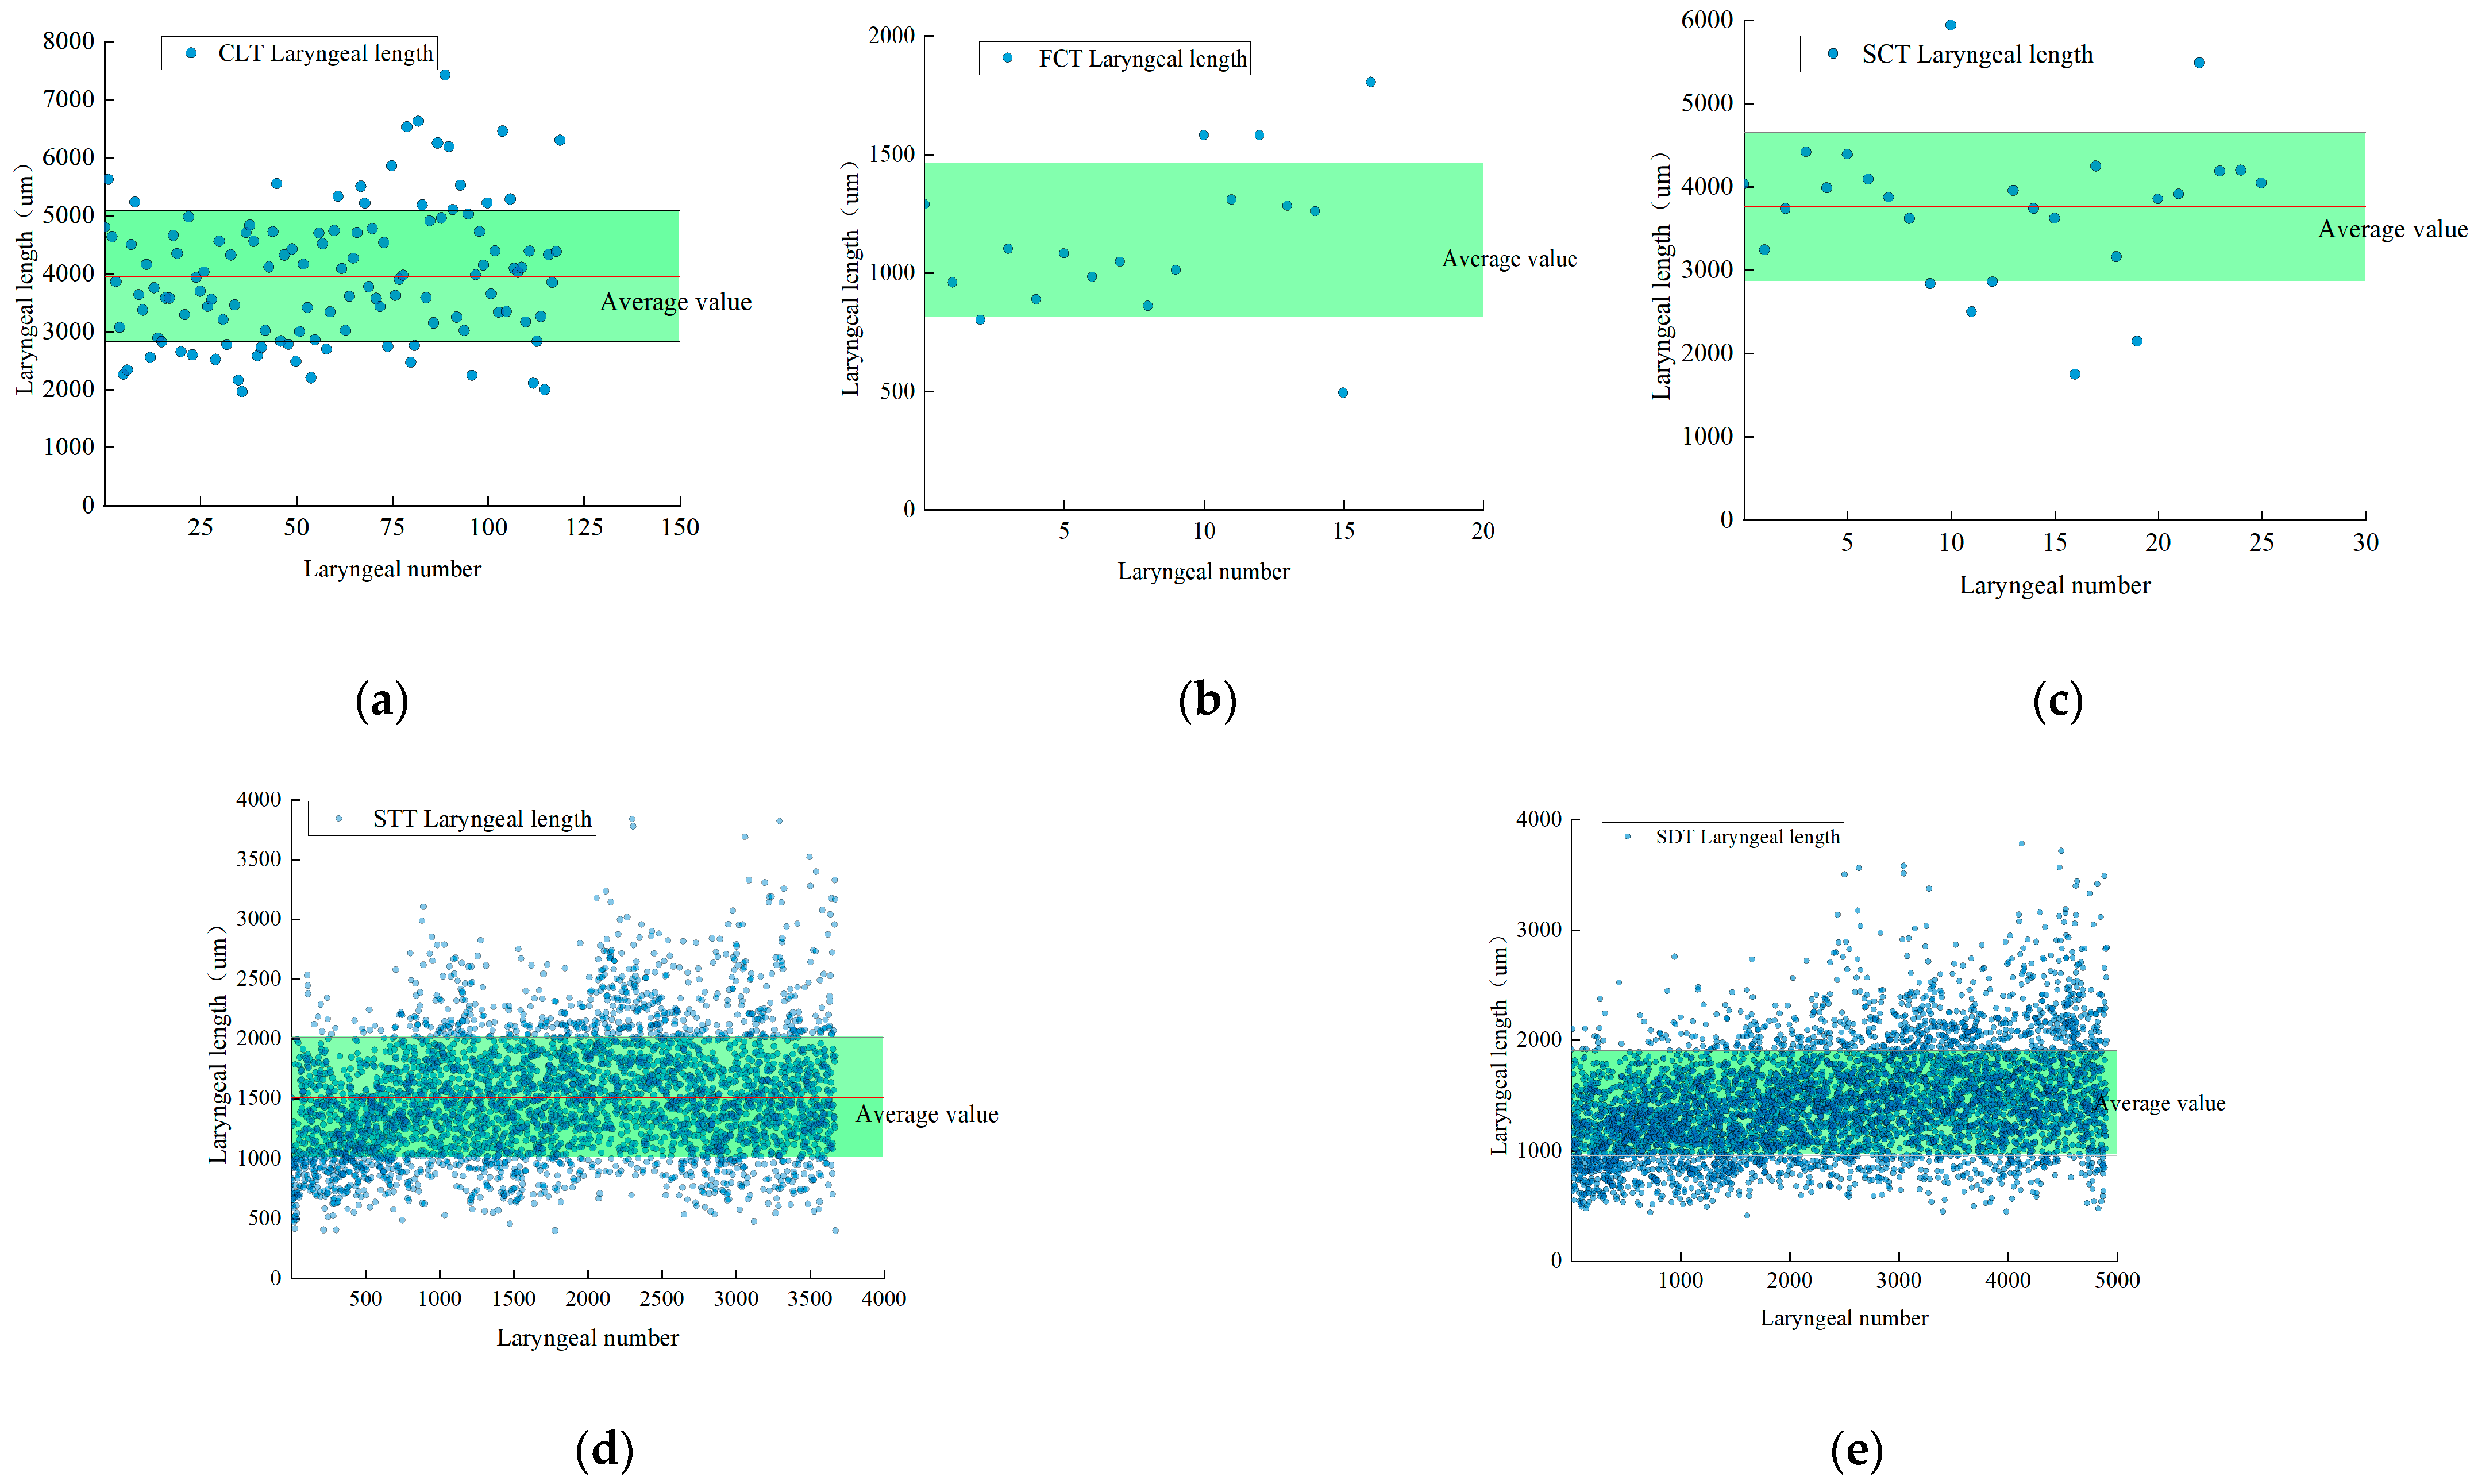
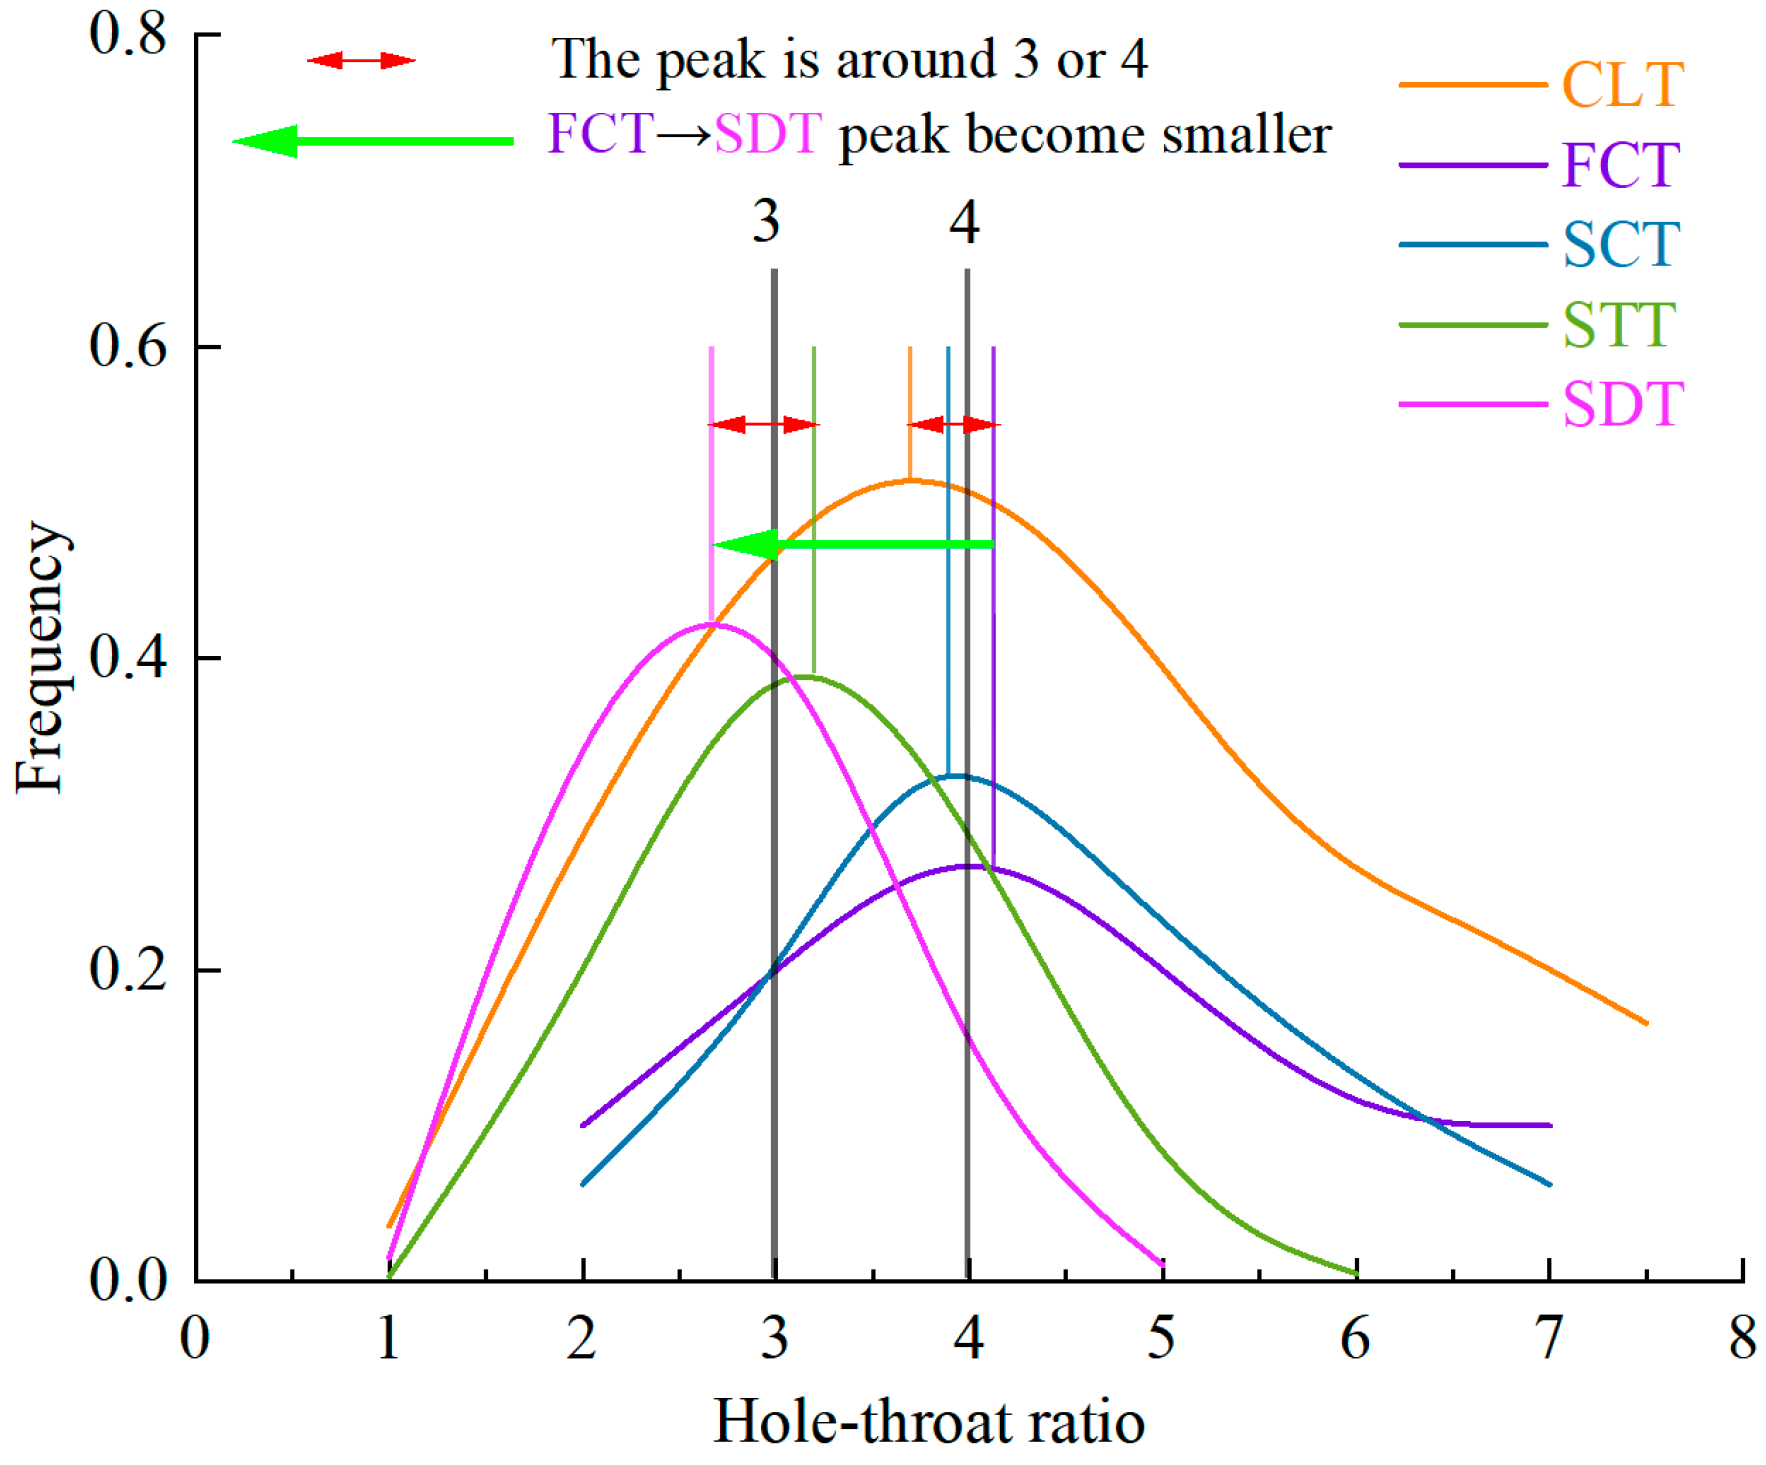
3.4. Three-Dimensional Pore Throat Model and Parameter Analysis
4. Seepage Simulation Based on the Navier–Stokes Equation
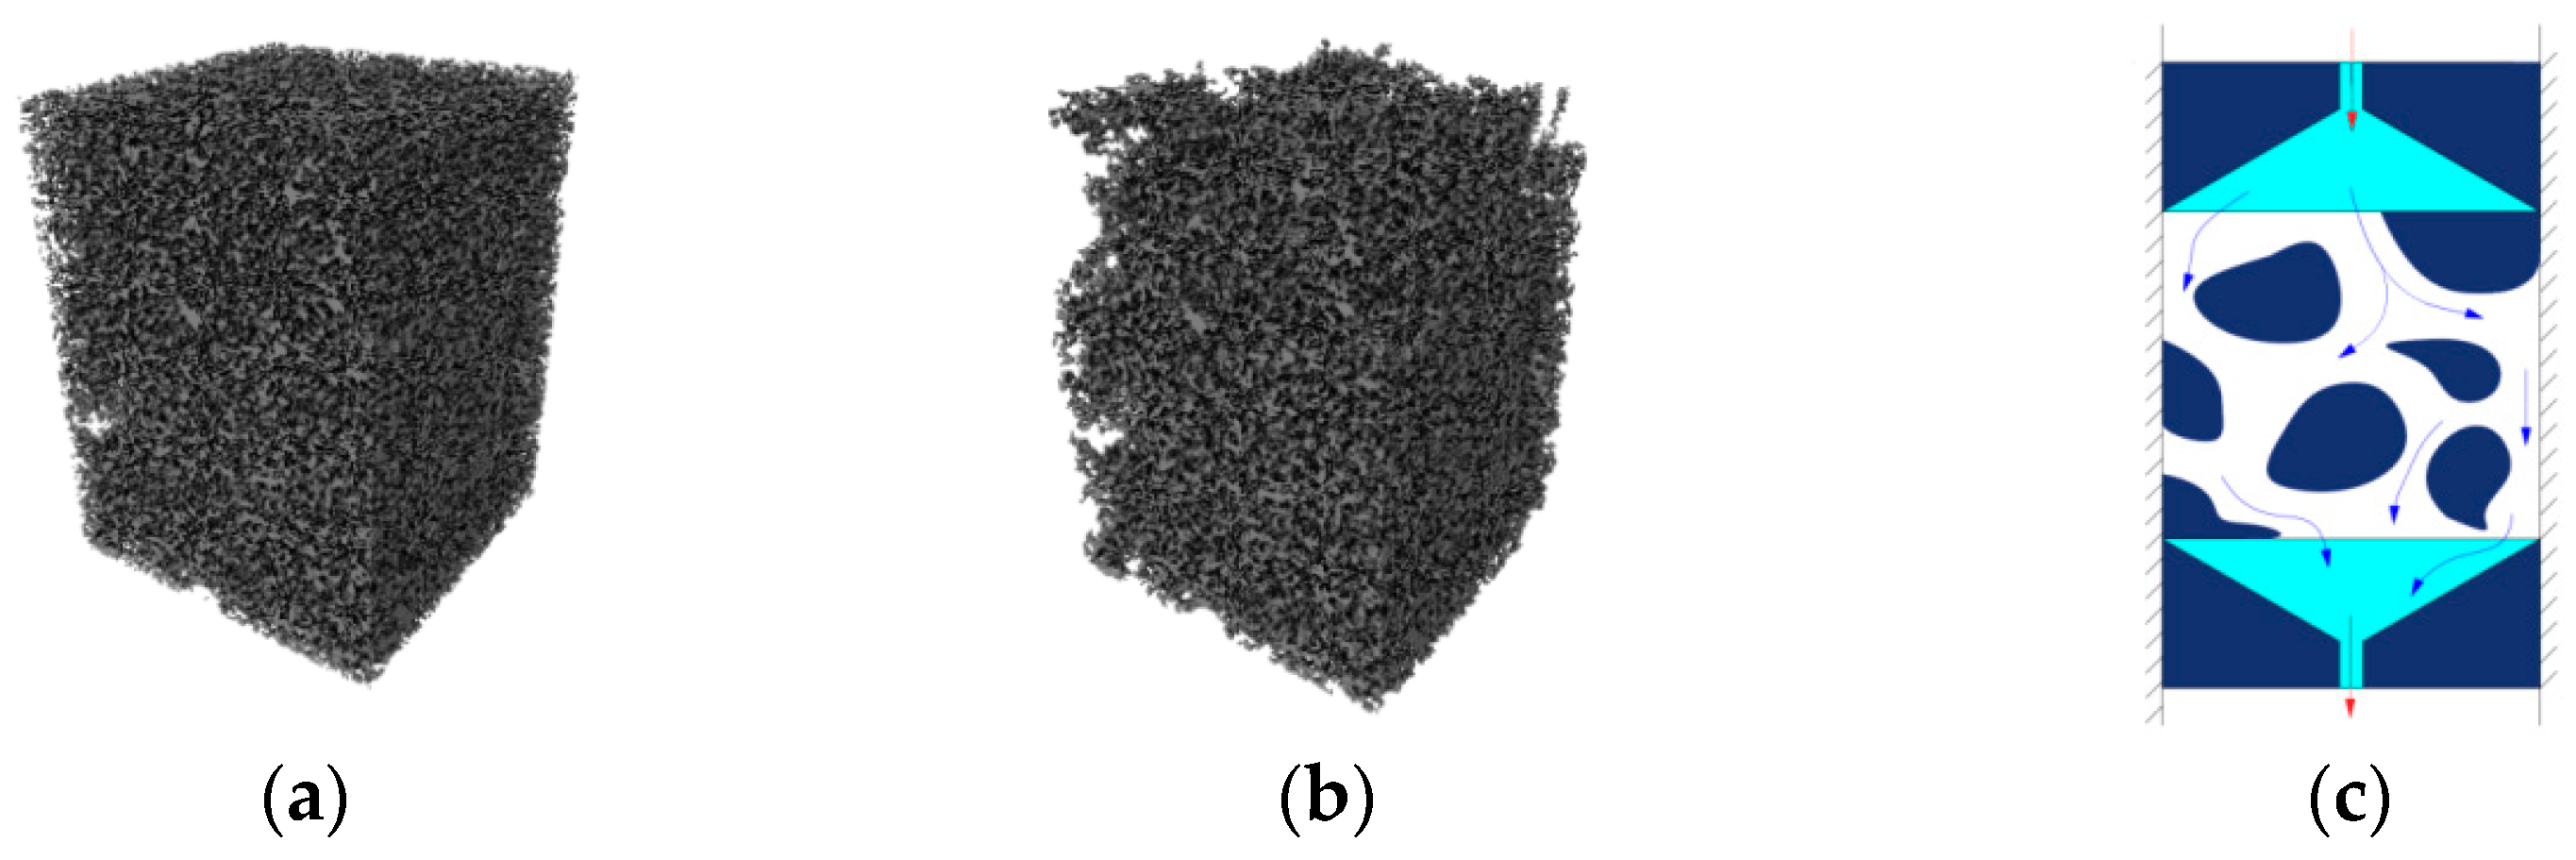
4.1. Connected Pore Extraction
4.2. Principles and Methods of Seepage Simulation
4.3. Simulate the Results of the Calculations
4.4. Analysis of Influencing Factors of Tailings Permeability
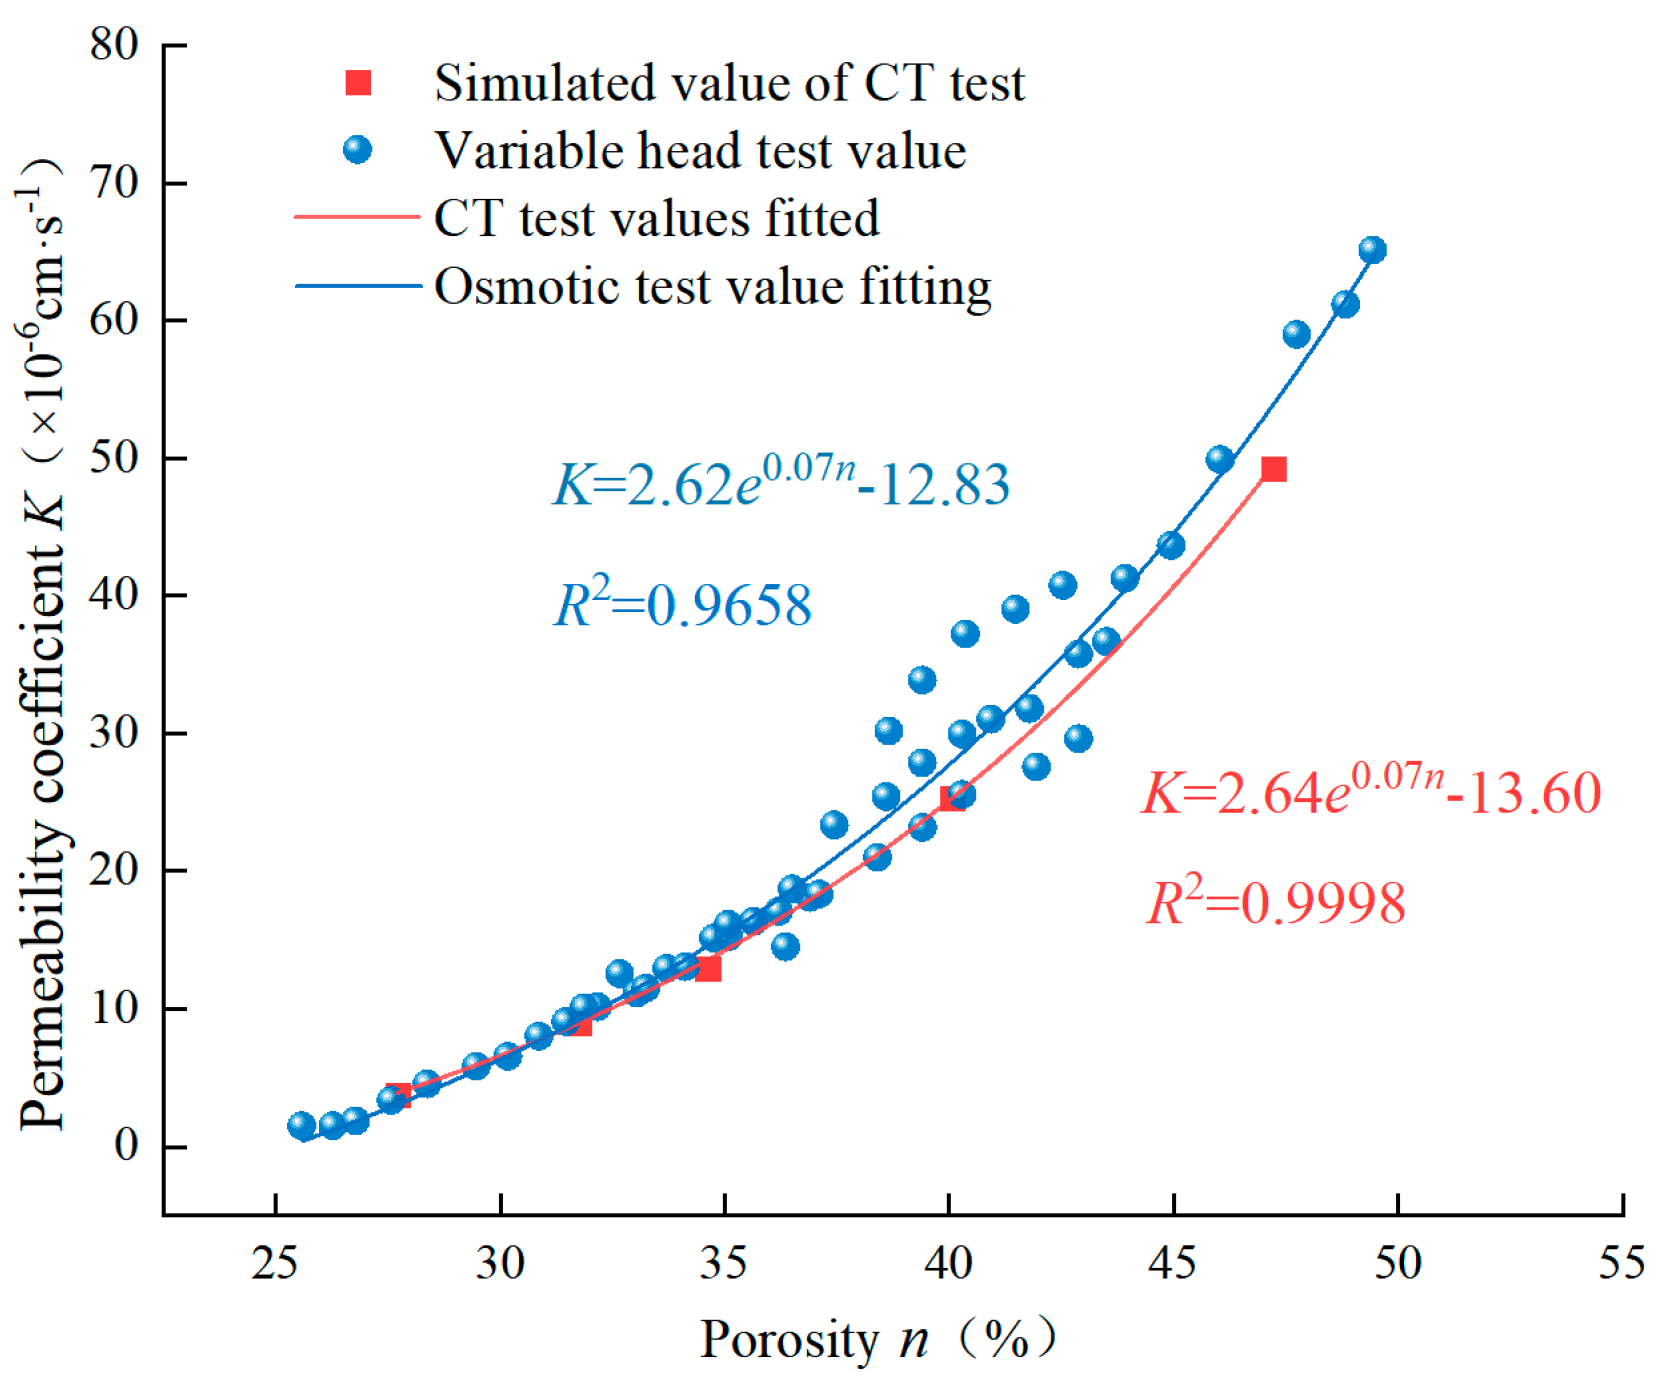
4.5. A Prediction Model of Tailings Permeability Coefficient Was Established
5. Conclusions
- (1)
- The data between the CT test results and the measured results are less than 10%, which give good applicability in the study of the permeability characteristics of tailings.
- (2)
- The porosity of viscous tailings ranges from 25 to 35%, the surface porosity of the distribution along the height is similar, and the distribution becomes more uniform with the increase in particle size.
- (3)
- Based on the various microstructure characteristics of tailings, it can be seen that, compared with sand tailings and silty tailings, the viscous tailings have fewer edges and corners, a smoother surface, a geometric shape closer to a circle, a convexity greater than 0.85, a fractal dimension as low as 1.2, and a shape factor of 0.95.
- (4)
- According to the correlation analysis results of the microscopic parameters of tailings, the porosity, the number of pores and the number of throats are the three key factors affecting the permeability characteristics. The exponential relationship between the porosity n and the permeability coefficient K (×10−6 cm·s−1) satisfies: K = 2.64e0.07n−13.60, R2 = 0.9998.
- (5)
- The effective porosity is the main factor that affects the permeability of tailings. This is in line with common sense.
Author Contributions
Funding
Institutional Review Board Statement
Informed Consent Statement
Data Availability Statement
Acknowledgments
Conflicts of Interest
References
- Xu, B. Study on The Variation Law of Tailing Sand Strength under Freeze-thaw Cycles. Master’s Thesis, Liaoning Technical University, Fuxin, China, 2022. [Google Scholar]
- Zeng, S.; Ji, K.; Li, J.; Wang, P. Numerical Simulation of the Influence of Structural Features of Tailings on its Permeability. Met. Mine 2017, 1, 43–46. [Google Scholar]
- Mei, H. The Study of Seepage Theory and It’s Application in Tailings Dam Engingeering under Consolidation. Master’s Thesis, Xi’an University of Technology, Xi’an, China, 2007. [Google Scholar]
- Wang, Q.; Lu, B.; Wang, S.; Zhou, W.; Xiao, J. Finite Element Analysis for Seepage Field in Tailing Dam by ANSYS. Mod. Min. 2009, 25, 27–30. [Google Scholar]
- Yin, G.; Jing, X.; Wei, Z.; Li, X. Study of Model Test of Seepage Characteristic and Field Measurement of Coarse and Fine Tailing Dam. Chin. J. Rock Mech. Eng. 2010, 29, 3710–3718. [Google Scholar]
- Yang, X.; Zhang, Y.; Gan, D.; Jia, Y. Experimental Study on Permeability Characteristics of Undisturbed Iron Tailing. Adv. Eng. Sci. 2020, 52, 110–117. [Google Scholar]
- Yang, B.; Liu, Y.; Wan, F.; Yang, T.; Feng, J.; Zhao, X.; Zheng, D. Experimental Study on Influence of Particle-Size Distribution on Permeability Coefficient of San. J. Southwest Jiaotong Univ. 2016, 51, 855–861. [Google Scholar]
- Kozeny, J. Ueber kapillare Leitung des Wassers im Boden. Sitzungsberichte Der Akad. Der Wiss. Wien 1927, 136, 271–306. [Google Scholar]
- Carman, P.C. Permeability of saturated sands, soils and clays. J. Agric. Sci. 1939, 29, 262–273. [Google Scholar] [CrossRef]
- Mesri, G.; Olson, R.E. Mechanisms controlling the permeability of clays. Clays Clay Miner. 1971, 19, 151–158. [Google Scholar] [CrossRef]
- Li, D.; Wang, H.; Zhang, C.; Chen, Q. Study on meso-structure characteristics of tailings based on CT scanning. Eng. J. Wuhan Univ. 2020, 53, 574–582. [Google Scholar]
- Zhang, P.; Lee, Y.; Zhang, J. A review of high-resolution X-ray computed tomography applied to petroleum geology and a case study. Micron 2019, 124, 102702. [Google Scholar] [CrossRef]
- Li, Z. Study on the macro-fine structure and mechanical properties of the whole tailings layered cemented backfill. Master’s Thesis, Kunming University of Science and Technology, Kunming, China, 2023. [Google Scholar]
- Barrett, P.J. The shape of rock particles, a critical review. Sedimentology 1980, 27, 291–303. [Google Scholar] [CrossRef]
- Yang, C.; Zhang, C.; Li, Q.; Yu, Y.; Ma, C.; Duan, Z. Disaster mechanism and prevention methods of large-scale high tailings dam. Rock Soil Mech. 2021, 42, 1–17. [Google Scholar]
- Yang, Y.; Wei, Z.; Chen, Y.; Ren, B. Study on the shapes of tailings particles based on microscopy and image processing technologies. Chin. J. Rock Mech. Eng. 2017, 36, 3689–3695. [Google Scholar]
- Hu, X.; Gao, S.; Zhang, X.; Wang, W.; Zhong, H.; Zhou, H. A rock thin section analysis system based on continuous extinction characteristic. Earth Sci. Front. 2021, 28, 296–304. [Google Scholar]
- Wu, S. Effect of Particle Size on Physico-Mechanical Properties of Tailings and Dam Stability Study. Ph.D Thesis, Chongqing University, Chongqing, China, 2017. [Google Scholar]
- Sheng, J.; Yang, C.; Xu, L.; Ding, X.; Yang, X.; Li, G. Application of Digital Core Technology in the Study of Microscopic Seepage Characteristics of Tight Reservoirs. J. Xi’an Shiyou Univ. 2018, 33, 83–89. [Google Scholar]
- Li, Z. Research on pore structure parameters of sandstone based on CT data. Master’s Thesis, Northeast Petroleum University, Daqing, China, 2023. [Google Scholar]
- Wang, Q. Study on characteristics of waterproof material in underground engineering based on micro scanning technology. Ph.D Thesis, Southwest Jiaotong University, Chengdu, China, 2017. [Google Scholar]
- Ministry of Housing and Urban-Rural, Development of the People’s Republic of China. Standards for Geotechnical Test Methods; State Administration for Market Regulation of the People’s Republic of China: Beijing, China, 2019. [Google Scholar]
- Wei, B.; Xie, N. Unified representation and properties of generalized Grey relational analysis models. Syst. Eng.-Theory Pract. 2019, 39, 226–235. [Google Scholar]
- Xu, L.; Zhang, W.; Liang, X.; Xiao, R.; Cao, J. The Grey correlation degree analysis of pore structure parameters of Geotechnical medium. J. Nanjing Univ. 2018, 54, 1105–1113. [Google Scholar]
- Dong, Y.; Duan, Z. A new method for determining the grey correlation resolution coefficient. J. Xi’an Univ. Archit. Technol. 2008, 4, 589–592. [Google Scholar]
- Wei, T.; Fan, W.; Yuan, W.; Wei, Y.N.; Yu, B. Three-dimensional pore network characterization of loess and paleosol stratigraphy from South Jingyang Plateau. Environ. Earth Sci. 2019, 78, 1–15. [Google Scholar] [CrossRef]
- Zhao, J.; He, X.; Lai, Q.; Yu, B.; Wu, Z. A Model of Permeability Prediction for Carbonate Rocks Based on Digital Cores. Prog. Geophys. 2024, 1–12. Available online: http://link.cnki.net/urlid/11.2982.P.20240611.1524.064 (accessed on 15 December 2024).
- An, R.; Kong, L.; Zhang, X.; Li, C. Effects of dry-wet cycles on three-dimensional pore structure and permeability characteristics of granite residual soil using X-ray micro computed tomography. J. Rock Mech. Geotech. Eng. 2022, 14, 851–860. [Google Scholar] [CrossRef]


| Numbering | Wet Density (g/cm3) | Dry Density (g/cm3) | Specific Gravity | Water Content (%) | Saturation (%) | Porosity (%) | Permeability Coefficient (cm/s) |
|---|---|---|---|---|---|---|---|
| CLT | 1.98 | 1.54 | 2.73 | 28.8 | 99.73 | 27.73 | 5.86 × 10⁻⁶ |
| FCT | 1.90 | 1.39 | 2.72 | 36.5 | 99.43 | 31.78 | 7.15 × 10⁻⁶ |
| SCT | 2.14 | 1.76 | 2.78 | 21.0 | 99.67 | 33.64 | 8.11 × 10⁻⁶ |
| STT | 2.06 | 1.70 | 2.76 | 21.5 | 95.73 | 40.08 | 2.64 × 10⁻⁵ |
| SDT | 2.11 | 1.76 | 2.77 | 19.6 | 95.24 | 48.25 | 4.55 × 10⁻⁵ |
| Parameter Category | Parametric Indicators |
|---|---|
| Spatial resolution | 0.7 µm |
| Tube voltage range | 30–160 kv |
| Sample loading capacity | 15 kg |
| Stage stroke (x, y, z) | 45 mm, 100 mm, 50 mm |
| Z-direction light source travel | 190 mm |
| Detector stroke (z) | 290 mm |
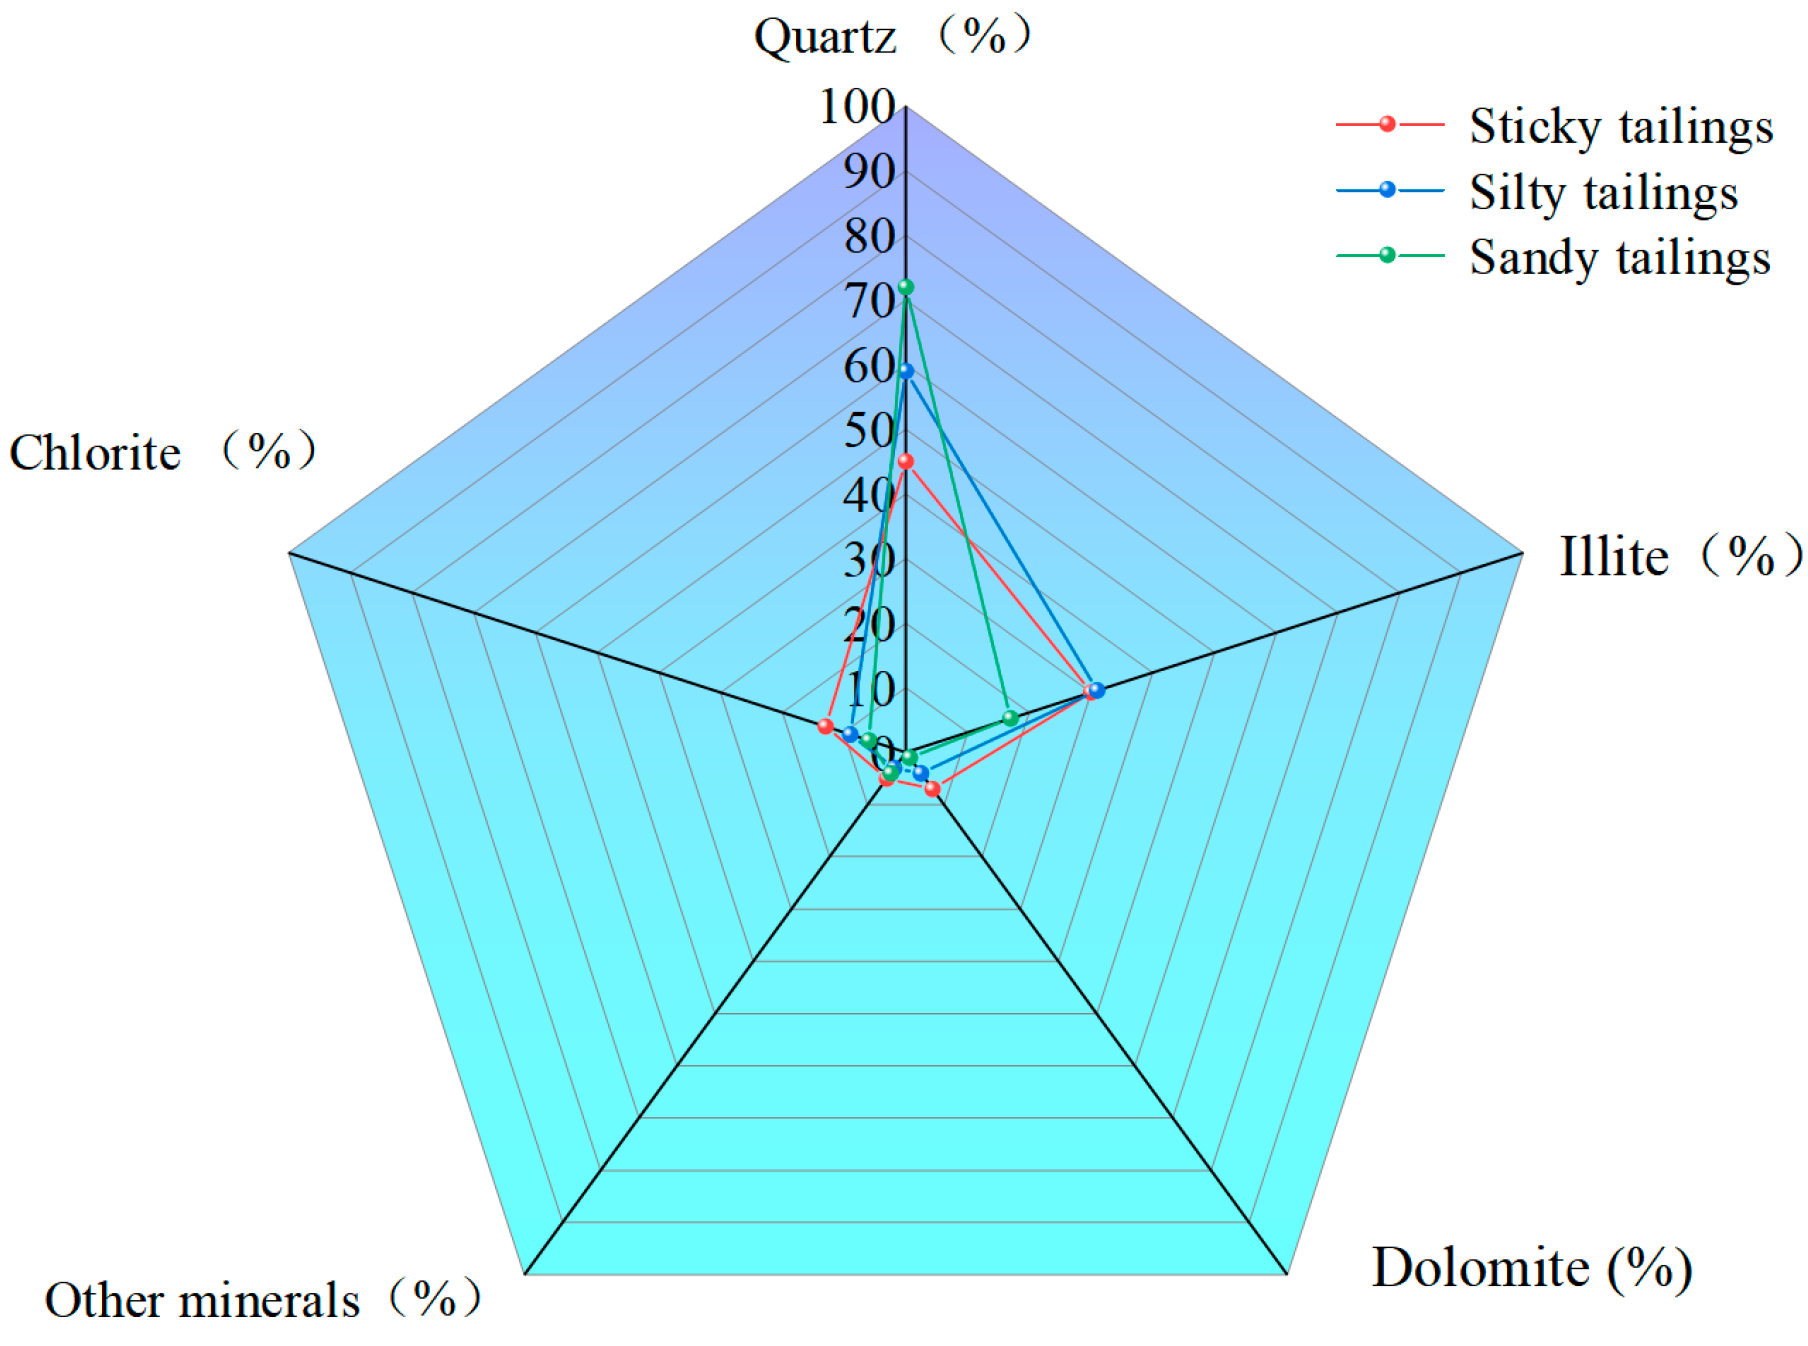
| Tailings Category | Mineral Composition (%) | ||||
|---|---|---|---|---|---|
| Quartz | Illite | Dolomite | Chlorite | Other Minerals | |
| Sticky tailings | 45.2 | 30.3 | 7.6 | 11.8 | 5.1 |
| Silty tailings | 59.4 | 31.2 | 1.4 | 4.6 | 3.4 |
| Sandy tailings | 72.4 | 16.8 | 1.2 | 5.3 | 4.3 |
| Numbering | Calculated Porosity (%) | Measured Values (%) | Relative Error |
|---|---|---|---|
| CLT | 27.73 | 28.38 | 2.34 |
| FCT | 31.78 | 32.34 | 1.76 |
| SCT | 33.64 | 32.86 | 2.32 |
| STT | 40.08 | 38.49 | 3.97 |
| SDT | 48.25 | 50.13 | 3.90 |
| Parameter | Descriptions of the Meanings of Various Parameters |
|---|---|
| S1 | The actual area of the particles |
| P1 | The actual perimeter of the particle |
| Fmax | The maximum distance between parallel lines tangential to the outer edge of the particle |
| Fmin | The minimum distance between parallel lines tangential to the outer edge of the particle |
| S2 | The area of the external polygon along the particle boundary |
| P2 | The perimeter of the circumscribed polygon along the particle boundary |
| d | The diameter of a circle with the same area as the particle |
| Sample Number | Permeability (md) | Permeability Coefficient (cm/s) | Relative Error (%) | |
|---|---|---|---|---|
| Simulated Value | Experimental Value | |||
| CLT | 5.55 | 5.72 × 10⁻⁶ | 5.86 × 10⁻⁶ | 2.4 |
| FCT | 7.31 | 7.53 × 10⁻⁶ | 7.15 × 10⁻⁶ | 5.0 |
| SCT | 8.52 | 8.78 × 10⁻⁶ | 8.11 × 10⁻⁶ | 7.6 |
| STT | 2.52 | 2.45 × 10⁻⁵ | 2.64 × 10⁻⁵ | 7.8 |
| SDT | 4.39 | 4.26 × 10⁻⁵ | 4.55 × 10⁻⁵ | 6.8 |
| Parameter | Relevance | Sort |
|---|---|---|
| Porosity | 0.7823 | 1 |
| Number of pores | 0.7073 | 2 |
| Hole–throat ratio | 0.5727 | 10 |
| Number of laryngeal tracts | 0.6851 | 3 |
| Maximum throat radius | 0.6188 | 5 |
| Mean laryngeal radius | 0.5849 | 7 |
| Minimum laryngeal radius | 0.5739 | 9 |
| Maximum pore radius | 0.5640 | 12 |
| Average pore radius | 0.5586 | 13 |
| Minimum pore radius | 0.5457 | 14 |
| Average pore volume | 0.5404 | 15 |
| Average number of coordinations | 0.6322 | 4 |
| Maximum laryngeal length | 0.5928 | 6 |
| Mean laryngeal length | 0.5844 | 8 |
| Minimum throat length | 0.5717 | 11 |
Disclaimer/Publisher’s Note: The statements, opinions and data contained in all publications are solely those of the individual author(s) and contributor(s) and not of MDPI and/or the editor(s). MDPI and/or the editor(s) disclaim responsibility for any injury to people or property resulting from any ideas, methods, instructions or products referred to in the content. |
© 2024 by the authors. Licensee MDPI, Basel, Switzerland. This article is an open access article distributed under the terms and conditions of the Creative Commons Attribution (CC BY) license (https://creativecommons.org/licenses/by/4.0/).
Share and Cite
Li, Q.; Ma, C.; Zhang, C.; Guo, Y.; Zhou, T. Study on the Microstructure and Permeability Characteristics of Tailings Based on CT Scanning Technology. Appl. Sci. 2024, 14, 12032. https://doi.org/10.3390/app142412032
Li Q, Ma C, Zhang C, Guo Y, Zhou T. Study on the Microstructure and Permeability Characteristics of Tailings Based on CT Scanning Technology. Applied Sciences. 2024; 14(24):12032. https://doi.org/10.3390/app142412032
Chicago/Turabian StyleLi, Qiyang, Changkun Ma, Chao Zhang, Yongcheng Guo, and Tong Zhou. 2024. "Study on the Microstructure and Permeability Characteristics of Tailings Based on CT Scanning Technology" Applied Sciences 14, no. 24: 12032. https://doi.org/10.3390/app142412032
APA StyleLi, Q., Ma, C., Zhang, C., Guo, Y., & Zhou, T. (2024). Study on the Microstructure and Permeability Characteristics of Tailings Based on CT Scanning Technology. Applied Sciences, 14(24), 12032. https://doi.org/10.3390/app142412032